Respiratory Gas Monitoring∗
Detectors of Infrared Radiation
Infrared Wavelength and Anesthetic Agent Specificity
Sampling Systems and Infrared Analysis
WATER VAPOR AND ACCURACY OF CAPNOMETERS
COLORIMETRIC CARBON DIOXIDE DETECTORS
APPLICATIONS OF GAS MONITORING
COMPLICATIONS OF GAS MONITORING
CREDENTIALING FOR THE USE OF GAS MONITORING
AMERICAN SOCIETY OF ANESTHESIOLOGISTS STANDARDS FOR POSTANESTHESIA CARE
Overview
The gases of interest to the anesthesia caregiver include oxygen, carbon dioxide, nitrous oxide, and the potent inhaled anesthetic agents. Other gases that may be relevant in certain situations are nitrogen, helium, nitric oxide, and xenon. Although gas monitors from different manufacturers may appear to offer various options to the user, ultimately, these monitors use one or more of a limited number of technologies to make the analysis and present the data.
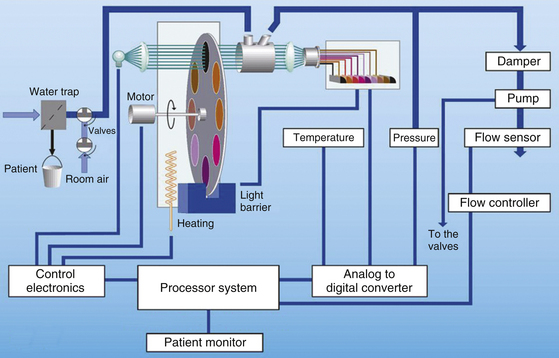
The monitoring of respired gases has evolved considerably over the past few years. Contemporary systems are reliable, accurate, have rapid response times, and are becoming less expensive as a result of competition among manufacturers. Early gas monitoring systems were large, stand-alone units that usually were placed on a shelf on the anesthesia machine (Fig. 8-1). As a result of advances in technology and miniaturization, on many contemporary anesthesia workstations, gas analysis is performed in one component module of a modular physiologic monitoring system (Fig. 8-2). This chapter is intended to provide a framework for understanding the methods by which respiratory gases are analyzed as well as clinical applications, limitations, and pertinent standards of care.
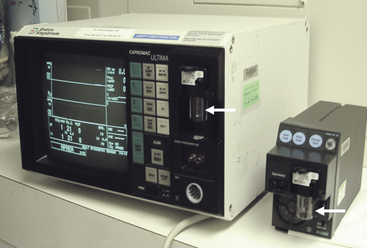
FIGURE 8-1 Left: The Datex Capnomac Ultima stand-alone multigas analyzer (GE Healthcare, Waukesha, WI) used infrared analysis for carbon dioxide, nitrous oxide, and anesthetic agents and paramagnetic analysis for oxygen. Right: The much smaller GE Compact Airway module uses the same technologies to perform the same functions. Arrows indicate water traps.
Gas Sampling Systems
For a respired gas mixture to be analyzed, either the gas must be brought to the analyzer, or the analyzer must be brought to the gas in the airway. A fuel cell oxygen analyzer located in the breathing system by the inspiratory unidirectional valve is one example of bringing the analyzer to the gas in the circuit. Figure 8-3 shows two mainstream analyzer modules. Because gas is not removed from the circuit for analysis elsewhere, this is termed a nondiverting or mainstream analyzer. Alternatively, and more commonly, the gas to be analyzed is continuously sampled from the vicinity of the patient’s airway and is conducted via fine-bore tubing to the analyzer unit (Fig. 8-4). This arrangement is termed a sidestream or diverting system because the gas is diverted from the airway for analysis elsewhere.
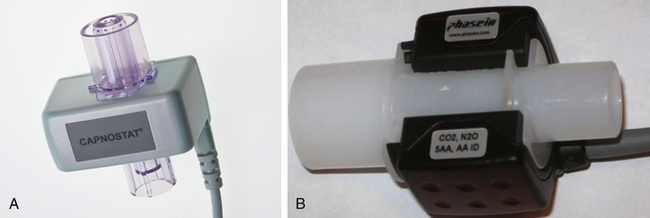
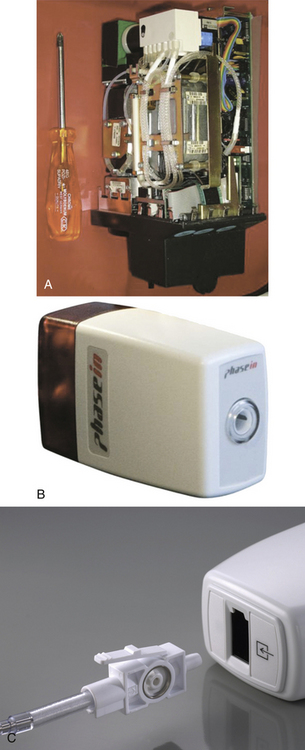
FIGURE 8-3 A, Mainstream lightweight Capnostat 5 carbon dioxide sensor. B, Mainstream multigas analyzer module that measures carbon dioxide, nitrous oxide, oxygen, and anesthetic agents. The IRMA plug-in and measure are also shown. (A, Courtesy Philips Respironics, Wallingford, CT. B, Courtesy Phasein AB, Danderyd, Sweden.)
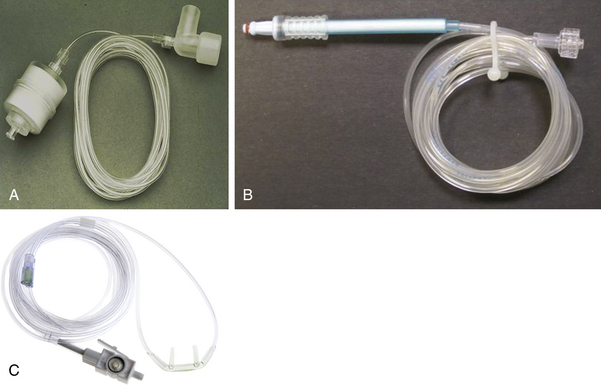
FIGURE 8-4 A, Gas-sampling tubing and airway adapter for sidestream-sampling gas analyzers. B, Nomoline gas sampling tubing with integral moisture/water removal filter. C, Nasal cannula with sampling tubing and integral filter/removable sample cell. (A, Courtesy Phasein AB, Danderyd, Sweden. B, Courtesy Philips Respironics, Wallingford, CT.)
Gas analysis is performed in real time so that changes can be rapidly appreciated by the anesthesia caregiver. It is therefore important to know the total response time of the complete system. The total response time is composed of two components: the transit time and the rise time. The transit time is the time lag for the gas sample to reach the analyzer; this term applies only to systems that use diverting gas sampling. The rise time is the time taken by the analyzer to react to the change in gas concentration. An analyzer’s reponse to a sudden (square wave) change in gas concentration is generally sigmoid in shape, so that rise time is specified as the time to change from 10% to 90% of the sudden total change in gas concentration at the analyzer inlet (Fig. 8-5). As an example, the Datex Compact Airway module (GE Healthcare, Waukesha, WI; see Fig. 8-1, right) with a 3-meter sampling line and 200 ± 20 mL/min gas sampling rate typically has a sampling delay time of 2.5 seconds and a total response time of 2.9 seconds, which includes the sampling delay and rise time.1 For comparison, the Capnostat 5 mainstream carbon dioxide sensor (Philips Respironics, Wallingford, CT) is specified to have a rise time of less than 60 ms. A rapid total system response time is essential for accurate concentration readings and high-fidelity waveforms.
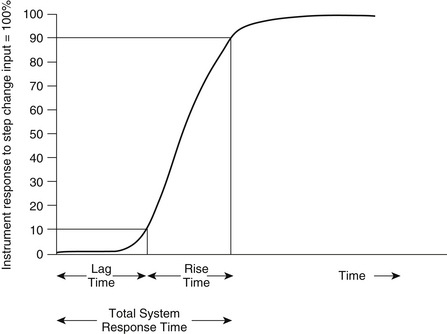
FIGURE 8-5 Delay time (lag time) is the time from a step function change in CO2 concentration at the sampling site to the achievement of 10% of the final CO2 value in the capnometer. Rise time is the time required to achieve a rise from 10% to 90% of the final CO2 value in the capnometer when a step function change in CO2 concentration occurs at the sampling site.
Nondiverting (Mainstream) Systems
In nondiverting systems, gas flows past the analyzer interface placed in the main gas stream. Until recently, mainstream analysis at the patient’s airway was possible only for carbon dioxide using infrared (IR) technology (Mainstream, Philips Respironics) and by the inspiratory unidirectional valve for oxygen using a fuel cell. As a result of advances in miniaturization, mainstream multigas analysis at the patient’s airway is now available (Phasein, Danderyd, Sweden); this permits rapid acquisition of breath-by-breath data for carbon dioxide, nitrous oxide, oxygen, and the five potent inhaled anesthetics. Although mainstream analyzers overcome the gas sampling problem, they require a special airway adapter and analysis module to be placed in the breathing system near the patient’s airway. From this location, the analyzers produce a sharp concentration-versus-time waveform in real time, but they may be vulnerable to damage with repeated drops onto hard surfaces. New designs are lightweight, such as the Phasein IRMA sensor head, which uses a miniaturized, spinning filter wheel that weighs only 1 oz. Such designs add only a small amount of dead space, and some, such as the Capnostat 5, use solid-state technology. In addition, waste gas scavenging is not necessary with nondiverting systems.
Mainstream analyzer modules are subject to interference by water vapor, secretions, and blood. Because condensed water blocks all IR wavelengths, leaving too low a source intensity to make a measurement, spurious carbon dioxide readings might result. The cuvette’s window may be heated (usually to 41° C), or it may be coated with water-repellant material to prevent such condensation and interference. Adding the mainstream analyzer to the breathing system creates two additional interfaces for a potential breathing circuit disconnection. Disposable breathing system adapters are now available, whereas previously, the nondisposable adapters required cleaning between patient uses. In addition, a mainstream carbon dioxide analyzer is now available for patients receiving oxygen via nasal cannula (Cap-ONE, Nihon Kohden America, Foothill Ranch, CA).
Sidestream (Diverting) Systems
Compared with mainstream analyzers, the advantages of diverting analyzers are that, because they are remote from the patient, they can be of any size and therefore offer more versatility in terms of monitoring capabilities. They can be used when the monitor must be remote from the patient, such as in magnetic resonance imaging (MRI) or radiation therapy. The sampled gas is continually drawn from the breathing circuit via an adapter placed between the circuit and the patient’s airway (the Y-piece in a circle breathing system); it passes through a filter or water trap (Fig. 8-1, arrows) before entering the analyzer. The gas sampling flow rate is usually about 200 mL/min, with a range of 50 to 250 mL/min. Disadvantages include problems with the catheter sampling system, such as clogging with secretions or water, kinking, failure of the sampling pump, slower total system response time (although usually <3 seconds), and artifacts when the gas sampling rate is poorly matched to the patient’s inspiratory and expiratory gas flow rates.
Rapid respiratory rates and long sampling catheter lines may decrease the accuracy of the readings and the fidelity of the tracings. This is because there would be samples from many breaths stored in the catheter, and the breaths could “smudge” into one another, thereby “dampening” the tracing with loss of clear peaks and troughs. If a diverting system is used with a very small patient, such as a neonate, and the gas sampling rate exceeds the patient’s expiratory gas flow rate, spurious readings may result because the expired gas will be contaminated by fresh gas. Similarly, if an uncuffed tracheal tube is used and a leak develops between the tube and the trachea, the gas sampling pump may draw room air into the tracheal tube and into the analyzer.
Ideally, the gas sampling flow rate should be appropriate for the patient and for the breathing circuit used. Thus the sampling flow rate may limit the use of low-flow or closed-circuit anesthesia techniques. If the gas sampling rate exceeds the fresh gas inflow rate, the potential exists for negative pressures to be created in the breathing system.2 Once the sampled gas has been analyzed, it should be directed to the waste gas scavenging system or returned to the patient’s breathing system.
Leaks in the gas sampling line, both inside the monitor and between the patient’s airway and the monitor inlet, will result in erroneous readings that may or may not be obvious. These monitors require calibration using a certified standard gas mixture that is directed into the monitor’s gas inlet connection. A leak inside the monitor that allows room air to contaminate the gas sample would result in miscalibration.3
In multigas analyzers that incorporate a paramagnetic oxygen sensor, simultaneous room air sampling (10 mL/min) is required to provide a reference. This air is therefore added to the waste gas exiting the monitor at a rate of 10 mL/min; it may then be returned to the patient circuit. This might create a problem during closed-circuit anesthesia because nitrogen, albeit at a rate of about 8 mL/min, would be added to the breathing circuit (see Paramagnetic Oxygen Analyzers later in this chapter).
Units of Measurement
The respiratory tract and the anesthesia delivery system contain respired gases in the form of molecules that are in constant motion. When the molecules strike the walls of their container, they give rise to pressure, defined as force per unit of area; the greater the number of gas molecules present, the greater the pressure exerted for any given temperature. Dalton’s law of partial pressures states that the total pressure exerted by a mixture of gases is equal to the arithmetic sum of the partial pressures exerted by each gas in the mixture. The total pressure of all gases in the anesthesia system at sea level is equivalent to approximately 760 mm Hg. Although anesthetic gas monitors may display data expressed in millimeters of mercury (mm Hg), kilopascals (1 kPa = 7.5 mm Hg), or as volumes percent (vol%), it is important to understand in principle how the measurement was made. The reader should understand the difference between partial pressure, an absolute term, and volumes percent, an expression of a proportion, or ratio.
If the partial pressure of one component of a gas mixture is known, a reading in volumes percent can be computed as follows:

Number of Molecules (Partial Pressure)
An analytic method based on quantifying a specific property of a gas molecule determines in absolute terms—that is, in millimeters of mercury or kilopascals—the number of molecules of that gas that are present. Gas molecules composed of two or more dissimilar atoms—such as carbon dioxide, nitrous oxide, and the potent inhaled anesthetics—have bonds between their component atoms. Certain wavelengths of IR radiation excite these molecules, stretching or distorting the bonds, and the molecules also absorb the radiation. Carbon dioxide molecules absorb IR radiation at a wavelength of approximately 4.3 μm. The greater the number of molecules of carbon dioxide present, the more radiation at 4.3 μm absorbed. This property of the carbon dioxide molecule is applied in the IR carbon dioxide analyzer. Because the total amount of IR radiation absorbed at a specific wavelength is determined by the number of molecules present, and the motion of each molecule contributes to the total pressure, the amount of radiation absorbed is a function of partial pressure; thus, an IR analyzer measures partial pressure.
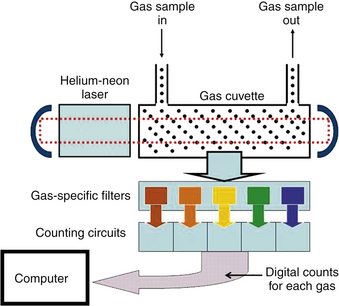
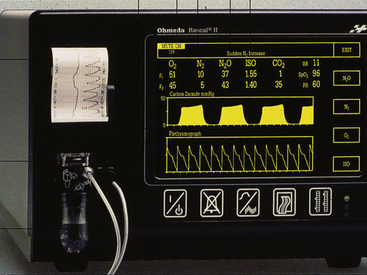
In the analysis of gases by Raman spectroscopy, as was used in the Datex-Ohmeda Rascal II analyzer (GE Healthcare), a helium-neon laser emits monochromatic light at a wavelength of 633 nm. When this light interacts with the intramolecular bonds of specific gas molecules, it is scattered and reemitted at wavelengths different from that of the incident monochromatic light. Each reemission wavelength is characteristic of a specific gas molecule present in the gas mixture and therefore is a function of its partial pressure. Thus Raman spectroscopy also measures partial pressures.
A sufficient number of molecules of any gas to be analyzed—that is, adequate partial pressures—must be present to facilitate gas analysis by the IR and Raman technologies. These systems also must be pressure compensated if analyses are being made at ambient pressures other than those used for the original calibration of the systems.4
Measurement of Proportion (Volumes Percent)
Another approach to gas analysis is to separate the molecular component species of a gas mixture and determine what proportion (percentage) each gas contributes to the total (100%). This approach is applied in mass spectrometry. Thus, if 21 molecules of oxygen were in a sample of gas containing 100 molecules, oxygen would represent 21% of the gas sample and therefore might reasonably be assumed to represent 21% of the original gas mixture. The result is expressed as 21 vol% or as a fractional concentration (0.21). This monitor does not measure partial pressures; it measures only proportions. If the system is provided with an absolute pressure reading that is equivalent to 100%, the basic measured proportions can be converted to readings in millimeters of mercury. In the above example, if 100% were made equivalent to 760 mm Hg, oxygen would have a calculated partial pressure of 159 mm Hg (760 × 21%).
These fundamental differences in the approaches to gas analysis and their basic units of measurement are important, particularly when the data presented by these monitors are interpreted in a clinical setting and may affect patient management.
Gas Analysis Technologies
Contemporary respiratory multigas analyzers use some form of IR spectroscopy to measure carbon dioxide, nitrous oxide, and the potent inhaled anesthetic agents. The same multigas analyzers measure oxygen by a paramagnetic, rapid-responding analyzer or by a fuel cell (slow or rapid responding). Although some technologies are no longer in general clinical use, it is worthwhile to review them briefly to appreciate their principles of operation and how monitoring has evolved.
Mass Spectrometry
For many anesthesia caregivers, the term mass spec is used as if it were synonymous with respiratory gas analysis. Indeed, many anesthetic record forms still incorrectly include this term, but this technology is no longer in routine clinical use. It was, however, the first multigas monitoring system in widespread clinical use, following a description by Ozanne and colleagues in 1981.5
The mass spectrometer is an instrument that allows the identification and quantification, on a breath-by-breath basis, of up to eight of the gases commonly encountered during the administration of an inhalational anesthetic. These gases include oxygen, nitrogen, nitrous oxide, halothane, enflurane, and isoflurane. Other agents—such as helium, sevoflurane, argon, and desflurane—could sometimes be added or substituted if desired. Although the technology of mass spectrometry had been available for many years, analyzer units dedicated to a single patient were too expensive for routine use in each operating room (OR). In 1981, the concept of a shared, or multiplexed, system was introduced.5 This arrangement allowed one centrally located analyzer to function as part of a computerized, multiplexed system that could serve up to 31 patient sampling locations (ORs and recovery room or intensive care unit [ICU] beds) on a time-share basis.6 The two multiplexed systems that became widely used were the Perkin Elmer system, which later became the Marquette Advantage system, and the System for Anesthetic and Respiratory Analysis (SARA).
Principles of Operation
The mass spectrometer analyzer unit separates the components of a stream of charged particles (ions) into a spectrum according to their mass/charge (m/z) ratios. The relative abundance of ions at certain specific m/z ratios is determined and is related to the fractional composition of the original gas mixture. The creation and manipulation of ions is carried out in a high vacuum (10−5 mm Hg) to avoid interference by outside air and to minimize random collisions among the ions and residual gases.
The most common design of mass spectrometer was the magnetic sector analyzer, so called because it uses a permanent magnet to separate the ion beam into its component ion spectra (Fig. 8-6). A stream of gas (250 mL/min) to be analyzed is continuously drawn by a sampling pump from an airway connector via a long nylon catheter, an example of a sidestream-sampling system. During transit through the sampling catheter, the pressure decreases from atmospheric pressure, usually 760 mm Hg, in the patient circuit to approximately 40 mm Hg by the inlet of the analyzer unit. A very small amount of the gas actually sampled from the circuit, approximately 10−6 mL/sec, enters the analyzer unit’s high-vacuum chamber through the molecular inlet leak. The gas molecules are then bombarded by an electron beam, which causes some of the molecules to lose one or more electrons and become positively charged ions. Thus an oxygen molecule (O2) might lose one electron and become an oxygen ion (O2+) with one positive charge. The m/z ratio would therefore be 32/1, or 32. If the oxygen molecule lost two electrons, it would gain two positive charges, and the resulting ion (O22+) would have an m/z ratio of 32/2, or 16. The process of electron bombardment also causes large molecules—such as halothane, enflurane, and isoflurane—to become fragmented, or “cracked,” into smaller, positively charged ions.
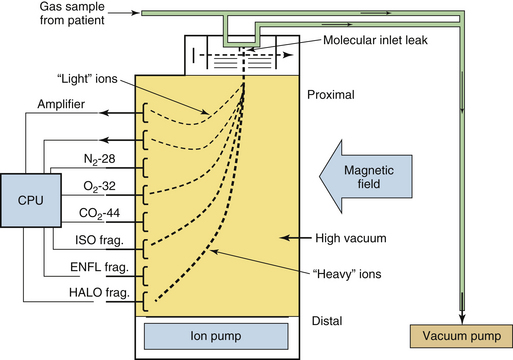
FIGURE 8-6 Schematic of a magnetic sector respiratory mass spectrometer. The respiratory gas is sampled and drawn over a molecular inlet leak. Gas molecules enter a vacuum chamber through the leak, where they are ionized and electrically accelerated. A magnetic field deflects the ions. The mass and charge of the ions determine their trajectory, and metal dish collectors are placed to detect them. The electrical currents produced by the ions impacting the collectors are processed, the composition is computed, and the results are displayed. CPU, central processing unit; ENFL, enflurane; frag., fragment; HALO, halothane; ISO, isoflurane.
The positive ions created in the analyzer are then focused into a beam by the electrostatic fields in the ion source, directed through a slit to define an exact shape for the beam, and accelerated and directed into the field of the permanent magnet. The magnetic field influences the direction of the ions and causes each ion species to curve in a trajectory whose arc is related to its m/z ratio. The effect is to create several separate ion beams exiting the magnetic field. The separated beams are directed to individual collectors, which detect the ion current and transmit it to amplifiers that create output voltages in relation to the abundance of the ion species detected. The collector plates are positioned so that an ion with a specific m/z ratio strikes a specific collector. The heaviest ions are deflected the least and travel the furthest before striking a collector (see Fig. 8-6). Collectors for these heavy ions are therefore located farthest from the ion source. Summing and other computer software measure the total voltage from all the collector circuits as well as measuring the individual voltages from each collector. Total voltage is considered equivalent to 100% of the analyzed gas mixture.
Individual gas collector circuit voltages are expressed as percentages of the total voltage and are displayed as percentages of the sampled gas mixture. Thus if the voltage from the oxygen collector circuit (m/z ratio = 32) represented 30% of the total voltage from all the collector circuits, oxygen would be read as constituting 30% of the total gas mixture analyzed. The Marquette Advantage and SARA systems used magnetic sector analyzers that had up to eight collectors and therefore were able to detect and analyze up to eight different ion types and their parent gases.
The mass spectrometer functions as a proportioning system for the components of a gas mixture. When it displays each of the components of the mixture as a percentage of the total, it makes the assumption that all the gases present have been detected. If ambient (atmospheric) pressure information is entered into the software, the measured percentages or proportions can be converted to readings in millimeters of mercury (i.e., partial pressures). It must be remembered that the mass spectrometer does not measure partial pressures; it calculates them from the measured proportions and the atmospheric pressure information that must be supplied to it. Thus

Usually, because the mass spectrometer was sampling respired gases from the patient circuit, the total pressure entered into the computer was ambient pressure minus 47 mm Hg, the latter representing the saturated vapor pressure of water at body temperature (37° C). Thus at sea level (760 mm Hg), a pressure of 713 mm Hg would be entered into the mass spectrometer software to be apportioned among the gases present. The mass spectrometer readings, when displayed in millimeters of mercury, represent somewhat of a compromise because inspired gas usually is not fully saturated with water vapor, whereas expired gas usually is. If an incorrect value for total ambient pressure were to be entered into the mass spectrometer software, all readings in millimeters of mercury would be incorrect, but the readings in volumes percent would be correct. For example, assume that end-tidal carbon dioxide is measured as 5% by the mass spectrometer and that ambient pressure is 760 mm Hg. The reading in millimeters of mercury will be 35.65 ([760 − 47] × 5%). If a value of 500 mm Hg is entered instead of 713 mm Hg, the reading will be 25 mm Hg (500 × 5%). In any case of doubt, the astute clinician would revert to the reading in volumes percent; hence the importance of understanding how the displayed value is obtained.
Shared Mass Spectrometry Systems
Multiplexing permitted the sharing of one (rather expensive) mass spectrometer analyzer unit among up to 31 sampling locations, or stations. In a shared system, the gas from each sampling location is directed in sequence by the multiplexing valve system to the mass spectrometer for analysis. In a multiplexed system, the time between analyses at any particular location therefore depended on 1) the number of breaths analyzed from each sampling location (i.e., dwell time), 2) the number of sampling locations in use, 3) the priority settings, and 4) in the case of “stat” samples, the distance between sampling locations and the analyzer, which was up to 300 feet in some installations.
Use of multiplexed mass spectrometry systems led anesthesia caregivers to appreciate the value of continual (i.e., frequently repeated), although not continuous (without interruption), respiratory gas monitoring and the limitations—the main one being that the systems were shared, which meant that data were updated only intermittently.
In October 1986, the American Society of Anesthesiologists (ASA) first approved standards for basic intraoperative monitoring. As the standards evolved, the requirement for continuous capnometry was not met by a shared mass spectrometry system. The systems were expensive to install and maintain, and they were not always easily upgradable when the new agents desflurane and sevoflurane were introduced. In addition, the long sampling catheters combined with rapid respiratory rates led to significant artifact; the sampling pump could cause considerable negative pressure in the breathing system, and when the system failed, all the monitored sites were affected.7,8 Practitioners demanded continuous gas monitoring. The most important functions of a multiplexed mass spectrometry system could be served by other dedicated gas monitors, and the multiplexed, mass spectrometer–based systems became extinct.
Dedicated (Stand-Alone) Mass Spectrometry Systems
A number of smaller stand-alone mass spectrometers were developed for dedicated single-patient use. One model, the Ohmeda 6000 Multigas Analyzer, was a quadrupole-filter mass spectrometer.9 It worked on the principle that, with regard to the m/z ratio of ions, a controlled electrostatic field can prevent all but a narrow range of charged particles from reaching a target. In the Ohmeda 6000 unit, the gas sampling rate was fixed at 30 mL/min. One advantage of the quadrupole system was that it could be adapted to measure new or additional agents by changes in software only. A number of other stand-alone, quadrupole-filter mass spectrometers were marketed, but their production was discontinued as a result of cost and reliability issues.
Infrared Analysis
The IR spectrum ranges between wavelengths of 0.40 μm and 40 μm. Measurement of the energy absorbed from a narrow band of wavelengths of IR radiation as it passes through a gas sample can be used to measure the concentrations of certain gases. Asymmetric, polyatomic, polar molecules—such as carbon dioxide, nitrous oxide, water, and the potent volatile anesthetic agents—absorb IR energy when their atoms rotate or vibrate asymmetrically; this results in a change in dipole moment, the charge distribution within the molecule. The nonpolar molecules argon, nitrogen, helium, xenon, and oxygen do not absorb IR energy. Because the number of gas molecules in the path of the IR energy beam determines the total absorption, IR analyzers measure the partial pressure.
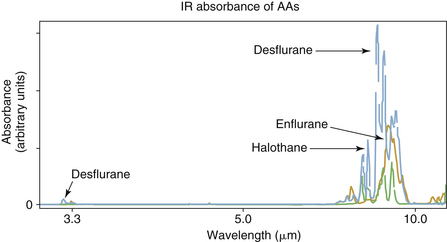
IR analyzers are classified as dispersive or nondispersive. In a dispersive analyzer, after passing through the gas sample, the radiation emitted by an IR source is separated, or dispersed, into the component wavelengths and is arranged sequentially. When gas to be analyzed is put in the path of the spectrum of radiation, it absorbs radiation in one or more parts of the spectrum. By examining the entire spectrum, a plot of absorbance versus wavelength is obtained (Fig. 8-7), from which the gas composition can be analyzed and quantified, provided the gases in the mixture have characteristic absorption peaks.
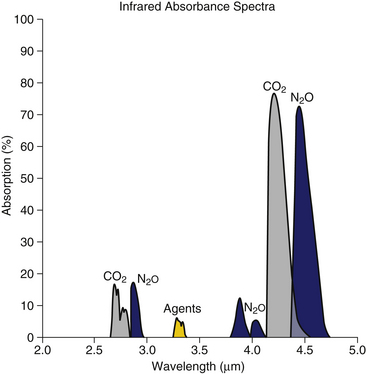
FIGURE 8-7 Absorption bands of respiratory gases in the infrared spectrum. (From Raemer DB: Monitoring respiratory function. In Rogers MC, Tinker JH, Covino BG, Longnecker DE, editors: Principles and practice of anesthesiology. St Louis, 1992, Mosby–Year Book.)
In the nondispersive analyzer, radiation from the IR source is filtered to allow passage of only the specific wavelength bands, for which the gases of interest have distinct absorption peaks. The gas sample is placed between the filter and the IR detector (Fig. 8-8) or between the IR source and the filter (Fig. 8-9). With the exception of the Andros, the IR analyzers used clinically are predominantly of the nondispersive type.
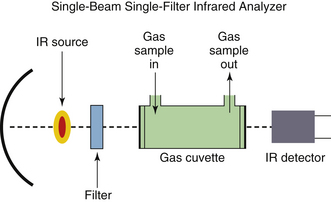
FIGURE 8-8 Block diagram of a simple, single-wavelength, infrared (IR) respiratory gas analyzer. An IR source emits a beam that passes through a filter, which passes only the wavelength absorbed by the gas of interest. The respiratory gas from the patient is sampled and passes through the gas cell in the optical path. An IR detector measures intensity of the IR wavelength that has passed through the gas sample; intensity is inversely related to the partial pressure of that gas in the sample cell. The electrical signal from the detector is processed to report the gas composition (in millimeters of mercury); this value can be automatically converted to a reading in volumes percent if the ambient pressure is known.
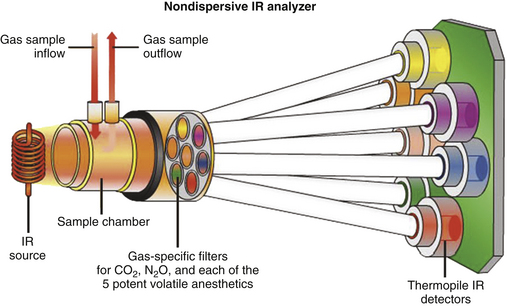
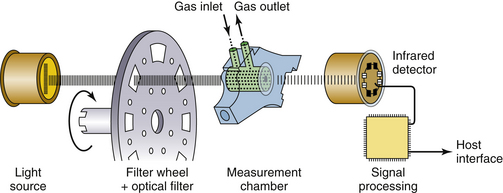
FIGURE 8-9 Principles of the Datex-Ohmeda infrared (IR) analyzer in the Compact Airway Module (GE Healthcare, Waukesha, WI). In this design, the IR beam is interrupted electronically, rather than mechanically, by a “chopper” wheel. (From Explore! The anesthesia system. Cincinnati, OH, GE Datex-Ohmeda.)
Carbon dioxide, nitrous oxide, and anesthetic gases exhibit absorption of radiation at unique bands in the IR spectrum (see Fig. 8-7). Carbon dioxide molecules absorb strongly between 4.2 and 4.4 μm, whereas nitrous oxide molecules absorb strongly between 4.4 and 4.6 μm and less strongly at 3.9 μm. The potent volatile anesthetic agents have strong absorption bands at 3.3 μm and throughout the range 8 to 12 μm.
The close proximity of the nitrous oxide and carbon dioxide absorption bands may cause some analyzers to be affected by high concentrations of nitrous oxide.10,11 The impact of this cross-interference—that is, the overlapping of absorption bands of other gases—can vary significantly among devices. The use of narrow-band sources or narrow-band filters with sufficiently small bandwidths can effectively reduce the impact of cross interference. The presence of other gases, which may or may not have overlapping absorption bands, can also affect the measurement. This phenomenon is called collision broadening or pressure broadening because molecular collisions result in a change in the dipole moment of the gas being analyzed; thus the IR absorption band is broadened, and the apparent absorption at the measurement wavelength may be altered.12 In a typical IR carbon dioxide analyzer, 95% oxygen causes a 0.5% decline in the measured carbon dioxide. Nitrous oxide causes a more substantial increase of approximately 0.1% carbon dioxide per 10% nitrous oxide because of collision broadening. Contemporary multigas analyzers can automatically compensate for the effect of collision broadening if they measure the concentrations of interfering gases.
A simple nondispersive IR analyzer (see Fig. 8-8) consists of the following basic elements:
1. A source of IR radiation, typically a heated black body. A black body radiator is a theoretical object that is totally absorbent to all thermal energy that falls on it; it does not reflect any light and therefore appears black. As it absorbs energy, it heats up and reradiates the energy as electromagnetic radiation. Heating the black body causes emission of IR radiation.
2. A sample cell, or cuvette. The gas to be analyzed is drawn through the cuvette by a sampling pump.
3. A detector that generates an output signal. The signal is related to the intensity of the IR radiation that falls on it.
4. A narrow-band pass filter. This filter allows only radiation at the wavelength bands of interest to pass through; it is interposed between the IR source and the cuvette (see Fig. 8-8) or between the cuvette and the detector (see Fig. 8-9). The intensity of radiation reaching the detector is inversely related to the concentration of the specific gas being measured.
A number of sources of IR radiation can be used to produce a broad spectrum of IR radiation. Light sources made of tungsten wires or ceramic resistive materials heated to 1500 to 4000 K emit energy over a broad wavelength range that includes the absorption spectrum of the respiratory gases. The radiation may be pulsed electronically (see Fig. 8-9) or, if constant, may be made intermittent by being interrupted mechanically, or “chopped,” such as with a filter wheel (Fig. 8-10). Because energy output of IR light sources tends to drift, optical systems have been designed to stabilize the analyzers. Three common designs are distinguished by their use of single or dual IR beams and by their use of positive or negative filtering.13
Single-Beam Positive Filter
In single-beam positive-filter designs, the IR beam may be divided in time or in space. If the IR beam is divided in time, precision optical band-pass filters mounted on a chopper wheel spinning at 40 to 250 rpm sequentially interrupt a single IR beam. The beam retains energy at a narrow wavelength band during each interruption. If the IR beam is divided in space, after passing through the cuvette, the beam is divided into separate paths using beam splitters and mirrors before passing through optical filters. For each gas of interest, a pair of band-pass filters is selected at an absorption peak and at a reference wavelength at which relatively little absorption occurs. The chopped IR beam then passes through a cuvette containing the sample gas. The ratio of intensity of the IR beam for each pair of filters is proportional to the partial pressure of the gas and is insensitive to changes in the intensity of the IR source.
Single-Beam Negative Filter
In the single-beam negative-filter design, the filters usually are gas-filled cells mounted in a spinning wheel. During each interruption, the IR beam retains energy at all wavelengths except those absorbed by the gas. The chopped IR beam then passes through a cuvette containing the sample gas. Analogous to the positive-filter design previously described, the ratio of IR beam intensity for each pair of filter cells is proportional to the partial pressure of the gas and is insensitive to changes in intensity of the IR source.
Dual-Beam Positive Filter
In the dual-beam positive-filter design, the IR energy from the source is split into two parallel beams: one passes through the sample gas, the other passes through a reference gas. A spinning blade passes through the beams and sequentially interrupts one, the other, then both. The two beams are optically focused on a single point, where a band pass optical filter selected at the absorption peak of the gas of interest is mounted over a single detector. As before, the ratios of the intensities of the sample and reference beams are proportional to the partial pressure of the gas.
Detectors of Infrared Radiation
To measure carbon dioxide, nitrous oxide, and sometimes anesthetic agents, a radiation-sensitive solid-state material, lead selenide, is commonly used as a detector. Lead selenide is quite sensitive to changes in temperature; it therefore is usually thermostatically regulated (cooled or heated) or temperature compensated.
Anesthetic agents, carbon dioxide, and nitrous oxide are sometimes measured with another detector called a Luft cell. This detector uses a chamber filled with gas that expands as IR radiation enters the chamber and is absorbed. A flexible wall of the chamber acts as a diaphragm that moves as the gas expands, and a microphone converts the motion to an electrical signal.
The signal processor converts the measured electrical currents to display gas partial pressure. First, the ratios of detector currents at various points in the spinning wheel’s progress, or from multiple detectors, are computed. Next, electronic scaling and filtering are applied. Finally, linearization according to a reference table for the point-by-point conversion from electrical voltage to gas partial pressure is accomplished by a microprocessor. Compensation for cross-sensitivity or interference between gases can be accomplished by the microprocessor after linearization.
Infrared Wavelength and Anesthetic Agent Specificity
IR analyzers must use a specific wavelength of radiation according to the absorbance peak of each gas to be measured. Early agent analyzers, such as the Datex Puritan-Bennett Anesthetic Agent Monitor (Fig. 8-11),14 used a wavelength of 3.3 μm to measure the potent inhaled anesthetics. However, use of a single wavelength did not permit differentiation among these agents (see Fig. 8-7). When this system was used, the analyzer had to be programmed by the user for the particular agent being administered. This set the appropriate gain in the software program, and the displayed reading was then accurate for the one agent in use. Obviously, programming such an analyzer for the wrong agent, or the use of mixed agents, would lead to erroneous readings.15,16
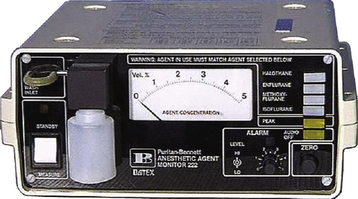
FIGURE 8-11 Datex Puritan-Bennett anesthetic agent analyzer. This analyzer uses a single wavelength, so the agent being measured must be entered into the software by the user; failure to do this results in erroneous readings. Note the warning: “Agent in use must match agent selected below.” Keypads on the right are for selection of halothane, enflurane, methoxyflurane, or isoflurane.
Modern IR analyzers are agent specific; that is, by measuring each agent with a unique set of wavelengths, they have the capability to both identify and quantify mixed agents in the presence of one another. Contemporary analyzers that can identify and quantify anesthetic agents incorporate individual wavelength filters in the range of 8 to 12 μm. An example is the Datex-Ohmeda Compact Airway Module (GE Healthcare) (see Figs. 8-2 and 8-9), which measures the absorption of the gas sample at seven different wavelengths selected using optical narrow band filters. In this analyzer module, the IR radiation detectors are thermopiles. Carbon dioxide and nitrous oxide are calculated from absorption measured at 3 to 5 μm (Fig. 8-12). Identification and calculation of the concentrations of anesthetic agents are done by measuring absorption at five wavelengths in the 8- to 9-μm band and solving for the concentrations from a set of five equations, one for each agent (Fig. 8-13).16 A schematic of a multiwavelength analyzer in which the beam of radiation is interrupted mechanically is shown in Figure 8-14.
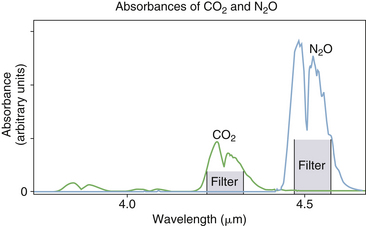
FIGURE 8-12 Absorbance bands for CO2 and N2O. (From Datex-Ohmeda Compact Airway Modules technical reference manual. Document no. 800 1009-5. Helsinki, 2003, Datex-Ohmeda Division, Instrumentarium.)
Sampling Systems and Infrared Analysis
Sidestream-sampling analyzers continuously withdraw between 50 and 250 mL/min from the breathing circuit through narrow-gauge sample tubing to the optical system, where the measurement is made. One of the disadvantages of sidestream monitors is the need to deal with liquid water and water vapor. Water vapor from the breathing circuit condenses on its way to the sample cuvette and can interfere with optical transmission. NAFION tubing, a semipermeable polymer that selectively allows water vapor to pass from its interior to the relatively dry exterior, is commonly used to eliminate water vapor. Also, a water trap often is interposed between the patient sampling catheter and the analyzer to protect the optical system from liquid water and body fluids (see Fig. 8-1). Filters integrated with the sampling tubing have replaced water traps in many of the currently available systems. Three different methods are available; these include 1) blocking the water, such as with a hydrophobic filter with large surface area (Oridion Medical, Jersusalem, IL), 2) absorbing and blocking, such as with a hydrophilic fibrous element followed by a hydrophobic plug (Philips Respironics, Wallingford, CT), and 3) active water removal with a hydrophilic wick, such as an elastomer, described as being able to “sweat” water collected from the gas sample flow to the outer surface of the cover (Nomoline, PhaseIn).
Infrared Photoacoustic Spectrometer
The photoacoustic spectrometer is similar to the basic IR spectrometer (Fig. 8-15). IR energy is passed through optical filters that select narrow-wavelength bands that correspond to the absorption characteristics of the respired gases. Carbon dioxide is measured at a wavelength of 4.3 μm, nitrous oxide at 3.9 μm, and the potent inhaled agents at a wavelength between 10.3 and 13.0 μm.17 Evenly spaced windows are located along the circumference of a rotating wheel. The optical components are located astride the wheel along one of its radii. A series of IR beams pulse on and off at particular frequencies, according to the rate of rotation of the wheel and the spacing of the windows. The gas flowing through the measurement cuvette is exposed to the pulsed IR beams. As each gas absorbs the pulsating IR energy in its absorption band, it expands and contracts at that frequency, and resulting sound waves are detected with a microphone. The partial pressure of each gas in the sample is then proportional to the amplitude, or “volume,” of the measured sound.
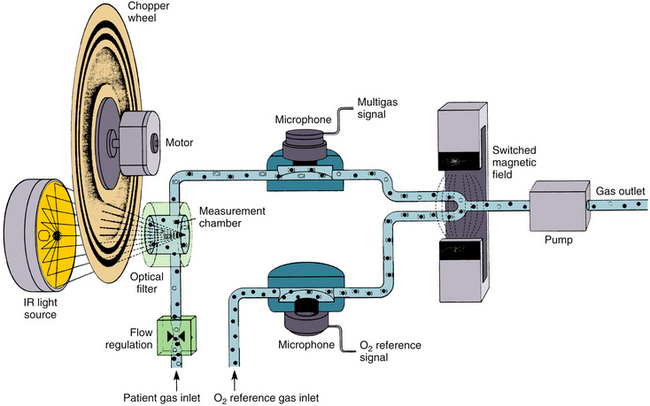
FIGURE 8-15 Schematic diagram of a photoacoustic spectrometer.
An infrared (IR) source emits a beam that passes through a spinning chopper wheel that has several rows of circumferential slots. The interrupted IR beams then pass through optical filters that select specific wavelengths of light chosen to be at the absorption peaks of the gases to be measured. Each interrupted IR light beam impinges on its respective gas in the measurement chamber, causing vibration of the gas as energy is absorbed and released from the molecules. The vibration frequency of each gas is dependent on the spacing of its slots on the chopper wheel. A microphone converts the gas vibration frequencies and amplitudes into electrical signals that are converted to the gas concentrations for display. (From Raemer DB: Monitoring respiratory function. In Rogers MC, Tinker JH, Covino BG, Longnecker DE, editors: Principles and practice of anesthesiology. St Louis, 1992, Mosby–Year Book.)
The photoacoustic technique has the distinct advantage over other IR methods in that a simple microphone detector can be used to measure all the IR-absorbing gases. However, this device is sensitive to interference from loud noises and vibration. Also, because only one wavelength is used to measure the potent inhaled anesthetics, this monitor is unable to distinguish among the agents, which requires that it be programmed for the agent in use; also, erroneous readings might arise in the presence of mixed anesthetic agents. This technology was used in the Brüel and Kjær Anesthetic Gas Monitor 1304, and it is used currently in atmospheric trace gas monitors, such as the Innova 1412 (LumaSense Technologies, Santa Clara, CA).
Recent Technologies
Philips Respironics introduced a flexible monitoring interface, now known as CO2nnect & Go, which allows the user to choose, based on the patient and environment, which carbon dioxide–monitoring modality should be used, sidestream or mainstream. A complete measurement system is available for both mainstream (Capnostat 5) and sidestream (LoFlo, either external or internal format) modes of gas sampling.
Mainstream multigas IR analysis has recently been introduced by Phasein in their IRMA series of multigas analyzers. The IRMA mainstream probe measures IR light absorption at 10 different wavelengths to determine gas concentrations in the mixture (Fig. 8-16). Adult, pediatric, and infant disposable airway adapters are available. In a bench study, the monitor was found to have a response time for carbon dioxide (96 vs. 348 ms) and oxygen (108 vs. 432 ms) that was significantly less than a contemporary sidestream-sampling gas monitor.18 The same miniaturized technology is used in Phasein’s EMMA Emergency Capnometer, a device that displays respiratory rate and incorporates apnea, high carbon dioxide, and low carbon dioxide audible and visual alarms (Fig. 8-17).
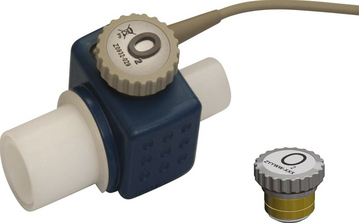
FIGURE 8-16 Mainstream multigas analyzer module that measures carbon dioxide, nitrous oxide, oxygen, and anesthetic agents. Rapid-response fuel-cell oxygen analyzer and IRMA Plug-in and Measure. (Courtesy Phasein AB, Danderyd, Sweden.)
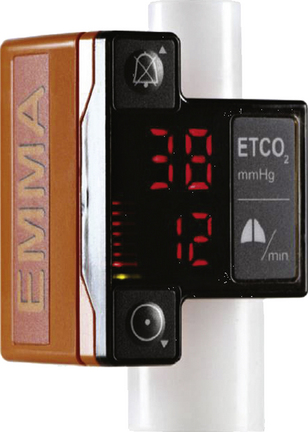
FIGURE 8-17 EMMA Capnocheck mainstream capnometer Plug-in and Measure. (Courtesy Phasein AB, Danderyd, Sweden.)
Although Microstream (Oridion Medical) capnography is now used as a generic term to refer to a sampling flow rate of 50 mL/min, a rate now available from several vendors, it also encompasses the unique IR emission source. This approach is called molecular correlation spectroscopy (MCS),19 and it produces selective emission of a spectrum of discrete wavelengths, approximately 100 discrete lines in the 4.2- to 4.35-μm range, which match those for carbon dioxide absorption. This is compared with the broad IR emission spectrum of black body emitters used with conventional nondispersive IR technology and permits use of a smaller sample cell (15 μL). This technology has been adapted for use in portable carbon dioxide monitors.20
Raman Spectroscopy
When light strikes gas molecules, most of the energy scattered is absorbed and reemitted in the same direction, and at the same wavelength, as the incoming beam (Rayleigh scattering).21 At room temperature, about one millionth of the energy is scattered at a longer wavelength, producing a so-called red-shifted spectrum. Raman scattering can be used to measure the constituents of a gas mixture. Unlike IR spectroscopy, Raman scattering is not limited to gas species that are polar. Carbon dioxide, oxygen, nitrogen, water vapor, nitrous oxide, and the potent volatile anesthetic agents all exhibit Raman activity. Monatomic gases such as helium, xenon, and argon, which lack intramolecular bonds, do not exhibit Raman activity.
The medical Raman spectrometer used a helium-neon laser (wavelength 633 nm, or 0.633 μm) to produce the incoming monochromatic light beam. The Raman scattered light is of low intensity and is measured perpendicular to the laser beam. The measurement cuvette is located in the cavity of the laser, so that the gas molecules are struck repeatedly by the beam (Fig. 8-18). This results in enough Raman scattering to be collected and processed by the optical detection system. Photomultiplier tubes count the scattered photons at the characteristic Raman-shifted wavelength for each gas. Thus the Raman spectrometer measures the partial pressures of the gases in its measurement cuvette, and measurements are converted electronically to the desired units of measure and are displayed on the screen.
Raman spectroscopy is the principle of operation of the Ohmeda Rascal II monitor (Fig. 8-19). The Rascal II Raman spectrometer has the same capabilities as the mass spectrometer; in particular, it is able to measure nitrogen for detection of air embolism, and it received a very favorable evaluation.22 Unfortunately, despite its obvious versatility, this monitor is no longer in production, although a number remain in use.
Water Vapor and Accuracy of Capnometers
Water vapor can be an important factor in the accuracy of a carbon dioxide analyzer. Most sidestream analyzers report ambient temperature and pressure dry (ATPD) values for PCO2 by using a water trap and water vapor–permeable NAFION tubing to remove water vapor from the sample. It has been recommended that carbon dioxide analyzers report their results at body temperature and pressure saturated (BTPS) so that end-tidal values are close to conventionally reported alveolar gas partial pressure.23 The error in reporting PCO2 at ATPD, when it should be reported at BTPS, is approximately 2.5 mm Hg. Carbon dioxide values reported in ATPD can be converted to BTPS by decreasing the dry gas reading by the fraction (PATM − 47)/PATM, where PATM is the atmospheric pressure in mm Hg, and 47 mm Hg is the vapor pressure of water at 37° C.
Mainstream sampling analyzers naturally report readings at the breathing circuit conditions that are typically near BTPS. Depending on these conditions, a small decrease from body temperature may result in the analyzer reading slightly less than BTPS values. Condensation of water can affect the windows of the mainstream airway adapter and cause erroneous readings. These adapters are therefore heated or use coatings on the inside of the windows to prevent condensation.
Colorimetric Carbon Dioxide Detectors
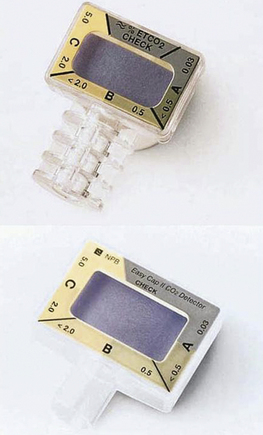
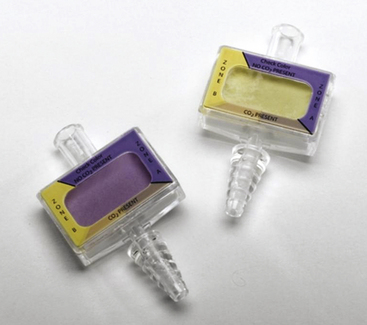
Carbon dioxide in solution is acidic; pH-sensitive dyes can therefore be used to detect and measure its presence. A colorimetric carbon dioxide detector is designed to be interposed between the tracheal tube and the breathing circuit. Respired gas passes through a hydrophobic filter and a piece of filter paper visible through a plastic window. The originally described detector, the Fenem CO2 Indicator (Engineered Medical Systems, Indianapolis, IN), consisted of a piece of filter paper permeated with an aqueous solution of metacresol purple, a pH-sensitive dye. Carbon dioxide from the exhaled breath dissolves in the solution, changing the color of the dye from purple to yellow; the degree of color change depends on the carbon dioxide concentration. On inspiration of carbon dioxide–free gas, carbon dioxide leaves the solution and the color of the indicator returns to purple.24
A number of colorimetric devices are now commercially available for use in adult and pediatric patients. They may use other carbon dioxide–sensitive dyes and are calibrated to provide an approximate indication of expired carbon dioxide concentration that can be discerned by comparison of the indicator color with a graduated color scale printed on the device’s housing. For example, with the Easy Cap II (Covidien, Mansfield, MA), the color changes from purple to yellow to indicate 2% to 5% carbon dioxide (15 to 38 mm Hg) with each exhaled breath. On inspiration the color should change back to purple, indicating absence of carbon dioxide in the inspired gas (Fig. 8-20). A permanent change in color may mislead the uneducated user.25,26 The following caution appears in the directions for use from the manufacturer: “Interpreting results before confirming six breath cycles can yield false results. Gastric distension with air prior to attempted intubation may introduce carbon dioxide levels as high as 4.5% into the Easy Cap detector if the endotracheal tube is misplaced in the esophagus. Initial Easy Cap detector color (yellow) may be interpreted as a false positive if read before delivery of six breaths.” The warnings also further include a statement that “reflux of gastric contents, mucus, edema fluid, or intratracheal epinephrine into the Easy Cap can yield persistent patchy yellow or white discoloration which does not vary with the respiratory cycle. Contamination of this type may also increase airway resistance and affect ventilation. Discard device if this occurs.”
This type of detector is intended to be used to confirm clinical signs of tracheal intubation when conventional capnography is not available. Both adult and pediatric versions are available. The newest Fenem carbon dioxide indicator is designed to be attached to the exhalation port (19 or 30 mm) of a self-inflating resuscitator bag, where it does not add dead space or resistance to flow (Fig. 8-21).
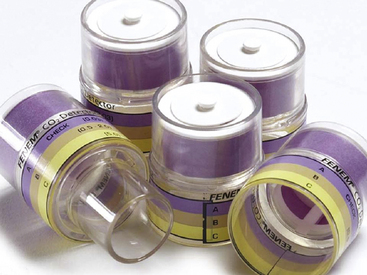
FIGURE 8-21 Fenem CO2 Detector (Engineered Medical Systems, Indianapolis, IN) designed for exhalation port of self-inflating resuscitation (Ambu) bag.
Another version of the colorimetric carbon dioxide detector, the CO2nfirm Now carbon dioxide detector (Covidien), is marketed as a device to confirm intragastric placement of an orogastric or nasogastric tube to avoid intratracheal placement (Fig. 8-22).
Oxygen Analyzers
In all contemporary anesthesia delivery systems, the fraction of inspired oxygen (FiO2) in an anesthesia breathing circuit is monitored by an oxygen analyzer. Two types of oxygen analyzers are in common use for monitoring: those based on a fuel or galvanic cell principle and the paramagnetic (Pauling) sensor. In the past, in addition to these methods, multigas analyzers that used mass spectroscopy or Raman spectroscopy to measure oxygen were also used.
Fuel Cell Oxygen Analyzer
The fuel cell (Fig. 8-23), or galvanic cell, is basically an oxygen battery that consists of a diffusion barrier; a noble metal cathode, either gold mesh or platinum; and a lead or zinc anode in a basic, usually potassium hydroxide, electrolyte bath (Fig. 8-24). The sensor is covered by an oxygen-permeable membrane and is exposed to the gas in the breathing circuit. Oxygen diffusing into the sensor is reduced to hydroxyl ions at the cathode in the following reaction:
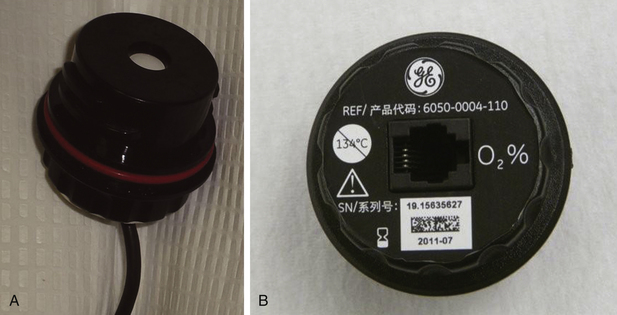
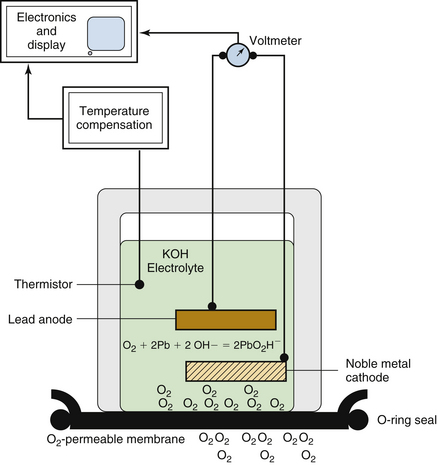
FIGURE 8-24 Principles of fuel cell oxygen analyzer. Oxygen in the gas sample permeates a membrane and enters a potassium hydroxide (KOH) electrolyte solution. An electrical potential is established between a lead anode and noble metal cathode as oxygen is supplied to the anode. The measured voltage between the electrodes is proportional to the oxygen tension of the gas sample. Temperature compensation is required for accurate measurement. (From Raemer DB: Monitoring respiratory function. In Rogers MC, Tinker JH, Covino BG, Longnecker DE, editors: Principles and practice of anesthesiology. St Louis, 1992, Mosby–Year Book.)

The hydroxyl ions then oxidize the lead or zinc anode, and the following reaction occurs at the anode:


The flow of current depends on the uptake of oxygen at the cathode, according to Faraday’s first law of electrolysis, and the voltage developed is proportional to the oxygen partial pressure (PaO2). No polarizing potential (battery) is needed because the cell produces its own. The fuel-cell sensor voltage is measured and is electronically scaled to units of partial pressure, or equivalent concentration in volumes percent, and is displayed as a readout. Like any battery, the fuel cell has a limited life span, usually several months, depending on its length of exposure to oxygen. For this reason, machine manufacturers have recommended that the cell be removed from the breathing system when not in use. The response time of standard fuel cell oxygen analyzers is slow (~30 seconds); therefore they are best used to monitor the average O2 concentration in the inspiratory limb of the breathing system.
A faster galvanic oxygen sensor is in development and is designed to be used with the mainstream multigas analyzer (Phasein IRMA; see Fig. 8-16). This sensor claimed to have a lifetime exceeding 100,000 oxygen hours.
Paramagnetic Oxygen Analyzer
The oxygen molecule has two electrons in unpaired orbits, which makes it paramagnetic; that is, it is susceptible to attraction by a magnetic field. Most other gases are weakly diamagnetic and are repelled. The paramagnetic oxygen sensor uses the strong, positive magnetic susceptibility of oxygen in a pneumatic bridge configuration to determine oxygen concentration by measuring a pressure differential between a stream of reference gas (room air at about 10 mL/min) and one of the measured gas, as the two streams are exposed to a changing magnetic field (Fig. 8-25). An electromagnet is rapidly switched off and on (at a frequency of 165 Hz in the GE Healthcare Compact Airway Module1), creating a rapidly changing magnetic field between its poles. The electromagnet is designed to have its poles in close proximity, forming a narrow gap. The streams of sample and reference gas have different oxygen partial pressures, and the pressure between the entrance and exit of the respective gas streams differs slightly because of the magnetic force on the oxygen molecules; this generates sound waves from each gas stream. A sensitive pressure transducer (i.e., a microphone) is used to convert the sound waves to an electrical signal. The output signal is proportional to the oxygen partial pressure difference between the two gas streams and should be displayed as the PO2, but it is more typically displayed as the equivalent concentration in volumes percent. Paramagnetic oxygen analysis is used in most of the contemporary sidestream-sampling multigas analyzers.
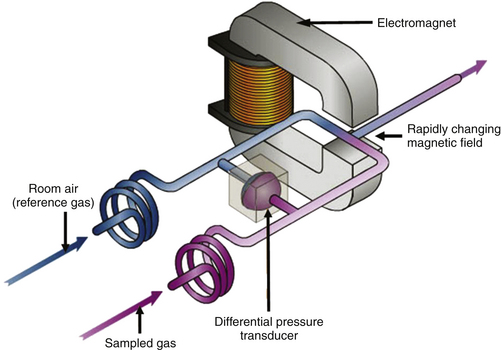
FIGURE 8-25 Schematic of a paramagnetic oxygen analyzer. The sample and reference gas streams converge in a rapidly changing magnetic field. Because the two streams have different oxygen tensions (i.e., different numbers of oxygen molecules), a pressure differential is created across a sensitive pressure transducer. The transducer converts this force to an electrical signal that is either displayed as oxygen partial pressure or converted to a reading in volumes percent. (From Explore Aisys. In Explore! The anesthesia system. Cincinnati, OH, GE Datex-Ohmeda.)
The main advantage of paramagnetic analysis over the standard fuel cell is that it has a very rapid response that permits continuous breath-by-breath monitoring of the respired oxygen concentration. The graphic representation of this can be displayed as the oxygram, which is essentially a mirror image of the capnogram (Fig. 8-26).
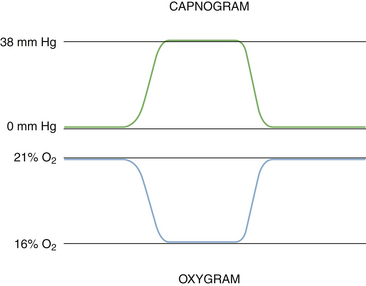
FIGURE 8-26 Capnogram (top) and oxygram (bottom). The oxygram is almost a mirror image of the capnogram.
Normally the gas exiting the multigas analyzer is directed to the waste gas scavenging system of the anesthesia delivery system. If a low-flow or closed-circuit anesthesia technique is being used, the gas exiting the analyzer usually is returned to the breathing system. In this case it must be remembered that nitrogen from the room air reference gas stream is being added also, albeit at a low rate (8 mL/min), and will accumulate in the breathing circuit.27
Oxigraphy
Another technology used to measure oxygen available from Oxigraf (Palo Alto, CA) uses laser diode absorption spectroscopy in the visible spectrum, similar in principle to the IR absorption methodology used to measure carbon dioxide, nitrous oxide, and the potent inhaled anesthetic agents. The wavelength used to measure oxygen is 760 nm because there is no interference by other gases at this wavelength. The emission line width of the laser and the absorption line width of oxygen are both very narrow (<0.01 nm) compared with the absorption band for carbon dioxide (~100 nm). The laser is thermally tuned precisely to the oxygen line; as the oxygen concentration increases, the intensity of transmitted light is attenuated as energy is absorbed by the oxygen molecules. The response of the photodetector varies linearly with the concentration of oxygen. The analyzer can measure oxygen in the range of 5% to 100% with an accuracy of 0.1% and has an adjustable gas sampling rate of 50 to 250 mL/min. As with the IR analyzers, the Oxigraf analyzer measures the partial pressure of oxygen in the sample chamber. The pressure of the sample at the time of measurement also is needed to convert data from partial pressure to percent oxygen.
Calibration of Oxygen Analyzers
Oxygen analyzers require periodic calibration. Because all analyzers produce an electrical signal proportional to the oxygen partial pressure, the constant of proportionality (gain) must be determined. In general, the electrical signal in the presence of 0% oxygen is known to be near zero; therefore no offset correction is required. In the fuel cell, the gain changes over time because of changes in electrolyte, electrodes (the anode is sacrificial), and membrane; the anesthesia caregiver must therefore calibrate it to display 21% by removing it from the breathing system and allowing equilibration in room air. It must be remembered that the fuel cell is actually measuring the ambient pressure of oxygen (PO2, normally 159 mm Hg in dry air at sea level), but for convenience, it displays 21 vol%. Therefore, if a fuel cell that has been calibrated to read 21% at sea level is used at a much higher altitude, the readout will show less than 21% because the ambient PO2 is lower, even though the composition of the atmosphere is still 21% by volume.
The gain of the paramagnetic sensor changes with temperature, humidity, and pneumatic factors. The contemporary paramagnetic oxygen analyzers perform their own periodic computer-controlled automated calibration process.
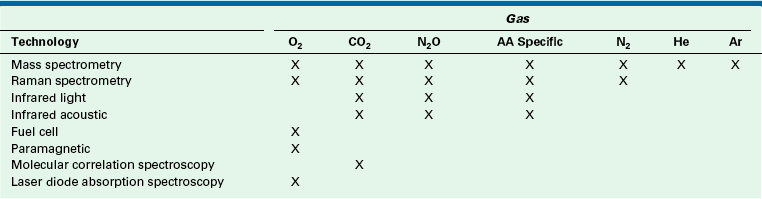
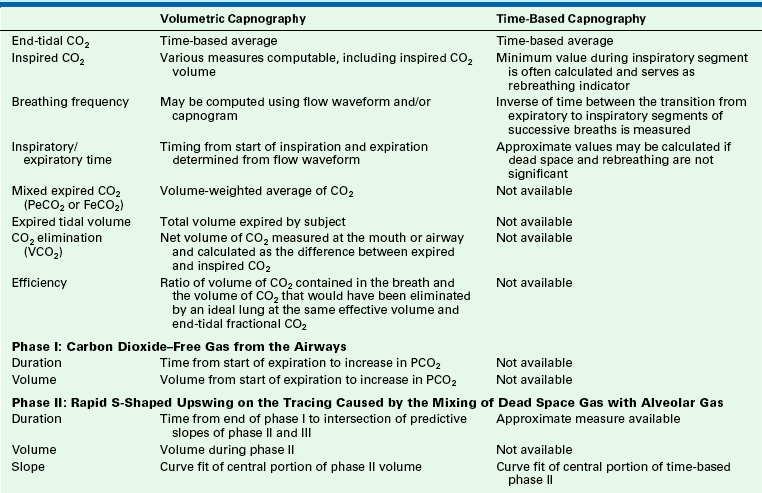
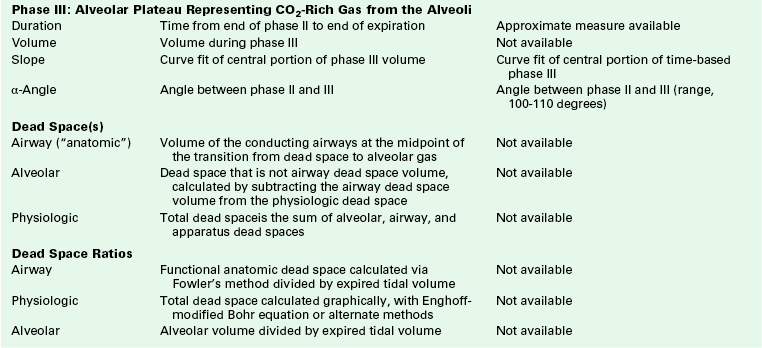
Gases in the anesthesia delivery system can be analyzed by a number of modern technologies, each of which is based on application of some specific physical property of the gas molecule. The analysis methods and their applications are summarized in Table 8-1. In interpreting gas analysis data, it is important to understand the principles of how the data were obtained so that erroneous data can be identified and, if necessary, rejected.
Balance Gas
Contemporary multigas analyzers measure the partial pressure of each gas of interest in a dry gas mixture. They also measure ambient barometric pressure (PB). The partial pressure of oxygen (PO2) is measured by paramagnetic analysis, and the partial pressures of nitrous oxide and carbon dioxide (PN2O and PCO2) and the anesthetic agent are measured by IR technology. If the sum of these partial pressures is subtracted from the ambient barometric pressure, the result is the partial pressure of unmeasured gases and may be displayed as “Balance Gas” (Fig. 8-27, Box 8-1). In most cases the balance gas is nitrogen, and in the absence of a specific nitrogen gas analyzer (i.e., Raman or mass spectrometer), balance gas has been described as the “poor man’s nitrogen.” However, if a heliox (75% helium, 25% oxygen) mixture were being analyzed, helium would be read as the balance gas.


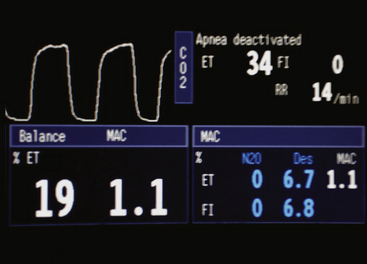
FIGURE 8-27 Screen of the Datex-Ohmeda S5 monitor (GE Healthcare, Waukesha, WI). Balance gas concentration is shown in volumes percent. Measurements are made in millimeters of mercury and then converted to volumes percent using the measured barometric pressure. Capnogram (top) and oxygram (bottom). The oxygram is almost a mirror image of the capnogram.
Nitric Oxide
Inhaled nitric oxide (NO) is used to treat hypoxemia and pulmonary hypertension associated with acute respirtory failure. A number of nitric oxide delivery systems are commercially available that incorporate or require contemporaneous use of an NO analyzer.
The INOvent delivery system (GE Healthcare) delivers nitric oxide in concentrations of 0 to 40 ppm. Circuit gas is sampled at a rate of 230 mL/min and is analyzed electrochemically (amperometric approach) when nitric oxide reacts with an electrode to induce a current or voltage change. The measurement ranges are 0 to 100 ppm for NO and 0 to 15 ppm for nitrogen dioxide, NO2.
Chemiluminescence is the emission of light with limited emission of heat (luminescence) as the result of a chemical reaction. The concentration of NO can be determined by using a simple chemiluminescent reaction involving ozone28; a sample containing nitric oxide is mixed with a large quantity of ozone, and the nitric oxide reacts with the ozone to produce oxygen and nitrogen dioxide. This reaction also produces light (chemiluminescence) that can be measured with a photodetector. The amount of light produced is proportional to the amount of nitric oxide in the gas sample:

To determine the amount of nitrogen dioxide in a sample containing no nitric oxide, the NO2 must first be converted to NO by passing the sample through a converter, before the ozone activation reaction is applied. The ozone reaction produces a photon count proportional to NO, which is proportional to NO2 before it was converted to NO. In the case of a mixed sample containing both NO and NO2, the above reaction yields the amount of NO and NO2 combined in the gas sample, assuming that the sample is passed through the converter. If the mixed sample is not passed through the converter, the ozone reaction produces activated NO2 only in proportion to the NO in the sample. The NO2 in the sample is not activated by the ozone reaction. Although unactivated NO2 is present with the activated NO2, photons are emitted only by the activated species, which is proportional to the original NO. The final step is to subtract NO from the combined gas sample (NO + NO2) to yield NO2.
Applications of Gas Monitoring
The qualitative and quantitative oxygen-specific analyzer in the anesthesia breathing system is probably the most important of all of the monitors on the anesthesia workstation. Before the general use of an oxygen analyzer in the anesthesia breathing system, a number of adverse outcomes from unrecognized delivery of a hypoxic gas had been reported.29
To be used correctly, the oxygen analyzer must be calibrated, and appropriate low and high audible and visual concentration alarm limits must be set. Because it samples gas in the inspiratory limb of the breathing system, this analyzer provides the only means of ensuring that oxygen is being delivered to the patient. If a hypoxic gas or gas mixture is delivered, the alarm will go off. Such situations can occur if there is a pipeline crossover (e.g., O2 for N2O), an incorrectly filled oxygen storage tank or cylinder, or failure of a proportioning system intended to prevent delivery of a gas mixture that contains less than 25% oxygen. The high oxygen concentration alarm limit is important when caring for patients for whom a high oxygen concentration may be harmful, such as premature infants and patients treated with chemotherapeutic drugs (e.g., bleomycin), who are more susceptible to oxygen toxicity.
Continuous monitoring of inspired and end-expired oxygen is very helpful in ensuring completeness of preoxygenation of the lungs, before a rapid sequence induction of anesthesia, or in patients at increased risk for hypoxemia during induction of anesthesia, such as the morbidly obese.30-32 During preoxygenation, nitrogen is washed out of the lungs and is replaced by oxygen.33 Preoxygenation is ideal when the inspired oxygen concentration is 100% and the end-tidal oxygen is 95%, the difference of 5% being the exhaled carbon dioxide. In general, however, an end-tidal oxygen greater than 90% is considered acceptable.
The rapid-response oxygen analyzer makes possible the display of the oxygram, a continuous real-time display of oxygen concentration on the y-axis against time on the x-axis. Now that it is possible to accurately measure inspiratory and expiratory gas flows, and therefore volumes (i.e., flow = volume/time), via the airway, the oxygram can be combined with these flow signals to plot inspired and expired oxygen concentrations against volume. This is termed volumetric oxygraphy. In theory, the integral of simultaneous flow and oxygen concentration during inspiration and expiration is the inspired and expired volume of oxygen. From the difference between these two amounts, oxygen consumption can be estimated. Barnard and Sleigh34 used this method (with a Datex Ultima monitor) to measure oxygen consumption in patients under general anesthesia and compared it with that obtained simultaneously using a metabolic monitor. These investigators concluded that the Datex Ultima may be used with moderate accuracy to measure oxygen uptake during anesthesia. The analogous plot for the capnogram, volumetric capnography, allows measurement of carbon dioxide production.
The application of this concept is termed indirect calorimetry, which is used in the GE Healthcare bedside metabolic module,35 which has been validated in both the ICU and anesthesia environments.36 By monitoring flow and measuring the gas concentrations, this module provides measurements of oxygen consumption (VO2) and carbon dioxide elimination (VCO2), and it calculates respiratory quotient and energy expenditure (Fig. 8-28).37 Although the applications may be more pertinent to patients in the ICU, some have found it useful during liver transplantation surgery in predicting the viability of the organ once in the recipient. It might also be useful in the early detection of a hypermetabolic state in a patient under general anesthesia (e.g., malignant hyperthermia) and in distinguishing it from insufflation of carbon dioxide during a laparoscopic procedure.38 One development worth noting is the trend toward complete in-line measurement of oxygen consumption and carbon dioxide elimination, evidenced by the testing of a prototype in-line system that uses a luminescence quenching sensor for O2, IR sensing for carbon dioxide, and a fixed orifice for flow sensing.39
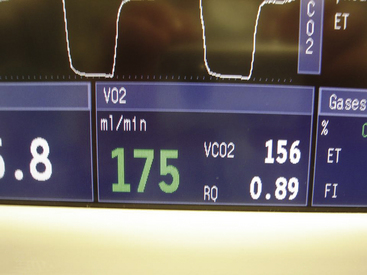
FIGURE 8-28 Screen of Datex-Ohmeda S5 Compact Airway Module monitor (GE Healthcare, Waukesha, WI). Metabolic monitoring data (VO2, VO2, RQ) are shown from integrating concentration and flow signals.
The oxygen analyzer is one of the most important monitors in the breathing system because it is both qualitative and quantitative. In that location, it helps ensure that the patient does not receive a hypoxic gas mixture. In that regard, it should be noted that if an oxygen delivery device, such as a mask or nasal cannula, is connected to the auxiliary oxygen outlet of the anesthesia workstation—which derives gas from the machine’s high-pressure system for oxygen, or to a wall oxygen outlet flowmeter—there is no oxygen monitoring of the delivered gas. Thus if a hypoxic gas were delivered by the oxygen pipeline system to the auxiliary oxygen outlet, or an oxygen wall flowmeter were to somehow become connected to a nitrous oxide wall outlet, an adverse outcome could be expected.40
Carbon Dioxide
The introduction of carbon dioxide monitoring into clinical practice is one of the major advances in patient safety. Before its introduction, many cases of esophageal intubation were unrecognized and led to adverse outcomes, not to mention increases in malpractice premiums. Detection of carbon dioxide on a breath-by-breath basis is considered to be the best method to confirm endotracheal intubation,41 and the applications of time and volumetric carbon dioxide monitoring (capnography) are numerous, such that entire textbooks have been devoted to this subject.42,43
Time Capnography
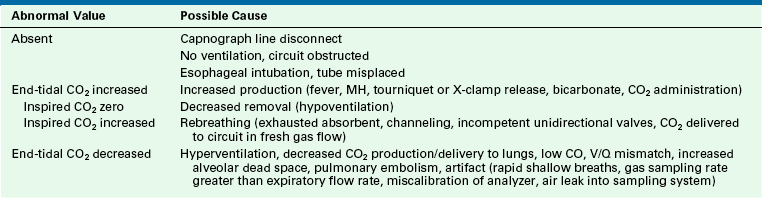
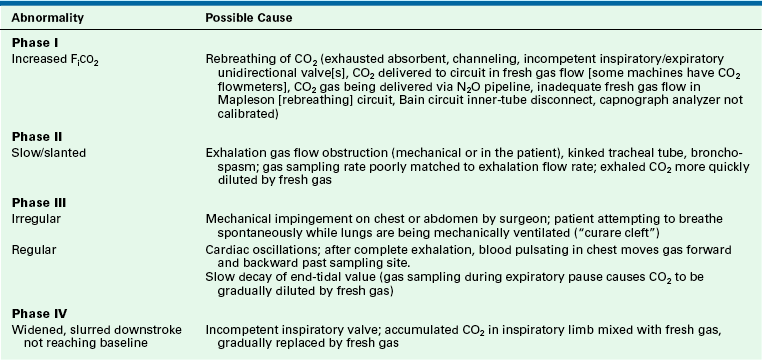
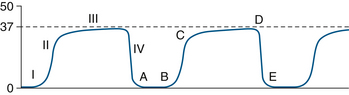
The normal capnogram, shown in Figure 8-29, can be divided into four phases. Phase I (A to B) is the inspiratory baseline, which normally is zero. Phase II (B to C) is the expiratory upstroke, which normally is steep. As the patient exhales, fresh gas in the anatomic dead space (with no carbon dioxide) is gradually replaced by carbon dioxide-containing gas from the alveoli. Phase III (C to D) is the expiratory plateau, which normally has a slight upward gradient because of imperfect matching of ventilation and perfusion (V/Q) throughout the lungs. Alveoli with lower V/Q ratios, and therefore higher carbon dioxide concentrations, tend to empty later during exhalation than those with high V/Q ratios. Once exhalation is complete, the plateau continues because exhaled carbon dioxide from the alveoli remains at the gas sampling site until the next inspiration. The end-tidal carbon dioxide concentration (PETCO2) is considered to be the same as alveolar concentration (PACO2). Phase IV (D to E) is the inspiratory downstroke, as fresh gas replaces alveolar gas at the sampling site. The presence of a normal capnogram indicates that the lungs are being ventilated. The ventilation may be spontaneous, assisted, or controlled. The inspired carbon dioxide concentration normally is zero, and the end-tidal volume normally is between 34 and 44 mm Hg. Table 8-2 shows some of the possible causes for values outside of the normal ranges. Table 8-3 lists some other abnormalities in the four phases of the capnogram. Observation of the shape of the capnogram also may be helpful in alerting the caregiver to certain conditions (see Chapter 10 for examples of abnormal capnograms).
TABLE 8-2
Possible Causes for Abnormal Capnogram Values
CO, cardiac output; CO2, carbon dioxide; MH, malignant hyperthermia; V/Q, ventilation/perfusion.
TABLE 8-3
Possible Capnogram Abnormalities
CO2, carbon dioxide; NO2, nitrous oxide; FiCO2, fractional concentration of inspired carbon dioxide.
The end-tidal carbon dioxide concentration is commonly used as a surrogate for alveolar carbon dioxide tension, which in turn is used to track arterial carbon dioxide, a value that must be obtained invasively. The normal arterial–end-tidal carbon dioxide tension difference is approximately 4 mm Hg. This difference is not constant and is affected by the alveolar dead space (DSA), which is that portion of the alveolar ventilation (VA) that is wasted.44 Consider the following example of a patient whose lungs are being ventilated: PaCO2 is 40 mm Hg, end-tidal (alveolar) PACO2 is 36 mm Hg, tidal volume is 500 mL, and anatomic dead space ventilation is 150 mL; therefore alveolar ventilation is 350 mL (500 − 150).

Thus 35 mL (350 × 10%) of the VA is DSA, or wasted alveolar ventilation.
In addition to its use for confirming tracheal, rather than esophageal, intubation and to make adjustments to ventilator settings, end-tidal carbon dioxide monitoring has been found to correlate well with cardiac output during low-flow states. This has been applied in the evaluation of the efficacy of resuscitation efforts in cardiac arrest victims, and several studies have found that low end-tidal carbon dioxide is associated with a poorer prognosis.45,46
Volumetric Capnography
Some professional societies, including the ASA, have recognized the important link between carbon dioxide and volume, and although they have not yet mandated the monitoring of expired volume, they have strongly encouraged it. Because the transport of volume is central to the function of the lung, volumetric capnography provides a clearer and more comprehensive picture of the patient than a single-point measure such as an end-tidal value.
The integration of flow or volume signals with the carbon dioxide concentration signal and the measurement of indexes characterizing this curve is widely known as volumetric capnography. It has also been referred to as the single-breath test for carbon dioxide47,48 and carbon dioxide spirography.49 It provides information based on physiology using an established and uniform terminology. This terminology was originally used by Fowler to describe the single-breath test for nitrogen (SBT-N2) curve, with which instantaneous nitrogen concentration is plotted against expired volume.50 Where instantaneous carbon dioxide fractional concentration is plotted against the expired volume, the resulting curve has been referred to as an SBT-CO2 curve47 or, preferably, the volumetric capnogram.51 The presentation shown in Figure 8-30 provides a unified framework for such physiologic measures as carbon dioxide elimination, alveolar dead space, and rates of emptying.
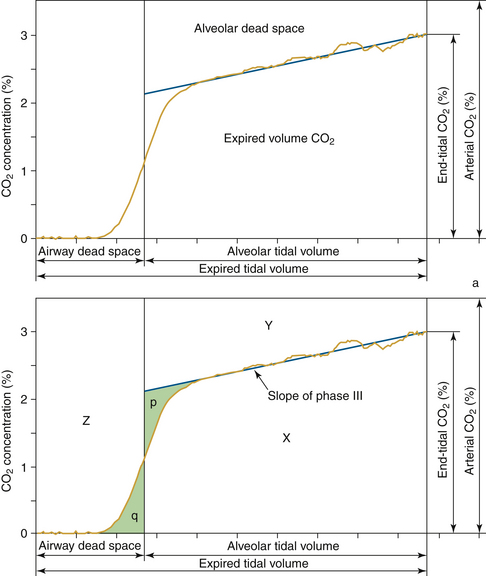
FIGURE 8-30 Top, Components of volumetric capnogram (carbon dioxide/volume plot). Bottom, Dead spaces shown graphically. Airway dead space, as illustrated by triangles p and q, are of equal area. Area X is the volume of carbon dioxide (CO2) in the expired breath, and areas Z and Y are from airway and alveolar dead space (Vdaw and Vdalv). Because it does not contribute to CO2 elimination, this is wasted ventilation. (Modified from Fletcher R: The single breath test for carbon dioxide [thesis]. Lund, Sweden, 1980; and Arnold JH, Thompson JE, Arnold LW: Single breath CO2 analysis: description and validation of a method. Crit Care Med 1996; 24[1]:96-102.)
This plot of carbon dioxide versus volume has been divided into three phases (Table 8-4).47 Phase I is the carbon dioxide–free volume, and phase II is the transitional region characterized by a rapidly increasing carbon dioxide concentration resulting from progressive emptying of the alveoli. Phase III, the alveolar plateau, typically has a positive slope that indicates a rising PCO2. With these three recognizable components of the volumetric capnogram, physiologically relevant measures can be determined, such as the volumes of each phase, the slopes of phase II and III, carbon dioxide elimination (VCO2), dead space tidal volume, and ratios of anatomic and physiologic dead space.
Under normal conditions, the lungs will excrete carbon dioxide at the same rate as the total body production rate, and no net change in body carbon dioxide stores will occur. Carbon dioxide elimination (VCO2), which often is incorrectly referred to as carbon dioxide production, is the net volume of carbon dioxide measured at the mouth or airway, calculated as the difference between expired and inspired carbon dioxide volumes normalized to 1 minute. VCO2 is computed by taking the integral of the product of the flow and carbon dioxide waveforms over the entire breath cycle and usually is reported at standard temperature and pressure dry (STPD) conditions. For breath-by-breath measurements, it is calculated as follows:

where FCO2(t) and V(t) are the sampled individual values of the carbon dioxide and flow waveforms summed over the entire breath, RR is the respiratory rate, and Δt is the sampling interval. When present, inspired carbon dioxide, if not accounted for, could result in an error in the calculation of VCO2 of several percent.52 Figure 8-31 illustrates the multiplication process with the plot of actual flow and carbon dioxide waveforms versus time of a mechanical breath delivered in a volume control mode. If PCO2 and volume are plotted instead, VCO2, the net volume of carbon dioxide eliminated, can be viewed as the area between the expiratory and inspiratory curves (Fig. 8-32). In anesthesia and intensive care, components such as filters, heat-moisture exchangers (HMEs), connecting tubes, elbows, airway adapters, and suction adapters are placed between the tracheal tube connector and Y-piece, causing partial rebreathing and thereby raising the level of the inspired carbon dioxide. Placement of the sampling site more proximally, such as at or near the endotracheal tube, will potentially allow the end-tidal carbon dioxide value to better reflect the alveolar concentration. If the inspiratory carbon dioxide volume is ignored, the overestimation of VCO2 will increase with decreases in tidal volume and/or increases in apparatus dead space.
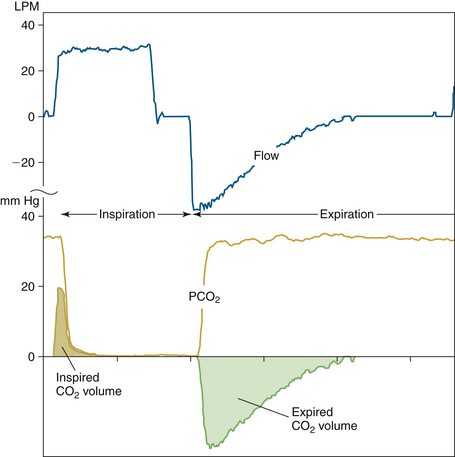
FIGURE 8-31 Plot of flow and CO2 waveforms for an individual ventilator-delivered breath with cross-product showing inspired and expired CO2 volumes. Because of apparatus dead space from the mainstream sensor, Y-piece, and other circuit components, a small volume of end-expiratory CO2 from the previous breath is rebreathed upon the initiation of inspiration. Note that in this patient, the expiratory CO2 waveform rises rapidly to a plateau, and the CO2 volume curve follows that of the expiratory portion of the flow waveform. VCO2 would then be the difference between the expiratory and inspiratory areas of the dot products. LPM, liters per minute. (Courtesy Philips Respironics, Wallingford, CT.)
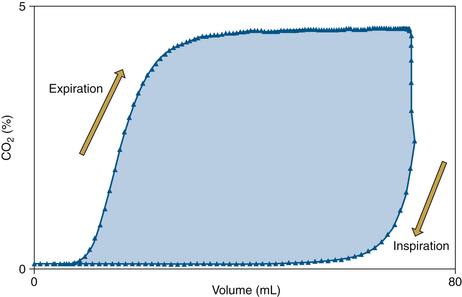
FIGURE 8-32 Plot of CO2 vs. volume illustrating both the expiratory and inspiratory portions (100 samples/sec) of the breath. Note that the inspiratory portion is usually negligible, and the net CO2 volume per breath is the difference between the area under the expired and inspired portions of this curve or, similarly, the area within the loop (shaded portion). (Courtesy Philips Respironics, Wallingford, CT.)
With today’s compact systems, measurements of flow and gas partial pressure, or concentration, are undertaken by flow and gas sensors that may or may not be located proximally and in the mainstream flow. Proximal flow measured at the patient’s airway can be substantially different from flow measured inside or at the ventilator because the delivered flow in the inspiratory limb of the breathing circuit and the exhaled flow from the expiratory limb typically are measured internally by two separate flow sensors. Gas concentration may be measured at or near the patient airway or distally, away from the patient’s airway, or a portion may be sampled and measured by a system located a distance from the sample site. The challenge is to combine the concentration and flow signals in such a way that the temporal relationship between these two variables is accurate. Also, given that frequency response differs among sensors, it is important that the time alignment and frequency response of the flow and carbon dioxide signal be suitably matched (Fig. 8-33).
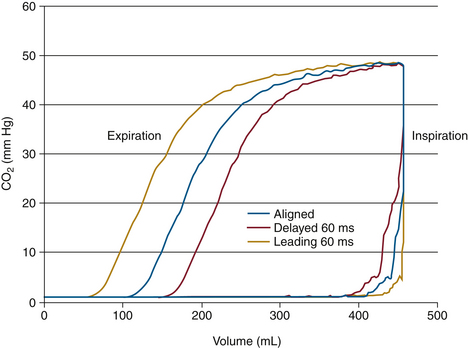
FIGURE 8-33 Volumetric capnogram showing both expiratory and inspiratory limbs and illustrating the effect of time misalignment. Note that if the CO2 waveform is delayed relative to the volume, the loop gets smaller on both ends; conversely, when the CO2 waveform is advanced relative to volume, the loop gets larger on both ends. (Courtesy Philips Respironics, Wallingford, CT.)
As noted, the location of gas sampling and flow measurement varies, which can affect the reliability and accuracy of volumetric gas measurements; this applies to both mainstream and sidestream devices. Placement of the gas sampling site more proximally will potentially allow PETCO2 to better reflect the alveolar concentration.
When leaks are present in the collecting system, or when conditions exist such that all the gas that is considered part of the alveolar ventilation volume cannot be measured, such as a pneumothorax with a leak or a tracheal tube cuff that leaks on exhalation, VCO2 may not accurately reflect the underlying physiology. Because of the complex interaction between tidal volume, physiologic dead space, and alveolar ventilation, the volume of carbon dioxide excreted by each breath is variable. The results of several breaths are often averaged in an attempt to decrease the effect of normal breath-to-breath changes in volume. Depending on how VCO2 is used (metabolic measurements vs. ventilator adjustments),53 different averaging intervals may be required that include a range such as 1 breath, 8 breaths, 1 minute, 3 minutes, and longer. Because the body retains a large amount of carbon dioxide relative to the rate at which carbon dioxide is produced, eliminated carbon dioxide can be different from metabolically produced carbon dioxide for a long time—up to 1 hour following a significant change in ventilation. However, changes in VCO2 can provide an instantaneous indication of the change in effective alveolar ventilation.52
The respiratory dead space, also known as “wasted” ventilation, is considered to be that volume of each breath that is inhaled but does not participate in gas exchange. Airway dead space, a functional surrogate of anatomic dead space, is calculated from the carbon dioxide volume curve by Fowler’s method,50 which requires that the slope of phase III be estimated. Physiologic dead space, the sum of the airway dead space and alveolar dead space, also can be calculated but requires an estimate of the alveolar PCO2. Arterial PCO2 usually serves as an estimate of alveolar PCO2 given the normally close relationship.54 The portion of the physiologic dead space that does not take part in gas exchange but is within the alveolar space is considered the alveolar dead space. It is considered to be that volume of each breath that is inhaled but does not reach functional terminal respiratory units. The term functional has important implications because alveolar ventilation depends on the output of carbon dioxide. A respiratory unit that is ventilated but not eliminating carbon dioxide—that is, it is deprived of its blood flow—is included in the alveolar dead space volume. An increase in the alveolar dead space also occurs when regions of the lung are ventilated but underperfused. Alveolar dead space is affected by any condition that results in a V/Q mismatch, including 1) hypovolemia, 2) pulmonary hypotension, 3) pulmonary embolus, 4) ventilation of nonvascular airspace, 5) obstruction of precapillary pulmonary vessels, 6) obstruction of the pulmonary circulation by external forces, and 7) overdistension of the alveoli.55
The ventilation-perfusion relationships of the lung are more accurately reflected in the slope of phase III by a volumetric capnogram, rather than a time-based capnogram, in which the gradient of the phase III slope usually is less obvious and can be misleading. This may be attributed to the small volume of expired gases, approximately the final 15% of expired volume, that often occupies half the time available for expiration. In addition, unlike the volumetric capnogram, the physiologic dead space and carbon dioxide elimination cannot be measured from a time-based capnogram.
In addition, other potentially useful parameters have been calculated from the combination of carbon dioxide and volume, including new surrogates for, and better estimates of, alveolar carbon dioxide, estimates of ventilatory efficiency,47 and measures of the nonsynchronous emptying of the alveoli with unequal V/Q ratios.56 Ventilatory efficiency, by definition, requires an arterial blood gas and provides a single value that summarizes the emptying of the lung relative to an ideal lung (see Table 8-4). Alveolar ejection volume has been suggested by Romero et al56 to serve as a measure of the nonsynchronous emptying of the alveoli with unequal V/Q ratios but is characterized as a misnomer by Fletcher and Drummond.57 This measure of emptying can be contrasted with physiologic dead space, which can be viewed as reflecting the emptying characteristics of different alveoli.55 The better understanding of respiratory physiology and related disease processes that volumetric capnography can help provide is only now beginning to be realized.
To properly calculate the various measurements associated with volumetric capnography, the basic measurements of carbon dioxide flow and airway pressure, to allow carbon dioxide to be referenced to in-circuit pressure, are required. It is preferable to measure all these parameters proximally, and a number of different approaches have been pursued over the past 30 years. Clinically acceptable results for carbon dioxide elimination may be obtained with many of the configurations under favorable conditions, if close attention is paid to the measurement, equipment setup, and interpretation of the displayed results. However, as more extremes of ventilator conditions are encountered, only the proximal mainstream flow and gas measurement offer a solution that can provide reliable results under the widely ranging humidity values, pressures, and temperatures seen in the clinical environment.
Commercial Equipment for Volumetric Capnography
Two companies, Philips Respironics and GE Healthcare, offer a family of integrated, disposable airway adapters optimized for different patient populations (Figs. 8-34 and 8-35) that offer volumetric capnography. The combined carbon dioxide flow airway adapters from Philips Respironics are available in neonatal, pediatric, and adult tracheal tube sizes. These interface to an on-airway capnometer and differential pressure–based spirometry measurement module, whereas the GE Datex-Ohmeda adapters use their D-Lite flow sensor, available in adult and pediatric sizes, which has three ports: one for sidestream carbon dioxide gas sampling and two for differential pressure flow measurement.
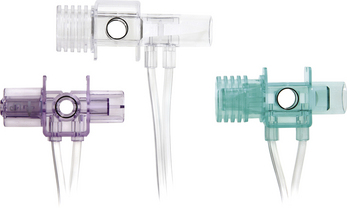
FIGURE 8-34 Adult, pediatric, and neonatal combined CO2 and fixed-orifice flow sensors. With the adult CO2 flow sensor (top), dead space is less critical; as such, the CO2 measurement cell and flow measurement portions are separate. With the combined neonatal (bottom left) and pediatric (bottom right) CO2 flow sensors, the measurement cell, with small restrictions located on each side of the cell chamber, serves a dual function by adding a differential pressure flow signal to CO2 measurement. (Courtesy Philips-Respironics, Wallingford, CT.)
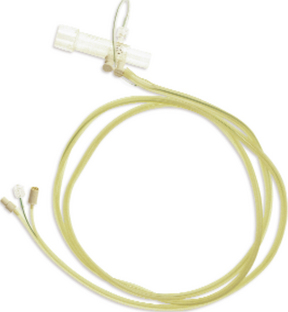
Applications of Volumetric Capnography
The measured concentration of carbon dioxide is the result of ventilation, perfusion, metabolism, and their interactions and is affected by changes in any of these components. Knowledge of the absolute values and changes in the time-based and volumetric capnograms can assist in the diagnosis of a variety of physiologic and pathologic phenomena, and these serve as a valuable tool during a wide variety of clinical situations.
In some of these clinical situations, accurate knowledge of the end-tidal value may be clinically sufficient, but in other situations, the time-based capnogram is required for proper clinical interpretation. In many clinical scenarios, the time-based capnogram is inadequate as a reliable diagnostic tool or indicator. However, volumetric capnography can serve as a more reliable clinical tool and can be an indicator for a number of clinical situations, including intubation and pulmonary embolism screening. However, the added clinical value of these monitoring modalites often remains unrecognized. The recognized and potential clinical value of both time-based and volumetric capnography are briefly reviewed in Table 8-5 for many of the recognized and developing indications and clinical uses.
TABLE 8-5
Comparison of Clinical Utility of Time-Based and Volumetric Capnography
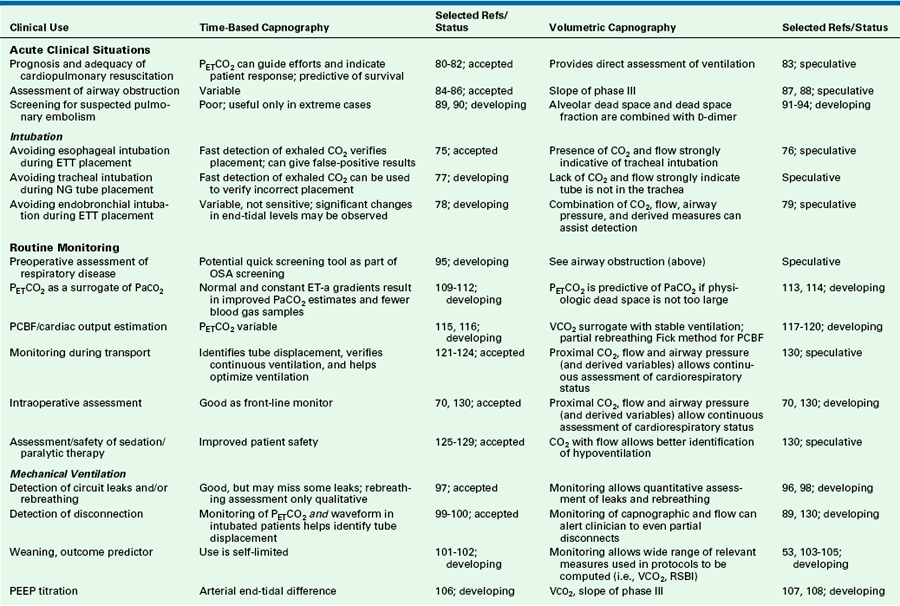
Accepted, widely accepted as standard practice; CO2, carbon dioxide; developing, developing application; ET-a, end-tidal to arterial; ETT, endotracheal tube; NG, nasogastric; OSA, obstructive sleep apnea; PaCO2, partial pressure of carbon dioxide in arterial blood; PCBF, pulmonary capillary blood flow; PEEP, positive end-expiratory pressure; PETCO2, end-tidal pressure of carbon dioxide; RSBI, rapid shallow breathing index; speculative, possible, but not confirmed by evidence; VCO2, rate of carbon dioxide.
Courtesy Philips Respironics, Wallingford, CT.
Nitrogen
Where available, measurement of nitrogen is useful in following preoxygenation (nitrogen washout), detecting venous air embolism, and detecting air leaks into the anesthesia breathing system. Fortunately, alternative means are now available to perform these functions.
Potent Inhaled Anesthetic Agents and Nitrous Oxide
Contemporary multigas analyzers measure the inspired and end-tidal concentrations of N2O as well as the potent inhaled anesthetic agents desflurane, enflurane, halothane, isoflurane, and sevoflurane in the presence of one another. Although no study has established the value of this monitoring modality, the possible applications make the potential benefits of its use obvious; it makes possible the monitoring of anesthetic uptake and washout and allows setting high and low alarm limits for agent concentrations.
By adding the minimum alveolar concentration (MAC) values for N2O and the potent agents to the analyzer software, and because MAC values are additive, once the composition of the gas mixture is known, the total MAC value of the inhaled anesthetic agents can be displayed. This is useful as an indication of anesthetic depth and a form of awareness monitor and has many potential applications.
Monitoring agent levels during uptake permits a safer and more intelligent use of the anesthesia vaporizer to reach target end-tidal concentrations in the patient. A high fresh gas flow and vaporizer concentration dial setting will ensure that the gas composition in the circuit changes rapidly, and the technique of “overpressure” can be used to speed anesthetic uptake. Once the desired end-tidal concentration has been attained, the vaporizer concentration dial setting can be decreased. When equilibrium has been reached—that is, when inspired and end-tidal agent concentrations are almost equal—the fresh gas flow can be decreased to maintain the equilibrium and conserve anesthetic agent. Monitoring of the anesthetic concentration during elimination provides information regarding the state of its washout. The washout rate can then be increased by increasing the fresh gas flow, hence increasing its removal into the waste gas scavenging system.
The anesthetic agent high-concentration alarm can be used to alert the anesthetist to potential anesthetic overdosing. Indeed, the applicable U.S. consensus standard for anesthetic agent monitors requires a high-concentration alarm; a low-concentration alarm is an option.58 The ASA Closed Claims Project includes several adverse outcomes as a result of anesthetic overdose and other reports of vaporizer malfunction that have led to higher than intended output concentrations.59,60 The low-concentration alarm can be used to help prevent awareness by maintaining an anesthetic agent concentration that exceeds MACawake, which is the average of the concentrations immediately above and below those that permit voluntary response to command.61 In general MACawake is approximately one third of MAC.62 The anesthetic agent low-concentration alarm also serves as a late sign that the vaporizer is becoming empty. An agent analyzer may also alert the anesthetist to an air leak into the breathing system, causing an unintended low-agent concentration.63
Assuming that the analyzer has been calibrated according to the manufacturer’s instructions, it can be used to check the calibration of a vaporizer as well as detect mixed agents in a vaporizer. Monitoring of N2O concentrations may be helpful when discontinuing or avoiding its administration; this may apply in patients who have closed air spaces that might expand with the use of N2O.
The continuous analysis of all of the respired gases by a multigas monitor also facilitates recording of the data by an automated anesthesia information management system. Many anesthesia caregivers record end-tidal concentrations of the gases administered. Monitoring of agent concentration, fresh gas flow, and time facilitates calculation of the consumption of the potent agents, both in liters of vapor and in milliliters of liquid agent. Attention to these data can be used to promote a more economical use of the more expensive anesthetics.
Gas Flow Sensor
Flow measurements in anesthesia are most commonly made with fixed-orifice or variable-orifice flowmeters. The Datex-Ohmeda D-Lite and Pedi-Lite flow sensors allow the qualitative and quantitative monitoring of respired gases using the density of the gas mixture for the computation of flow (see Chapter 9). Thus:

Measuring Anesthetic Concentrations in the Blood
In some clinical studies, it may be necessary to measure the partial pressure of anesthetics in the blood. Although end-tidal concentrations are commonly used as a surrogate, they may differ considerably from those in arterial blood; yet it is the arterial levels that reflect the partial pressure of anesthetic perfusing the brain.64,65 Measurement of blood concentrations of anesthetics usually is performed with a head space equilibration method with gas chromatography. Peyton and colleagues66 have reported successfully using a conventional IR gas analyzer (Datex-Ohmeda Capnomac Ultima) and double head space equilibration technique to measure the partial pressures of anesthetics in blood; accuracy and precision were comparable to that achieved by studies using gas chromatography.
Complications of Gas Monitoring
The complications associated with respiratory gas monitoring can be divided into two categories: pure equipment failure and use error.67 As with any mechanical or electronic piece of equipment, failure can occur, but overall such devices are reliable if properly maintained, which includes any recommended maintenance and calibration procedures. Use error is a much more common problem. The user must understand respiratory physiology as well as monitoring technology to recognize a spurious reading. In addition, the user may misinterpret data,67 which can lead to an inappropriate change in patient management. A simple example is that a low end-tidal carbon dioxide reading may cause the user to assume that the cause is hyperventilation and to decrease ventilation, when the problem is really a low cardiac output state.
In the event of total failure of the capnograph (electrical, mechanical, optical, etc.), a colorimetric carbon dioxide detector should always be kept as an immediate backup. Because these devices have an expiration date shown on the packaging, they should be checked routinely and replaced as necessary. A battery-powered portable capnometer is an alternative backup; if greater accuracy is needed, an arterial blood sample can be drawn for analysis in a blood gas analyzer.
Credentialing for the Use of Gas Monitoring
There are no specific credentialing requirements associated with the use of gas monitoring. However, all users should receive in-service training when a new monitor is introduced; in particular, clinicians should understand and use the alarm features. Unfortunately, this is often not the case.68 An educated user will no doubt derive more benefit than someone who has less understanding of the equipment. To this end, the Anesthesia Patient Safety Foundation (APSF) has sponsored a technology training initiative to promote critical training on new, sophisticated, or unfamiliar devices that can directly affect patient safety.69
Practice Parameters
In 1986, the ASA first approved standards for basic anesthesia monitoring. These have undergone periodic review and modification, the most recent being in October 2010.70 The following sections contain excerpts from Standard II of the ASA Standards for Basic Anesthetic Monitoring,70 and they pertain directly to the contents of this chapter.
Standard II
During all anesthetics, the patient’s oxygenation, ventilation, circulation, and temperature shall be continually evaluated.
Oxygenation
Methods
1. Inspired gas: During every administration of general anesthesia using an anesthesia machine, the concentration of oxygen in the patient breathing system shall be measured by an oxygen analyzer with a low oxygen concentration limit alarm in use.∗
The requirement to monitor the FiO2 in the breathing system is not only one of the ASA standards, it is also included in the health code regulations of some states, including those of New York71 and New Jersey. Note that the standard does not demand use of any specific technology to make the measurement, nor does it specify where in the inspiratory path oxygen must be monitored. Thus it is common to have a fuel cell located in the inspiratory unidirectional valve housing but downstream, on the patient side of the valve. It is also acceptable to sample gas from a connector by the patient’s airway at the Y-piece for analysis in a multigas analyzer.
Ventilation
Methods
1. Every patient receiving general anesthesia shall have the adequacy of ventilation continually evaluated. Qualitative clinical signs such as chest excursion, observation of the reservoir breathing bag, and auscultation of breath sounds are useful. Continual monitoring for the presence of expired carbon dioxide shall be performed unless invalidated by the nature of the patient, procedure, or equipment. Quantitative monitoring of the volume of expired gas is strongly encouraged.∗
2. When an endotracheal tube or laryngeal mask is inserted, its correct positioning must be verified by clinical assessment and by identification of carbon dioxide in the expired gas. Continual end-tidal carbon dioxide analysis, in use from the time of endotracheal tube/laryngeal mask placement until extubation/removal or initiating transfer to a postoperative care location, shall be performed using a quantitative method such as capnography, capnometry, or mass spectroscopy.∗ When capnography or capnometry is utilized, the end-tidal CO2 alarm shall be audible to the anesthesiologist or the anesthesia care team personnel.∗
3. When ventilation is controlled by a mechanical ventilator, there shall be in continuous use a device that is capable of detecting disconnection of components of the breathing system. The device must give an audible signal when its alarm threshold is exceeded.
4. During regional anesthesia (with no sedation) or local anesthesia (with no sedation), the adequacy of ventilation shall be evaluated by continual observation of qualitative clinical signs. During moderate or deep sedation, the adequacy of ventilation shall be evaluated by continual observation of qualitative clinical signs and monitoring for the presence of exhaled carbon dioxide unless precluded or invalidated by the nature of the patient, procedure, or equipment.
The ASA standards applicable to carbon dioxide monitoring have evolved considerably since they were first written. In particular, they have been revised to include use of the laryngeal mask airway, a supraglottic airway device, and use in regional anesthesia and monitored anesthesia care. Note also in item 3, the capnograph could be considered a disconnect detection device and as such must be used with an audible alarm activated. Catastrophes have been reported when state-of-the-art monitoring has been used with the alarms silenced.68
At time of this writing, no ASA standard requires monitoring of nitrous oxide and the potent inhaled anesthetics. However, as use of this monitoring becomes more widespread, it may become a de facto standard.72 The manufacturers of anesthesia workstations anticipate this trend; the most recent American Society for Testing and Materials (ASTM) voluntary consensus standard requires that the anesthesia workstation be provided with a device to monitor the concentration of anesthetic vapor in the inspired gas.73 The ASA standards for postanesthesia care, last updated in 2004,74 do not require monitoring of gas concentrations.
American Society of Anesthesiologists Standards for Postanesthesia Care
The patient’s condition shall be evaluated continually in the PACU.
1. The patient shall be observed and monitored by methods appropriate to the patient’s medical condition. Particular attention should be given to monitoring oxygenation, ventilation, circulation, level of consciousness, and temperature. During recovery from all anesthetics, a quantitative method of assessing oxygenation, such as pulse oximetry, shall be employed in the initial phase of recovery.∗ This is not intended for application during the recovery of the obstetrical patient, in whom regional anesthesia was used for labor and vaginal delivery.
In many postanesthesia care units, capnometry is used in patients who are tracheally intubated. If a patient requires reintubation, a means to confirm tracheal placement of the tube should be available, and its use must be documented.
References
1. . Datex-Ohmeda compact airway modules technical reference manual. Document no. 800 1009-5. Helsinki: Datex-Ohmeda Division, Instrumentarium; 2003.
2. Mushlin P.S., Mark J.B., Elliott W.R., et al. Inadvertent development of subatmospheric airway pressure during cardiopulmonary bypass. Anesthesiology. 1989;71:459–462.
3. Healzer J.M., Spiegelman W.G., Jaffe R.A. Internal gas analyzer leak resulting in an abnormal capnogram and incorrect calibration. Anesth Analg. 1995;81:202–203.
4. Pattinson K., Myers S., Gardner-Thorpe C. Problems with capnography at high altitude. Anaesthesia. 2004;59:69–72.
5. Ozanne G.M., Young W.G., Mazzei W.J., et al. Multipatient anesthetic mass spectrometry. Anesthesiology. 1981;55:62–67.
6. Gillbe C.E., Heneghan C.P., Branthwaite M.A. Respiratory mass spectrometry during general anesthesia. Br J Anaesth. 1981;53:103–109.
7. Scamman F.L., Fishbaugh J.K. Frequency response of long mass spectrometer sampling catheters. Anesthesiology. 1986;65:422–425.
8. Steinbrook R.A., Elliott W.R., Goldman D.B., Philip J.H. Linking mass spectrometers to provide continuing monitoring during system failure. J Clin Monit. 1991;7:271–273.
9. Schulte G.T., Block F.E. Evaluation of a single room dedicated mass spectrometer. J Clin Monit. 1991;8:179–181.
10. Severinghaus J.W., Larson C.P., Eger E.I. Correction factors for infrared carbon dioxide pressure broadening by nitrogen, nitrous oxide, and cyclopropane. Anesthesiology. 1961;22:429–432.
11. Nielsen J.R., Thornton V., Dale E.B. The absorption laws for gases in the infrared. Rev Mod Phys. 1944;16:307–324.
12. Kennell E.M., Andrews R.W., Wollman H. Correction factors for nitrous oxide in the infrared analysis of carbon dioxide. Anesthesiology. 1973;39:441–443.
13. Raemer D.B., Philip J.H. Monitoring anesthetic and respiratory gases. In: Blitt C.D., ed. Monitoring in anesthesia and critical care medicine. New York: Churchill-Livingstone; 1990:373–386.
14. PB 254 owners manual. Wilmington, Mass: Puritan-Bennett; 1985.
15. Guyton D., Gravenstein N. Infrared analysis of volatile anesthetics: impact of monitor agent setting, volatile mixtures and alcohol. J Clin Monit. 1990;6:203–206.
16. Nielsen J., Kann T., Moller J.T. Evaluation of three transportable multigas anesthetic monitors. J Clin Monit. 1994;9:91–98.
17. Møllgaard K. Acoustic gas measurement. Biomed Instrum Technol. 1989;23:495–497.
18. Berggren M., Hosseini N., Nilsson K., Stenqvist O. Improved response time with a new miniaturised main-stream multigas monitor. J Clin Monit Comput. 2009;23:355–361.
19. Colman Y., Krauss B. Microstream capnography technology: a new approach to an old problem. J Clin Monit Comput. 1999;15:403–409.
20. Casati A., Gallioli A., Passarretta P., Borgi B., Torri G. Accuracy of end-tidal carbon dioxide monitoring using the NPB 75 Microstream capnometer: a study in intubated, ventilated and spontaneously breathing nonintubated patients. Eur J Anaesthesiol. 2000;17:622–626.
21. Westenskow D.R., Smith K.W., Coleman D.L., et al. Clinical evaluation of a Raman scattering multiple gas analyzer for the operating room. Anesthesiology. 1989;70:350–355.
22. Lockwood G.G., Landon M.J., Chakrabarti M.K., Whitwam J.G. The Ohmeda Rascal II: a new gas analyzer for anaesthetic use. Anaesthesia. 1994;49:44–53.
23. Severinghaus J.W. Water vapor calibration errors in some capnometers: respiratory conventions misunderstood by manufacturers? Anesthesiology. 1989;70:996–998.
24. Sum Ping S.T., Mehta M.P. Symreng T: Accuracy of the FEF CO2 detector in the assessment of endotracheal tube placement. Anesth Analg. 1992;74:415–419.
25. Srinivasa V., Kodali B.S. Caution when using colorimetry to confirm endotracheal intubation. Anesth Analg. 2007;104:738.
26. Brackney S.M. Caution when using colorimetry to confirm endotracheal intubation. Anesth Analg. 2007;104:739.
27. Hendrickx J.F.A., Van Zundert A.A.J., De Wolf A.M. Influence of the reference gas of paramagnetic oxygen analyzers on nitrogen concentrations during closed-circuit anesthesia. J Clin Monit. 1998;14:381–384.
28. Fontijn A., Sabadell A.J., Ronco R.J. Homogeneous chemiluminescent measurement of nitric oxide with ozone. Anal Chem. 1970;42:575–579.
29. Holland R. Wrong gas disaster in Hong Kong. Anesthesia Patient Safety Foundation Newsletter. 1989;4:25–36.
30. Machlin H.A., Myles P.S., Berry C.B., et al. End-tidal oxygen measurement compared with patient factor assessment for determining preoxygenation time. Anaesth Intensive Care. 1993;21:409–413.
31. Tanoubi I., Drolet P., Donati F. Optimizing preoxygenation in adults. Can J Anaesth. 2009;56:449–466.
32. Gadhinglaikar S.V., Sreedhar R., Unnikrishnan K.P. Oxygraphy: an unexplored perioperative monitoring modality. J Clin Monit Comput. 2009;23:131–135.
33. Berry C.B., Myles P.S. Preoxygenation in healthy volunteers: a graph of oxygen “washin” using end-tidal oxygraphy. Br J Anaesth. 1994;74:116–118.
34. Barnard J.P., Sleigh J.W. Breath-by-breath analysis of oxygen uptake using the Datex Ultima. Br J Anaesth. 1995;74:155–158.
35. Takala J., Meriläinen P. Handbook of indirect calorimetry and gas exchange. Helsinki: Datex-Ohmeda; 1991. p 30
36. Stuart-Andrews C.R., Peyton P., Robinson G.J., et al. In vivo validation of the M-COVX metabolic monitor in patients under anaesthesia. Anaesth Intensive Care. 2007;35(3):398–405.
37. Takala J. Appliguide: clinical application guide of gas exchange and indirect calorimetry. Helsinki: Datex-Ohmeda; 2000.
38. Gadhinglajkar S.V., Sreedhar R., Unnikrishnan K.P. Oxygraphy: an unexplored perioperative monitoring modality. J Clin Monit Comput. 2009;23(3):131–135.
39. Orr J.A., Brewer L.M. Clinical evaluation of an on-airway system to measure oxygen uptake. Anesthesiology. 2008;109:A281.
40. Surgery mix-up causes 2 deaths. New Haven Register. January 20, 2002.
41. Birmingham P.K., Cheney F.W., Ward R.J. Esophageal intubation: a review of detection techniques. Anesth Analg. 1986;65:886–891.
42. Gravenstein J.S., Jaffe M.B., Paulus D.A. Capnography: clinical aspects. New York: Cambridge University Press; 2004.
43. Smalhout B., Kalenda Z. An atlas of capnography, ed 2. Utrecht, The Netherlands: Kerkebosche Zeist; 1981.
44. Nunn J.F. Applied respiratory physiology. Boston. Butterworths; 1977. p 226
45. Sanders A.B., Kern K.B., Otto C.W., Milander M.M., Ewy G.A. End-tidal CO2 monitoring during CPR: a prognostic indicator for survival. JAMA. 1989;262:1347–1351.
46. Wayne M.E., Levine R.L., Miller C.C. Use of end-tidal CO2 to predict outcome in pre-hospital cardiac arrest. Ann Emerg Med. 1995;25:762–767.
47. Fletcher R. The single breath test for carbon dioxide [thesis]. Lund, Sweden. 1980.
48. Arnold J.H., Thompson J.E., Arnold L.W. Single breath CO2 analysis: description and validation of a method. Crit Care Med. 1996;24(1):96–102.
49. Breen P.H., Bradley P.J. Carbon dioxide spirogram (but not capnogram) detects leaking inspiratory valve in a circle circuit. Anesth Analg. 1997;85(6):1372–1376.
50. Fowler W.S. Lung function studies. II. The respiratory dead space. Am J Physiol. 1948;154:405–416.
51. Ream R.S., Schreiner M.S., Neff J.D., et al. Volumetric capnography in children: influence of growth on the alveolar plateau slope. Anesthesiology. 1995;82(1):64–73.
52. Breen P.H., Serina E.R., Barker S.J. Measurement of pulmonary CO2 elimination must exclude inspired CO2 measured at the capnometer sampling site. J Clin Monit. 1996;12(3):231–236.
53. Taskar V., John J., Larsson A., Wetterberg T., Jonson B. Dynamics of carbon dioxide elimination following ventilator resetting. Chest. 1995;108(1):196–202.
54. Enghoff H. Volumen inefficax: Bemerkungen zur Frage des schädlichen Raumes. Uppsala LäkFör Förh. 1938;44:191–218.
55. Lumb A.B. Nunn’s applied respiratory physiology, ed 7. London: Churchill Livingstone; 2010.
56. Romero P.V., Lucangelo U., Lopez Aguilar J., Fernandez R., Blanch L. Physiologically based indices of volumetric capnography in patients receiving mechanical ventilation. Eur Respir J. 1997;10(6):1309–1315.
57. Fletcher R., Drummond G.B. Alveolar ejection volume: a misnomer? Eur Respir J. 2000;15(1):232–233.
58. American Society for Testing and Materials. Medical electrical equipment: particular requirements for the basic safety and essential performances of respiratory gas monitors. West Conshohocken, PA: ASTM/ISO 21647.; 2005.
59. Caplan R.A., Vistica M.F., Posner K.L., Cheney F.W. Adverse anesthetic outcomes arising from gas delivery equipment: a closed claims analysis. Anesthesiology. 1997;87:741–748.
60. Geffroy J.C., Gentili M.E., Le Pollès R., Triclot P. Massive inhalation of desflurane due to vaporizer dysfunction. Anesthesiology. 2005;103:1096–1098.
61. Stoelting R.K., Longnecker D.E., Eger E.I., 2nd. Minimal alveolar concentrations on awakening from methoxyflurane, halothane, ether and fluroxene in man: MAC awake. Anesthesiology. 1970;33:5–9.
62. Eger E.I., II., Weisskopf R.B., Eisenkraft J.B. The pharmacology of inhaled anesthetics. San Antonio: Dannemiller Memorial Educational Foundation; 2002. p 27
63. Sandberg W.S., Kaiser S. Novel breathing system architecture: new consequences of old problems. Anesthesiology. 2004;100:755–756.
64. Landon M.J., Matson A.M., Royston B.D., et al. Components of the inspiratory-arterial isoflurane partial pressure difference. Br J Anaesth. 1993;70:605–611.
65. Frei F.J., Zbinden A.M., Thomson D.A., Rieder H.U. Is the end-tidal partial pressure of isoflurane a good predictor of its arterial partial pressure? Br J Anaesth. 1991;66:331–339.
66. Peyton P.J., Chong M., Stuart-Andrews C., et al. Measurement of anesthetics in blood using a conventional infrared clinical gas analyzer. Anesth Analg. 2007;105:680–687.
67. Barker S.J. Too much technology? Anesth Analg. 2003;97:938–939.
68. $16 million settlement. Monitoring devices turned off/down; patient suffers irreversible brain damage. Anesthesia Malpractice Prevention (Newsletter). 1997;2:3.
69. Olympio M.A. Formal training and assessment before using advanced medical devices in the OR. Anesthesia Patient Safety Foundation Newsletter. 2007;22:63–65.
70. American Society of Anesthesiologists. Standards for basic anesthetic monitoring. Approved by the ASA House of Delegates on October 21, 1986; last amended October 20, 2010 with an effective date of July 1, 2011. Available at www.asahq.org.
71. NY State Laws and regulations, Section 405.13. Anesthesia services (b)(2)(iii)(d).
72. Eichhorn J.H. Pulse oximetry as a standard of practice in anesthesia. Anesthesiology. 1993;78:423–425.
73. American Society for Testing and Materials. Standard Specification for Particular Requirements for Anesthesia Workstations and their Components ASTM F1850-2005. West Conshohocken, PA: ASTM; 2005.
74. ASA Standards for Postanesthesia Care. approved by the ASA House of Delegates on October 27, 2004, and last amended on October 21, 2009. Available at www.asahq.org.
75. Knapp S., Kofler J., Stoiser B., Thalhammer F., Burgmann H., Posch M., Hofbauer R., Stanzel M., Frass M. The assessment of four different methods to verify tracheal tube placement in the critical care setting. Anesth Analg. 1999;88(4):766–770.
76. Cheifetz I.M., Myers T.R. Respiratory therapies in the critical care setting. Should every mechanically ventilated patient be monitored with capnography from intubation to extubation? Respir Care. 2007 Apr;52(4):423–438.
77. Chau J.P., Lo S.H., Thompson D.R., Fernandez R., Griffiths R. Use of end-tidal carbon dioxide detection to determine correct placement of nasogastric tube: a meta-analysis. Int J Nurs Stud. 2011;48(4):513–521.
78. Gandhi S.K., Munshi C.A., Coon R., Bardeen-Henschel A. Capnography for detection of endobronchial migration of an endotracheal tube. J Clin Monit. 1991;7(1):35–38.
79. Mahajan A., Wald S.H., Schroeder R., Turner J. Detection of Endobronchial Intubation in Infants and Children Using Spirometry. Anesthesiology. 2002;97(3):A1268.
80. Falk J.L., Rackow E.C., Weil M.H. End-tidal carbon dioxide concentration during cardiopulmonary resuscitation. N Engl J Med. 1988;318(10):607–611.
81. Levine R.L., Wayne M.A., Miller C.C. End-tidal carbon dioxide and outcome of out-of-hospital cardiac Aarrest. New Eng J Med. 1997;337(5):301–306.
82. White R.D., Goodman B.W., Svoboda M.A. Neurologic recovery following prolonged out-of-hospital cardiac arrest with resuscitation guided by continuous capnography. Mayo Clin Proc. 2011;86(6):544–548.
83. Terndrup T.E., Rhee J. Available ventilation monitoring methods during pre-hospital cardiopulmonary resuscitation. Resuscitation. 2006;71(1):10–18.
84. You B., Peslin R., Duvivier C., Vu V.D., Grilliat J.P. Expiratory capnography in asthma: evaluation of various shape indices. Eur Respir J. 1994;7(2):318–323.
85. Yaron M., Padyk P., Hutsinpiller M., Cairns C.B. Utility of the expiratory capnogram in the assessment of bronchospasm. Ann Emerg Med. 1996;28(4):403–407.
86. Nik Hisamuddin N.A., Rashidi A., Chew K.S., Kamaruddin J., Idzwan Z., Teo A.H. Correlations between capnographic waveforms and peak flow meter measurement in emergency department management of asthma. Int J Emerg Med. 2009 Feb 24;2(2):83–89.
87. Almeida C.C., Almeida-Júnior A.A., Ribeiro M.A., Nolasco-Silva M.T., Ribeiro J.D. Volumetric capnography to detect ventilation inhomogeneity in children and adolescents with controlled persistent asthma. J Pediatr (Rio J). 2011 Mar-Apr;87(2):163–168.
88. Romero P.V., Rodriguez B., de Oliveira D., Blanch L., Manresa F. Volumetric capnography and chronic obstructive pulmonary disease staging. Int J Chron Obstruct Pulmon Dis. 2007;2(3):381–391.
89. Thys F., Elamly A., Marion E., Roeseler J., Janssens P., El Gariani A., Meert P., Verschuren F., Reynaert M. PaCO2/ETCO2 gradient: early indicator of thrombolysis efficacy in a massive pulmonary embolism. Resuscitation. 2001;49(1):105–108.
90. Courtney D.M., Watts J.A., Kline J.A. Use of Capnometry to Distinguish Cardiac Arrest Secondary to Massive Pulmonary Embolism from Primary Cardiac Arrest. Acad Emerg Med. 2001;8(5):433.
91. Anderson J.T., Owings J.T., Goodnight J.E. Bedside noninvasive detection of acute pulmonary embolism in critically ill surgical patients. Arch Surg. 1999;134(8):869–875.
92. Kline J.A., Israel E.G., Michelson E.A., O’Neil B.J., Plewa M.C., Portelli D.C. Diagnostic accuracy of a bedside D-dimer assay and alveolar dead-space measurement for rapid exclusion of pulmonary embolism: a multicenter study. JAMA. 2001;285(6):761–768.
93. Moreira M.M., Terzi R.G., Cortellazzi L., Falcão A.L., Moreno H., Jr., Martins L.C., Coelho O.R. Volumetric capnography: in the diagnostic work-up of chronic thromboembolic disease. Vasc Health Risk Manag. 2010;25(6):317–319.
94. Verschuren F., Heinonen E., Clause D., Roeseler J., Thys F., Meert P., Marion E., El Gariani A., Col J., Reynaert M., Liistro G. Volumetric capnography as a bedside monitoring of thrombolysis in major pulmonary embolism. Intensive Care Med. 2004;30(11):2129–2132.
95. Block F.E., Jr., Reynolds K.M., Kajaste T., Nourijelyani K. Pre-operative oximetry and capnometry: potential respiratory screening tools. Int J Clin Monit Comput. 1996;13(3):153–156.
96. Blanch L., Romero P.V., Lucangelo U. Volumetric capnography in the mechanically ventilated patient. Minerva Anestesiol. 2006 Jun;72(6):577–585.
97. Healzer J.M., Spiegelman W.G., Jaffe R.A. Internal gas analyzer leak resulting in an abnormal capnogram and incorrect calibration. Anesth Analg. 1995;81(1):202–203.
98. Breen P.H., Bradley P.J. Carbon dioxide spirogram (but not capnogram) detects leaking inspiratory valve in a circle circuit. Anesth Analg. 1997;85(6):1372–1376.
99. Kennedy R.R., French R.A. A breathing circuit disconnection detected by anesthetic agent monitoring. Can J Anesth. 2001;48(9):847–849.
100. Tripathi M., Tripathi M. A partial disconnection at the main stream CO2 transducer mimics “curare-cleft” capnograph. Anesthesiology. 1998;88(4):1117–1119.
101. Morley T.F., Giaimo J., Maroszan E., Bermingham J., Gordon R., Griesback R., Zappasodi S.J., Giudice J.C. Use of capnography for assessment of the adequacy of alveolar ventilation during weaning from mechanical ventilation. Am Rev Respir Dis. 1993;148(2):339–344.
102. Saura P., Blanch L., Lucangelo U., Fernandez R., Mestre J., Artigas A. Use of capnography to detect hypercapnic episodes during weaning from mechanical ventilation. Intensive Care Med. 1996;22(5):374–381.
103. Boynton J.H., O’Keefe G. The use of VCO2 in predicting liberation from mechanical ventilation. Resp Care. 1999;44(10):1243.
104. Hubble C.L., Gentile M.A., Tripp D.S., Craig D., Meliones J.N., Cheifetz I.M. Deadspace to tidal volume ratio predicts successful extubation in infants and children. Crit Care Med. 2000;28(6):2034–2040.
105. Nuckton T.J., Alonso J.A., Kallet R.H., Daniel B.M., Pittet J.F., Eisner M.D., Matthay M.A. Pulmonary dead-space fraction as a risk factor for death in the acute respiratory distress syndrome. N Engl J Med. 2002;346(17):1281–1286. 25
106. Murray I.P., Modell J.H., Gallagher T.J., Banner M.J. Titration of PEEP by the arterial minus end-tidal carbon dioxide gradient. Chest. 1984;85(1):100–104.
107. Böhm S.H., Maisch S., von Sandersleben A., Thamm O., Passoni I., Martinez Arca J., Tusman G. The effects of lung recruitment on the Phase III slope of volumetric capnography in morbidly obese patients. Anesth Analg. 2009;109(1):151–159.
108. Tusman G., Bohm S.H., Suarez-Sipmann F., Scandurra A., Hedenstierna G. Lung recruitment and positive end-expiratory pressure have different effects on CO2 elimination in healthy and sick lungs. Anesth Analg. 2010;111(4):968–977.
109. Chan K.L., Chan M.T., Gin T. Mainstream vs. sidestream capnometry for prediction of arterial carbon dioxide tension during supine craniotomy. Anaesthesia. 2003;58(2):149–155.
110. King J.C., Boitano L.C., Benditt J.O. End-Tidal Carbon Dioxide (ETCO2) Accurately Predicts Arterial Carbon Dioxide (PaCO2) in Patients with Neuromuscular Disease. Am J Respir Crit Care Med. 2003;167(7):A424.
111. Barton C.W., Wang E.S. Correlation of end-tidal CO2 measurements to arterial PaCO2 in nonintubated patients. Ann Emerg Med. 1994;23(3):560–563.
112. McDonald M.J., Montgomery V.L., Cerrito P.B., Parrish C.J., Boland K.A., Sullivan J.E. Comparison of end-tidal CO2 and PaCO2 in children receiving mechanical ventilation. Pediatr Crit Care Med. 2002;3(3):244–249.
113. Banner M.J. Partial pressure of end-tidal CO2 in the ICU: Reevaluating old beliefs. Anesthesiology. 2000. SCCA:B8
114. McSwain S.D., Hamel D.S., Smith P.B., Gentile M.A., Srinivasan S., Meliones J.N., Cheifetz I.M. End-tidal and arterial carbon dioxide measurements correlate across all levels of physiologic dead space. Respir Care. 2010;55(3):288–293.
115. Ornato J.P., Garnett A.R., Glauser F.L. Relationship between cardiac output and the end-tidal carbon dioxide tension. Ann Emerg Med. 1990;19(10):1104–1106.
116. Saleh H.Z., Pullan D.M. Monitoring cardiac output trends with end-tidal carbon dioxide pressures in off-pump coronary bypass. Ann Thorac Surg. 2011;91(5):e81–e82.
117. Gedeon A., Forslund L., Hedenstierna G., Romano E. A new method for noninvasive bedside determination of pulmonary blood flow. Med Biol Eng Comput. 1980;18(4):411–418.
118. Capek J.M., Roy R.J. Noninvasive measurement of cardiac output using partial CO2 rebreathing. IEEE Trans Biomed Eng. 1988;35(9):653–661.
119. Jaffe M.B. Partial CO2 Rebreathing Cardiac Output – Operating Principles of the NICO® System. J Clin Monit. 1999;15(6):387–401.
120. Young B.P., Low L.L. Noninvasive monitoring cardiac output using partial CO2 rebreathing. Crit Care Clin. 2010;26(2):383–392.
121. Ruckoldt H., Marx G., Leuwer M., Panning B., Piepenbrock S. Pulse oximetry and capnography in intensive care transportation: combined use reduces transportation risks. Anasthesiol Intensivmed Notfallmed Schmerzther. 1998;33(1):32–36.
122. Bacon C.L., Corriere C., Lavery R.F., Livingston D.H. The use of capnography in the air medical environment. Air Med J. 2001;20(5):27–29.
123. Tobias J.D., Lynch A., Garrett J. Alterations of end-tidal carbon dioxide during the intrahospital transport of children. Pediatr Emerg Care. 1996;12:249–251.
124. Langhan M.L., Ching K., Northrup V., Santucci K., Chen L. A Randomized Controlled Trial of Capnography in the Correction of Simulated Endotracheal Tube Dislodgement. Acad Emerg Med. 2011;18(6):590–596.
125. McQuillen K.K., Steele D.W. Capnography during sedation/analgesia in the pediatric emergency department. Pediatr Emerg Care. 2000;16(6):401–404.
126. Burton J.H., Harrah J.D., Germann C.A., Dillon D.C. Does end-tidal carbon dioxide monitoring detect respiratory events prior to current sedation monitoring practices? Acad Emerg Med. 2006;13:500–504.
127. McCarter T., Shaik Z., Scarfo K., Thompson L.J. Capnography monitoring enhances safety of postoperative patient-controlled analgesia, American Health & Drug Benefits. June 2008. 28–35
128. Deitch K., Miner J., Chudnofsky C.R., Dominici P., Latta D. Does end tidal CO2 monitoring during emergency department procedural sedation and analgesia with propofol decrease the incidence of hypoxic events? A randomized, controlled trial. Ann Emerg Med. 2010;55(3):258–264.
129. Langhan M.L., Chen L., Marshall C., Santucci K.A. Detection of hypoventilation by capnography and its association with hypoxia in children undergoing sedation with ketamine. Pediatr Emerg Care. 2011;27(5):394–397.
130. Gravenstein J.S., Jaffe M.B., Gravenstein N., Paulus D.A., eds. Capnography. ed 2. Cambridge, UK: Cambridge University. Press; 2011:488.
∗Parts of this chapter are reproduced by permission from Eisenkraft JB: Respiratory gas monitoring. In Reich DL et al, editors: Monitoring in Anesthesia and Perioperative Care, New York, 2011, Cambridge University Press.
∗Under extenuating circumstances, the responsible anesthesiologist may waive the requirements marked with an asterisk; it is recommended that when this is done, it should be so stated, including the reasons, in a note in the patient’s medical record.