Monitoring Ventilation
Automated Determination of Respiratory Rate
Thoracic Impedance and Inductance
Breathing Circuit Low-Pressure Alarms
Sensor Position Within the Breathing Circuit
Airway Versus Alveolar Pressures
Overview
Until the early twentieth century, animal life was defined by the presence of spontaneous ventilation. Absence of breathing implied death or impending death, although experiments with resuscitation and artificial ventilation had occurred since the eighteenth century.1 The defining characteristics of spontaneous ventilation, depth and frequency, were early indicators of anesthetic action, with profound depression of respiration indicating the deepest plane of ether narcosis.2
The most fundamental measure of ventilation is frequency, measured in units of inverse time, usually min−1. Although physiology pundits will remind us that respiration is a cellular phenomenon, the term respiratory rate is commonly accepted to denote the frequency of ventilation, either spontaneous or controlled.
Respiratory Rate
Respiratory rate is still commonly assessed by direct observation, either by counting the spontaneous breaths observed in a full minute or by doubling the count in 30 seconds. In the nearly well patient, the frequency at rest is relatively predictable (~14 to 18 min−1),3 whereas in the critically ill or perioperative patient, it is more variable. In reference to hospital patients in the 1950s, one commentator noted that almost all patients had recorded “respiratory rates” of between 18 and 22 min−1, irrespective of their actual value; this led him to conclude that the routine recording of respiration was not only useless but wasted millions of hours of health care time annually.4 On the other hand, a more astute observer commented that respiratory rate “is a sensitive clinical parameter in a multitude of pulmonary diseases, especially in the critical care setting.”5
Although tachypnea has many underlying causes, one common perioperative cause is pain. It is unusual for severe, acute pain not to be accompanied by hyperventilation as a part of a clinical picture of systemic stimulus and sympathetic nervous system activation. Conversely, patients who have recently received opioid analgesics may exhibit bradypnea as one sign of a relative overdose. Thus the frequency of spontaneous ventilation may be a crude but valuable tool in preserving the comfort and safety of perioperative patients in that it may express the balance between acute pain and analgesic effects.6 In a spontaneously breathing patient, the titration of opioid analgesics to effect is much more difficult without access to this simple, real-time variable.
Automated Determination of Respiratory Rate
Determination of respiratory rate by direct observation is difficult because of interobserver variability, length of time needed for accurate readings (up to 1 minute), and the confounding effects of upper airway obstruction that produce chest wall motion and apparent breaths in the absence of gas exchange. The reliable automation of this data gathering is valuable, not only to perioperative caregivers—especially those who perform regional or sedation techniques—but also to nonanesthesiology personnel responsible for patient sedation in more remote or ambulatory locations.
Instrumentation to measure respiration may be direct, as in airflow sensors—pinwheels, gas sampling, or thermocouples—or indirect, imputing air flow from changes in thoracic dimension or breath sounds. Indirect measurements of chest volume may be via strain gauges, impedance measurements, or electrocardiograph (ECG) analysis. In a fully equipped operating suite, the most convenient method of measurement is with a capnograph. In the tracheally intubated, anesthetized patient and in the awake or sedated patient, exhaled gas flow may be sampled using a number of devices. In the case of the spontaneously breathing patient, a nasal cannula may be configured to both sample exhaled gas and simultaneously deliver supplemental oxygen.7,8
Thoracic Impedance and Inductance
An early attempt to automate respiratory rate measurement in the 1960s was based on the theory that the electrical properties of the thorax changed during the respiratory cycle. The resistance to the flow of alternating current, known as impedance, was found to change with the inflation and deflation of the lungs; it is increased with inhalation. Because of this, this impedance value could be continuously measured; when it exceeded a set threshold, the occurrence of a breath was recorded by a monitor. Efforts were made to correlate changes in impedance with tidal volume, but this was less successful in awake patients and in those with respiratory disease.9,10 Significantly, this technique does not measure actual air entry but only measures the changes in the shape of the thoracic cage. Accordingly, it could be fooled by respiratory effort in the presence of upper airway obstruction.11 In anesthetized and ventilated surgical patients, however, the technique was much more valuable, producing accurate respiratory rate measurements and high correlation of tidal volumes (r = 0.89) with Wright’s respirometer.12 In addition, the technique was somewhat sensitive to both airway occlusion and circuit disconnects.
Work has been done to determine the optimal placement of electrode pairs for maximum sensitivity. As expected, maximal separation of electrode pairs provides the most sensitive signal.13 Interference between respiratory monitors that use thoracic impedance and implanted respiratory rate–sensitive pacemakers has been reported, producing unwanted heart rate changes. The only solution was to disable the respiratory rate monitoring function in the physiologic monitor.14
Inductive plethysmography is superficially similar to impedance plethysmography in that electrically active sensors detect chest wall movement. However, the inductive technique uses direct-current sensors in the form of coils of wire around the chest and/or abdomen. The changes in self-inductance (stretch) of these sensors are electrically transmitted and analyzed. These signals can reflect respiratory rate and, after calibration, tidal volume.15 In a study of infants at risk for apnea, Brouillette and colleagues16 found that inductive plethysmography was superior to impedance-based measurement in that it recorded fewer cardiac artifacts and was better able to discern upper airway obstruction.
Electrocardiograph-Based Respiratory Monitoring
After the use of continuous ECG monitoring became widespread, attempts were made to use ECG-derived data to record respiratory rate. The ECG may be used through the analysis of changes in both the amplitude of the ECG signal and the changes in the axis of the QRS complex. Amplitude changes in the ECG are caused by the change in overall electrical resistance because of the increased proportion of air, rather than tissue, within the chest cavity during inspiration. This is reflected in a decrease in ECG signal voltage, and thus QRS wave size, that is amenable to analysis.
Inflation of the lungs also produces a change in the axis of the heart, as reflected in the multilead ECG. Using two limb leads, measurements are made of the area under a normal QRS complex. By using these areas as amplitudes of known direction, a vector can be derived as the sum of the two values. These measurements are routinely made by most arrhythmia detection software in current use.17
Other Techniques
Acoustic techniques actually “listen” for the sound of airflow at the face, pretracheal neck, or chest. One method uses the sound of air impinging on open-ended tubes positioned near the nostrils and mouth.18 Although lightweight and immune to upper airway obstruction artifact, this method may suffer from interference from ambient noise. Also, it is a pure respiratory frequency monitor, without any other measure of ventilatory adequacy. A variation of this approach uses a pyroelectric polymer mounted inside a face mask that senses the temperature increase from exhaled air. This signal is electrically amplified and displayed. Inexpensive and relatively simple, it can be incorporated into the construction of a face mask or nasal cannula.19
A sophisticated, noninvasive sensor was described by Zhu and colleagues in 2006.20 A head pillow containing fluid-filled tubes is connected to two sensitive pressure transducers. The pressure signal is processed with a derivation of an algorithm known as wavelet transformation and is filtered to produce both pulse and respiratory signals. The technique is, as expected, less effective in the presence of motion artifact and poor head positioning. However, in 13 healthy subjects, both the sensitivity and the positive predictive value of the sensor were above 95% for respiration, compared with simultaneous nasal thermistor recordings.20 The data were even more favorable with respect to detection of pulse rate. In combination with oximetry, this technique will likely prove valuable both in ambulatory monitoring and in the diagnosis of sleep disorders.
The Rainbow Acoustic Monitoring system (Masimo, Irvine, CA) noninvasively and continuously measures respiration rate using an innovative adhesive sensor with an integrated acoustic transducer that is easily and comfortably applied to the patient’s neck. Using acoustic analysis, the respiratory signal is separated and processed to continuously display respiration rate.21 Box 9-1 summarizes the various methods for automated detection and recording of respiratory rate.
Airway Pressures
Pressure is defined as the force per unit area exerted on a surface by an external substance, usually a gas or liquid in medical applications. A molecule of a gas can be envisioned as confined within a cube. This molecule of gas transfers its momentum to a vessel wall during a collision equal to 2 × mv, where m is mass and v is mean velocity. After bouncing off the opposite wall, the molecule then hits the first wall again after a time equal to 2 × d/v, where d is the distance between walls, exerting a force of mv2/d. With N molecules, one third will hit each pair of sides of the box, yielding a force (F) on each wall:

Because pressure is force exerted over an area (d2), total pressure (P) is:

or, because d3 is volume (V), then:

This gives the useful fact that, at constant temperature, pressure is inversely proportional to volume (Boyle’s law) and directly proportional to the square of molecular velocity.22
Determination of atmospheric pressure was the first practical application of pressure gauges. Initially, the force exerted by the weight of the atmosphere was balanced against a column of fluid, either water or mercury. This is an example of an absolute pressure gauge, indicating approximately 30 inches (or 760 mm) of mercury, 101 kPa, or 1.01 bars of pressure at sea level. In contrast, relative or “gauge” pressure indicators read zero at atmospheric pressure and indicate only additional pressure sensed.
Sensors
The history of airway pressure measurement parallels the development of sensitive gauges and meters for atmospheric pressure. Beginning with fluid columns, devices for the estimation of gas pressure rapidly evolved into mechanical linkages translating physical motions—of an evacuated capsule, for example—into displacements of an indicating needle. The Bourdon gauge (Fig. 9-1) uses this principle of change in pressure, translated into motion of an evacuated compartment or tube, and is still a robust and inexpensive mechanism. This mechanical gauge, and others similar to it, require no power, are always on, and have high reliability. Although they do not communicate with data systems or alarms, they are useful backups for modern electronic systems.
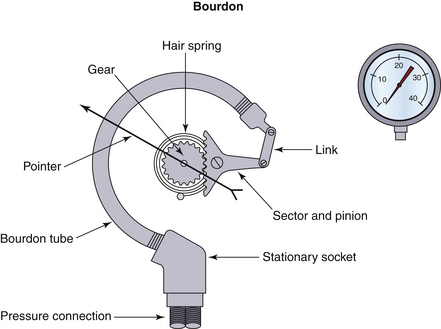
FIGURE 9-1 The Bourdon gauge, representing a mechanical gauge that requires no power. The Bourdon tube is an evacuated compartment.
Newer electronic sensors use the principle of piezoelectricity, the property of certain crystals, usually quartz, to produce a small electric current when compressed. This output may be calibrated and amplified into a usable signal. A metal or semiconductor whose resistive properties change with strain, a so-called piezoresistive effect, also may be used to sense pressure. This additional technologic development has facilitated the evolution and miniaturization of pressure sensors that may be adapted to almost any application. In general, these sensors do require periodic calibration against atmospheric pressure (zero) and occasionally require one other known data point (span) to ensure linearity across their operational range. They are small, lightweight, and generally much more sensitive to small changes.
Applications
Airway pressure is a key component in measuring ventilation. Detecting ventilator-related events (VREs) helps anesthesia providers identify and avoid a majority of serious anesthesia-related events.23,24 Disconnection of the circuit without occlusion is a significant anesthesia-related event that may lead to adverse patient outcomes.
Pressure sensors have been used to detect other mechanical problems, including tracheal tube disconnection with occlusion, kinking of the inspiratory limb, fresh gas hose kink or disconnection, circuit leaks, high and low scavenging system pressure, continued high circuit pressure, and kinking in the circuit pressure-sensing hose.25 However, the ability to detect these conditions, especially with older monitors, is not as reliable.
Before the introduction of these sensors, previous techniques included lung auscultation, measures of chest wall movement, use of a precordial or esophageal stethoscope, and measurement of physiologic variables such as pulse, blood pressure, respiration, and skin color. These other monitoring methods, absent end-tidal carbon dioxide and pulse oximetry, often resulted in delayed or failed detection of events.
Ventilation failure events can occur because positive pressure does not always equal tidal volume delivered. Sensors in different locations along the breathing circuit, especially with pressure-based ventilator modes, can give disparate pressure measurements and are thus susceptible to both false-negative and false-positive readings.
Breathing Circuit Low-Pressure Alarms
At a minimum, a low-pressure alarm with an audible alert must be placed in the patient breathing circuit in accordance with the current American Society of Anesthesiologists (ASA) Standards for Basic Anesthetic Monitoring. Pressure-sensitive alarms monitor airway or breathing circuit pressure through a side port and compare it with a preset low-pressure alarm limit. The primary purpose of this alarm is the prompt identification of breathing circuit disconnection. This class of malfunction has been disproportionately associated with adverse outcomes in the intraoperative period and may be almost completely avoided when this relatively simple monitor is used. Although low-pressure alarms are primarily intended to warn of a breathing circuit disconnection when a positive-pressure ventilator is used, it is important to realize that they do not detect some partial disconnections and will likely not detect misconnections or obstructions. However, because 70% of all disconnections occur at the Y-piece,26 it is an excellent addition to the other sensors used to monitor ventilation.
Sensor Position Within the Breathing Circuit
The location of airway pressure sensors is important to both detect circuit disconnects and accurately reflect distal airway pressures. Sampling location, kinetic energy transfer, and Bernoulli effects all influence final measured pressure. Circuit pressure should be measured at an appropriate site for the particular need and at a right angle to axial flow.27 The ideal location is at or near the patient Y-piece, but secretions and condensation may cause sensor malfunction. If it is not close enough to the Y-piece, an undetected disconnection (false-negative) may occur as a result of circuit resistance between the measurement site and the distal, now open, end. This will be compounded if a descending bellows ventilator is used, or if the disconnection site is embedded in sheets, blankets, or some other obstructing material.26
A sensor inside the circuit, upstream of the inspiratory valve, eliminates any risk of contamination but becomes insensitive under certain conditions. The combination of an inspiratory limb low-pressure monitor with an in-line humidifier, capnometer cuvette, angled tracheal tube connector, or corrugated catheter mount28 can create backpressure with medium to high flows and may prevent the alarm from being activated. Increased backpressure has also been seen in the Bain (or C-Pram) breathing circuit as a result of circuit tapering and extension of the fresh gas outlet to near the connector at the patient. Lower flows can also prevent the alarm from being activated if moisture builds in the in-line humidifier.29
One proposed solution is to place the low-pressure alarm on the expiratory limb to avoid backpressure-induced false-negative events.30 However, expiratory limb pressure sensors are not without problems. Apnea volume alarms have also been sounded, without the pressure alarm sounding, as a result of loose retaining rings in the expiratory limb not detected during machine leak testing. Interestingly, reverse-flow and minute volume low alarms may trigger without a low-pressure alert.31 In older anesthesia delivery systems without fresh gas compensation, expiratory valve anemometers routinely overestimated tidal volumes because of high flows of fresh gas passing through the circuit during the expiratory phase.
Pressure sensors within the ventilator obviously are insensitive in machines with a manual/automatic selector switch in the manual position.26 The placement of pressure sensors in both the circuit and ventilator may provide a solution, but this has been implemented only in the Medical Anesthesia Delivery Unit (ADU) anesthesia machine (GE Healthcare, Waukesha, WI).32 Recently, ventilation pressure sensors have been placed in both the inspiratory and expiratory circuit limbs.33,34 The inspiratory limb sensor provides feedback during volume-controlled ventilation. Stress fractures in these sensors may trigger alarms without directing the provider to the site of the fault. The small fracture size prevents detection through low- and high-pressure leak tests. Options include detection through visual inspection, using alcohol-wet hands to detect a small gas leak,35 or using a second reservoir bag as a test lung to verify sensor integrity.
To improve the rate of detection of true-positive events, the low-pressure limit should be set just below the normal peak airway pressure, and subsequent machine testing should establish that a disconnection would cause the alarm to sound. The disconnection should be performed at the distal (patient) end to ensure that backpressure, flows, and monitor limits are not such that the alarm would fail to sound in the event of a disconnection.28
The clinical response to a low-pressure alarm should be rapid and organized. The anesthesiologist must systematically evaluate the gas flow to ensure it is adequate, the breathing circuit to ensure it is not disconnected or leaking, and the ventilator, which may not be driving the bellows or may have a setting error. Working outward from the adjustable pressure-limiting (APL) valve toward the patient helps the anesthesiologist rapidly identify and correct the issue.26
Airway Versus Alveolar Pressures
With controlled ventilation, a transpulmonary inflation gradient is provided by positive airway pressure. Generated by a ventilator, this positive pressure gradient may be constant or may vary during the inspiratory phase. The instantaneous pressure during the ventilation cycle is best measured at the distal end of the ventilator circuit, near the connection to the patient.27 Division of the airway pressure-time product (area under the curve) by total cycle time yields mean airway pressure. In most cases,this average pressure approximates mean alveolar pressure.36 Mean airway pressure also correlates with alveolar ventilation, arterial oxygenation, hemodynamic performance (venous return), and risk of barotrauma.27
Alveolar pressure is clinically of interest, but direct measurement generally is not practical. The measurement requires measurement of airway pressure at the distal portion of the endotracheal tube, as close as possible to the alveoli, whereas clinical airway pressure measurements commonly are at the proximal portion of the endotracheal tube.37 Measured airway and actual alveolar pressures differ because of proximal dissipation of the frictional inspiratory airway pressure component and the expiratory alveolar pressure resistive contributions. Positive end-expiratory pressure (PEEP) adds to the external circuit pressure throughout the cycle, proportionally increasing the mean airway pressure.27
Chest wall and lung compliance, secretions, partial occlusions, and tracheal tube resistance may also affect peak airway pressures. Plateau pressures are measured during an inspiratory pause (no flow) and are affected only by secretions, partial occlusions, and tracheal tube resistance.
Ventilation Mode Effects on Airway Pressures
Volume control will deliver a set tidal volume, and pressure will increase until that volume is reached. In low lung compliance conditions, such as acute respiratory distress syndrome (ARDS), high pressures can be administered in attempts to deliver a set volume.
Pressure control will deliver a set pressure, and the tidal volume will depend on airway resistance and lung and chest wall compliance. Pressure control may be better tolerated in some patients, improving both ventilation and oxygenation. However, if lung compliance decreases, and the same pressure is applied, the tidal volume will decrease. Appropriate volume alarm settings will signal low volumes and avoid undetected hypoventilation.
Pressure support mode delivers a positive pressure that is rapidly achieved and maintained throughout inspiration whenever the patient makes an inspiratory effort. The volume delivered depends on the pressure setting, inspiratory time and effort, and airway resistance and compliance.38
Pressure Alarms
Subatmospheric Pressure Alarms
Subatmospheric alarms measure and alert the clinician to a subatmospheric (negative) circuit pressure and the potential for reverse flow of gas. Negative pressures can rapidly cause pulmonary edema, atelectasis, and hypoxia. Commonly, the low pressures result from active (suction) scavenging system malfunctions or patient inspiratory efforts against a circuit that is either blocked or that has inadequate fresh gas flow. Other events detected include suction applied to a gastric tube that has been passed into the trachea alongside the tracheal tube39 and moisture accumulation in the carbon dioxide absorber that decreases gas flow to the patient.40
High-Pressure Alarms
High-pressure alarms are now user adjustable or even automated, but in older monitors, this was not always the case. High respiratory rate, low inspiratory/expiratory ratios, low tidal volume, low flow of inspiration and fresh gas, and high tubing compliance may result in a failure to trigger the alarm. Older machines may generate excessive pressure and put the patient at risk without exceeding their preset level, usually near 40 cm H2O.41 Positive inspiratory pressure (PIP) measurement and adjustable alarms are especially valuable in the pediatric population. Endobronchial intubation can be identified rapidly using pressure monitoring before the onset of hypoxia or hypercapnea.42
Continuing Pressure Alarms
A continuing pressure alarm is triggered when circuit pressure exceeds 10 cm H2O for more than 15 seconds, and it alerts the anesthesiologist to more gradual increases in pressure, such as those that result from a ventilator pressure relief valve malfunction (a valve stuck closed) or a scavenging system occlusion. In these situations fresh gas continues to enter the breathing system from the machine flowmeters but is unable to leave. Rate of rise of pressure therefore depends on the fresh gas flow rate.
Modern anesthesia machines now have multiple pressure sensors, as described. In addition to the electronic sensors in the ventilator and the circuit, an analog gauge usually is positioned on the carbon dioxide absorber to serve as a quick reference and as a backup in case of electrical failure.
Volume Measurement
In the management of controlled ventilation, it is important to monitor minute ventilation—the volume of gas delivered to the airway in 1 minute—as a measure of ventilatory “adequacy.” This measure is best obtained by measuring tidal (breath) volume and then multiplying by respiratory frequency. Because arterial partial pressure of carbon dioxide is inversely proportional to alveolar minute ventilation,43 this measurement is important both for initial ventilator setup and subsequent adjustments. Measurements may be made intermittently with manual methods; more commonly, they are made with a device integrated into a ventilator circuit and electronically monitored. This integration may include the derivation and display of minute ventilation, flow-volume loops, and determinations of pulmonary compliance.
Dead Space
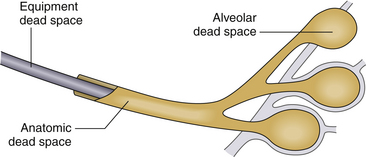
Because not all tidal ventilation delivered reaches the alveoli, effective gas exchange occurs only in a fractional part of the tidal volume. The remaining gas occupies the trachea, bronchi, and bronchioles and is referred to as anatomic dead space. This volume is relatively fixed in each patient; thus, as tidal volume decreases, it occupies a larger fraction of each breath. At a tidal volume roughly equal to the anatomic dead space, effective alveolar ventilation ceases, with the same gas being transported distally from bronchi to alveoli that was most recently expelled. Also, the distal breathing circuit and patient airway contribute additional mechanical or apparatus dead space to the system (Fig. 9-2).
Measurement of dead space is important to minimize its contribution to total minute ventilation and clearly calculate the relationship between alveolar minute ventilation and arterial carbon dioxide tension. A combination of precise volume measurement and capnography may be used to calculate anatomic dead space using Fowler’s method. Initially described using nitrogen as the reference gas, the expired volume was measured from the beginning of exhalation until the onset of the “plateau” of alveolar gas.43
Mechanical Devices
The simplest device for the measurement of gas volume is based on a rotating vane or propeller calibrated against a specific density of gas. The total rotation of the attached shaft correlates with the volume of gas (air) that has passed by. The basic principle is that a force is transmitted to the vanes by the impact of gas molecules, and this force is converted to a rotational (angular) momentum and spins the pinwheel. Optical or mechanical transducers count the rotations and convert the value to an equivalent volume. Critical variables are the gas density—which depends on gas composition, humidity, and altitude—and temperature. At very low flows or volumes, the device may be less accurate as a result of the finite mass and inertia of the vanes.
Wright’s Respirometer
Introduced in 1955,44 this vane anemometer uses a low-mass rotating vane that responds to the force of flowing gas by rotating in proportion to flow. It records tidal volume, which is proportional to total rotations, and it can sum multiple breaths to indicate minute volumes. Manufactured by several companies in both mechanical and optically encoded forms, the overall shortcoming of this device is volume inaccuracy at low flows. Low flow causes the turbine to accelerate more slowly because of inertial effects, so the accuracy is lower. It is considered a very safe monitor, however, because it understates inspired tidal volumes at low volumes45 and continuous low flows as a result of gas slippage past the vanes,45 although expired volumes continue to be reliable. Pulsatile flows will cause an overread of tidal volume because of higher peak flow rates and “coasting” of the vane between breaths.46 The Ohmeda 5400 Volume Monitor (GE Healthcare), an optically encoded turbine, is the exception in this class. It overreads with low flows and underreads with high flows.46
The Wright respirometer (Cardinal Health, Dublin, OH) design is not ideal for low-flow anesthesia because it requires a minimum flow of approximately 2 L/min. The monitor is also not appropriate for spontaneously breathing pediatric patients, whose tidal volumes are insufficient to rotate the vane. If pediatric patients are artificially ventilated, the device may be more useful; this is because with expiratory valve opening, the initial flow rates should be sufficient to overcome inertia and rotate the vane.45 Hatch47 studied a modified turbine design that is accurate at volumes of 15 to 200 mL; it also is electronically encoded and incorporates an integral apnea alarm.
Several manufacturers have used this technology to measure expiratory volumes at the proximal end of the expiratory limb of a breathing circuit. Head-to-head comparisons of the various devices showed reasonable reliability of this class of tidal volume monitor above minute ventilations of 5 L/min using air, nitrous oxide/oxygen, or humidified air.46 As minute ventilation decreases, the measured tidal volume will be less than the actual volume delivered; however, the accuracy of the device depends on the transducer used by the manufacturer (Fig. 9-3).48
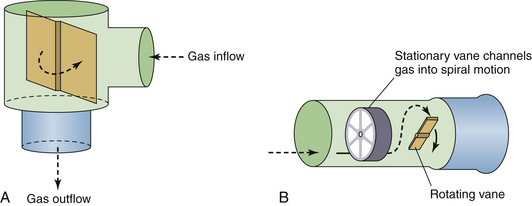
FIGURE 9-3 Rotating vane flow sensors. A conventional Wright respirometer from a MagTrak IV (A; Baker Hughes Incorporated, Houston, TX) and an Ohmeda 5400 (B; GE Healthcare, Waukesha, WI).
A sealed mechanical volumeter (Fig. 9-4) was used by Dräger Medical (Telford, PA) in some older delivery systems to measure tidal volume and minute ventilation. This device consists of a pair of rotating elements in the gas flow path, configured much like a revolving door at the entrance to a building. A fixed volume of gas is passed across the volumeter with each quarter rotation of the dumbbell-shaped elements. A seal is formed between the polystyrene rotating elements and the interior wall of the tube, and a sealed volumeter provides substantially more resistance to flow than does the vane anemometer. The accuracy of this volumeter is affected by gas density and by the inertia of the rotating elements; however, it is not influenced substantially by the flow pattern of the gas. The number of fixed volumes of gas transferred from inlet to outlet is mechanically measured.
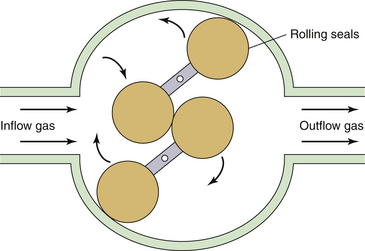
FIGURE 9-4 Schematic of a sealed volumeter. The rotating polystyrene elements seal against the volumeter interior. Fixed volumes of gas flow from the inlet to the outlet and rotate the elements. A mechanical gauge connected to the rotating element shaft (mechanical spirometer) displays the measured volume. Electronic measurements may be read on a remote display. This is the principal of operation of the Drägerwerk AG volumeter (Spiromed; Dräger Medical, Telford, PA).
The Dräger Spiromed is an electronic version of the mechanical spirometer. Gas flow through the device determines the rate of rotation of the rotors, which is measured by an electromagnetic sensing system. The Spiromed is direction sensitive and can alert to reversal of gas flow in the circle system. The accuracy of the Spiromed for tidal volumes is ±40 mL and ±100 mL for minute ventilation, or 10% of the reading.
Measurement of Gas Flows
The flow of any fluid material, liquid or gas, may be described by a set of equations that embody the concepts of smoothness, continuity, and conservation of mass. This description allows for properties such as density, viscosity, compressibility, mass, and volume. As fluids flow, they interact with their surroundings—that is, other fluid or container walls—in predictable ways. An important concept is the distinction between laminar (smooth) and turbulent (chaotic) fluid flow. This is an interesting exception to the normally smooth, continuous nature of fluid transport.
Turbulent flow is characterized by the formation of eddies or vortices on an increasingly small scale. The transition from laminar to turbulent flow is catalyzed by increasing drag on the fluid by friction from interaction with boundary layers, walls, or orifices in the fluid path. It is a chaotic process that depends on a complex combination of fluid density, viscosity, and the size and shape of the obstruction to flow.
Principles
The behavior of fluids and gases depends on whether their flow is laminar (smooth) or turbulent. Flow through a tube with a length greater than the diameter usually is laminar; however, at a critical velocity (VC), a transition to turbulent flow occurs. This is shown in the following equation, in which r is the radius of the tube, ⍴ is the density, η is the viscosity of the gas, and k is the critical Reynolds number, which is different for each gas:

This transition to turbulent flow greatly increases the resistance to flow and may be seen in many common scenarios, such as a kink occurring in an otherwise smooth tracheal tube. For flow through an orifice, in which length is less than the radius, turbulent flow is a given. Measured in units of length cubed per unit of time, volume flow may be calculated by detecting a velocity change across a fixed cross-sectional area. Bernoulli’s equation makes this possible by measuring a pressure change across this transition:

where P is pressure, g is gravitational acceleration, and h is the height above a reference plane. Note that with turbulent flow, only the gas density affects the relationship between pressure and velocity. Application of a continuity condition, in which gas in equals gas out, gives the following:

In this case, P1 and V1 represent initial pressure and velocity, and P2 and V2 represent final values. Rearrangement of this equation allows determination of gas velocity by measurement of pressure change (drop); this is converted into flow by knowing the cross-sectional area (A) of the passage:

Given that flow is proportional to velocity, from the continuity equation we know that flow is also proportional to the square root of the pressure difference (P) across an orifice.22

However, for laminar flow, where r and L are the radius and length of the tube, the Hagen-Poiseuille law offers this relationship between flow (F) and pressure drop (P1 − P2):
This equation allows the laminar flow of a gas to be calculated by determining the pressure drop across a resistance element, not an orifice. Here, in contrast to Bernoulli’s equation, gas viscosity is the factor that may contribute to miscalibration or erroneous readings. Also, flow is directly proportional to the pressure difference, rather than to the square root, as with turbulent flow.
Flowmeters
The concept of the flowmeter encompasses two major areas: the metering of gas supplies, usually to a delivery system, and the measurement of tidal (periodic) ventilation in breathing circuits. The use of relatively constant flowmeters requires precise and reproducible settings to control, rather than measure, gas flows. The primary requirement for flowmeters in human breathing is accurate measurement of nonsteady flows.49
Rotameters
Variable-orifice rotameters have existed for more than a century; the patent for the initial device was granted to Karl Kuppers in 1909,50 and commercial production occurred in the same year. The concept of a tapered tube that enclosed a weighted bobbin that rose in the vertical column in response to increases in gas flow was perfectly mated with a controlling needle valve to produce a device to both measure and control gas flow. In 1910, Dr. Maximilian Neu delivered a known volume percentage of nitrous oxide and oxygen during an anesthetic.51 The introduction of acetylene and of a rotameter calibrated for this gas occurred in 1922.52 The ability to provide an accurate mixture of gases allows anesthesiologists to more precisely control anesthetic depth. Adoption of this innovation initially was not rapid because it was unable to deliver ether, and nitrous-oxygen-morphine-scopolamine anesthetics did not reliably provide sufficient muscle relaxation for abdominal surgery. Also, nitrous oxide was expensive to produce at the time, whereas ether and its delivery equipment were inexpensive.
Rotameters can measure gas, vapor, or liquid flow. The floating bobbin rotates to avoid friction as gas impinges on its finned head. The tapered outer tube provides what is effectively a variable orifice, as distance between the bobbin and sidewall increases with increasing flow. The float position is read from a calibrated scale on the tube that is specific for that tube, bobbin, gas used, and temperature range. The rotameter must be vertical to avoid friction or collision between the bobbin and the tube walls.52
Rotameters typically are used individually for each gas in the fresh gas manifold of an anesthesia machine. Although the glass tubes are normally shielded, cracks or leaks in rotameters do occur, producing the risk of hypoxic mixtures. However, placing oxygen last in the manifold of gases to the patient decreases the risk of hypoxic mixtures. A properly calibrated oxygen analyzer also aids in the detection of hypoxic mixtures.53 This preferred configuration decreases hypoxic risk but could increase the risk of patient awareness and hypoventilation.
Later changes to the arrangement of rotameters brought nitrous oxide and oxygen together to allow the two to be mechanically “interlocked.” This limits the flow of nitrous oxide based on the oxygen flow, which further decreases the risk of a hypoxic mixture delivery.
Weakened springs and worn or degraded O-rings have caused intermittent failures not detected on a machine check.53,54 Empty cylinder yokes also can leak as a result of reverse flow around the rotameter bobbins because the bobbin at zero does not create a seal at the base of the tube. This condition is worsened by ventilator backpressure and is not prevented by pressure regulators or unidirectional valves.55 The bobbins and tubes are specific to the gas density and viscosity, with the viscosity difference being more significant at low flow rates. At high flow rates, the gas density difference predominates, as it does with the use of helium in an oxygen rotameter.22 Inadvertent transposition of bobbins and tubes between gas supplies has resulted in both intraoperative patient awareness and hypoxic mixtures.56,57
Real-Time Flow Monitoring
Rather than meter gas flows, as with a rotameter, a more interesting application of gas laws is in instantly detecting the velocity and direction of tidal flows, such as might be found in a ventilator circuit. One application of Bernoulli’s law is in the pitot tube flowmeter. In this design, the dynamic pressure of gas impacting into a pressure port is compared with the static pressure within the conduit. The pressure difference is proportional to the square of the flow rate. By using opposing pitot tubes facing in opposite directions, the direction of the flow also may be determined. This technology was developed for use at the distal end of a patient breathing circuit by Datex as the Capnomac Ultima (Fig. 9-5).
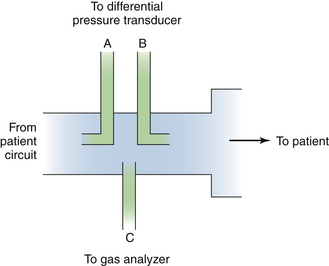
FIGURE 9-5 A sidestream gas analyzer and spirometry adapter, longitudinal cross section. Using two pitot tubes (A and B) facing opposite directions, the pressure differential is used to measure inspiration and expiration through flow and flow rate. Absolute pressure is also measured. Port C is used to continuously sample respiratory gas for composition, and analysis results are used to correct flow readings for density and viscosity. This technology is used in the Datex Capnomac Ultima Monitor. (Courtesy Datex Medical Instrumentation, Tewksbury, MA.)
Fleisch Pneumotachometer
The principle of operation of the pneumotachometer is to measure the loss of energy of the flowing gas as it passes through a resistive element. The resistive element is designed to ensure that the flow of gas is laminar, so that the energy loss is completely due to viscosity, and the flow is directly proportional to the pressure difference. The energy loss is measured as a pressure difference from the inlet to the outlet of the resistive element. The most common type of resistive element designed by Fleisch58 consists of narrow, parallel metal tubes aligned in the direction of the flow (Fig. 9-6). Nominally, for laminar flow, the pneumotachometer obeys the Hagen-Poiseuille law:

Here, F equals gas flow, r and L are radius and length of the element, P1 and P2 are inlet and outlet pressures, and η represents the viscosity of gas flowing through the device. Measurement of flow is therefore independent of gas density and total pressure.
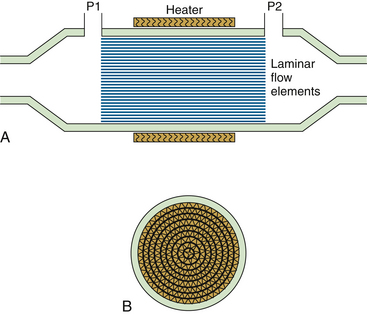
FIGURE 9-6 Fleisch pneumotachometer cross-sectional views. A, Longitudinal view: the parallel paths constitute the laminar flow resistance element. P1 and P2 (pressure ports) measure the differential pressure across the resistance element. The heating element prevents condensation formation within the elements. B, A laminar flow element cross-section. This pneumotachometer is generally bidirectional and constructed from aluminum, and resistance elements are roughly triangular in appearance.
Fleisch pneumotachometers have been widely used in respiratory physiology and pulmonary function studies and are available in various sizes (resistances) to accommodate the appropriate flow range. The resistance of the element must be chosen so that the pressure difference produced in the flow range of interest is large enough to be measured accurately by the available pressure transducers; too resistive an element will impede ventilation. The Fleisch pneumotachometer typically uses a heating element to raise the temperature of the device to approximately 40° C, thus preventing condensation of moisture in expired gas.
The pressure difference across the resistive element, or “head,” is measured by a differential pressure transducer with sufficient sensitivity and frequency response. The transducer must be zeroed, or “nulled,” electronically by reserving a measurement made with zero flow. The pressure difference is typically in the range of 2 cm H2O. Pressure transducer output readings tend to drift and the measured signal is small; therefore they must be periodically renulled. For vigorous ventilatory flows, the rate of change in gas flow is great, and the frequency response of the transducer must be adequate to follow these changes.
The respiratory volume is computed by integrating the flow with respect to time because flow equals volume divided by time. The pneumotachometer is calibrated by setting a gain coefficient according to a volume produced by manually emptying a calibrated syringe, usually 1 L in volume, through the device. Often the calibration syringe is emptied several times at different rates to simulate the range of gas flows expected during clinical use. In practice, the characteristics of the Fleisch pneumotachometer depend on the geometry of the tubing on the upstream side of the resistive element. This results in a distinctly nonlinear deviation from Poiseuille’s law.59
The viscosity of gases in the respiratory mixture must be considered if measurement of flow is to be accurate. Consider that the viscosity of a gas mixture of 88.81% oxygen, 1.61% nitrogen, and 9.58% carbon dioxide is 9.1% greater than that of air. Thus substantial errors can result if gas viscosity is not considered. Temperature is considered to have a linear effect on the viscosity of respiratory gases in the range of 20° to 40° C, although the linear coefficient is different for each gas.
The other disadvantage of the pneumotachometer in an anesthesia circuit is its propensity to accumulate mucus and water in its narrow tubes. It must be repeatedly calibrated because its effective resistance changes with fouling. In addition, the pneumotachometer must be cleaned and sterilized between clinical uses.
Turbulent Flow Fixed-Orifice Flowmeters
The other common alternative to laminar flowmeters for the accurate measurement of ventilatory gas flows is the use of pressure differential between two ports separated by an orifice. This mechanism assumes that gases at low flows have constant density, and it calculates flow from the pressure difference upstream and downstream of a calibrated resistance. Laminar flow is found upstream in a fixed-orifice flowmeter, and it is turbulent downstream; the problem with a fixed-orifice flowmeter is its resistance to high flows and insensitivity to very low flows.
D-Lite Gas Airway Adapter and Flow Sensor
Datex (now part of GE Healthcare) introduced the D-Lite gas sampler and flow-sensor device in 1993. This sensor is evolved from the sensor in the Datex Capnomatic Ultima Monitor (see Fig. 9-5). It measures flow and airway pressure and provides sidestream gas sampling for analysis60 and sidestream spirometry.61 This lightweight device attaches between the Y-piece of the circle breathing system and the airway device, such as the tracheal tube, laryngeal mask airway (LMA), and so on. Reliable operation in a humid and secretion-filled environment involves a two-sided pitot-type tube with a robust flow restrictor element.60 One pressure-sensing port faces “upstream” (Pu), and the other faces “downstream” (Pd). The difference—Pu − Pd, or the dynamic pressure—is proportional to the square of the gas velocity. Across a known cross-sectional area, and assuming laminar flow, velocity converts to flow. Because the ports face in opposite orientation, flow may be measured in both directions with a single, fixed arrangement. Thus


This is illustrated in Figure 9-7.61
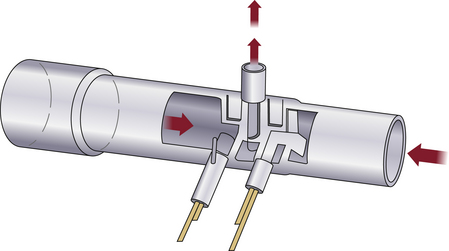
FIGURE 9-7 Section of the D-Lite flow sensor (GE Healthcare, Waukesha, WI) showing the two fixed sidestream resistances and a gas sampling port above.
The continuous analysis of gas composition supplies the density data required for the flow calculation shown. Flow and pressure measurements—flow rate, peak flow, end-expiratory plateau, and minimum and maximum pressures—are then used to calculate inspiratory and expiratory tidal volume and minute loops as well as compliance and resistance. Low-flow conditions and compensation for pressure and gas fraction variability are handled by monitor calibration and continuous analysis of respired gases (Fig. 9-8).60
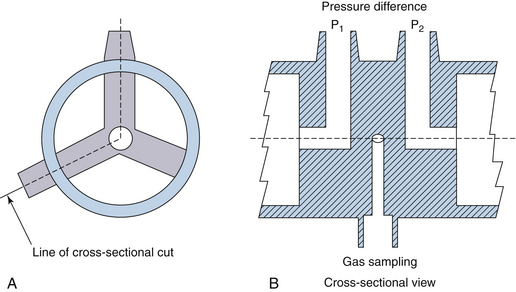
FIGURE 9-8 D-Lite sensor head design (GE Healthcare, Waukesha, WI). A, End view through the tube. B, Cross-sectional view of holes to measure pressure and sample gas.
The sensor head is constructed in a symmetric fashion to measure gas flow in both directions. Connectors are on the outer wall: two sense pressure, and one (Luer Lock) samples gases. Flow resistance is quite low at 1 cm H2O/L/sec at 30 L/min. Back-and-forth air movement of a precise volume accomplishes calibration while the device is connected to an 8.5-mm tracheal tube, which provides a known resistance. This sensor serves multiple roles in the assessment of patient ventilation: it assesses endobronchial intubation and malposition of double-lumen tubes, and kinks, leaks, and obstructions may also be identified. A pediatric version with a smaller apparatus dead space (Pedi-Lite is 2.5 mL; adult D-Lite is 9.5 mL) partially compensates for the decreased sensitivity to lower flows and volumes.
Because the two sizes have different cross-sectional areas, the user must ensure that the Datex Compact Airway Gas Monitoring Module is set appropriately. Erroneous spirometry data result if the sensor size does not correspond with the appropriate software setting. Helium-oxygen mixtures do not affect the accuracy of this flowmeter.62
Variable-Orifice Flowmeters
A novel implementation of flow sensing is found in the Datex-Ohmeda Aestiva, where a variable-orifice flow sensor monitors both inspiratory and expiratory flows and volumes. The problem of nonlinearity and decreased sensitivity at low flows is partially compensated for by the modification of introducing a “flapper” valve between the two pressure sensors. This serves as a variable orifice that increases in size with larger flows. Because flow calibration is different with a variable orifice, each sensor has a unique calibration table stored within the ventilator’s electronic memory. This technology is in use in GE Healthcare’s latest generation of anesthesia machines, the Medical 7900 Smartvent.63
Resistance: Heated Wire
Flow rate can be measured with a heated wire by measuring the cooling of the wire from heat transfer to the gas flowing by. Heat transfer depends on several variables, including gas flow rate, density, heat conductivity, dynamic viscosity, and the temperature difference between the sensor and the gas. With most other variables controlled, heat transfer is a function of the gas velocity from which flow may be derived. This type of flow sensor will always show the flow rate relative to its reference regardless of the pressure, as long as the sensor is in an inelastic tube.64 In general, because the dynamics of the human respiratory system require that any device measure flow rates from 0 to 2.5 L/sec, the flowmeter should be accurate to within 5% with commonly used gases at typical temperatures and pressures. Minimum flow resistance, dead space, and the ability to detect the direction of the flow also are required.
The heated wire transducer is a tube with a basal temperature sensor and flow rate wires. The design of the device is intentionally small to minimize thermal mass and response time. The two flow-rate sensors are heated, perpendicular to the flow, and connected by a Wheatstone bridge. The temperature of the thin, heated wire is regulated at a constant level; when the airflow rate changes, the induced shift in electrical resistance alters the voltage on one side of the electrically balanced circuit. The limitation of the device is that turbulent flow must be avoided; therefore directional sensors are kept very small so that direction is measured at a point and not at the cross-section of the tube. Baffles at both ends of the sensor prevent laminar flow from becoming turbulent. Dead space is about 5 mL, and an outlet for a pressure transducer is built into the device. The advantage of this type of device over turbines and pressure drop–based devices appears when respiratory flow rates are widely variable. Measuring flows with other devices, such as pressure-based devices, may require several transducers or a variable orifice, which are not as accurate in extreme situations, such as with a high respiration rate, in which errors occur as a result of inertia; with high flow resistance, especially in the setting of spontaneous respiration; and with large dead-space volumes (Fig. 9-9).
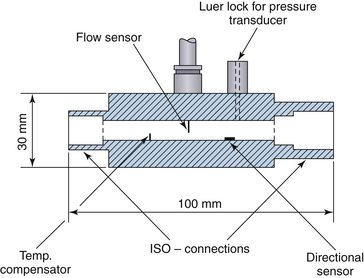
FIGURE 9-9 Transducer mechanical layout for a constant-temperature anemometer. ISO, International Organization for Standardization.
A new development in this sensor is the addition of vibration to the heated wire sensor. The voltage at constant current varies with gas velocity and allows the sensor to be used with gases of varying composition and temperature. This is useful in the velocity range of 0 to 30 cm/sec and reduces the need for frequent calibration of the hot wire voltage curve. It is likely that this technology will be incorporated in future flow sensors.65
Flowmeters for Xenon Anesthetics
The rotating-vane flowmeter is accurate enough for xenon anesthetics because of its insensitivity to gas composition.48 However, because of the increased density of xenon relative to air, the pitot tube and variable-orifice type flowmeters overestimate tidal volume by a factor of 2. Hot wire anemometers used with xenon would tend to underestimate flows and volumes because of the low thermal conductivity of the gas.
Acoustic/Ultrasonic Flow Sensors
A more sensitive flowmeter used for monitoring of variable flows uses ultrasound reflection from moving columns of gas or liquid. Similar to the familiar ultrasound applications to tissue and blood flow imaging, the intrinsic accuracy and compact size of these sensors makes them ideal in the operating room (OR) environment. Initial work on measuring human breathing with ultrasonic flowmeters appeared in the 1980s and was rapidly adopted for measuring many types of ventilation and human populations in and out of the OR.66,67
Acoustic/ultrasonic flow sensors use clamp-on or wet transducers and can be applicable to liquids, gases, and multiphase mixtures. Their use has limits, but application to monitoring ventilation can be accomplished with the right combination of technology (Box 9-2).68
Within the acoustic domain, various techniques of measurement may be used. Single versus multiple acoustic paths, vortex shedding, and passive and active principles, to name a few, are available, although no single “best” method exists.
Several ultrasonic flowmeters are in current use, including the BRDL flowmeter (Birmingham Research and Development Ltd., Birmingham, UK) and the Spiroson flowmeter (ECO Medics AE, Dürnten, Switzerland). The former has two PVC flowmeters with diagonally opposed flow transducers, and the latter has a single flowhead with two rectangular flow channels, again with diagonally opposed flow transducers. The advantage of these flowmeters is minimal airflow obstruction over a large flow range compared with the traditional Fleisch pneumotachometers (Fig. 9-10).48,69
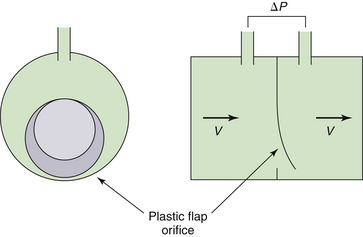
FIGURE 9-10 An Ohmeda 7900 variable-orifice sensor (GE Healthcare, Waukesha, WI). The plastic flap opens with gas flow, causing a pressure decrease across the orifice measured as an index of flow velocity.
The ultrasonic flow sensor is used on certain models of Draeger anesthesia workstations, such as the Narkomed 6400. Ultrasonic flow measurement uses the transit time principle, by which opposite sending and receiving transducers are used to transmit signals through the gas flow. The signal travels faster when moving with the flow stream rather than against it, and the difference between the two transit times is used to calculate the gas flow rate. The device is sensitive to gas flow direction and has no moving parts, and accuracy is independent of gas flow composition.
Spirometry, Curves, and Loops
Overview
Spirometry is most familiar as an outpatient test for obstructive lung disease, asthma, and other respiratory conditions. Indications include wheezing, cough, stridor, chest tightness, and dyspnea on exertion or at rest. Spirometry can be invaluable in identifying respiratory versus cardiac etiologies, distinguishing between obstructive and restrictive disease, following the progression of neurologic diseases, and evaluating preoperative respiratory risks. As the most widely used test to assess the ventilation portion of the respiratory system, its utility in the OR and the intensive care unit can also be significant.70 Several approaches to continuous spirometry have been developed, each with advantages and limitations; but the information gathered from spirometry, combined with blood gas measurements, may be used to both optimize care and detect evolving airway issues.71
Several visual displays are available on modern anesthesia machines. The variables available for two-dimensional displays include time, volume, flow, and pressure. Time is always on the horizontal (x) axis, and the others are either on the horizontal or vertical (y) axis. If time is on the horizontal axis, the graphic relationship is a curve. If time is not used in the comparison, the visual relationship is a closed curve or loop.
Insufficient studies have been published to compare the utility of the various graphic depictions; currently the choice of display is user dependent.38
Spirograms
Spirograms are a visual representation of volume over time. The primary measurements are forced vital capacity (FVC), forced expiratory volume over 1 second (FEV1), forced inspiratory volume in 1 second (FIV1), and the calculated value of FEV1/FVC (Fig. 9-11).70 Low airway function is measured by the middle 50% of expiratory flow, forced expiratory flow (FEF) 25% to 75%. In an ambulatory setting, testing is performed by the subject taking a maximal inspiratory breath and making a forced maximal exhalation through a mouthpiece. In the OR, the tracheal tube replaces the mouthpiece.
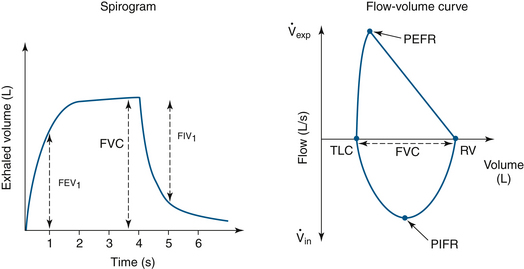
FIGURE 9-11 Normal spirogram and flow-volume curves showing conventional measurements. FEV1, forced expiratory volume in 1 second; FIV1, forced inspiratory volume in 1 second; FVC, forced vital capacity; PEFR, peak expiratory flow rate; PIFR, peak inspiratory flow rate; RV, residual volume; TLC, total lung capacity;  exp, expiratory volume;
  in, inspiratory volume.
Curves
Curves are a useful depiction of two parameters in a visual format. Traditionally, ventilatory curves use time along the x-axis, and the y-axis can be volume, flow, or pressure.
Volume-Time Curves
Inspirations on volume-versus-time curves are depicted as upslopes; downslopes are exhalations. These curves can identify auto-PEEP, expiratory limb leaks, active (forced) exhalation, and flow transducer miscalbrations (Fig. 9-12).38
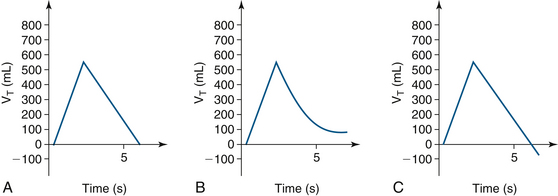
FIGURE 9-12 A, Normal volume-time curve, with time on the x-axis and tidal volume (VI) on the y-axis. B, An expiratory limb air leak or positive end-expiratory pressure; the expiratory curve does not return to baseline. C, An expiratory curve that goes below baseline because of active exhalation or inaccurate flow transducer calibration.
Flow-Time Curves
When observed with controlled ventilation, these curves may display square, decelerating, descending ramp, or sine flow patterns depending on the type of ventilatory pattern selected. Pressure control and pressure support ventilation curves may be decelerating or descending. Square flows represent constant inspiratory flows that create shorter inspiration time and longer expiration time; higher peak inspiratory pressures (PIP) result from this pattern and increase the risk of ventilator-induced lung injury.38
Peak flow is delivered early in both decelerating and descending ramp flows, and it decreases until the target volume or pressure is delivered. Lower PIP is generated, but mean airway pressures can be increased and inspiratory time may be longer. Decelerating flows are recommended in ARDS.38
Spontaneous breathing patterns are closest to sine-pattern flows with accelerating then decelerating flows. PIP may be increased and uncomfortable for patients not under general anesthesia (Fig. 9-13).
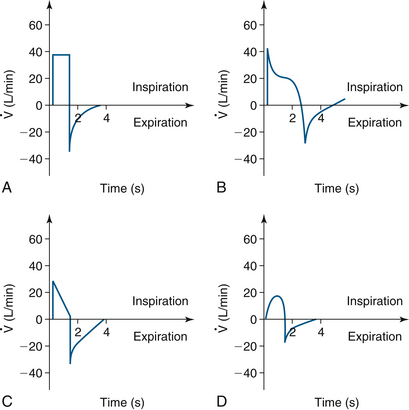
FIGURE 9-13 A, Volume control ventilation displays a square flow pattern. Higher positive inspiratory pressure (PIP) and shorter inspiratory times can be seen. B, Decelerating ramp seen in pressure control and pressure support ventilation. Lower PIP and longer inspiratory times are seen. C, Descending ramp seen in pressure control and pressure support ventilation. Lower PIP and longer inspiratory times are seen. D, Sine waveform used in volume control ventilation. Higher PIP can be seen. (Modified from Lian JX: Understanding ventilator waveforms and how to use them in patient care. Nurs Crit Care 2009; 4[1]:43-55.)
Loops
Flow-Volume and Pressure-Volume Loops
Flow-volume loops represent flow rates versus inspiratory and expiratory volumes. In forced (spontaneous) breathing, total lung capacity (TLC) and residual volume (RV) are values along the x-axis (zero flow), and the FVC is calculated from the difference of these two values. Peak flow rates at the highest (expiratory) and lowest (inspiratory) points of the loop are at extremes along the y-axis. Flow-volume loops may be used to evaluate compliance changes, effects of bronchodilator therapy (resistance changes), auto-PEEP, air trapping, and air leaks.
Normal Loops
Pressure-volume loops have unique characteristics depending on the mode of ventilation. A spontaneous breath loop will show both negative and positive pressures. Negative pressures may be absent if PEEP is applied during the respiratory cycle. The respiratory cycle moves in a clockwise rotation, starting with inhalation and ending with exhalation (Fig. 9-14). Although flow resistance across the tracheal tubes may be seen with vital capacity maneuvers with sizes as large as 7 and 8 mm, normal tidal volume flows are sufficiently low to make such flow limitations minimal.72 This minimal limitation assumes the absence of secretions, kinking, and other obstructions that would decrease the inner diameter of the tracheal tube and increase flow resistance.72
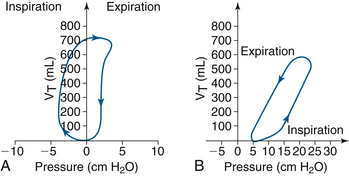
FIGURE 9-14 A, The spontaneous breath progresses clockwise, starting at zero, with tidal volume (VT) on the y-axis. B, Ventilator-initiated volume control pressure-volume loop. In this instance, positive end-expiratory pressure is 5 cm H2O and cycles counterclockwise. (Modified from Lian JX: Understanding ventilator waveforms and how to use them in patient care. Nurs Crit Care 2009; 4[1]:43-55.)
Mechanical ventilation of a paralyzed patient’s lungs is different because negative pressure is not generated except in the event of an equipment malfunction. Also, inspiration requires an increase in airway pressure, and exhalation requires a decrement in pressure. The loop cycle thus moves counterclockwise with positive-pressure ventilation (Fig. 9-15).
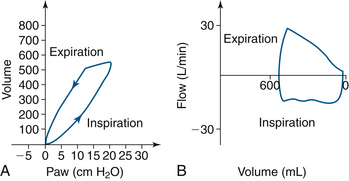
FIGURE 9-15 Normal loops in a mechanically ventilated paralyzed patient, with airway pressure (Paw) on the x-axis. A, Normal pressure-volume curve. B, Normal flow-volume curve. (Modified from Bardoczky GI, Engelman E, D’Hollander A: Continuous spirometry: an aid to monitoring ventilation during operation. Br J Anaesth 1993; 71[5]:747-751.)
Although the loops in these figures are idealized, a variety of other loop variations depend on the ventilation mode and the flow pattern selected by the clinician.
Compliance and Resistance Optimization
Pressure-volume loops show bowing and widening as airway resistance increases. The slope of the loop decrease and flatten as compliance decreases (Figs. 9-16 and 9-17).
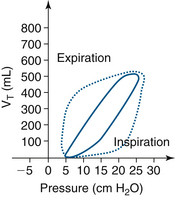
FIGURE 9-16 Pressure-volume loop, with tidal volume (VT) on the y-axis. The solid line is a normal loop and the dotted line is a bowed, or widened, loop that signifies an increase in airway resistance.
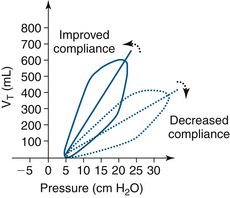
FIGURE 9-17 A comparison of a normal pressure-volume loop (solid line) and the dotted line loop with a decreased slope, indicating decreased compliance, with tidal volume (VT) on the y-axis.
Compliance is defined as change in volume per unit change in pressure (∆V/∆P) and is not fixed, but rather varies with functional residual capacity (FRC).73 The application of PEEP to the circuit may increase FRC and improve compliance; this is titrated by examining the pressure-volume loop as PEEP is increased, noting the change in slope of the curve.
Loops Related to Equipment Issues
Equipment issues are independent of patient disease. These can include malposition of the tracheal tube to equipment malfunctions. Using pressure-volume and flow-volume loops continuously can help identify resultant changes in resistance and/or compliance to minimize the potentially negative impact of these events on a patient.
Intubation
Endobronchial Intubation
Endobronchial intubation will demonstrate decreased expiratory flow with single-lung ventilation. The pressure-volume curve also behaves as expected with lower volumes and higher pressures (decreased compliance; Fig. 9-18).
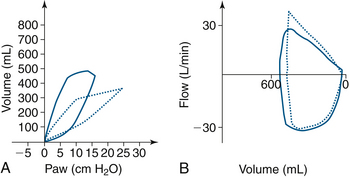
FIGURE 9-18 Volume-pressure and flow-volume loops that demonstrate changes from a right mainstem endobronchial intubation. The dotted line loop in A shows a right and downward shift in the curve, with airway pressure (Paw) on the x-axis. B shows decreased expiratory flow. The solid line loops show loop correction when the endotracheal tube was withdrawn 3 cm.
Esophageal Intubation
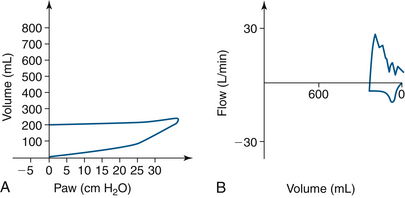
High pressure is accompanied by low volume when attempts are made to ventilate the noncompliant esophagus. The flow-volume loop is irregular with low volume and variable flow (Fig. 9-19).
Kinked Tracheal Tube
Kinking of the tracheal tube decreases the volume delivered and increases the pressure, as shown in the pressure-volume curve. This decrease in volume and flow is shown in the flow-volume loop (Fig. 9-20).
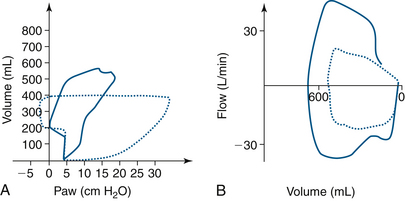
FIGURE 9-20 Endotracheal tube kinking in the dotted line pressure-volume loop in A shows a right and downward shift with increased loop area and increased inspiratory pressure. B, The expiratory and inspiratory portions of the dotted flow-volume loop are diminished. The solid lines, or normal loops, were measured during a laparoscopic abdominal procedure. Paw, airway pressure.
Capnography and Volumetric Capnography
Capnography is the visual, time-based monitoring of carbon dioxide; capnometry is the digital display of data. Volumetric capnography combines the use of carbon dioxide monitoring and a pneumotachograph. All are used to assess adequacy of ventilation by analyzing exhaled carbon dioxide throughout the respiratory cycle.74 Although arterial blood gas analysis of carbon dioxide is the gold standard,75 carbon dioxide levels may change rapidly, and continuous monitoring of this parameter is desirable or, at the very least, comforting. Methods include electrochemical or optical sensors or direct sampling for a gas chromatograph or mass spectrometer.75 (Time-based capnography is discussed in detail in Chapter 10, and volumetric capnography is covered in Chapter 8.)
Capnographic monitoring of end-tidal carbon dioxide does not detect breathing system disconnects as rapidly as do the pressure alarms, but it identifies problems that are either detected too slowly or not at all. Its ability encompasses esophageal intubation, disconnection, cardiac output changes, inadequate pulmonary circulation, and air embolism. Clinically, its rapid rise is an early indicator of malignant hyperthermia, seen before tachycardia, cyanosis, tachypnea, and other signs and symptoms. Other benefits include detection of valve malfunctions and exhausted carbon dioxide absorbent.24
This essential monitor should not be used in isolation. Integrated with other clinical indicators, it can frequently identify patient issues before hemoglobin oxygen desaturation and changes in heart rate and blood pressure are evident.
Apnea and Disconnect Monitoring
As a circuit disconnect alarm, continuous end-tidal carbon dioxide monitoring is considered the most sensitive method to detect a disconnection or cessation of ventilation. It is slower to alarm than the pressure alarms but is an excellent redundant monitor for such a purpose. During general anesthetics and moderate sedation, it alerts faster than other vital sign monitors—such as pulse oximetry and other, later indicators of extubation and obstruction—compared with capnography.
Capnography frequently is used by personnel other than anesthesiologists for monitoring during moderate sedation. Studies conducted in locations such as the endoscopy suite and the emergency department have shown that capnography identifies hypoventilation and apnea that go undetected by care providers before the onset of hypoxia.76,77
Continuous Carbon Dioxide Monitoring
Continuous monitoring of end-tidal carbon dioxide is a noninvasive method of estimating the arterial partial pressure of carbon dioxide (PaCO2) and is derived from a capnographic representation of carbon dioxide relative to time. An algorithm determines the carbon dioxide value at the end of the expiratory plateau. Accuracy depends on accurate sampling of pure expired gas, preferably from a tracheally intubated patient. This measurement method is significantly affected by respiratory disorders that produce diffusion barriers and is also dependent on normal pulmonary perfusion. (For more on continuous carbon dioxide monitoring, see Chapters 8 and 10.)
Transcutaneous Carbon Dioxide Monitoring
Transcutaneous carbon dioxide monitoring has been available since the 1970s. Generally speaking, it uses either electrochemical or optical sensors. A noninvasive, continuous, real-time system for measuring transcutaneous partial pressure of CO2 (TcPCO2) is commercially available (SenTec AG, Therwil, Switzerland). The SenTec V-Sign sensor is attached to the earlobe and provides TcPCO2 as well as pulse oximeter oxygen saturation (SpO2) and pulse rate data. An algorithm is used to calculate TcPCO2 from the measured cutaneous PCO2 (PcCO2), an algorithm that accounts for temperature and metabolic correction factors. The TcPCO2 values displayed by the SenTec digital monitor are corrected and normalized to 37° C and provide an estimate of PaCO2 at 37° C.
Volumetric Capnography and Oxigraphy
With the ability to measure CO2 concentration and minute ventilation in near real time comes the ability to calculate CO2 production (VCO2). The measurement of inspired and expired oxygen concentrations also allows for volumetric oxigraphy and oxygen consumption (VO2) determination. Dividing the two (VCO2/VO2) yields the respiratory exchange ratio (see Chapter 8).
Display of Ventilation Data
Ventilator-Integrated Displays
Most modern anesthesia and critical care ventilators provide, at the very least, a numeric display of commonly used variables such as rate, tidal volume, and inspiratory/expiratory (I:E) ratio. Many also provide a display of airway pressure over time, perhaps also depicting the location of high- and low-pressure alarm limits. These are stand-alone displays, in that they do not depend on other monitors or external devices for their function.
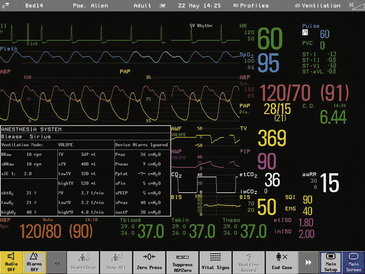
Monitor-Integrated Displays
The next step up in display sophistication integrates the digital output from a ventilator into a combined display, usually in combination with hemodynamic data. Physiologic monitors with modular construction, such as those from Philips Respironics (Wallingford, CT) and Hewlett-Packard (Dayton, OH), allow the insertion of a ventilator monitoring module and the display of volumes and pressures. In addition, they offer the option of visual display of pressure versus time, flow versus time, or other curves. These modular links are specific to the physiologic monitor and normally accept data from the most common anesthesia ventilators (Fig. 9-21).
Data Link from Ventilators
Even today, the output from ventilators, ventilator monitors, and respiratory mechanics sensors proceeds at a relatively low data rate. The most common interfaces are simple serial outputs that typically run at 19,200 Baud or less.78 This common interface makes data transmission and interface design relatively straightforward and simple. Experiments with Ethernet connectivity have been done, but the future seems to lie with wireless data transmission.79 The challenges involve data security, verification, and accurate patient identification and tracking as both patients and hardware become more mobile.
Practice Parameters
ASA standards for basic anesthetic monitoring were approved by the ASA House of Delegates on October 21, 1986, and were last amended on October 20, 2010, with an effective date of July 1, 2011. The statements that pertain to pressure and volume monitoring are included Box 9-3. The monitoring equipment needed to meet these standards is now part of every anesthesia delivery system. All contemporary workstations include spirometry for exhaled volume; inhaled volume also is included in many, and all include pressure monitoring and alarms.
As with other monitoring devices and technology, complications may be due to pure device failure or vulnerable monitoring devices, but more commonly they are attributable to user error. Some flow sensors require zeroing or calibration because water accumulation in monitoring tubing may cause spurious readings of flow and volume. Flow sensors commonly are concealed within the workstation; breakage therefore may not be obvious as the source of a breathing circuit leak.
Contemporary ventilation monitoring systems are highly reliable and are integrated with sophisticated, prioritized alarm systems. It is essential that the anesthesia caregiver understand how to use them correctly and how to set appropriate alarm limits and audible alarm volumes, so that critical incidents do not go undetected and adverse outcomes are prevented.
References
1. Hunter J. Proposals for the recovery of people apparently drowned. Philosophical Transactions of the Royal Society of London. 1776;66:412–425.
2. Guedel A.R. Inhalation anesthesia: a fundamental guide. New York: Macmillan; 1937.
3. Baker S.P., Hitchcock F.A. Immediate effects of inhalation of 100% oxygen at one atmosphere on ventilation volume, carbon dioxide output, oxygen consumption and respiratory rate in man. J Appl Physiol. 1957;10(3):363–366.
4. Kory R.C. Routine measurement of respiratory rate: an expensive tribute to tradition. JAMA. 1957;165(5):448–450.
5. Krieger B., Feinerman D., Zaron A., Bizousky F. Continuous noninvasive monitoring of respiratory rate in critically ill patients. Chest. 1986;90(5):632–634.
6. Bowdle T.A. Adverse effects of opioid agonists and agonist-antagonists in anaesthesia. Drug Safety. 1998;19(3):173–189.
7. Ibarra E., Lees D. Mass spectrometer monitoring of patients with regional anesthesia. Anesthesiology. 1985;63:572–573.
8. Fukuda K., Ichinohe T., Kaneko Y. Is measurement of end-tidal CO2 through a nasal cannula reliable? Anesthesia Progress. 1997;44(1):23–26.
9. Ashutosh K., Gilbert R., Auchincloss J.H., Erlebacher J., Peppi D. Impedance pneumograph and magnetometer methods for monitoring tidal volume. J Appl Physiol. 1974;37(6):964–966.
10. Houtveen J.H., Groot P.F., de Geus E.J. Validation of the thoracic impedance-derived respiratory signal using multilevel analysis. Int J Psychophysiol. 2006;59(2):97–106.
11. Wilkinson J.N., Thanawala V.U. Thoracic impedance monitoring of respiratory rate during sedation: is it safe? Anaesthesia. 2009;64(4):455–456.
12. Freundlich J.J., Erickson J.C. Electrical impedance pneumography for simple nonrestrictive continuous monitoring of respiratory rate, rhythm and tidal volume for surgical patients. Chest. 1974;65(2):181–184.
13. Khambete N., Metherall P., Brown B., Smallwood R., Hose R. Can we optimize electrode placement for impedance pneumography? Ann N Y Acad Sci. 1999;873:534–542.
14. Network E.U.E. Thoracic impedance measurements can interfere with impedance-based rate-responsive pacemakers. Health Devices. 1997;26:393–394.
15. Tobin M.J., Jenouri G., Lind B., et al. Validation of respiratory inductive plethysmography in patients with pulmonary disease. Chest. 1983;83(4):615–620.
16. Brouillette R.T., Morrow A.S., Weese-Mayer D.E., Hunt C.E. Comparison of respiratory inductive plethysmography and thoracic impedance for apnea monitoring. J Pediatr. 1987;111(3):377–383.
17. Moody G.B., Mark R.G., Zoccola A., Mantero S. Derivation of respiratory signals from multi-lead ECGs. Comput Cardiol. 1985;12:113–116.
18. Hok B., Wiklund L., Henneberg S. A new respiratory rate monitor: development and initial clinical experience. Int J Clin Monit Comput. 1993;10(2):101–107.
19. Dodds D., Purdy J., Moulton C. The PEP transducer: a new way of measuring respiratory rate in the non-intubated patient. J Accid Emerg Med. 1999;16:26–28.
20. Zhu X., Chen W., Nemoto T., et al. Real-time monitoring of respiration rhythm and pulse rate during sleep. IEEE Trans Biomed Eng. 2006;53(12 Pt 1):2553–2563.
21. Macknet M.R., et al. Accuracy and tolerance of a novel bioacoustic respiratory sensor in pediatric patients. Available at www.rcjournal.com/abstracts/2007/?id=aarc07_199.
22. Macintosh R. Physics for the anaesthetist, ed 4. Boston: Blackwell Scientific; 1987.
23. Abstracts of the 1998 Joint Meeting of the Society for Technology in Anesthesia and the Rochester Simulator Symposium: Simulation in Anesthesia. J Clin Monit Comput. 1998;14(7):511–539.
24. Winter A., Spence A.A. An international consensus on monitoring? Br J Anaesth. 1990;64(3):263–266.
25. McEwen J., Small C., Jenkins L. Detection of interruptions in the breathing gas of ventilated anaesthetized patients. Can J Anaesth. 1988;35(6):549–561.
26. Raphael D.T., Weller R.S., Doran D.J. A response algorithm for the low-pressure alarm condition. Anesth Analg. 1988;67(9):876–883.
27. Marini J.J., Ravenscraft S.A. Mean airway pressure: physiologic determinants and clinical importance. Part 2: Clinical implications. Crit Care Med. 1992;20(11):1604–1616.
28. Campbell R.M., Sheikh A., Crosse M.M. A study of the incorrect use of ventilator disconnection alarms. Anaesthesia. 1996;51(4):369–370.
29. Milligan K.A. Disablement of a ventilator disconnect alarm by a heat and moisture exchanger. Anaesthesia. 1992;47(3):279.
30. Slee T.A., Pavlin E.G. Failure of low pressure alarm associated with the use of a humidifier. Anesthesiology. 1988;69(5):791–792.
31. Chung D.C., Ho A.M.H., Tay B.A. “Apnea-volume” warning during normal ventilation of the lungs: an unusual leak in the Narkomed 4 anesthesia system. J Clin Anesth. 2001;13(1):40–43.
32. Snyders S., Mitton M. Failure of a flow sensor of a Datex Ohmeda S/5 Aespire. Anaesthesia. 2005;60(9):941–942.
33. Hari M., Jennings M., Mitton M. Flow sensor fault causing ventilator malfunction. Anaesthesia. 2005;60(10):1049–1051.
34. Aldridge J. Leak on Datex Aestiva/5 anaesthetic machine. Anaesthesia. 2005;60(4):420–421.
35. Dhar P., George I., Mankad A., Sloan P. Flow transducer gas leak detected after induction. Anesth Analg. 1999;89(6):1587.
36. Bowes W.A., 3rd., Corke B.C., Hulka J. Pulse oximetry: a review of the theory, accuracy, and clinical applications. Obstet Gynecol. 1989;74(3 Pt 2):541–546.
37. Bardoczky G.I., Engelman E.E. Comparison of airway pressures from different measuring sites. Anesth Analg. 1996;83(4):887.
38. Lian J.X. Understanding ventilator waveforms and how to use them in patient care. Nurs Crit Care. 2009;4(1):43–55.
39. Spielman F.J., Sprague D.H. Another benefit of the subatmospheric alarm. Anesthesiology. 1981;54(6):526.
40. Walker T. Another problem with a circle system. Anaesthesia. 1996;51(1):89.
41. Bashein G.M.D., MacEvoy B. Anesthesia ventilators should have adjustable high-pressure alarms. Anesthesiology. 1985;63(2):231–233.
42. Campos C., Naguib S.S., Chuang A.Z., Lemak N.A., Khalil S.N. Endobronchial intubation causes an immediate increase in peak inflation pressure in pediatric patients. Anesth Analg. 1999;88(2):268–270.
43. West J. Respiratory physiology: the essentials, ed 8. Baltimore: Lippincott, Williams & Wilkins; 2008. pp 17–19
44. Wright B.M. A respiratory anemometer. J Physiol (London). 1955;127:25.
45. Bushman J. Effect of different flow patterns on the Wright respirometer. Br J Anaesth. 1979;51(9):895–898.
46. Ilsley A., Hart J., Withers R., Roberts J. Evaluation of five small turbine-type respirometers used in adult anesthesia. J Clin Monit Comput. 1993;9(3):196–201.
47. Hatch D.J., Jackson E.A. A new critical incident monitor for use with the paediatric T-piece. Anaesthesia. 1996;51(9):839–842.
48. Goto T., Saito H., Nakata Y., et al. Effects of xenon on the performance of various respiratory flowmeters. Anesthesiology. 1999;90(2):555–563.
49. Lynnworth L.C., Korba J.M., Wallace D.R. Fast response ultrasonic flowmeter measures breathing dynamics. IEEE Trans Biomed Eng. 1985;32(7):530–535.
50. Kuppers K.. An improved apparatus for measuring gasesGermany. 1909. Deutsches patent and Markenamt
51. Ball C., Westhorpe R. Maximilian Neu and the first anaesthetic rotameter. Anaesth Intensive Care. 1999;27:333.
52. Foregger R. Early use of rotameter in anaesthesia. Br J Anaesth. 1952;24(3):187–195.
53. Moore J.K., Railton R. Hypoxia caused by a leaking rotameter: the value of an oxygen analyser. Anaesthesia. 1984;39(4):380–381.
54. Gupta B.L., Varshneya A.K. Anaesthetic accident caused by unusual leakage of rotameter [letter]. Br J Anaesth. 1975;47(7):805.
55. McQuillan P.J., Jackson I.J. Potential leaks from anaesthetic machines: potential leaks through open rotameter valves and empty cylinder yokes. Anaesthesia. 1987;42(12):1308–1312.
56. Slater E.M. Transposition of rotameter bobbins. Anesthesiology. 1974;41(1):101.
57. Cooke R. Transposition of rotameter tubes. Br J Anaesth. 1998;80(5):699.
58. Fleisch A. The pneumotachometer [in German]. Arch Ges Physiol. 1925;209:713–722.
59. Yeh M.P., Adams T.D., Gardner R.M., Yanowitz F.G. Effect of O2, N2, and CO2 composition on nonlinearity of Fleisch pneumotachograph characteristics. J Appl Physiol. 1984;56(5):1423–1425.
60. Meriläinen P., Hänninen H., Tuomaala L. A novel sensor for routine continuous spirometry of intubated patients. J Clin Monit Comput. 1993;9(5):374–380.
61. Bardoczky G.I., deFrancquen P., Engelman E., Capello M. Continuous monitoring of pulmonary mechanics with the sidestream spirometer during lung transplantation. J Cardiothorac Vasc Anesth. 1992;6(6):731–734.
62. Søndergaard S., Kárason S., Lundin S., Stenqvist O. Evaluation of a pitot type spirometer in helium/oxygen mixtures. J Clin Monit Comput. 1998;14(6):425–431.
63. Tham R., Oberle M. How do flow sensors work? APSF Newsletter. 2008:10–12.
64. Kann T., Hald A., Jørgensen F.E. A new transducer for respiratory monitoring: a description of a hot-wire anemometer and a test procedure for general use. Acta Anaesth Scand. 1979;23(4):349–358.
65. Kiełbasa J. Measurement of gas flow velocity: anemometer with a vibrating hot wire. Rev Sci Instrum. 81(1), 2010. 015101
66. Brusasco V., Beck K.C., Crawford M., Rehder K. Resonant amplification of delivered volume during high-frequency ventilation. J Appl Physiol. 1986;60(3):885–892.
67. Eberhart R.C., Weigelt J.A. Respiratory monitoring: current techniques and some new developments. Bull Eur Physiopathol Respir. 1985;21(3):295–300.
68. Lynnworth L.C., Liu Y. Ultrasonic flowmeters: half-century progress report, 1955-2005. Ultrasonics. 2006;44(Suppl 1):e1371–e1378.
69. Kästner S.B., Marlin D.J., Roberts C.A., Auer J.A., Lekeux P. Comparison of the performance of linear resistance and ultrasonic pneumotachometers at rest and during lobeline-induced hyperpnoea. Res Vet Sci. 2000;68(2):153–159.
70. Pierce R. Spirometry: an essential clinical measurement. Aust Fam Physician. 2005;34(7):535–539.
71. Bardoczky G.I., Engelman E., D’Hollander A. Continuous spirometry: an aid to monitoring ventilation during operation. Br J Anaesth. 1993;71(5):747–751.
72. Weissman C. Flow-volume relationships during spontaneous breathing through endotracheal tubes. Crit Care Med. 1992;20:615–620.
73. Lumb A.B. Elastic forces and lung volumes. Nunn’s applied respiratory physiology. Woburn, MA: Butterworth Heinemann; 2000. p 47
74. Cheifetz I.M., Myers T.R. Should every mechanically ventilated patient be monitored with capnography from intubation to extubation? Respir Care. 2007;52(4):423–438.
75. Eberhard P. The design, use, and results of transcutaneous carbon dioxide analysis: current and future directions. Anesth Analg. 2007;105:S48–S52.
76. Lightdale J.R., Goldmann D.A., Feldman H.A., et al. Microstream capnography improves patient monitoring during moderate sedation: a randomized, controlled trial. Pediatrics. 2006;117(6):e1170–e1178.
77. Deitch K., Chudnofsky C.R., Dominici P. The utility of supplemental oxygen during emergency department procedural sedation with propofol: a randomized, controlled trial. Ann Emerg Med. 2008;52(1):1–8.
78. Respironics Flo-Trak module. Accessed 2012 Oct 5 at http://oem.respironics.com/Downloads/4100306-FloTrak.pdf.
79. Cisco Systems: 802.11ac: The Fifth Generation of Wi-Fi. Available at www.cisco.com/en/US/prod/collateral/wireless/ps5678/ps11983/white_paper_c11-713103_ns767_Networking_Solutions_White_Paper.html. Accessed 4 Nov 2012