Chapter 13 Strong Ion Approach to Acid-Base Disorders
“Assumptions can be dangerous, especially in science. They usually start as the most plausible or comfortable interpretation of the available facts. But when their truth cannot be immediately tested and their flaws are not obvious, assumptions often graduate to articles of faith, and new observations are forced to fit them. Eventually, if the volume of troublesome information becomes unsustainable, the orthodoxy must collapse.”
Determination of the mechanisms underlying acid-base disturbances has been an important clinical goal for more than 100 years. Landmark advancements in the clinical diagnosis and treatment of acid-base disturbances have included the Henderson-Hasselbalch equation (1916), the base excess (BE) concept (1960), calculation of the anion gap (AG) (1970s),41 introduction of the strong ion approach,50 and the simplified strong ion approach,5 and development of the strong ion gap (SIG) concept.6,30,32
The two main goals of acid-base assessment are to identify and quantify the magnitude of an acid-base disturbance and to determine the mechanism for the acid-base disturbance by identifying changes in variables that independently alter acid-base balance.5,14 Independent variables influence a system from the outside and cannot be affected by changes within the system or by changes in other independent variables. In contrast, dependent variables are influenced directly and predictably by changes in the independent variables. Singer and Hastings proposed in 194847 that plasma pH was determined by two independent factors, Pco2 and net strong ion charge, equivalent to the strong ion difference (SID, or the difference in charge between fully dissociated strong cations and anions in plasma). Stewart suggested in 1983 that a third variable, [Atot] or the total plasma concentration of nonvolatile weak buffers (e.g., albumin, globulins, and phosphate), also exerted an independent effect on plasma pH.50 One of Stewart’s major contributions to clinical acid-base physiology was his proposal that plasma pH was determined by three independent factors: Pco2, SID, and [Atot] (Figure 13-1). An understanding of the three independent variables (Pco2, SID, Atot) is required to apply the strong ion approach to acid-base disorders in dogs and cats.
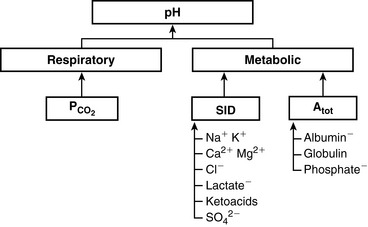
Figure 13-1 Determinants of plasma pH at 37° C as assessed by the simplified strong ion model. Both [SID+] and [Atot] provide independent measures of the nonrespiratory (metabolic) component of plasma pH.
(From Stämpfli HR, Constable PD. Experimental determination of net protein charge and Atot and Ka of nonvolatile buffers in human plasma. J Appl Physiol 2003;95:620–630.)
Pco2
Carbon dioxide tension can be changed by alveolar ventilation, which has a profound effect on [ ] and pH. Approximately 50% of the daily variability of [
 ] in normal dogs can be attributed to changes in Pco2 alone. The dependent nature of the relationship between [
 ] and Pco2 is best appreciated by rearrangement of the Henderson-Hasselbalch equation, whereby:

with pK′a being the negative logarithm of the apparent dissociation constant for carbonic acid (H2CO3) in plasma, and S being the solubility of CO2 in plasma. Because plasma pH is vigorously defended by animals to maintain a homeostatic environment, and because values for pK′a and S are fixed at constant temperature and ionic strength, the dependence of [ ] on Pco2 is clearly appreciated.
Measurement of arterial Pco2 (Paco2) provides the clinician with direct information about the adequacy of alveolar ventilation because Paco2 is inversely proportional to the alveolar ventilation. Increase in Paco2 or respiratory acidosis is caused by and synonymous with hypoventilation, whereas a decrease in Paco2 or respiratory alkalosis is caused by and synonymous with hyperventilation.
SID
Simple ions in plasma can be divided into two main types: nonbuffer ions (strong ions or strong electrolytes) and buffer ions. Strong ions are fully dissociated at physiologic pH and therefore exert no buffering effect. However, strong ions do exert an electrical effect because the sum of completely dissociated cations does not equal the sum of completely dissociated anions. Stewart termed this difference the SID.50 Because strong ions do not participate in chemical reactions in plasma at physiologic pH, they act as a collective positive unit of charge (SID).5,50 The quantitatively most important strong ions in plasma are Na+, K+, Ca2+, Mg2+, Cl−, lactate, ß-hydroxybutyrate, acetoacetate, and  . The influence of strong ions on pH and [
 ] can always be summarized in terms of the SID. Changes in SID of a magnitude capable of altering acid-base balance usually occur as a result of increasing concentrations of Na+, Cl−,
  , or organic anions or decreasing concentrations of Na+ or Cl−. An increase in SID (by decreasing [Cl−] or increasing [Na+]) will cause a strong ion (metabolic) alkalosis, whereas a decrease in SID (by decreasing [Na+] or increasing [Cl−], [
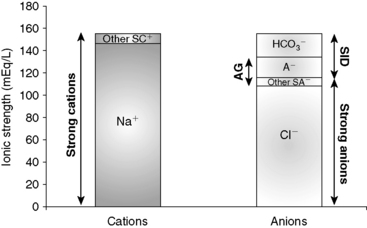
 ], or organic anions) will cause a strong ion (metabolic) acidosis.5,50 A Gamblegram of normal plasma (Figure 13-2) shows the relationship between strong cations, strong anions, and buffer ions (
 and the nonvolatile weak acids, A−). A graphic representation of SID and the AG also is shown in Figure 13-2.
 ) in the second column.
[Atot]
In contrast to strong ions, buffer ions are derived from plasma weak acids and bases that are not fully dissociated at physiologic pH. The conventional dissociation reaction for a weak acid (HA) and its conjugated base (A−) pair is HA ↔ H+ + A−. At equilibrium, an apparent dissociation constant (Ka) can be calculated.5,50 For a weak acid to act as an effective buffer, its pKa (defined as the negative logarithm of the weak acid dissociation constant Ka) lies within the range of pH ± 1.5. Because normal plasma pH is approximately 7.4, substances with a pKa between 5.9 and 8.9 can act as buffers. The main nonvolatile plasma buffers act as weak acids at physiologic pH (e.g., phosphate, imidazole [histidine] groups on plasma proteins). Also known as the non- buffer system, they form a closed system containing a fixed quantity of buffer. The non-
 buffer system consists of a diverse and heterogeneous group of plasma buffers that can be modeled as a single buffer pair (HA and A−). An assumption in Stewart’s strong ion model is that HA and A− do not take part in plasma reactions that result in the net destruction or creation of HA or A−. When HA dissociates, it ceases to be HA (therefore decreasing plasma [HA]) and becomes A− (therefore increasing plasma [A−]). The total amount of A, or Atot, is the sum of A in dissociated [A−] and undissociated [HA] forms, which remain constant according to the law of conservation of mass.5,50
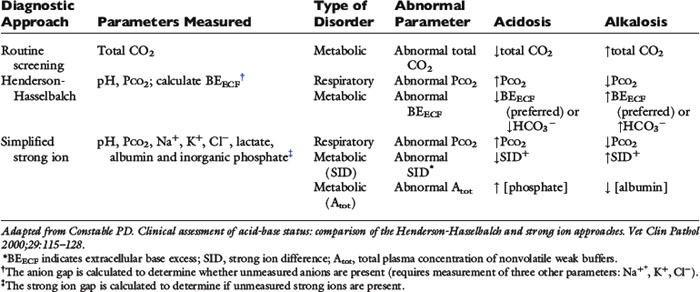
The great advantage of Stewart’s strong ion approach is that it provides a mechanistic view as to why pH is changing and fully integrates electrolyte and acid-base physiology. However, his approach is heavily mathematical and states that pH is a function of eight factors50 (for comparison, the Henderson-Hasselbalch equation is mathematically simpler, stating that pH is a function of four factors, whereas Constable’s simplified strong ion equation states that pH is a function of six factors).5 With that in mind, this chapter will focus on the concepts behind the strong ion approach, emphasizing the relationship between weak and strong ions and acid-base balance and developing an understanding of why pH and [ ] are changing. Frameworks adapting the strong ion approach to clinical uses also will be reviewed. The mathematical and physicochemical background of this approach is described in detail elsewhere.* A comparison of diagnostic approaches using routine screening (total CO2), the Henderson-Hasselbalch approach, and the simplified strong ion approach is shown in Table 13-1.
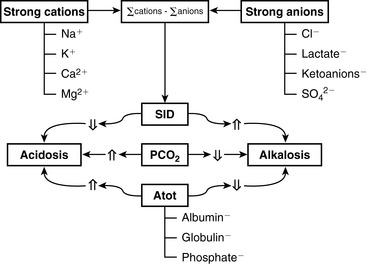
Because clinically important acid-base derangements result from changes in Pco2, SID, or Atot, the strong ion approach distinguishes six primary acid-base disturbances (respiratory, strong ion, or nonvolatile buffer ion acidosis and alkalosis; Figure 13-3) instead of the traditional four primary acid-base disturbances (respiratory or metabolic acidosis and alkalosis) characterized by the Henderson-Hasselbalch equation.5,7,8,13 Acidemia (decrease in plasma pH) results from an increase in Pco2 and nonvolatile buffer concentrations (albumin, globulin, phosphate) or from a decrease in SID. Alkalemia (increase in plasma pH) results from a decrease in Pco2 and nonvolatile buffer concentration or from an increase in SID.
Disorders of Pco2
Increases in Pco2 are associated with respiratory acidosis, whereas decreases in Pco2 lead to respiratory alkalosis. There are no differences between the Henderson-Hasselbalch approach and the strong ion approach in relation to Pco2. See Chapter 11 for further discussion of respiratory acid-base disorders.
Disorders of [Atot]
Albumin, globulins, and inorganic phosphate are nonvolatile weak acids and collectively are the major contributors to [Atot]. Consequently, changes in their concentrations will directly change pH, and this represents a major philosophical difference between the strong ion and Henderson-Hasselbalch approaches. There are two general mechanisms by which Atot can change: (1) an increase in plasma albumin, phosphate, or globulin concentrations; and (2) a decrease in plasma albumin, phosphate, or globulin concentrations. Changes in plasma albumin, phosphate, or globulin concentrations can occur in response to a change in the distribution volume for the three factors (denominator effect; clinically equivalent to changes in plasma free water for albumin and globulin, and changes in extracellular fluid volume for phosphate). Changes in plasma albumin, phosphate, or globulin concentrations and therefore the value for Atot can also occur due to increases or decreases in the total number of moles in plasma or extracellular fluid with no change in the distribution volume (numerator effect).
Values for the total plasma concentration of nonvolatile weak acids and the effective dissociation constant (Ka) for plasma nonvolatile buffers are species specific. Values for Atot and Ka have been experimentally determined in the plasma of humans,49 cats,37 and dogs12 and theoretically determined for the plasma of humans.8 Canine and feline plasma proteins have a greater net negative charge than human plasma proteins because their albumin contributes proportionally more to net protein charge, has a different amino acid composition, and carries a greater net negative charge at physiologic pH. These characteristics explain the higher AG in dogs and cats because the AG in healthy dogs and cats essentially reflects the total protein concentration. Atot in dogs is 17.4 mmol/L (equivalent to 0.27 mmol/g of total protein or 0.47 mmol/g of albumin), whereas Ka is 0.17 × 10⁻⁷ (pKa = 7.77).12 Atot in cats is 24.3 mmol/L (equivalent to 0.35 mmol/g of total protein or 0.76 mmol/g of albumin), whereas Ka is 0.67 × 10⁻⁷ (pKa = 7.17).37
The contribution of proteins to Atot has been determined in vitro for dogs.12 The net protein charge of canine plasma at pH = 7.40 is approximately 16 mEq/L, equivalent to 0.25 mEq/g of total protein or 0.42 mEq/g of albumin. The overall effect of a 1-g/dL increase in total protein concentration is a decrease in pH of 0.047.
The contribution of proteins to Atot has been determined in vitro for cats.37 The net protein charge of feline plasma at pH = 7.40 is approximately 14 mEq/L, equivalent to 0.19 mEq/g of total protein or 0.41 mEq/g of albumin. The overall effect of a 1-g/dL increase in total protein concentration is a decrease in pH of 0.093.
The contribution of phosphate to Atot can be estimated by first converting phosphate concentration to mmol/L and then multiplying by its valence. One millimole (atomic weight in milligrams) of phosphate has 31 mg of elemental phosphorus. Thus the phosphate concentration in mg/dL can be converted to mmol/L by dividing by 3.1. The valence of phosphate changes with pH, but at a pH of 7.4, it is 1.8. Thus a phosphorus concentration of 5 mg/dL is equivalent to 1.6 mmol/L and 2.88 mEq/L at a pH of 7.4.
Nonvolatile buffer ion alkalosis
Hypoalbuminemia
The fact that hypoalbuminemia tends to increase pH and cause metabolic alkalosis was first identified in people in 1986 by McAuliffe et al.36 Phosphate is quantitatively the second most important component of [Atot] and normally is present in plasma at a low concentration (<4 mmol/L). Therefore hypophosphatemia is not a clinically important cause of nonvolatile buffer ion (metabolic) alkalosis. Globulin is quantitatively the third most important component of [Atot]; however, decreases in plasma globulin concentration usually accompany decreases in plasma albumin concentration. In other words, nonvolatile buffer ion alkalosis in dogs and cats is usually due to hypoalbuminemia.
The effects of a decrease in Atot (Atot alkalosis) on [ ] are shown in a Gamblegram in Figure 13-4. Hypoproteinemic alkalosis has been identified clinically in dogs and cats.18,32,52 In vitro, a 1-g/dL decrease in albumin concentration is associated with an increase in pH of 0.093 in cats37 and 0.047 in dogs.12 The increase in pH secondary to hypoalbuminemia should result in ventilatory compensation (hypoventilation) or a decrease in SID because plasma pH is vigorously defended and any deviation in pH from the optimal range for a given core temperature will be energetically inefficient. Data are not currently available regarding the presence or absence of ventilatory compensation for nonvolatile buffer ion alkalosis in dogs or cats. However, compensatory hypoventilation and increased Pco2 have been documented in human patients with hypoalbuminemic alkalosis.32,36 In contrast, hyperventilation and decreased Pco2 were identified in humans with congestive heart failure and cirrhosis, although it is likely that hyperventilation may have been induced by the underlying diseases and not by the metabolic acid-base disorder.45 Metabolic compensation with decreased SID caused by an increase in chloride concentration occurs in human patients with hypoproteinemic alkalosis.36,54
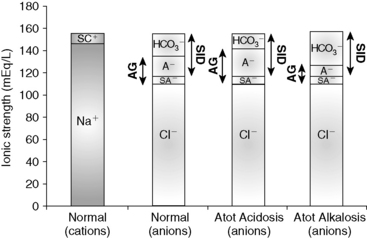
Figure 13-4 Gamblegram of normal plasma and change in ionic strength of weak anions with increased (Atot acidosis) and decreased (Atot alkalosis) concentration of nonvolatile weak acids. SID does not change, but anion gap (AG) is increased in Atot acidosis and decreased in Atot alkalosis. Na+, Sodium; SC+, other strong cations; Cl−, chloride; SA−, other strong anions; A−, net charge of nonvolatile buffers;  , bicarbonate.
The most common causes of hypoproteinemic alkalosis are shown in Box 13-1. Hypoalbuminemic alkalosis is common in the critical care setting.22 Presence of hypoalbuminemia complicates identification of increased unmeasured anions (e.g., lactate, ketoanions) because hypoproteinemia not only increases pH but also decreases AG.20,24,28 Thus the severity of the underlying disease leading to metabolic acidosis may be underestimated if the effects of hypoalbuminemia on pH, [ ], and AG are not considered. Calculation of the SIG is therefore preferred in dogs and cats with hypoalbuminemia because hypoproteinemia will not alter the SIG. Treatment for hypoalbuminemic alkalosis should be directed at the underlying cause and the decreased colloid oncotic pressure.
Nonvolatile buffer ion acidosis
Hyperphosphatemia
Hyperphosphatemia, especially if severe, can cause a large increase in [Atot], leading to metabolic acidosis (see Box 13-1). Although extremely rare, an increase in albumin concentration also can lead to metabolic acidosis.46 A Gamblegram representing Atot acidosis is shown in Figure 13-4. The most important cause of hyperphosphatemic acidosis is renal failure. Metabolic acidosis in patients with renal failure is multifactorial but mostly is caused by hyperphosphatemia and increases in unmeasured strong anions such as sulfate.40,44 Hyperphosphatemic acidosis also has been observed after hypertonic sodium phosphate enema administration in cats.2 In experimental cats that have been given hypertonic sodium phosphate enemas, serum phosphate concentration changed from a mean of 2.8 mEq to 8.1 mEq/L within 15 minutes after a 60-mL dose and from 2.3 mEq/L to 8.8 mEq/L within 30 minutes with a 120-mL dose.2 In both groups, the increase in [SID] was enough to offset the increase in lactate concentration, whereas protein concentration did not change. Because Pco2 also did not change, the metabolic acidosis could be caused by an increase in unmeasured anions or phosphate, but an increase in any organic acid other than lactate would have been unlikely. Using the data from this study, a strong correlation can be found between changes in phosphate and changes in BE (r = 0.95 with the 60-mL dose, and r = 0.96 with the 120-mL dose). More than 90% of the change in the AG in the first 4 hours can be explained entirely by changes in lactate and phosphate. Clinically, hyperphosphatemic acidosis also occurred in a cat that received a phosphate-containing urinary acidifier.26 Treatment for hyperphosphatemic acidosis should be directed at the underlying cause. Sodium bicarbonate administered intravenously may be used as adjunctive therapy in patients with hyperphosphatemic acidosis3 because the increase in plasma sodium concentration results in an increase in plasma SID (strong ion alkalosis) expansion of the extracellular fluid volume (which is the distribution space for phosphorus), and increased urine production. The combined effect of these changes is to decrease plasma phosphorus concentration.
Disorders of SID
Changes in SID usually are recognized by changes in [ ], BE, [Na+], or [Cl−] from their reference values. It is important to understand that the change in SID from normal is equivalent to the change in [
 ] or BE from normal whenever the plasma concentrations of nonvolatile buffer ions (albumin, phosphate, globulin) are normal.7 In other words, the Henderson-Hasselbalch and strong ion approaches are equivalent whenever plasma albumin, phosphate, and globulin concentrations are within their reference ranges. It is also important to realize that the sodium-chloride difference ([Na+] – [Cl−]) provides a clinically valuable index of SID, particularly in animals that do not have hyperlactatemia.
A decrease in SID results in a strong ion (metabolic) acidosis, whereas an increase in SID results in a strong ion (metabolic) alkalosis.5,7 There are three general mechanisms by which SID can change (Table 13-2): (1) an increase in strong anions relative to strong cations; (2) a decrease in strong anions relative to strong cations; and (3) a change in the free water content of plasma (change in extracellular fluid volume) with no change in strong anions relative to strong cations.
Table 13-2 Mechanisms for SID Changes
| Disorder | Mechanism | Clinical Recognition |
|---|---|---|
| SID Acidosis | ||
 In strong cations In strong cations |
 Free water ( Free water ( Sodium) Sodium) |
Dilutional acidosis |
 In strong anions In strong anions |
 Chloride Chloride |
Hyperchloremic acidosis |
 Unmeasured strong anions Unmeasured strong anions |
Organic acidosis | |
| SID Alkalosis | ||
 In strong cations In strong cations |
 Free water ( Free water ( Sodium) Sodium) |
Concentration alkalosis |
 In strong anions In strong anions |
 Chloride Chloride |
Hypochloremic alkalosis |
SID Alkalosis
There are three general mechanisms by which SID can increase, leading to metabolic alkalosis: an increase in [Na+], a decrease in [Cl−], or a decrease in plasma free water, which occurs commonly in dehydration. Strong cations other than sodium are tightly regulated, and changes of a magnitude that could affect SID clinically either are not compatible with life or do not occur. Conversely, chloride is the only strong anion present in sufficient concentration to cause an increase in SID when its concentration is decreased. Common causes of SID alkalosis are presented in Box 13-2.


Concentration Alkalosis
Concentration alkalosis develops whenever a deficit of free water in plasma occurs and is recognized clinically by the presence of hypernatremia or hyperalbuminemia. Solely decreasing the content of water increases the plasma concentration of all strong cations and strong anions and thus increases SID (Figure 13-5). This decrease in water content also increases Atot, but the increase in SID has a greater effect on pH.11 A decrease in extracellular fluid (ECF) volume alone will not alter acid-base status because such a decrease in volume does not change any of the independent variables and therefore cannot change acid-base status (see Chapter 4 for more information). However, if the decrease in ECF volume is associated with a relatively greater loss of free water as in diabetes insipidus or hypotonic losses in animals with diarrhea, vomiting, or osmotic diuresis, then an acid-base change (concentration alkalosis) will result because of the increase in SID. Hypernatremia and increased SID also can be associated with sodium gain in animals with hyperadrenocorticism or in those treated with isotonic or hypertonic NaHCO3 because the effective SID of NaHCO3 solutions is high, whereas animals treated with isotonic or hypertonic NaCl will have hypernatremia and decreased SID because the effective SID of NaCl solutions is 0 mEq/L.11 Hypernatremia is further discussed in Chapter 3. Therapy for concentration alkalosis should be directed at treating the underlying cause responsible for the change in [Na+]. If necessary, [Na+] and osmolality should be corrected (see Chapter 3).
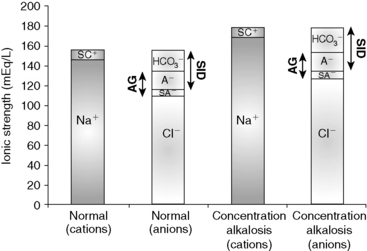
Figure 13-5 Gamblegram of normal plasma and change in ionic strength of anions and cations secondary to a decrease in free water content in plasma (concentration alkalosis). All anions and cations, as well as SID and anion gap (AG), increase proportionally in patients with concentration alkalosis. Na+, Sodium; SC+, other strong cations; Cl−, chloride; SA−, other strong anions; A−, net charge of nonvolatile buffers;  , bicarbonate.
Hypochloremic Alkalosis
If there is no change in the water content of plasma, plasma [Na+] will be normal. Other strong cations (e.g., Mg2+, Ca2+, K+) are regulated for purposes other than acid-base balance, and their concentrations never change sufficiently to substantially affect SID. Consequently, when water content is normal, SID changes only as a result of changes in strong anions. If [Na+] remains constant, decreases in [Cl−] can increase SID (so-called hypochloremic alkalosis; Figure 13-6). Primary decreases in [Cl−] unrelated to increases in plasma water content are recognized by the presence of a low corrected chloride concentration (see Chapter 4). Hypochloremic alkalosis may be caused by an excessive loss of chloride relative to sodium or by administration of substances containing more sodium than chloride as compared with normal ECF composition. Excessive loss of chloride relative to sodium as compared with normal ECF composition can occur in the urine after administration of diuretics that cause chloride wasting (e.g., furosemide) or when the fluid lost has a low or negative SID as in the case of vomiting of stomach contents. The administration of substances containing more sodium than chloride (e.g., NaHCO3) also increases SID, causing metabolic alkalosis.
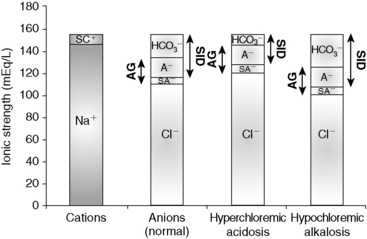
Figure 13-6 Gamblegram of normal plasma and change in ionic strength of anions secondary to increases (hyperchloremic acidosis) or decrease (hypochloremic alkalosis) in chloride (Cl−) content in plasma. SID is decreased in hyperchloremic acidosis and increased in hypochloremic alkalosis, whereas anion gap (AG) remains constant during primary chloride changes. Na+, Sodium; SC+, other strong cations; SA−, other strong anions; A−, net charge of nonvolatile buffers;  , bicarbonate.
A particular type of hypochloremic alkalosis that does not respond to chloride administration alone (as NaCl) is called chloride-resistant metabolic alkalosis and usually is caused by hyperadrenocorticism or hyperaldosteronism. Increased concentrations of cortisol or aldosterone cause sodium retention by activating the type I renal mineralocorticoid receptors.53 Experimentally, administration of desoxycorticosterone acetate (DOCA) twice daily in sodium-supplemented dogs caused a significant increase in [Na+] and [ ] with no change in [Cl−].35 When NaHCO3 was added to the diet instead of NaCl, [Na+] and [
 ] increased significantly, but [Cl−] decreased.35 Approximately 30% of dogs with hyperadrenocorticism have mild hypernatremia.34,38 In a study of 117 dogs with hyperadrenocorticism,34 only 12 had [Cl−] less than 105 mEq/L. However, 25 of these dogs had hypernatremia, and the [Cl−], although within the normal range, could have been low relative to the [Na+] (i.e., corrected hypochloremia). The mean [Na+] was 150 mEq/L; the mean [Cl−] was 108 mEq/L; and the mean [Cl−] after correcting for changes in free water was 105 mEq/L. The corrected hypochloremia that occurs in the presence of high mineralocorticoid or glucocorticoid concentrations likely is responsible for the mild metabolic alkalosis observed in these patients. The lack of response to NaCl can be explained by a resetting of the regulatory mechanism and associated increased urinary loss of chloride.29 Thus in so-called chloride-resistant metabolic alkalosis, something (e.g., excessive mineralocorticoid activity) prevents chloride retention, and consequently SID cannot be lowered by chloride administration.
Therapy of chloride-responsive hypochloremic alkalosis is directed at correcting the SID with a solution containing chloride (e.g., 0.9% NaCl, lactated Ringer’s solution, K Cl−supplemented fluids). In cases in which expansion of extracellular volume is desired, intravenous infusion of 0.9% NaCl is the treatment of choice. Corrected hypochloremia and hypochloremic alkalosis are discussed more in Chapters 4 and 10.
SID Acidosis
Three general mechanisms can cause SID to decrease, resulting in SID (metabolic) acidosis: (1) a decrease in [Na+]; (2) an increase in [Cl−]; and (3) an increased concentration of other strong anions (e.g., L-lactate in lactic acidosis, ß-hydroxybutyrate in diabetic ketoacidosis, sulfate in uremic acidosis). Common causes of SID acidosis are presented in Box 13-3.


 unmeasured strong anions)
Dilutional Acidosis
Dilutional acidosis occurs whenever there is an excess of water in plasma and is recognized clinically by the presence of hyponatremia. Increasing the water content of plasma decreases the concentration of all strong cations and strong anions, and thus SID (Figure 13-7). The increase in water content also decreases Atot, but the decrease in SID has a greater effect on pH.11 An increase in ECF volume alone will not alter acid-base status because such an increase in volume does not change any of the independent variables (see Chapter 4). However, if the increase in ECF volume is associated with a relatively greater addition of free water, then an acid-base change (dilutional acidosis) will result primarily because of the decrease in SID.
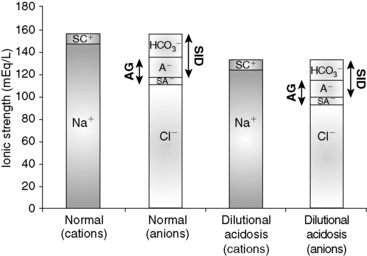
Figure 13-7 Gamblegram of normal plasma and change in ionic strength of anions and cations secondary to an increase in free water content in plasma (dilution acidosis). All anions and cations, as well as SID and anion gap (AG), decrease proportionally in patients with dilution acidosis. Na+, Sodium; SC+, other strong cations; Cl−, chloride; SA−, other strong anions; A−, net charge of nonvolatile buffers;  , bicarbonate.
Large increases in free water are necessary to cause an appreciable decrease in SID. It has been estimated that in dogs and cats, a decrease in [Na+] by 20 mEq/L is associated with a 5-mEq/L decrease in BE.15 Dilutional acidosis has been associated with congestive heart failure, hypoadrenocorticism, third space loss of sodium, and hypotonic fluid administration. However, hyponatremia in dogs most commonly is caused by gastrointestinal loss of sodium. Hyponatremia is further discussed in Chapter 3. Therapy for dilutional acidosis should be directed at the underlying cause of the change in [Na+]. If necessary, [Na+] and osmolality should be corrected (see Chapter 3).
Hyperchloremic Acidosis
Increases in [Cl−] can substantially decrease SID, leading to so-called hyperchloremic acidosis (see Figure 13-6). Hyperchloremic acidosis may be caused by chloride retention (e.g., early renal failure, renal tubular acidosis), excessive loss of sodium relative to chloride (e.g., diarrhea), or by administration of substances containing more chloride than sodium as compared with normal ECF composition (e.g., administration of 0.9% NaCl). Administration of 0.9% NaCl is a common cause of hyperchloremic acidosis in hospitalized patients16 and is the classic example of strong ion acidosis.10,11 Treatment of hyperchloremic acidosis should be directed at correction of the underlying disease process. Special attention should be given to plasma pH. Sodium bicarbonate can be administered whenever plasma pH is less than 7.20 because it has a high effective SID. Corrected hyperchloremia and hyperchloremic acidosis are further discussed in Chapters 4 and 10.
SID Acidosis Caused by an Increase in Unmeasured Strong Anions (Organic Acidosis)
Accumulation of metabolically produced organic anions (e.g., L-lactate, acetoacetate, citrate, ß-hydroxybutyrate) or addition of exogenous organic anions (e.g., salicylate, glycolate from ethylene glycol poisoning, formate from methanol poisoning) will cause metabolic acidosis because these strong anions decrease SID (Figure 13-8). Accumulation of some inorganic strong anions (e.g.,  in renal failure) will resemble organic acidosis because these substances decrease SID. The pK values for the clinically most important organic anions are as follows: lactate = 3.9, acetoacetate = 3.6, citrate = 4.3, and ß-hydroxybutyrate = 4.4. Thus the pK values of these ions are at least 3 pH units below normal plasma pH, and at a pH of 7.4, the concentrations of their dissociated forms are at least 1000 times greater than the concentrations of the nondissociated forms. For example, at a pH of 7.4 for each molecule of lactic acid, there are approximately 3200 molecules of lactate. Thus it can be assumed that these organic acids are completely dissociated within the pH range of body fluids compatible with life and consequently behave as strong ions. The most frequently encountered causes of organic acidosis in dogs and cats are renal failure (uremic acidosis), diabetic ketoacidosis, lactic acidosis, and ethylene glycol toxicity. Management of organic acidosis should be directed at stabilization of the patient and treatment of the primary disorder. Sodium bicarbonate may help patients in renal failure with acidosis but its efficacy remains controversial in patients with lactic acidosis or ketoacidosis. The efficacy of NaHCO3 therapy in renal failure is because the increase in plasma sodium concentration results in an increase in plasma SID (strong ion alkalosis); expansion of the extracellular fluid volume, which is the distribution space for phosphorus; and increased urine production. The combined effect of these changes is to decrease the plasma phosphorus concentration. The initial goal in acidemic patients with renal failure is to increase systemic pH to more than 7.20. Sodium bicarbonate should be used cautiously in lactic acidosis or ketoacidosis because subsequent metabolism of accumulated organic anions will further increase [
 ], potentially leading to excessive alkalinization. Organic acidoses are further discussed in Chapter 10.
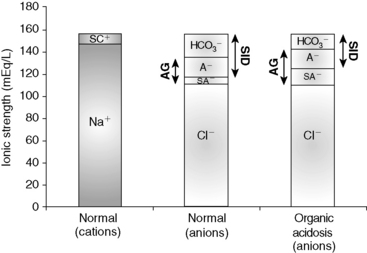
Figure 13-8 Gamblegram of normal plasma and change in ionic strength of anions secondary to increases in unmeasured strong anions (organic acidosis) in plasma. SID is decreased in organic acidosis, whereas anion gap (AG) is increased because of increase in unmeasured strong anions. Na+, Sodium; SC+, other strong cations; SA−, other strong anions; A−, net charge of nonvolatile buffers;  , bicarbonate.
Clinical approach
Three simplified approaches have been developed to allow the clinical use of Stewart’s strong ion approach: the effective SID method also known as the Stewart-Figge methodology,25 the BE approach, or Fencl-Stewart algorithm,23 and Constable’s simplified strong ion equation.5 Clinical application of these approaches has been helpful in identifying complex metabolic derangements in critically ill humans,4 dogs,19 calves,13 and pigs43; however, the clinical utility of these approaches has not appear to have been extensively investigated in cats.
Effective SID Model
Figge et al25 developed and successfully tested in humans a mathematical approach to evaluate metabolic acid-base disorders. Unmeasured strong ions (XA−) are estimated by subtracting the “effective SID” (SIDeff), an approximation of the “real” SID, from the “apparent SID” (SIDapp) as XA− = SIDapp – SIDeff. The SIDapp is calculated using electrolytes measured in the serum (SIDapp = [Na+] + [K+] + [Mg2+] + [Ca2+] – [Cl−]), and SIDeff is a satisfactory approximation of the “real SID.” Despite being a very promising model for assessment of metabolic acid-base disorders, Stewart-Figge’s model was developed using protein behavior based on human albumin and has not been tested in dogs or cats. Moreover, calculation of SIDeff is not simple and may be clinically impractical, and the approach has been shown to be less accurate in human plasma than calculating the SIG using Constable’s simplified strong ion equation.49
Base excess algorithm
BE has been used to assess changes in the metabolic component because SID is synonymous with buffer base. BE is a measurement of the deviation of buffer base (and therefore SID) from normal values, assuming nonvolatile buffer ion concentrations (albumin, phosphate, globulin) are normal. However, it should be pointed out that Siggaard-Andersen studied human blood with a constant protein concentration. A BE nomogram has been developed for dogs21 using Siggaard-Andersen’s approach. However, the canine nomogram has rarely been used because blood gas analyzers use the van Slyke equation to calculate BE from measured values for pH, Pco2, and hemoglobin concentration.7 Because blood gas analyzers were developed for the human medical market, the van Slyke equation uses values that assume human blood is being analyzed.
The BE has been used clinically for more than a decade to assess the metabolic acid-base status in human patients54 and has been adapted for use in dogs and cats.15,18 This approach attempts to take into account the effect that changes in sodium (i.e., dilutional acidosis and concentration alkalosis), chloride (i.e., hypochloremic alkalosis and hyperchloremic acidosis), phosphate (i.e., hyperphosphatemic acidosis), and plasma protein (i.e., hypoproteinemic alkalosis and hyperproteinemic acidosis) concentrations exert on plasma pH, purportedly facilitating identification and quantification of unmeasured strong ions (i.e., organic acidosis) in plasma. Values less than −5 mmol/L are suggestive of an increase in unmeasured strong anions.15 Formulas to estimate changes in BE resulting from changes in SID and Atot are presented in Box 13-4. A complete description of the derivation of these formulas, as well as their limitations, can be found elsewhere.7 The BE algorithm is a useful clinical tool despite a few shortcomings. These formulas were helpful in understanding complex acid-base disorders in dogs and cats.18,32,52 Unfortunately, no controlled clinical studies have been performed in dogs and cats with acid-base disturbances to assess the accuracy of these formulas, and there are theoretical limitations in extrapolating traditional BE calculations for use in dogs and cats.17 In addition, the influence of protein on BE is estimated based on data for human albumin, which behaves differently than canine and feline albumin.
Box 13-4 Estimation of Change in Base Excess Caused by Changes in [SID] and [Atot]


Changes in Base Excess Caused By Changes in [SID]


Contribution from Unidentified Strong Anions (Δ [XA-] in mEq/L)
SID, Strong ion difference; [Atot], total plasma concentration of nonvolatile weak buffers; [alb]normal, normal albumin concentration (midpoint) in g/dL; [alb]patient, patient’s albumin concentration in g/dL; [Phosphate]patient, patient’s inorganic phosphorus concentration in mmol/L or mg/dL; [Na+]patient, patient’s sodium concentration in mEq/L; [Na+]normal, normal sodium concentration (midpoint) in mEq/L; [Cl−]normal, normal chloride concentration (midpoint) in mEq/L; [Cl−]corrected, patient’s corrected chloride concentration in mEq/L; [BE]patient, patient’s base excess in mEq/L. Reference values for the author’s laboratory: [alb]normal = 3.1 g/dL; [Na+]normal = 156 mEq/L for cats and 146 mEq/L for dogs; [Cl−]normal, = 120 mEq/L for cats and 110 mEq/L for dogs.
Adapted from de Morais HSA, Muir WW. Strong ions and acid-base disorders. In: Bonagura JD, editor. Kirk’s current veterinary therapy XII, 12th ed. Philadelphia: WB Saunders, 1995: 121–127.
Simplified strong ion equation
Constable’s simplified strong ion equation assumes that plasma ions act as strong ions, volatile buffer ions ( ), or nonvolatile buffer ions (A−).5 Therefore plasma contains three types of charged entities: SID,
  , and A−. The requirement for electroneutrality dictates that at all times the SID equals the sum of bicarbonate buffer ion activity (
 ) and nonvolatile buffer ion activity (A−) such that SID+ =
  – A−. This approach obviously assumes that all ionized entities in plasma can be classified as a strong ion, a volatile buffer ion, or a nonvolatile buffer ion (A−). This assumption forms the basis for the simplified strong ion equation. A complete description of the mathematical background of the simplified strong ion model, as well as its limitations, can be found elsewhere.5,7
The simplified strong ion approach is a quantitative, mechanistic acid-base model. Unlike Stewart’s strong ion equation, the simplified strong ion equation uses hydrogen ion activity (pH) instead of concentration, provides a practical experimental method for determining species-specific values for Ka and Atot (CO2 tonometry of plasma), and simplifies to the Henderson-Hasselbalch equation when applied to aqueous nonprotein solutions (where Atot = 0 mEq/L and SID = [ ]).5,7 The simplified strong ion model also explains many of the anomalies of the Henderson-Hasselbalch equation. It explains why the apparent value for pK1′ in plasma is dependent on pH, protein concentration, and sodium concentration and also provides a mechanistic explanation for the temperature dependence of plasma pH.5 The simplified strong ion model shares two of the disadvantages of Stewarts strong ion model: (1) difficulty in accurately determining SID, and (2) mathematical complexity when compared with the traditional Henderson-Hasselbalch equation. It is unlikely that the simplified strong ion approach will replace the traditional Henderson-Hasselbalch approach clinically and in descriptive experimental studies because two (pH and Pco2) of the three (pH, Pco2, and [
 ]) unknowns in the Henderson-Hasselbalch equation can be measured accurately and easily in plasma, whereas only two (pH and Pco2) of the four unknowns in the simplified strong ion approach (pH, Pco2, SID, and Atot) can be measured easily and accurately. However, in mechanistic experimental studies, the simplified strong ion model is preferred because it conveys on a fundamental level the mechanisms underlying acid-base disturbances.5,7
Strong ion gap
The SIG concept is a modification of the simplified strong ion equation that overcomes one of the limitations of this model, namely, algebraic complexity. SIG is the difference in charge between all unmeasured strong anions and all unmeasured strong cations.6 Because there are more strong cations than strong anions, normal SIG is positive:

where [ ] is the sum of all unmeasured strong cations (e.g., ionized calcium, ionized magnesium), whereas [
 ] is the sum of all unmeasured strong anions (e.g., ketoanions, lactate, sulfate). The calculated value of the SIG will change depending on the strong ions measured. The most important strong cations in plasma based on their concentration are Na+ and K+, whereas the most prevalent strong anion is Cl−. Thus SIG can be defined in its simplest form when only these three strong ions are measured as:

where [ ] is the sum of all strong cations other than [Na+] and [K+], and [
 ] is the sum of all strong anions other than [Cl−]. Electroneutrality must be maintained in plasma, and the excess of positive charges from the SIG is balanced by the negative charges of
  and the nonvolatile buffers [A−]. Thus electroneutrality can be expressed as:

because
or

Based on the relationship above, the SIG has been simplified (SIGsimplified) so as to allow an estimation based on [Atot] (the sum of [A−] and its weak acid pair [HA]) and AG.6 Albumin is used to estimate [Atot] in the SIGsimplified because albumin is the most important buffer in plasma. At a normal plasma pH of 7.4, SIGsimplified can be calculated from the albumin concentration in g/dL in dogs as:12

In cats, at a normal plasma pH of 7.35, SIGsimplified can be calculated from the albumin concentration in g/dL as:37

An increase in unmeasured strong anions is suspected whenever SIGsimplified is less than 5 mEq/L. In patients with hyperphosphatemia, however, AG should be corrected for the presence of hyperphosphatemia {AGphosphate-adjusted = AG + (2.52 – 0.58×[Phosphate])} before calculating SIGsimplified. The SIGsimplified offers a more accurate approach to identifying unmeasured strong ions in plasma than does the AG. The critical difference between the AG and SIGsimplified is that the SIGsimplified provides an estimate of the difference between unmeasured strong cations and strong anions, whereas AG provides an estimate of the difference between unmeasured cations and anions (including strong ions and nonvolatile buffer ions such as albumin, globulins, and phosphate). Therefore a change in SIGsimplified provides a more specific method for detecting a change in unmeasured strong ions (such as lactate) than does a change in AG. The SIGsimplified has not been adequately tested in dogs and cats, but its derivation is sound, and it is superior to the AG in detecting increases in unmeasured strong anion concentration in horses,6 cattle,9 and pigs.43 It remains to be determined whether SIG or SIGsimplified provides a more clinically useful tool for quantifying unidentified strong anions than the corrected AG (AGc). The latter corrects the AG for changes in the plasma albumin concentration by assigning the net charge assigned to albumin at physiologic pH (7.40) and the deviation in albumin concentration from its normal value of 3.8 g/dl for the dog and 3.3 g/dL for the cat. The corrected AG equation for the dog is:

and the corrected AG equation for the cat is:

Conclusion
Use of the traditional Henderson-Hasselbalch equation for the evaluation of acid-base status using pH, Pco2, and [ ] has several clinically relevant limitations. It does not give a complete assessment of the sources of pathophysiologic changes in the metabolic component ([
 ]); it may lead to the conclusion that changes in electrolytes are only secondarily related to acid-base status; and it does not recognize changes in pH caused by changes in protein or inorganic phosphate concentrations. The strong ion model is compared with the traditional Henderson-Hasselbalch approach to acid-base disturbances in Table 13-3. Using the strong ion model, the relationship between electrolytes and acid-base status becomes clear, and it becomes apparent that they should no longer be viewed as separate entities. The end result is a better understanding of how acid-base disorders develop and how they should be treated. It is hoped that improved patient care will follow enhanced understanding of the pathophysiologic principles underlying acid-base disturbances.
Table 13-3 Comparison of the Traditional Henderson-Hasselbalch Approach to Acid-Base Disturbances to the Strong Ion Model
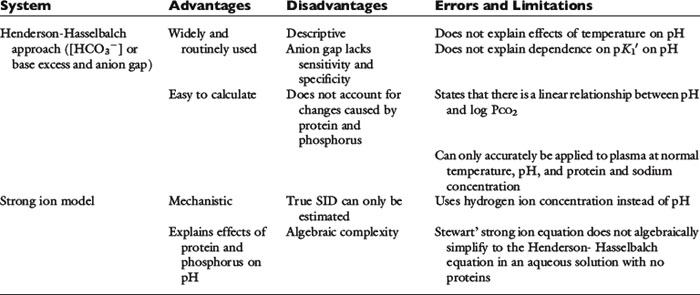
It should be appreciated that the strong ion approach to acid-base balance has been criticized and the bicarbonate-centered acid-base approach provided by the Henderson-Hasselbalch equation continues to be preferred by some investigators and clinicians.1,31,42 Clearly, the strong ion approach is more time consuming than are conventional methods, and therefore it is less convenient in daily practice.39 This argument is particularly true in patients with normal protein and phosphate concentrations, in which the traditional Henderson-Hasselbalch approach in conjunction with an estimation of unmeasured anions works well as a first approximation of a more complex system and is therefore the preferred method. In critically ill patients or patients with multiple problems, the Stewart approach provides a more comprehensive evaluation of acid-base status and greater insight into their possible causes and most appropriate therapy.
1 Adrogue H.J., Gennari F.J., Galla J.H., et al. Assessing acid-base disorders. Kidney Int. 2009;76:1239-1247.
2 Atkins C.E., Tyler R., Greenlee F. Clinical, biochemical, acid-base, and electrolyte abnormalities in cats after hypertonic sodium phosphate enema administration. Am J Vet Res. 1985;46:980-988.
3 Barsotti G., Lazzeri M., Cristofano C., et al. The role of metabolic acidosis in causing uremic hyperphosphatemia. Miner Electrolyte Metab. 1986;12:103-106.
4 Boniatti M.M., Cardoso P.R., Castilho R.K., et al. Acid-base disorders evaluation in critically ill patients: we can improve our diagnostic ability. Intensive Care Med. 2009;35:1377-1382.
5 Constable P.D. A simplified strong ion model for acid-base equilibria: application to horse plasma. J Appl Physiol. 1997;83:297-311.
6 Constable P.D., Hinchcliff K.W., Muir W.W. Comparison of anion gap and strong ion gap as predictors of unmeasured strong ion concentration in plasma and serum from horses. Am J Vet Res. 1998;59:881-887.
7 Constable P.D. Clinical assessment of acid-base status: comparison of the Henderson-Hasselbalch and strong ion approaches. Vet Clin Pathol. 2000;29:115-128.
8 Constable P.D. Total weak acid concentration and effective dissociation constant of nonvolatile buffers in human plasma. J Appl Physiol. 2001;91:1364-1371.
9 Constable P.D. Calculation of variables describing plasma nonvolatile weak acids for use in the strong ion approach to acid-base balance in cattle. Am J Vet Res. 2002;63:482-490.
10 Constable P.D. Hyperchloremic acidosis: the classic example of strong ion acidosis. Anesth Analg. 2003;96:919-922.
11 Constable P.D. In response: Letters to the editor. Anesth Analg. 2004;98:271-272.
12 Constable P.D., Stämpfli H.R. Experimental determination of net protein charge and Atot and Ka of nonvolatile buffers in canine plasma. J Vet Intern Med. 2005;19:507-514.
13 Constable P.D., Staempfli H.R., Navetat H., Berchtold J., Schelcher F. Use of a quantitative strong ion approach to determine the mechanism for acid-base abnormalities in sick calves with or without diarrhea. J Vet Intern Med. 2005;19:581-589.
14 Corey H.E. Stewart and beyond: new models of acid-base balance. Kidney Int. 2003;64:777-787.
15 de Morais H.S.A. A nontraditional approach to acid-base disorders. In: DiBartola S.P., editor. Fluid therapy in small animal practice. Philadelphia: WB Saunders; 1992:297-320.
16 de Morais H.S.A. Chloride disorders: hyperchloremia and hypochloremia. In: DiBartola S.P., editor. Fluid therapy in small animal practice. 2nd ed. Philadelphia: WB Saunders; 2000:73-82.
17 de Morais H.S.A. Has Stewart finally arrived in the clinic? J Vet Intern Med. 2005;19:489-490.
18 DiBartola S.P., de Morais H.S.A. Case examples. In: DiBartola S.P., editor. Fluid therapy in small animal practice. Philadelphia: WB Saunders; 1992:599-688.
19 Durocher L.L., Hinchcliff K.W., DiBartola S.P., et al. Acid-base and hormonal abnormalities in dogs with naturally occurring diabetes mellitus. J Am Vet Med Assoc. 2008;232:1310-1320.
20 Durward A., Mayer A., Skellett A., et al. Hypoalbuminemia in critically ill children: incidence, prognosis, and influence in the anion gap. Arch Dis Child. 2003;88:419-422.
21 Emuakpor D.S., Maas A.H.J., Ruigrok T.J.C., et al. Acid-base curve nomogram for dog blood. Pflugers Archiv. 1976;363:141-147.
22 Fencl V., Jabor A., Kazda A., et al. Diagnosis of metabolic acid-base disturbances in critically ill patients. Am J Respir Crit Care Med. 2000;162:2246-2251.
23 Fencl V., Leith D.E. Stewart’s quantitative acid-base chemistry: applications for biology and medicine. Respir Physiol. 1993;91:1-16.
24 Figge J., Jabor A., Kazda A., et al. Anion gap and hypoalbuminemia. Crit Care Med. 1998;26:1807-1810.
25 Figge J., Rossing T.H., Fencl V.L. The role of proteins in acid-base equilibria. J Lab Clin Med. 1991;117:453-467.
26 Fulton R., Fruechte L. Poisoning induced by administration of a phosphate-containing urinary acidifier in a cat. J Am Vet Med Assoc. 1991;198:8-12.
27 Gilfix B.M., Bique M., Magder S. A physical chemical approach to the analysis of acid-base balance in the clinical setting. J Crit Care. 1993;8:187-197.
28 Hatherill M., Waggie Z., Purves L., et al. Correction of anion gap for albumin in order to detect occult tissue anions in shock. Arch Dis Child. 2002;87:526-529.
29 Jones N.L. Blood gases and acid base physiology, 2nd ed. New York: Thieme Medical Publishers, 1987.
30 Kellum J.A., Kramer D.J., Pinsky M.R. Strong ion gap: a methodology for exploring unexplained anions. J Crit Care. 1995;10:51-55.
31 Kurtz I., Kraut J., Ornelian V., et al. Acid-base analysis: A critique of the Stewart and bicarbonate-centered approaches. Am J Physiol Renal Physiol. 2008;294:F1009-F1031.
32 Leisewitz A.L., Jacobson L.S., de Morais H.S.A., et al. The mixed acid-base disturbances of severe canine babesiosis. J Vet Intern Med. 2001;15:445-452.
33 Leith D.E. The new acid-base: power and simplicity. Proc ACVIM Forum. 1990:449-455. Washington. DC
34 Ling G., Stabenfeldt O.H., Comer K.M., et al. Canine hyperadrenocorticism: pretreatment clinical and laboratory evaluation of 117 cases. J Am Vet Med Assoc. 1979;174:1211-1215.
35 Madias N.E., Bossert W.H., Adrogué H.J. Ventilatory response to chronic metabolic acidosis and alkalosis in the dog. J Appl Physiol. 1984;56:1640-1646.
36 McAuliffe J.J., Lind L.J., Leith D.E., et al. Hypoproteinemic alkalosis. Am J Med. 1986;81:86-90.
37 McCullough S.M., Constable P.D. Calculation of the total plasma concentration of nonvolatile weak acids and the effective dissociation constant of nonvolatile buffers in plasma for use in the strong ion approach to acid-base balance in cats. Am J Vet Res. 2003;64:1047-1051.
38 Meijer J.C. Canine hyperadrenocorticism. In: Kirk R.W., editor. Current veterinary therapy VII. 7th ed. Philadelphia: WB Saunders; 1980:974-978.
39 Moviat M., van Haren F., van der Hoeven H. Conventional or physicochemical approach to intensive care unit patients with metabolic acidosis. Crit Care. 2003;7:R41-R45.
40 Naka T., Bellomo R. Bench-to-bedside review: treating acid-base abnormalities in the intensive care unit-the role of renal replacement therapy. Crit Care. 2004;8:108-114.
41 Oh M.S., Carroll H.J. Current concepts. The anion gap. N Engl J Med. 1977;297:814-817.
42 Rastegar A. Clinical utility of Stewart’s method in diagnosis and management of acid-base disorders. Clin J Am Soc Nephrol. 2009;4:1267-1274.
43 Reinhold P., Hartmann H., Constable P.D. Characterization of acid-base abnormalities in pigs experimentally infected with Chlamydia suis. Vet J. 2010;184:212-218.
44 Rocktaeschel J., Morimatsu H., Uchino S., et al. Acid-base status of critically ill patients with acute renal failure: analysis based on Stewart-Figge methodology. Crit Care. 2003;7:R60-R63.
45 Rossing T.H., Boixeda D., Maffeo H., et al. Hyperventilation with hypoproteinemia. J Lab Clin Med. 1988;112:553-559.
46 Rossing T.H., Maffeo N., Fencl V. Acid-base effects of altering plasma protein concentration in human blood in vitro. J Appl Physiol. 1986;61:2260-2265.
47 Singer R.B., Hastings A.B. An improved clinical method for the estimation of disturbances of the acid-base balance of human blood. Medicine. 1948;27:223-242.
48 Sirker A.A., Rhodes A., Grounde R.M., et al. Acid-base physiology: the traditional and the modern approaches. Anesthesia. 2002;57:348-356.
49 Stämpfli H.R., Constable P.D. Experimental determination of net protein charge and Atot and Ka of nonvolatile buffers in human plasma. J Appl Physiol. 2003;95:620-630.
50 Stewart P.A. Modern quantitative acid-base chemistry. Can J Physiol Pharmacol. 1983;61:1444-1461.
51 Tuhay G., Pein M.C., Masevivius F.D., et al. Severe hyperlactatemia with normal base excess: a quantitative analysis using conventional and Stewart approaches. Crit Care. 2008;12:R66.
52 Whitehair K.J., Haskins S.C., Whitehair J.G., et al. Clinical application of quantitative acid-base chemistry. J Vet Intern Med. 1995;9:1-11.
53 Whitworth J.A., Mangos G.J., Kelly J.J. Cushing, cortisol, and cardiovascular disease. Hypertension. 2000;36:912-916.
54 Wilkes P. Hypoproteinemia, strong-ion difference, and acid-base status in critically ill patients. J Appl Physiol. 1998;84:1740-1748.
55 Wooten E.W. Calculation of physiological acid-base parameters in multicompartment systems with application to human blood. J Appl Physiol. 2003;95:2333-2344.
56 Wooten E.W. Science review: quantitative acid-base physiology using Stewart Model. Crit Care. 2004;8:448-452.