23 SUSPECTED ACUTE PULMONARY EMBOLISM
Pulmonary embolism (PE): Obstruction of a pulmonary artery by a thrombus.
Pulmonary infarction: An area of tissue injury resulting from occlusion of a vessel—most commonly by an embolus. The injury may cause oedema and/or haemorrhage. It does not always result in necrosis of lung tissue.
BACKGROUND INFORMATION
 The clinical diagnosis of a PE can be very difficult. The symptoms and signs are varied and diverse, and none are diagnostic1-3. The CXR has no role to play in making a definitive diagnosis of PE. However, it can be useful in:
Continuing advances in multidetector CT scanning technology have established CT pulmonary angiography (CTPA) as the optimum imaging test for confirming or excluding a PE4,5. The present generation of CT machines are able to obtain very thin sections through the entire thorax in seconds. Establishing the precise accuracy of CTPA as a diagnostic test in suspected PE is difficult because meaningful research is constrained by the absence of a gold standard. Currently, the accepted view is that imaging carried out with high quality CTPA is very accurate. What about D-dimer?
The clinical diagnosis of a PE can be very difficult. The symptoms and signs are varied and diverse, and none are diagnostic1-3. The CXR has no role to play in making a definitive diagnosis of PE. However, it can be useful in:
Continuing advances in multidetector CT scanning technology have established CT pulmonary angiography (CTPA) as the optimum imaging test for confirming or excluding a PE4,5. The present generation of CT machines are able to obtain very thin sections through the entire thorax in seconds. Establishing the precise accuracy of CTPA as a diagnostic test in suspected PE is difficult because meaningful research is constrained by the absence of a gold standard. Currently, the accepted view is that imaging carried out with high quality CTPA is very accurate. What about D-dimer?
“D-dimer assays are commonly used as part of the screening assessment for patients with suspected venous thromboembolic disease (VTE). The assay results are best interpreted in conjunction with a formal clinical probability score. As D-dimer levels may be raised in many acute medical conditions, the clinical consensus is that the only useful D-dimer assay is a negative result as that has a high negative predictive value for VTE.”6
The unreliability of clinical assessment in providing a definitive diagnosis of PE, together with the plethora of diagnostic tests5-10, can lead to confusion and errors11. Pre-test probability assessments utilising clinical prediction rules (see Chapter 17) have helped to bring direction to the rational selection and use of the available diagnostic tests2,7.INVESTIGATION OF SUSPECTED ACUTE PE
This two-step approach is based on the British Thoracic Society 2003 Guidelines2.
STEP 1
Clinical risk stratification—ask two clinical questions:
The CXR and electrocardiogram findings may be helpful in suggesting other possible causes for the signs/symptoms.
IS THERE A ROLE FOR ISOTOPE VQ SCANNING?10,12
“PE is often misdiagnosed—partly due to over-reliance on the ventilation perfusion (VQ) scan. It is important that clinicians continue to be awareof the limitations of the VQ Scan”10.

THE ROLE OF THE CXR
The CXR has an important part to play in the diagnostic pathway outlined onp. 291—specifically in step 1.
A LESS IMPORTANT ROLE—BUT OCCASIONALLY USEFUL
An abnormal CXR (Table 23.1) may add strength to the clinical suspicion that a PE has occurred. This follows from the PISA-PED study which found that most patients with proven PE had an abnormality on the CXR3,11. Admittedly, most of these abnormalities are minor and non-specific (Table 23.1).
Table 23.1 CXR appearances in acute PE3,11,12
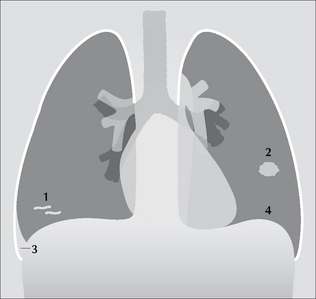
Figure 23.1 The CXR is frequently abnormal in PE—but the changes are usually minor12. Some of these non-specific changes are illustrated: 1 = linear areas of collapse; 2 = small area of consolidation; 3 = small pleural effusion; 4 = elevated dome of the diaphragm.
THE CXR AND TWO OVER-STATED SIGNS
Two CXR signs relating to acute PE are frequently emphasised. You may regard us as distrustful and cynical, but we prefer to see ourselves as streetwise when advising that you do not place too much weight on the presence or absence of either of these two signs.
THE WESTERMARK SIGN
This is a hyperlucent area of lung on the CXR due to reduced lung perfusion distal to an obstructed vessel. Be very careful. Placing too much reliance on an area of hyperlucency in these ill patients is usually unwise. Areas of local (or even whole lung) increased transradiancy (see pp. 254–263) can be produced by:
A hypertransradiant hemithorax is common in clinical practice. In our series, 35% of normal CXRs in people aged 50 years and older showed evidence of hypertransradiancy (see Chapter 16, p. 243).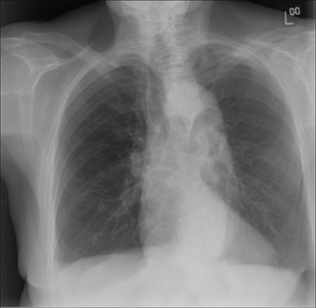
Figure 23.2 Westermark sign? Be careful. Elderly female. Dyspnoeic. A PE is a clinical possibility. The right lung is hypertransradiant (blacker than the left lung). We need to be cautious and not too quick to call this the Westermark sign of PE. Two technical factors are causing the blackening on this CXR: (1) rotation to the right; (2) lateral decentering of the x-ray beam to the right side…this is evident from the increased definition of the scapula and soft tissues on the right side as compared to the left side.
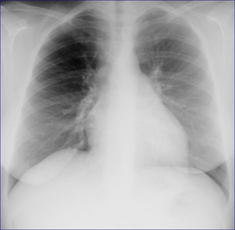
Figure 23.3 Westermark sign? Be very careful. Middle-aged female. Intermediate clinical probability of a pulmonary embolus. The right lung is hypertransradiant (blacker) compared with the left lung. Two technical factors are contributing to this:(1) lateral decentering of the x-ray beam;(2) asymmetric compression of the chest wall soft tissues on the right side. The VQ scan was entirely normal.
HAMPTON’S HUMP SIGN
This is the term given to what is often claimed to be the typical features of lung shadowing resulting from a pulmonary infarct. Hampton’s hump is a wedge shaped density with its base against the pleural surface and a rounded medial margin directed towards the hilum. We have two reservations—particularly if only a frontal CXR is available:
On a frontal CXR a centrally situated density, seemingly well away from the pleura, will not show the features of Hampton’s hump (Fig. 23.4). However, the density could still be based against the pleura, either peripherally in the lung or against a fissure. A lateral CXR may then reveal the characteristic features of Hampton’s hump.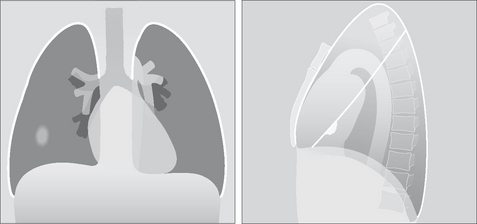
Figure 23.4 Why no hump? The lung shadow produced by an infarct is situated centrally in the right lung. On the frontal view it has no distinguishing features, i.e. no Hampton’s hump features. Only when a lateral CXR is obtained is it seen that the shadow is actually based against the pleura (the oblique fissure)—i.e. it fulfils a Hampton’s hump criterion.
The following are approximations1-3. Of patients with PE:
Death results from acute pulmonary hypertension causing right heart failure and then circulatory collapse.
AN INTERESTING CONDITION—FAT EMBOLISM13
Aetiology/pathology
A complication following fracture of a long bone, extensive soft tissue injury, or severe burns. Fat globules can enter the venous system (thence to the lungs) or the arterial system. It probably occurs—in a mild form—more frequently than is diagnosed.
1. Robinson GV. Pulmonary embolism in hospital practice. BMJ. 2006;332:156-160.
2. British Thoracic Society guidelines for the management of suspected acute pulmonary embolism. Thorax. 2003;58:470-483.
3. Miniati M, Prediletto R, Formichi B, et al. Accuracy of clinical assessment in the diagnosis of pulmonary embolism. Am J Respir Crit Care Med. 1999;159:864-871.
4. Quiroz R, Schoepf UJ. CT pulmonary angiography for acute pulmonary embolism: cost-effectiveness analysis and review of the literature. Semin Roentgenol. 2005;40:20-24.
5. Stein PD, Fowler SE, Goodman LR, et al. Multidetector computed tomography for acute pulmonary embolism. New Engl J Med. 2006;354:2317-2327.
6. Rose P. Very high D-dimers — what do they mean? Thrombus. 2005;9:2.
7. Wells PS, Anderson DR, Bormanis J, et al. Value of assessment of pretest probability of deep vein thrombosis in clinical management. Lancet. 1997;350:1795-1798.
8. Tick LW, Ton E, van Voorthurzen T, et al. Practical diagnostic management of patients with clinically suspected deep vein thrombosis by clinical probability test, compression ultrasonography, and D-dimer test. Am J Med. 2002;113:630-635.
9. Daftary A, Gregory M, Daftary A, et al. Chest radiograph as a triage tool in the imaging-based diagnosis of pulmonary embolism. AJR. 2005;185:132-134.
10. Becket P, Biswas S. Clinicians’ use of the VQ scan for diagnosis of pulmonary embolism. Thrombus. 2005;9:8-9.
11. Miniati M, Pistolesi M, Marini C, et al. Value of perfusion lung scan in the diagnosis of pulmonary embolism: results of the prospective investigative study of acute pulmonary embolism diagnosis (PISA-PED). Am J Respir Crit Care Med. 1996;154:1387-1393.
12. Worsley DF, Alavi A, Aronchick JM, et al. Chest radiographic findings in patients with acute pulmonary embolism: observations from the PIOPED study. Radiology. 1993;189:133-136.
13. Feldman F, Ellis K, Green WM. The fat embolism syndrome. Radiology. 1975;114:535-542.