16 THE RADIOLOGIST’S TOOLBOX
Some CXR appearances will be puzzling. Is the hilum enlarged or is it within the normal range? Where is that thoracic density? Is that shadow normal or abnormal?
Radiologists have a box of tricks—a toolbox—that helps them to sort out most of the puzzles. The box contains a mixed bag of rules, facts and figures. Here are some of the basic tools, a few power tools, and our assessment of 200 normal CXRs in patients aged 50 and older.
THE BASIC TOOLS
TOOL 1—A PREVIOUS CXR
Previous CXRs are the radiologist’s—and your—best friend. You see a real or possible abnormality on the CXR. Was it there before? Has it got larger or smaller? Is it unchanged? A previous CXR will often highlight an important but subtle change. On the other hand it will frequently provide reassurance that all is well.
TOOL 2—THE SILHOUETTE SIGN1,2,3
An intrathoracic lesion touching a border of the heart, aorta, or diaphragm will obliterate part of that border on the radiograph. An intrathoracic lesion which is not anatomically contiguous with a border will not obliterate that border.
See pp. 45–50.
TOOL 3—AIR BRONCHOGRAM SIGN3,4
When the internal tubular outline of a bronchus is visible within a thoracic opacity…that is an air bronchogram.
 It is usually very good news for the patient. An air bronchogram excludes a bronchial obstruction—i.e. the underlying pathological process is highly likely to be benign.
TOOL 4—HILA ASSESSMENT: RULE1
The left hilum should be higher than the right. Occasionally the hila are at the same level…but the right hilum should never be higher than the left (see p. 240).
This toolbox rule is often overlooked by inexperienced observers. If the rule is broken then look carefully for evidence of lobar collapse.
TOOL 5—HILA ASSESSMENT: RULE2
Most (unilateral) enlarged hila are both lumpy/bumpy and denser than the opposite normal side. Some normal hila will appear prominent—but are actually within the normal range. The three questions to ask yourself when a hilum appears equivocal are listed on p. 76.
TOOL 6—THE CARDIAC DENSITY RULE, FRONTAL CXR
The density (opacity) of the cardiac shadow should be equal on both sides of the spine. If there is any difference in density then look for evidence of pneumonia, or lower lobe collapse, or a lower lobe mass on the denser side.
TOOL 7—THE CARDIAC DENSITY RULE, LATERAL CXR
There should be no abrupt change in density across the cardiac shadow. Any abrupt change in density invariably indicates an abnormality in the overlying lung, on either the left or the right side.
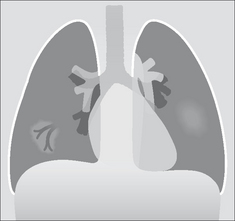
TOOL 8—PERIPHERAL OPACITIES
A peripheral opacity may be obvious, but is it really intrapulmonary? Could it be pleural, or alternatively, extrapleural?
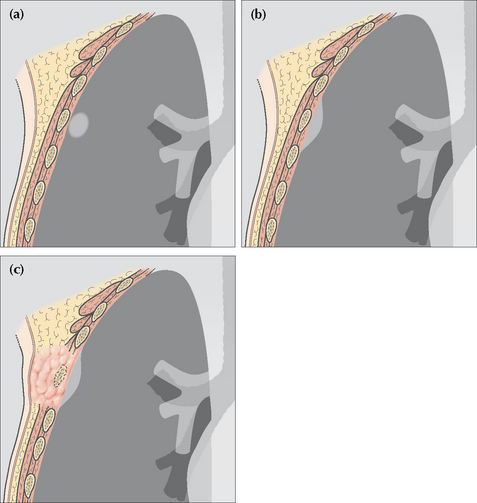
Figure 16.4 (a) Intrapulmonary lesion. Acute angle between the opacity and the adjacent pleural surface. (b) The lesion is not intrapulmonary. It may arise from the pleura or originate outside the pleura. Obtuse angle between the lesion and the adjacent pleural surface. (c) The rib destruction indicates that the extrapleural lesion arises from bone.
TOOL 9—RULES FOR LUNG APICES
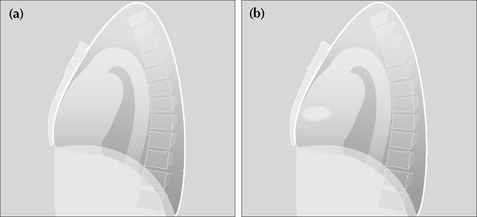
Thickening of the apical pleura—sometimes referred to as an apical cap—occurs in 10% of middle-aged and elderly people (p. 238). Unfortunately, a flat superior sulcus carcinoma (e.g. a Pancoast tumour) can mimic an apical cap. The rules to apply are described in Fig. 16.5.
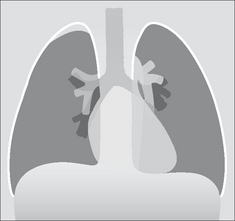
Figure 16.5 An apical pleural cap is present on the right. Apply these rules. (1) A benign apical pleural cap usually has a depth of less than 5 mm5. (2) If bilateral apical caps are present and one is deeper by 5 mm or more, then you need to rule out the possibility that the deeper one represents a superior sulcus tumour. (3) Always check that the ribs adjacent to a pleural cap are intact. (Superior sulcus: the groove in the lung created by the subclavian vessels. Pancoast tumour: the original description by the American radiologist Henry Pancoast, 1875–1939, included specific physical findings. The term is now used somewhat more loosely.)
TOOL 10—THE DESCENDING PULMONARY ARTERIES
Always look for and identify the lower lobe pulmonary arteries…each will have a diameter similar to your little finger. If either is missing you must look for any other CXR features that suggest collapse of a lower lobe (see pp. 58–61). The right lower lobe pulmonary artery is identified just lateral to the cardiac border on approximately 94% of normal CXRs (p. 239). The left descending pulmonary artery will sometimes be more difficult to identify—it is visible in 62% of normal people (p. 239).
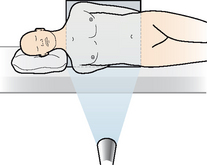
TOOL 11—A HELPFUL TRICK: THE DECUBITUS CXR
| Problem 1: | A CXR may show extensive lower zone shadowing. The question arises: is this mainly pleural fluid or mainly lung consolidation? |
| Problem 2: | Sometimes a dome of the diaphragm appears high, and the configuration raises the possibility of a subpulmonary pleural effusion (p. 82). |
The radiologist can sort out these problems by obtaining a lateral decubitus view. The patient lies with the abnormal side dependent and a cross-table CXR is obtained. Fluid that is free in the pleural space will layer out along the lateral chest wall.
TOOL 12—TWO TRICKS FOR RIBS
 Then turn the original image through 180º (i.e. look at it upside down) and evaluate the ribs in this third position.
Surprisingly, these moves can be helpful. Other distracting anatomy is discounted and the rib outlines stand out (p. 312).
THE POWER TOOLS
POWER TOOL 1—RIGHT PARATRACHEAL STRIPE APPEARANCE3
The wall of the right side of the trachea can be visualised in approximately 60% of adult patients3 (also see p. 242). The air within the trachea outlines its inside margin and the lung air outlines its outside margin. In 40% of normal adults the lung does not abut the outside wall and so this stripe (or line) will not be seen. When the stripe is visible it should measure no more than 2.5 mm in width (see p. 242). If the stripe is wider than 2.5 mm then suspect that there is adjacent lymph node enlargement.
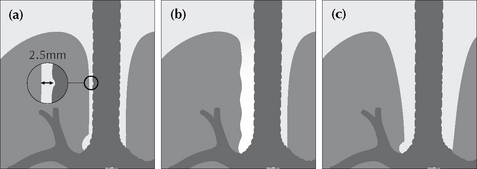
Figure 16.8 (a) Normal right paratracheal stripe. (b) Thickened right paratracheal stripe—it exceeds the normal width of 2.5 mm. Lymphadenopathy should be suspected. Occasionally, widening of the stripe is due to haemorrhage. (c) Caution: superimposition of (age related) unfolded vessels arising from the arch of the aorta must not be mistaken for the paratracheal stripe.
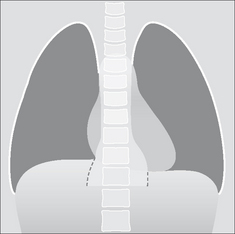
POWER TOOL 2—PARAVERTEBRAL STRIPE DISPLACEMENT6
A left-sided vertical shadow is visualised on most normal frontal CXRs. This shadow is projected between the lateral margin of the descending thoracic aorta and the lateral margin of the thoracic vertebrae. It extends from the level of the arch of the aorta to the diaphragm. This is the left paravertebral stripe. It represents a deflection of the pleura posteriorly by the adjacent descending thoracic aorta (see Figs 8.7–8.9 Fig 8.8 Fig 8.8 on p. 113). A right paravertebral stripe is not visualised until middle age, when age related marginal osteophytes can cause pleural displacement. Two rules:
A visualised right paravertebral stripe is always abnormal…unless age related osteophyte formation is present.NB: the most common pathological processes causing a bump or bulge of a paravertebral stripe are: haematoma following trauma, tumour, or infection arising in the vertebral column.
POWER TOOL 3—THE HILUM CONVERGENCE SIGN3,6
Sometimes referred to as the “hilus bifurcation sign”. It allows an enlarged hilum due to enlarged pulmonary arteries to be distinguished from enlargement due to tumour. The sign is applied as follows:
If the vessels appear to arise or converge medial to the lateral aspect of the hilar shadow—then the enlargement is a mass.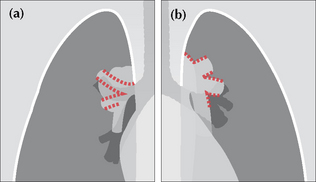
Figure 16.9 Enlarged hila. Apply these rules. (a) If the vessels converge medial to the hilar shadow, then enlargement is due to a mass. (b) If the vessels converge and merge directly on to the hilar shadow, then enlargement is due to enlarged (or prominent) vessels. The vessel walls are outlined in red.
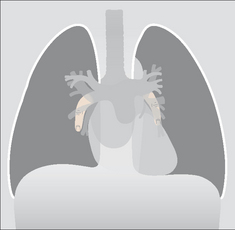
POWER TOOL 4—THE HILUM OVERLAY SIGN3,7
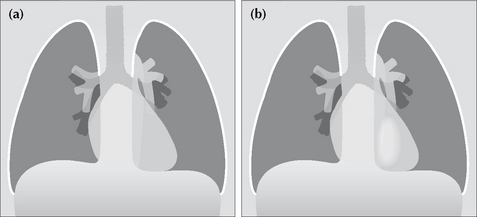
This sign is often misunderstood and misrepresented. The original description carefully distinguished between cardiac enlargement and an anterior mediastinal mass, as follows:
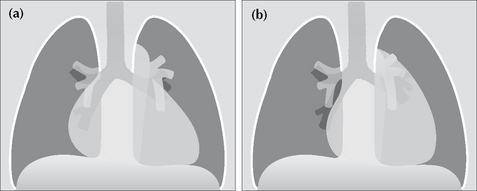
Figure 16.10 Mediastinal enlargement. Apply these rules. (a) If the vessels at the hilum lie lateral to the enlargement—this indicates that the abnormality is due solely to cardiac enlargement. (b) If the vessels at the hilum lie medial to the lateral margin of the enlarged mediastinum then a true mediastinal mass is present.
POWER TOOL 5—THE THORACO-ABDOMINAL SIGN3
This sign allows a lower mediastinal mass to be positioned accurately by analysing the frontal CXR. As follows:
A sharply marginated mediastinal mass projected over the diaphragm on a CXR (or on an AXR) will lie wholly or partly in the thorax…because it is outlined by the air in the lung. Convergence of the lower lateral margin of the mass towards the spine indicates that the inferior aspect of the lesion is nearby. Consequently, the lesion is most likely to be entirely intrathoracic (Fig 16.11). If the lower lateral margin of the lesion does not converge, and particularly if it diverges (Fig. 16.12), then a significant amount of the lesion lies within the abdomen (e.g. a paraspinal abscess).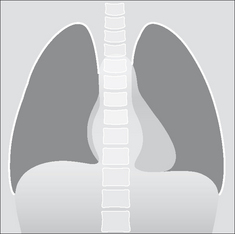
POWER TOOL 6—THE CERVICO-THORACIC SIGN3,7
This helps to decide whether a mass in the upper part of the mediastinum is situated anteriorly or posteriorly. The sign is based on a knowledge of normal anatomy and the application of the silhouette sign. Remember, the anterior aspect of a lung does not extend above the level of the clavicles. The sign applies to the frontal CXR as follows:
If the lateral outline of the mass is visualised above the clavicle then the mass is situated posteriorly (Fig. 16.13a). If the lateral outline of the mass fades away as it reaches the lower border of the clavicle then the mass is situated anteriorly (Fig. 16.13b).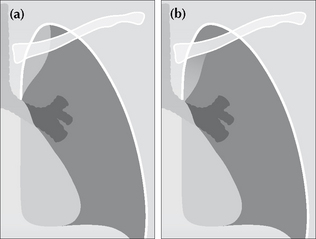
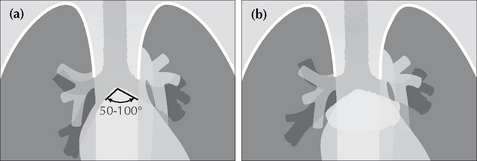
POWER TOOL 7—THE SUBCARINAL ANGLE APPEARANCE
The carina is the site of the division of the trachea into the right and left main bronchi. The normal angle subtended at the carina6 varies from 50º to 100°. If the angle is greater than 100° then the two main bronchi are being pushed apart (Fig. 16.14b). This pushing can be due to subcarinal tumour/lymph node enlargement or to an enlarged left atrium (e.g. mitral valve stenosis).
200 NORMAL CXRS: PATIENTS AGED 50 AND OVER
A tricky question: normal people vary…so what is normal?
There are some variations from the normal which occur so infrequently (or not at all) that finding a difference from the normal must be regarded as an abnormal finding.
Unfortunately, hard facts on the frequency of normal features are thin on the ground—apart from some data provided by Dr Ben Felson3. He painstakingly recorded statistical information from a large number of normal CXRs obtained on young men and women during World War II. His findings are used by radiologists as the benchmark in answer to the question—what is normal? Unfortunately, unlike Felson’s fit young military recruits, most patients referred for a CXR are middle-aged or elderly.
We analysed an older group of patients, reviewing 200 digital or digitised PA CXRs of men and women aged 50 and over. This is how we tried to make sure that the CXRs were really normal:
All patients had been referred by primary care physicians for chest radiography during 2005. In each case the radiologist’s report was normal. No further radiology had been obtained in the subsequent 12 months, or alternatively any subsequent examination (whether a CXR or thoracic CT) was also normal. Two of us (GdeL, LB) reviewed each of the CXRs together (45% of cases); all three of us (GdeL, LB, SM) reviewed 55% of the cases together. At review we excluded any CXR with a cardio-thoracic ratio at or above 50%, and also any radiograph that did not appear to have been obtained during an adequate inspiration. The latter exclusion was based on a subjective impression.THE PATIENTS
The 200 patients were living and working in or around the thriving and generally prosperous university town of Cambridge, in the south east of England. Gender: 47% were male, 53% were female. Age range: 50–91 years. Mean age (i.e. the average) = 64 years. Median age (i.e. the middle of the group) = 62 years. The mode (the age that occurred most often) = 61years.
THE RESULTS
The following results are expressed mainly as percentages. On occasion we have provided numbers only.
1. DIAPHRAGM POSITION—ASSESSING INSPIRATORY EFFORT
Background: A technically adequate inspiration is important (p. 6). This assessment was carried out by relating the position of the diaphragm to the overlying anterior ribs. We wanted to determine whether an assessment as to an adequate inspiration is likely to be more accurate by looking at the position of the left or the right dome of the diaphragm.
Method/Results: Any CXR considered by us to be obtained during an inadequate inspiration had already been excluded from the study. This was based—as in everyday clinical practice—on an overall subjective impression. The levels of the domes of the diaphragm were recorded in relation to the nearest closely overlying costochondral junction (CCJ). If a CCJ was well below the dome, then the immediately superior CCJ was recorded. In two patients the costochondral junctions could not be assessed with precision—one because of developmental rib anomalies and the other because of extensive rib demineralisation. Thus, a total of 198 patients, all of whom—to us—showed an adequate inspiration, were assessed.
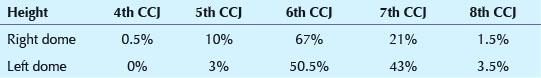
Comment: Our advice…evaluate for a good inspiration on a PA CXR by assessing the height of the left dome rather than the right dome. In the vast majority of patients a good inspiration has occurred when the left dome is at the level of the left 6th or 7th CCJ.
2. A WELL-DEFINED LEFT DOME OF THE DIAPHRAGM
Background: Loss of a clear silhouette of the left dome of the diaphragm is important in relation to detecting left lower lobe pathology (pp. 46–47).
Method/Results: We assessed how often the left dome was visualised from the costophrenic angle to the lateral margin of the vertebral column. The dome appeared sharp in 93% of cases. It was blurred (i.e. ill-defined) in 7%. When it was ill-defined then the loss of definition invariably affected only the medial3–4 cm of the dome.
Comment: Left lower lobe consolidation or collapse frequently obliterates all or part of the outline of the left dome. The rules to apply: if you cannot see the whole of the left dome then you must check whether there is any added density above the diaphragm. Increased density often accompanies consolidation or tumour in a lower lobe.
3. APICAL PLEURAL CAP
Background: Thickening of the pleura over the lung apex is commonly referred to as an apical pleural cap (pp. 89 and 230). The shadow can be mimicked by malignant disease (e.g. a Pancoast tumour).
Table 16.2 200 patients. Apical pleural cap.
| % | |
|---|---|
| Not present | 90 |
| Present on both sides | 2.5 |
| Present on right side only | 6.5 |
| Present on left side only | 1 |
Comment: An apical pleural cap occurred in 10% of patients. When a cap is seen it is important to check for any features that might suggest that it could be a tumour. These features are described on p. 142.
4. BLURRED RIGHT HEART BORDER
Background: Blurring of the right heart border can be an important CXR finding as it may indicate middle lobe disease (p. 46).
Results: Blurring was present in 35 (17.5%) of the 200 patients.
Table 16.3 Cause of blurred right heart border (35 cases).
| No. | |
|---|---|
| Heart not extending lateral to the vertebral margin | 5 |
| Impression: depressed sternum | 1 |
| Impression: adjacent cardiophrenic fat extending superiorly | 8 |
| Unexplained | 21 |
Comment 1: A blurred, or ill-defined, right heart border was a relatively common appearance on normal CXRs in these patients. Several possible causes: a normal heart not extending to the right of the vertebral column; a depressed sternum; or fat extending upwards from the cardiophrenic angle. Blurring must not be regarded as pathognomic of middle lobe disease. Any further investigation must be tailored to the clinical presentation and clinical findings.
Comment 2: Our 17.5% figure is much higher than in Felson’s series3. Most—or all—of Felson’s cases were aged less than 25 years. The mean age in our cases was 64 years. Could some of our cases have had true middle lobe disease? That is possible, but we did not have any evidence to suggest that this was likely.
5. CARDIAC FAT PAD SHADOWS
Background: Collections of fat accumulate around the heart, particularly at the cardiophrenic angles. They can cause potentially misleading low density shadows, sometimes mimicking a mass lesion. Also, if not recognised, fat leads to inaccurate measurement of the transverse cardiac diameter.
Results: Fat was evident in 103 (51.5%) of cases. Of these 103 patients, fat cast a shadow only at the left cardiophrenic angle in 55%, at the right cardiophrenic angle in 6%, and at both angles in 39%.
Comment: A visible epicardial fat pad was very common in this group of patients. The most frequent pattern was fat on the left side only and producing a relatively small shadow. The next most common pattern was fat at both cardiophrenic angles and producing relatively small shadows. Occasionally a fat pad was exceptionally large.
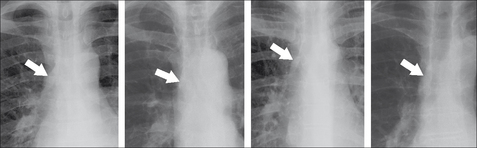
6. VISIBLE PULMONARY VENOUS CONFLUENCE
Background: This is a convex opacity projected over the right side of the heart. Felson3 attributed the appearance to a convergence of normal pulmonary veins draining into the left atrium. Others consider the shadow to be part of the normal left atrium. This shadow can be confused with a lung mass or a paravertebral soft tissue swelling (p. 151).
Results: The appearance occurred in 10% of our 200 cases. It was always on the right of the midline—never on the left side.
Comment: Being aware of this normal shadow will enable its significance to be properly attributed. See the example on p. 151.
7. MAIN LOWER LOBE PULMONARY ARTERIES
Background: The lower lobe pulmonary artery, on a PA CXR, can be likened to a little finger or to a finger’s proximal phalanx (p. 71). The “little finger” appearance of the pulmonary artery is not seen when a lower lobe is collapsed. We evaluated how often the “little finger” appearance was seen.
Results: The “little finger” appearance was identified on both sides in 58.5% of patients, on the right side only in 35%, on the left side only in 3%, and was not identified on either side in 3.5%. Examples are shown on pp. 71–73.
Comment: If the right lower lobe pulmonary artery is not visible then pathology must be excluded (e.g. lower lobe collapse). However, the left lower lobe pulmonary artery is less frequently visible. If it is not identified, then check the position of the hilar vee (see below) before assuming abnormality.
8. HILAR HORIZONTAL VEES
Background: The horizontal vee is defined (p. 73) as follows: identify the lower lobe pulmonary artery and look for the site/point where the most superior vertical or oblique vessel (no matter if it is a vein or an artery) crosses close to the lower lobe pulmonary artery’s lateral margin. The point of crossing forms a horizontal V shape.
The vee helps us to identify the hila precisely and with confidence. This is important when assessing whether there is any evidence of lower lobe collapse (pp. 56–61).
Table 16.4 The horizontal vees. 200 patients.
| The vee identified | No. | % |
|---|---|---|
| On both sides | 176 | 88 |
| Right side only | 18 | 9 |
| Left side only | 2 | 1 |
| Neither identified | 4 | 2 |
Comment: An absent vee on either side should raise a very strong suspicion—but not certainty—of lower lobe collapse.
9. LEVELS OF THE HILAR VEES WHEN BOTH ARE SEEN
Background: The position of the hilum is important for detecting lobar collapse because the hilum may move from its normal position when a lobe collapses. We assessed the positions of the hilar vees relative to each other.
Results: The left vee was higher than the right in 95% of cases. The vees were at the same level in 5%. The right vee was never higher than the left.
Comment: A cardinal rule…if the right vee is higher than the left then there is either volume loss in the left lower lobe or, alternatively, volume loss in the right upper lobe.
10. PROMINENT UNFOLDED OR TORTUOUS VESSELS
Background: Sometimes age related vessel unfolding (aorta or neck vessels), above and to the right or left of the aortic arch, can cause the inexperienced observer to be concerned that an apical mass is present.
Results: Prominent unfolding occurred in 5% of patients.
Comment: Potentially misleading vessel unfolding is a relatively uncommon occurrence on PA CXRs even in this age group. It is more likely to occur on AP CXRs where magnification and tube angulation distortions may occur.
11. HORIZONTAL FISSURE
Background: The absence of a visible horizontal fissure may lead to a concern as to normality. We assessed how frequently the horizontal fissure was visible.
Method/Results: The fissure was visualised in 134 of the 200 cases. On these 134 CXRs it appeared as a single line in 84% and as two lines in 16%. Frequently the second line was short—rarely longer than 2 cm. The reason why two lines are sometimes seen is explained on p. 55.
Comment: The horizontal fissure was not visible on 33% of normal CXRs. Its absence is not, on its own, of clinical significance.
12. AZYGOS VEIN SHADOW
Background: The azygos vein enters the superior vena cava to the right of the tracheal bifurcation (p. 176). Very small lymph nodes (not visible on the CXR) are also present at this site. Unless the patient is in right heart failure it is rare for the azygos vein to be enlarged. Consequently, enlargement of the azygos shadow is most commonly due to lymphadenopathy.
Results: The azygos vein was visible as a definite oval or rounded structure in 31% of patients. None of these visible azygos veins showed a transverse diameter in excess of 1.0 cm.
Comment: When a shadow is seen that appears to be a prominent azygos vein—measure its transverse diameter. The rule to apply: if this diameter exceeds 1.0 cm on a PA CXR: (a) presume that an abnormality is present;(b) determine whether the patient is in heart failure; and (c) check whether the clinical presentation might include the possibility of nodal enlargement.
13. THE RIGHT WALL OF THE TRACHEA
Background: Lymphadenopathy in the paratracheal region can be difficult to detect. The normal right paratracheal stripe can often be identified below the clavicle (see p. 112). The stripe represents both sides of the tracheal wall outlined by air. It is not seen in all patients, and it is rarely seen on the left side. Widening of the normal paratracheal stripe can be helpful in recognising early paratracheal lymph node enlargement. We assessed: (a) how frequently the normal right paratracheal stripe was seen; and (b) its width.
Results: Both sides of the right wall of the trachea were visible in 63% of patients. When both sides were visible (126 patients), in 98% of cases the wall thickness did not exceed 2 mm. In 2% of cases the wall thickness measured 2.5 mm. No cases exceeded 2.5 mm.
Comment: The rule to apply—when both sides of the right wall of the trachea are seen on a PA CXR then the wall thickness should not exceed 2.5 mm. If the wall thickness measures more than 2.5 mm then suspect that paratracheal lymphadenopathy is present.
14. STOMACH GAS POSITION
Background: A left-sided subpulmonary pleural effusion (p. 82) or subphrenic collection may be revealed by identifying inferior displacement of the gas shadow (or bubble) in the gastric fundus. We assessed the normal depth of separation between the gastric air and the diaphragm.
Method/Results: An unequivocal stomach gas bubble was visualised in 22% of cases. In these 44 patients the distance from the top of the stomach gas bubble to the immediately adjacent superior margin of the dome of the diaphragm was less than 7 mm in 98%. In one case the distance was 14 mm.
Comment: The distance between the left dome of the diaphragm and the superior surface of the gastric fundus is usually less than 7 mm. Very occasionally it can measure more than 7 mm. Thus, if a patient has a clinical presentation that might include the question of left-sided pleural fluid and the gastric air bubble is more than 7 mm below the dome then suspect a fluid collection. Applying this rule will lead to the occasional false positive diagnosis. No matter—an ultrasound examination will then rapidly confirm or refute.
15. UNILATERAL HYPERTRANSRADIANCY8
Background: Unilateral hypertransradiancy (blackening) can be a subtle but important sign of lung pathology. The causes of hypertransradiancy are described on p. 257.
Results: Hypertransradiancy was evident in 35% of patients. Of these CXRs (70 patients), 58% showed evidence of rotation. In 42% the cause was not apparent.
Comment: Detecting unilateral hypertransradiancy is subjective and depends on how meticulously you look for it. This will vary between observers. Some observers are very sensitive to a difference between the blackening of the two lungs. Be cautious about ascribing great significance to hypertransradiancy as an isolated finding. It is quite common. Frequently the cause is technical (p. 257). Work through our checklist (p. 258) to determine whether there is any other CXR evidence to suggest important pathology.
1. Felson B, Felson H. Localization of intrathoracic lesions by means of the postero–anterior roentgenogram: the silhouette sign. Radiology. 1950;55:363-374.
2. Glossary of terms for thoracic radiology: recommendations of the Nomenclature Committee of the Fleischner Society. AJR. 1984;143:509-517.
3. Felson B. Chest Roentgenology. Philadelphia, PA: WB Saunders, 1973.
4. Reed JC. Chest Roentgenology: Plain Film Patterns and Differential Diagnosis, 5th ed. Philadelphia, PA: Mosby, 2003.
5. O’Connell RS, McLoud TC, Wilkins EW. Superior sulcus tumour: Radiographic diagnosis and work up. AJR. 1983;140:25-30.
6. Fraser RG, Muller NL, Colman NC, Pare PD. Fraser and Pare’s Diagnosis of Diseases of the Chest, 4th ed. Philadelphia, PA: WB Saunders, 1999.
7. Briggs G. Pocket Guide to Chest X-rays. 2004. Sydney, NSW: McGraw-Hill, 2004.
8. Joseph AE, de Lacey GJ, Bryant TH, et al. The hypertransradiant hemithorax: the importance of lateral decentering and the explanation for its appearance due to rotation. Clin Radiol. 1978;29:125-131.