Chapter 417 Laboratory Evaluation
417.1 Radiologic Assessment
The chest x-ray may provide information about cardiac size and shape, pulmonary blood flow (vascularity), pulmonary edema, and associated lung and thoracic anomalies that may be associated with congenital syndromes (skeletal dysplasias, extra or deficient number of ribs, abnormal vertebrae, previous cardiac surgery). Variations are due to differences in body build, the phase of respiration or the cardiac cycle, abnormalities of the thoracic cage, position of the diaphragm, or pulmonary disease.
The most frequently used measurement of cardiac size is the maximal width of the cardiac shadow in a posteroanterior chest film taken mid-inspiration. A vertical line is drawn down the middle of the sternal shadow, and perpendicular lines are drawn from the sternal line to the extreme right and left borders of the heart; the sum of the lengths of these lines is the maximal cardiac width. The maximal chest width is obtained by drawing a horizontal line between the right and left inner borders of the rib cage at the level of the top of the right diaphragm. When the maximal cardiac width is more than half the maximal chest width (cardiothoracic ratio >50%), the heart is usually enlarged. Cardiac size should be evaluated only when the film is taken during inspiration with the patient in an upright position. A diagnosis of “cardiac enlargement” on expiratory or prone films is a common cause of unnecessary referrals and laboratory studies.
The cardiothoracic ratio is a less useful index of cardiac enlargement in infants than in older children because the horizontal position of the heart may increase the ratio to >50% in the absence of true enlargement. Furthermore, the thymus may overlap not only the base of the heart but also virtually the entire mediastinum, thus obscuring the true cardiac silhouette.
A lateral chest roentgenogram may be helpful in infants as well as in older children with pectus excavatum or other conditions that result in a narrow anteroposterior chest dimension. In these situations, the heart may appear small in the lateral view and suggest that the apparent enlargement in the posteroanterior projection was due to either the thymic image (anterior mediastinum only) or flattening of the cardiac chambers as a result of a structural chest abnormality.
In the posteroanterior view, the left border of the cardiac shadow consists of three convex shadows produced, from above downward, by the aortic knob, the main and left pulmonary arteries, and the left ventricle (Fig. 417-1). In cases of moderate to marked left atrial enlargement, the atrium may project between the pulmonary artery and the left ventricle. The outflow tract of the right ventricle does not contribute to the shadows formed by the left border of the heart. The aortic knob is not as easily seen in infants and children as in adults. The side of the aortic arch (left or right) can often be inferred as being opposite the side of the midline from which the air-filled trachea is visualized. This observation is important because a right-sided aortic arch is often present in cyanotic congenital heart disease, particularly in tetralogy of Fallot. Three structures contribute to the right border of the cardiac silhouette. In the view from above, they are the superior vena cava, the ascending aorta, and the right atrium.
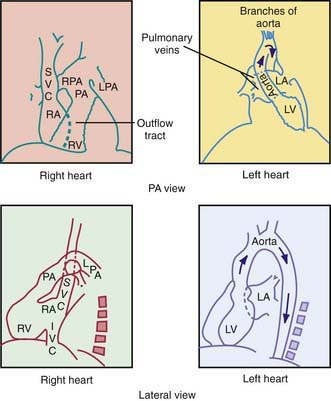
Figure 417-1 Idealized diagrams showing normal position of the cardiac chambers and great blood vessels. IVC, inferior vena cava; LA, left atrium; LPA, left pulmonary artery; LV, left ventricle; PA, pulmonary artery; RA, right atrium; RPA, right pulmonary artery; RV, right ventricle; SVC, superior vena cava.
(Adapted and redrawn from Dotter CT, Steinberg I: Angiocardiographic interpretation, Radiology 153:513, 1949.)
Enlargement of cardiac chambers or major arteries and veins results in prominence of the areas in which these structures are normally outlined on the chest x-ray. In contrast, the electrocardiogram (ECG) is a more sensitive and accurate index of ventricular hypertrophy.
The chest roentgenogram is also an important tool for assessing the degree of pulmonary vascularity. Angiocardiographic studies have shown that the hilar shadows seen on the plain chest roentgenogram are mainly vascular. Pulmonary overcirculation is usually associated with left-to-right shunt lesions, whereas pulmonary undercirculation is associated with obstruction of the outflow tract of the right ventricle.
The esophagus is closely related to the great vessels, and a barium esophagogram can help delineate these structures in the initial evaluation of suspected vascular rings, although this has largely been supplanted by CT. Echocardiographic examination best defines the morphologic features of intracardiac chambers, cardiac valves, and intracardiac shunts. CT is used as an adjunct to echo to evaluate extracardiac vascular morphology. MRI is used to quantitate ventricular volumes, cardiac function, and shunt and regurgitant fractions.
417.2 Electrocardiography
Developmental Changes
The marked changes that occur in cardiac physiology and chamber dominance during the perinatal transition (Chapter 415) are reflected in the evolution of the ECG during the neonatal period. Because vascular resistance in the pulmonary and systemic circulations is nearly equal in a term fetus, the intrauterine work of the heart results in an equal mass of both the right and left ventricles. After birth, systemic vascular resistance rises when the placental circulation is eliminated, and pulmonary vascular resistance falls when the lungs expand. These changes are reflected in the ECG as the right ventricular wall begins to thin.
The ECG demonstrates these anatomic and hemodynamic features principally by changes in QRS and T-wave morphologic features. It is recommended that a 13-lead ECG be performed in pediatric patients, including either lead V3R or V4R, which are important in the evaluation of right ventricular hypertrophy. On occasion, lead V1 is positioned too far leftward to reflect right ventricular forces accurately. This problem is present particularly in premature infants, in whom the electrocardiographic electrode gel may produce contact among all the precordial leads.
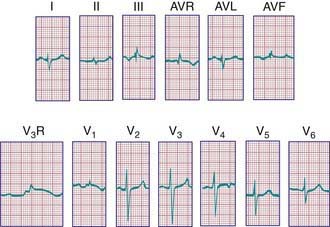
During the 1st days of life, right axis deviation, large R waves, and upright T waves in the right precordial leads (V3R or V4R and V1) are the norm (Fig. 417-2). As pulmonary vascular resistance decreases in the 1st few days after birth, the right precordial T waves become negative. In the great majority of instances, this change occurs within the 1st 48 hr of life. Upright T waves that persist in leads V3R, V4R, or V1 beyond 1 wk of life are an abnormal finding indicating right ventricular hypertrophy or strain, even in the absence of QRS voltage criteria. The T wave in V1 should never be positive before 6 yr of age and may remain negative into adolescence. This finding represents one of the most important, yet subtle differences between pediatric and adult ECGs and is a common source of error when adult cardiologists interpret pediatric ECGs.
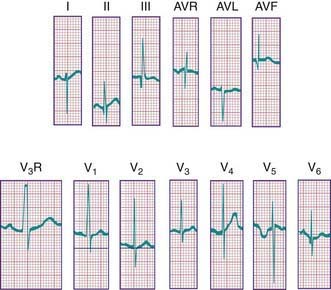
Figure 417-2 Electrocardiogram in a normal neonate <24 hr of age. Note the dominant R wave and upright T waves in leads V3R and V1 (V3R paper speed = 50 mm/sec).
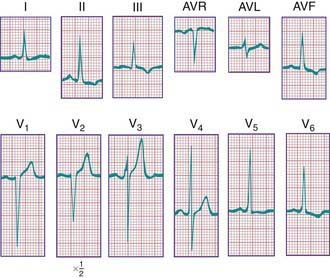
In a newborn, the mean QRS frontal-plane axis normally lies in the range of +110 to +180 degrees. The right-sided chest leads reveal a larger positive (R) than negative (S) wave and may do so for months because the right ventricle remains relatively thick throughout infancy. Left-sided leads (V5 and V6) also reflect right-sided dominance in the early neonatal period, when the R : S ratio in these leads may be <1. A dominant R wave in V5 and V6 reflecting left ventricular forces quickly becomes evident within the 1st few days of life (Fig. 417-3). Over the years, the QRS axis gradually shifts leftward, and the right ventricular forces slowly regress. Leads V1, V3R, and V4R display a prominent R wave until 6 mo to 8 yr of age. Most children have an R : S ratio >1 in lead V4R until they are 4 yr of age. The T waves are inverted in leads V4R, V1, V2, and V3 during infancy and may remain so into the middle of the 2nd decade of life and beyond. The processes of right ventricular thinning and left ventricular growth are best reflected in the QRS-T pattern over the right precordial leads. The diagnosis of right or left ventricular hypertrophy in a pediatric patient can be made only with an understanding of the normal developmental physiology of these chambers at various ages until adulthood is reached. As the left ventricle becomes dominant, the ECG evolves to the characteristic pattern of older children (Fig. 417-4) and adults (Fig. 417-5).
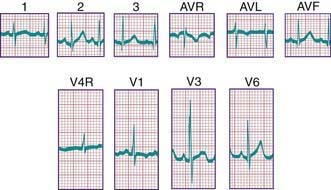
Figure 417-3 Electrocardiogram of a normal infant. Note the tall R and small S waves in V4R and V1 and the inverted T wave in these leads. A dominant R wave is also present in V6.
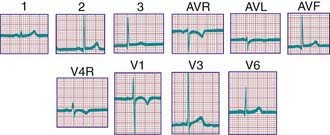
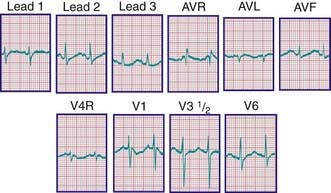
Figure 417-4 Electrocardiogram of a normal child. Note the relatively tall R waves and inversion of the T waves in V4R and V1.
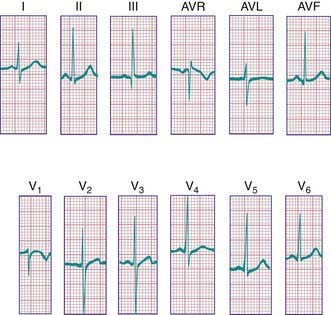
Figure 417-5 Normal adult electrocardiogram. Note the dominant S wave in lead V1. This pattern in an infant would indicate the presence of left ventricular hypertrophy.
Ventricular hypertrophy may result in increased voltage in the R and S waves in the chest leads. The height of these deflections is governed by the proximity of the specific electrode to the surface of the heart; by the sequence of electrical activation through the ventricles, which can result in variable degrees of cancellation of forces; and by hypertrophy of the myocardium. Because the chest wall in infants and children, as well as in adolescents, may be relatively thin, the diagnosis of ventricular hypertrophy should not be based on voltage changes alone.
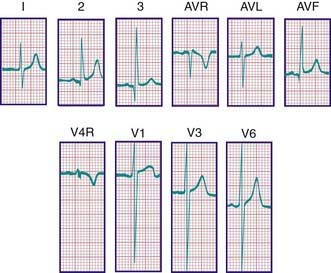
The diagnosis of pathologic right ventricular hypertrophy is difficult in the 1st wk of life because physiologic right ventricular hypertrophy is a normal finding. Serial tracings are often necessary to determine whether marked right axis deviation and potentially abnormal right precordial forces or T waves, or both, will persist beyond the neonatal period (Fig. 417-6). In contrast, an adult electrocardiographic pattern (see Fig. 417-5) seen in a neonate suggests left ventricular hypertrophy. The exception is a premature infant, who may display a more “mature” ECG than a full-term infant (Fig. 417-7) as a result of lower pulmonary vascular resistance secondary to underdevelopment of the medial muscular layer of the pulmonary arterioles. Some premature infants display a pattern of generalized low voltage across the precordium.
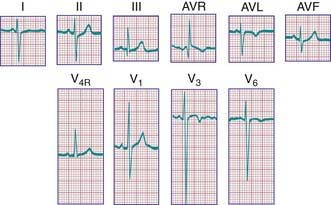
Figure 417-6 Electrocardiogram of an infant with right ventricular hypertrophy (tetralogy of Fallot). Note the tall R waves in the right precordium and deep S waves in V6. The positive T waves in V4R and V1 are also characteristic of right ventricular hypertrophy.
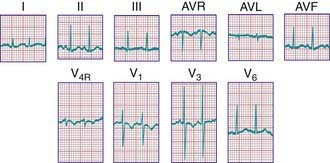
Figure 417-7 Electrocardiogram of a premature infant (weight 2 kg and age 5 wk at the time of the tracing). The cardiovascular system was clinically normal. Left ventricular dominance is manifested by R-wave progression across the chest, similar to tracings obtained from older children. Compare with the tracing from a normal full-term infant (see Fig. 417-3).
The ECG should always be evaluated systematically to avoid the possibility of overlooking a minor, but important abnormality. One approach is to begin with an assessment of rate and rhythm, followed by a calculation of the mean frontal-plane QRS axis, measurements of segment intervals, assessment of voltages, and, finally, assessment of ST and T-wave abnormalities.
Rate and Rhythm
A brief rhythm strip should be examined to assess whether a P wave always precedes each QRS complex. The P-wave axis should then be estimated as an indication of whether the rhythm is originating from the sinus node. If the atria are situated normally in the chest, the P wave should be upright in leads I and aVF and inverted in lead aVR. With atrial inversion (situs inversus), the P wave may be inverted in lead I. Inverted P waves in leads II and aVF are seen in low atrial, nodal, or junctional rhythms. The absence of P waves indicates a rhythm originating more distally in the conduction system. In this case, the morphologic features of the QRS complexes are important in differentiating a junctional (usually a narrow QRS complex) from a ventricular (usually a wide QRS complex) rhythm.
P Waves
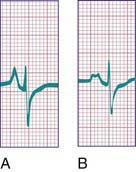
Tall (>2.5 mm), narrow, and spiked P waves are indicative of right atrial enlargement and are seen in congenital pulmonary stenosis, Ebstein anomaly of the tricuspid valve, tricuspid atresia, and sometimes cor pulmonale. These abnormal waves are most obvious in leads II, V3R, and V1 (Fig. 417-8A). Similar waves are sometimes seen in thyrotoxicosis. Broad P waves, commonly bifid and sometimes biphasic, are indicative of left atrial enlargement (Fig. 417-8B). They are seen in some patients with large left-to-right shunts (ventricular septal defect [VSD], patent ductus arteriosus [PDA]) and with severe mitral stenosis or regurgitation. Flat P waves may be encountered in hyperkalemia.
QRS Complex
Right Ventricular Hypertrophy
For the most accurate assessment of ventricular hypertrophy, pediatric ECGs should include the right precordial lead V3R or V4R, or both. The diagnosis of right ventricular hypertrophy depends on demonstration of the following changes (see Fig. 417-6): (1) a qR pattern in the right ventricular surface leads; (2) a positive T wave in leads V3R-V4R and V1-V3 between the ages of 6 days and 6 yr; (3) a monophasic R wave in V3R, V4R, or V1; (4) an rsR′ pattern in the right precordial leads with the 2nd R wave taller than the initial one; (5) age-corrected increased voltage of the R wave in leads V3R-V4R or the S wave in leads V6-V7, or both; (6) marked right axis deviation (>120 degrees in patients beyond the newborn period); and (7) complete reversal of the normal adult precordial RS pattern. At least 2 of these changes should be present to support a diagnosis of right ventricular hypertrophy.
Abnormal ventricular loading can be characterized as either systolic (as a result of obstruction of the right ventricular outflow tract, as in pulmonic stenosis) or diastolic (as a result of increased volume load, as in atrial septal defects [ASDs]). These two types of abnormal loads result in distinct electrocardiographic patterns. The systolic overload pattern is characterized by tall, pure R waves in the right precordial leads. In older children, the T waves in these leads are initially upright and later become inverted. In infants and children <6 yr, the T waves in V3R-V4R and V1 are abnormally upright. The diastolic overload pattern (typically seen in patients with ASDs) is characterized by an rsR′ pattern (Fig. 417-9) and a slightly increased QRS duration (minor right ventricular conduction delay). Patients with mild to moderate pulmonary stenosis may also exhibit an rsR′ pattern in the right precordial leads.
Left Ventricular Hypertrophy
The following features indicate the presence of left ventricular hypertrophy (Fig. 417-10): (1) depression of the ST segments and inversion of the T waves in the left precordial leads (V5, V6, and V7), known as a left ventricular strain pattern—these findings suggest the presence of a severe lesion; (2) a deep Q wave in the left precordial leads; and (3) increased voltage of the S wave in V3R and V1 or the R wave in V6-V7, or both. It is important to emphasize that evaluation of left ventricular hypertrophy should not be based on voltage criteria alone. The concepts of systolic and diastolic overload, though not always consistent, are also useful in evaluating left ventricular enlargement. Severe systolic overload of the left ventricle is suggested by straightening of the ST segments and inverted T waves over the left precordial leads; diastolic overload may result in tall R waves, a large Q wave, and normal T waves over the left precordium. Finally, an infant with an ECG that would be considered “normal” for an older child may, in fact, have left ventricular hypertrophy.
Bundle Branch Block
A complete right bundle branch block may be congenital or may be acquired after surgery for congenital heart disease, especially when a right ventriculotomy has been performed, as in repair of the tetralogy of Fallot. Congenital left bundle branch block is rare; this pattern is occasionally seen with cardiomyopathy. A bundle branch block pattern may be indicative of a bypass tract associated with one of the pre-excitation syndromes (Chapter 429).
P-R and Q-T Intervals
The duration of the P-R interval shortens with increasing heart rate; thus, assessment of this interval should be based on age- and rate-corrected nomograms. A long P-R interval is diagnostic of a 1st-degree heart block, the cause of which may be congenital, postoperative, inflammatory (myocarditis, pericarditis, rheumatic fever), or pharmacologic (digitalis).
The duration of the Q-T interval varies with the cardiac rate; a corrected Q-T interval (Q-Tc) can be calculated by dividing the measured Q-T interval by the square root of the preceding R-R interval. A normal Q-Tc should be <0.45. It is often lengthened with hypokalemia and hypocalcemia; in the former instance, a U wave may be noted at the end of the T wave (Fig. 417-11). There are a number of medications that can also lengthen the Q-T interval. A congenitally prolonged Q-T interval (Fig. 417-12) may also be seen in children with one of the long Q-T syndromes. These patients are at high risk for ventricular arrhythmias, including a form of ventricular tachycardia known as torsades de pointes, and sudden death (Chapter 429.5).
ST Segment and T-wave Abnormalities
A slight elevation of the ST segment may occur in normal teenagers and is attributed to early repolarization of the heart. In pericarditis, irritation of the epicardium may cause elevation of the ST segment followed by abnormal T-wave inversion as healing progresses. Administration of digitalis is sometimes associated with sagging of the ST segment and abnormal inversion of the T wave.
Depression of the ST segment may also occur in any condition that produces myocardial damage or ischemia, including severe anemia, carbon monoxide poisoning, aberrant origin of the left coronary artery from the pulmonary artery, glycogen storage disease of the heart, myocardial tumors, and mucopolysaccharidoses. An aberrant origin of the left coronary artery from the pulmonary artery may lead to changes indistinguishable from those of acute myocardial infarction in adults. Similar changes may occur in patients with other rare abnormalities of the coronary arteries and in those with cardiomyopathy, even in the presence of normal coronary arteries. These patterns are often misread in young infants because of the unfamiliarity of pediatricians with this “infarct” pattern, and thus a high index of suspicion must be maintained in infants with dilated cardiomyopathy or with symptoms compatible with coronary ischemia (e.g., inconsolable crying).
T-wave inversion may occur in myocarditis and pericarditis, or it may be a sign of either right or left ventricular hypertrophy and strain. Hypothyroidism may produce flat or inverted T waves in association with generalized low voltage. In hyperkalemia, the T waves are commonly of high voltage and are tent-shaped (Fig. 417-13).
Garson A. The electrocardiogram in infants and children: a systematic approach. Philadelphia: Lea & Febiger; 1983.
Lawless CE, Best TM. Electrocardiograms in athletes: interpretation and diagnostic accuracy. Med Sci Sports Exerc. 2008;40:787-798.
O’Connor M, McDaniel N, Brady WJ. The pediatric electrocardiogram: part I: age-related interpretation. Am J Emerg Med. 2008;26:506-512.
O’Connor M, McDaniel N, Brady WJ. The pediatric electrocardiogram: part III: congenital heart disease and other cardiac syndromes. Am J Emerg Med. 2008;26:497-503.
417.3 Hematologic Data
In acyanotic infants with large left-to-right shunts, the onset of heart failure often coincides with the nadir of the normal physiologic anemia of infancy. Increasing the hematocrit in these patients to >40% may decrease shunt volume and result in an improvement in symptoms; this form of treatment is reserved for infants who are not otherwise surgical candidates (extremely premature infants or those with exceedingly complex congenital heart disease for whom only palliative surgery is possible). In these select infants, regular evaluation of the hematocrit and booster transfusions when appropriate may be helpful in improving growth. In some patients, particularly those who are anemic but stable hemodynamically, erythropoietin (Epogen) can be used to more gradually increase hemoglobin and thus oxygen-carrying capacity.
Polycythemia is frequently noted in cyanotic patients with right-to-left shunts. Patients with severe polycythemia are in a delicate balance between the risks of intravascular thrombosis and a bleeding diathesis. The most frequent abnormalities include accelerated fibrinolysis, thrombocytopenia, abnormal clot retraction, hypofibrinogenemia, prolonged prothrombin time, and prolonged partial thromboplastin time. The preparation of cyanotic, polycythemic patients for elective noncardiac surgery, such as dental extraction, includes evaluation and treatment of abnormal coagulation.
Because of the high viscosity of polycythemic blood (hematocrit >65%), patients with cyanotic congenital heart disease are at risk for the development of vascular thromboses, especially of cerebral veins. Dehydration increases the risk of thrombosis, and thus adequate fluid intake must be maintained during hot weather or intercurrent gastrointestinal illnesses. Diuretics should be used with caution in these patients and may need to be decreased if fluid intake is a concern. Polycythemic infants with concomitant iron deficiency are at even greater risk for cerebrovascular accidents, probably because of the decreased deformability of microcytic red blood cells. Iron therapy may reduce this risk somewhat, but surgical treatment of the cardiac anomaly is the best therapy.
Severely cyanotic patients should have periodic determinations of hemoglobin and hematocrit. Increasing polycythemia, often associated with headache, fatigue, dyspnea, or a combination of these conditions, is one indication for palliative or corrective surgical intervention. In cyanotic patients with inoperable conditions, partial exchange transfusion may be required to treat symptomatic individuals whose hematocrit has risen to the 65-70% level. This procedure is not without risk, especially in patients with an extreme elevation in pulmonary vascular resistance. Because these patients do not tolerate wide fluctuations in circulating blood volume, blood should be replaced with fresh frozen plasma or albumin.
417.4 Echocardiography
Transthoracic echocardiography has replaced invasive studies such as cardiac catheterization for the initial diagnosis of most forms of congenital heart disease. The echocardiographic examination can be used to evaluate cardiac structure in congenital heart lesions, estimate intracardiac pressures and gradients across stenotic valves and vessels, quantitate cardiac contractile function (both systolic and diastolic), determine the direction of flow across a defect, examine the integrity of the coronary arteries, and detect the presence of vegetations from endocarditis, as well as the presence of pericardial fluid, cardiac tumors, and chamber thrombi. Echocardiography may also be used to assist in the performance of interventional procedures, including pericardiocentesis, balloon atrial septostomy (Chapter 425.2), atrial or ventricular septal defect closure and endocardial biopsy, and in the placement of flow-directed pulmonary artery (Swan-Ganz) monitoring catheters. Transesophageal echocardiography is used routinely to monitor ventricular function in patients during difficult surgical procedures and can provide an immediate assessment of the results of surgical repair of congenital heart lesions. A complete transthoracic echocardiographic examination usually entails a combination of M-mode and two-dimensional (2-D) imaging, as well as pulsed, continuous, and color Doppler flow studies. Doppler tissue imaging and other new technologies provide more quantitative assessments of ventricular function. Three-dimensional (3-D) echocardiography provides valuable information regarding cardiac morphology.
M-mode Echocardiography
M-mode echocardiography displays a one-dimensional slice of cardiac structure varying over time (Fig. 417-14). It is used mostly for the measurement of cardiac dimensions (wall thickness and chamber size) and cardiac function (fractional shortening, wall thickening). M-mode echocardiography is also useful for assessing the motion of intracardiac structures (opening and closing of valves, movement of free walls and septa) and the anatomy of valves (Fig. 417-15). The most frequently used index of cardiac function in children is percent fractional shortening (%FS), which is calculated as (LVED − LVES)/LVED, where LVED is left ventricular (LV) dimension at end-diastole and LVES is LV dimension at end-systole. Normal fractional shortening is approximately 28-40%. Other M-mode indices of cardiac function include the mean velocity of fiber shortening (mean VCF), systolic time intervals (LVPEP = LV pre-ejection period, LVET = LV ejection time), and isovolemic contraction time. More sophisticated indices of cardiac function can be derived noninvasively with the assistance of echocardiography (pressure-volume relationship, end-systolic wall stress-strain relationship).
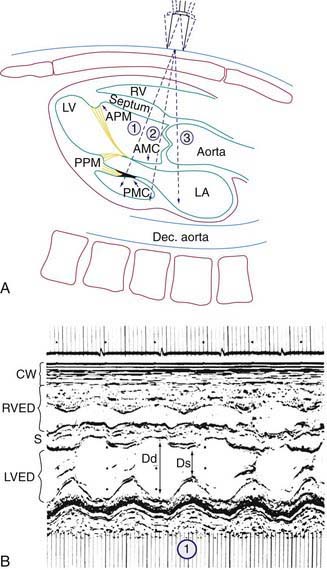
Figure 417-14 M-mode echocardiogram. A, Diagram of a sagittal section of a heart showing the structures traversed by the echo beam as it is moved superiorly to positions (1), (2), and (3). AMC, anterior mitral cusp; APM, anterior papillary muscle; Dec. aorta, descending aorta; LA, left atrium; LV, left ventricle; PMC, posterior mitral cusp; PPM, posterior papillary muscle; RV, right ventricle. B, Echocardiogram from transducer position (1); this view is the best one for measuring cardiac dimensions and fractional shortening. Fractional shortening is calculated as (LVED−LVES)/LVED. CW, chest wall; Ds, LV dimension in systole; LVED, LV dimension at end-diastole (Dd); RVED, RV dimension at end-diastole.
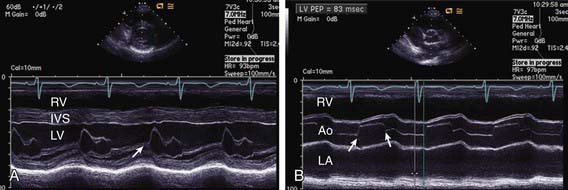
Figure 417-15 M-mode echocardiograms. The small figure at the top of each panel shows the 2-D parasternal short axis echo image from which the M-modes are derived. The cursor can be seen midway through the image, indicating the one-dimensional line through which the M-mode is being sampled. A, M-mode echocardiogram of a normal mitral valve. Arrow shows the opening of the anterior leaflet in early diastole (see ECG tracing above for reference). B, M-mode echocardiogram of a normal aortic valve. The opening and closing of the aortic leaflets in systole are outlined by the two arrows. Ao, aorta; IVS, interventricular septum; LV, left ventricle; RV, right ventricle.
Two-Dimensional Echocardiography
2-D echocardiography provides a real-time image of cardiac structures. With 2-D echocardiography, the contracting heart is imaged in real time using several standard views, including parasternal long axis (Fig 417-16), parasternal short axis (Fig. 417-17), apical four chamber (Fig. 417-18), subcostal (Fig. 417-19), and suprasternal (Fig. 417-20) windows, each of which emphasizes specific structures. 2-D echocardiography has replaced cardiac angiography for the preoperative diagnosis of most, but not all congenital heart lesions; it exceeds angiography in imaging the atrioventricular valves and their chordal attachments. When information from the cardiac examination or other studies is not consistent with the echocardiogram (e.g., the size of a left-to-right shunt), cardiac catheterization remains an important tool to confirm the anatomic diagnosis and evaluate the degree of physiologic derangement.
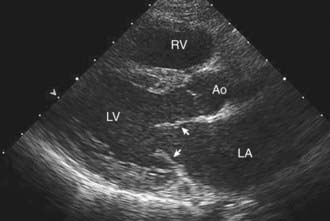
Figure 417-16 Normal parasternal long axis echocardiographic window. The transducer is angulated slightly posteriorly, imaging the left-sided cardiac structures. If the transducer were to be angulated more anteriorly, the right ventricular structures would be imaged. The mitral valve leaflets can be seen in partially open position in early diastole (arrowheads). The closed aortic valve leaflets can be seen just below the label Ao. Ao, aorta; LA, left atrium; LV, left ventricle; RV, right ventricle.
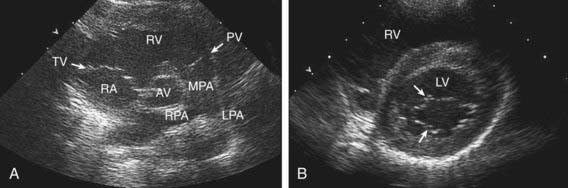
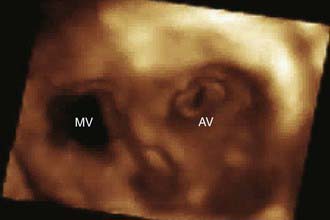
Figure 417-17 Normal parasternal short axis echocardiographic windows. A, With the transducer angled superiorly and rightwards, the aortic valve (AV) is imaged, surrounded by both inflow and outflow portions of the right ventricle (RV). LPA, left pulmonary artery; MPA, main pulmonary artery; PV, pulmonary valve; RA, right atrium; RPA, right pulmonary artery; TV, tricuspid valve. B, With the transducer angled inferiorly and leftwards, the left ventricular chamber is imaged along with cross-sectional view of the mitral valve (arrows). LV, left ventricle; RV, right ventricle.

Figure 417-18 Normal apical four chamber echocardiographic window showing all four cardiac chambers and both atrioventricular valves opened in diastole. LA, left atrium; LV, left ventricle; RA, right atrium; RV, right ventricle.
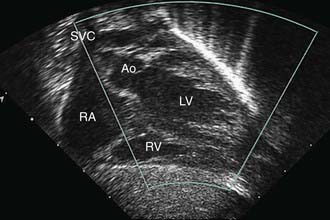
Figure 417-19 Normal subcostal echocardiographic window showing the left ventricular outflow tract. The right-sided structures are not fully imaged in this view. Ao, ascending aorta; LV, left ventricle; RA, right atrium; RV, right ventricle; SVC, superior vena cava.
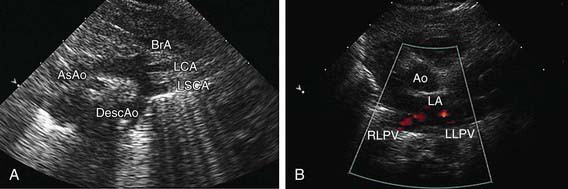
Figure 417-20 A, Normal suprasternal echocardiographic window showing the aortic arch and its major branches. AsAo, ascending aorta; BrA, brachiocephalic artery; DescAo, descending aorta; LCA, left carotid artery; LSCA, left subclavian artery. B, Normal high parasternal window showing color Doppler imaging of normal pulmonary venous return to the left atrium (LA) of both right (RLPV) and left (LLPV) lower pulmonary veins.
Doppler Echocardiography
Doppler echocardiography displays blood flow in cardiac chambers and vascular channels based on the change in frequency imparted to a sound wave by the movement of erythrocytes. In pulsed Doppler and continuous wave Doppler, the speed and direction of blood flow in the line of the echo beam change the transducer’s reference frequency. This frequency change can be translated into volumetric flow (L/min) data for estimating systemic or pulmonary blood flow and into pressure (mm Hg) data for estimating gradients across the semilunar or atrioventricular valves or across septal defects or vascular communications such as shunts. Color Doppler permits highly accurate assessment of the presence and direction of intracardiac shunts and allows identification of small or multiple left-to-right or right-to-left shunts (Fig. 417-21). The severity of valvular insufficiency can be evaluated with both pulsed and color Doppler (Fig. 417-22). Alterations in venous Doppler flow patterns can be used to detect abnormalities of systemic and pulmonary veins and alterations of atrioventricular valve Doppler flow patterns can be used to assess ventricular diastolic functional abnormalities.
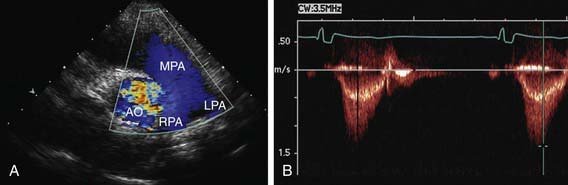
Figure 417-21 Color and pulsed Doppler evaluation of pulmonary arterial flow. A, Color Doppler evaluation of a parasternal short axis view showing normal flow through the pulmonary valve to the main and branch pulmonary arteries. The color of the Doppler flow is blue, indicating that the flow is moving away from the transducer (which is located at the top of the figure, at the apex of the triangular ultrasound window). Note that the color assigned to the Doppler signal does not indicate the oxygen saturation of the blood. Ao, aorta; LPA, left pulmonary artery; MPA, main pulmonary artery; RPA, right pulmonary artery. B, Pulsed wave Doppler flow pattern through the pulmonary valve showing a low velocity of flow (<1.5 m/sec), indicating the absence of a pressure gradient across the valve. The envelope of the flow signal is below the line, indicating that the flow is moving away from the transducer.
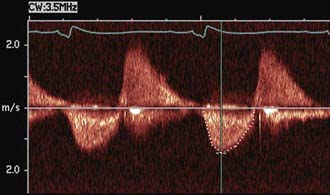
Figure 417-22 Doppler evaluation of a patient who had previously undergone repair of tetralogy of Fallot and who has mild pulmonary stenosis and moderate pulmonary regurgitation. The tracing shows the to-and-fro flow across the pulmonary valve with the signal below the line representing forward flow in systole (see ECG tracing for reference) and the signal above the line representing regurgitation during diastole.
Sophisticated M-mode, 2-D, and Doppler echocardiographic methods of assessing left ventricular systolic and diastolic function (e.g., end-systolic wall stress, dobutamine stress echocardiography, and Doppler tissue imaging) have proved useful in the serial assessment of patients at risk for the development of both systolic and diastolic ventricular dysfunction and ventricular dyssynchrony (where the coordination of left and right ventricular contraction is abnormal). Such patients include those with cardiomyopathies, those receiving anthracycline drugs for cancer chemotherapy, those at risk for iron overload, and those being monitored for rejection or coronary artery disease after heart transplantation.
Three-Dimensional Echocardiography
Real-time 3-D echocardiographic reconstruction is valuable for the assessment of cardiac morphology (Fig. 417-23). Details of valve structure, the size and location of septal defects, abnormalities of the ventricular myocardium, and details of the great vessels, which may not be as readily apparent using 2-D imaging, can often be appreciated on 3-D echo. Reconstruction of the view that the surgeon will encounter in the operating room makes this technique a valuable adjunct for preoperative imaging.
Transesophageal Echocardiography
Transesophageal echocardiography is an extremely sensitive imaging technique that produces a clearer view of smaller lesions such as vegetations in endocarditis, especially in larger patients. It is useful in visualizing posteriorly located structures such as the atria, aortic root, and atrioventricular valves. Transesophageal echocardiography is extremely useful as an intraoperative technique for monitoring cardiac function during both cardiac and noncardiac surgery and for screening for residual cardiac defects after the patient in initially weaned from cardiopulmonary bypass. This technique has been especially helpful in evaluating the degree of residual regurgitation after valve repairs and in searching for small muscular VSDs that may have been missed during the closure of larger defects.
Fetal Echocardiography
Fetal echocardiography can be used to evaluate cardiac structures or disturbances in cardiac rhythm (Fig. 417-24). Perinatologists often detect gross abnormalities in cardiac structure on routine obstetric ultrasonography or may refer the patient because of unexplained hydrops fetalis, a family history of congenital heart disease, or a maternal condition associated with fetal cardiac pathology such as gestational diabetes. Fetal echocardiography is capable of diagnosing most significant congenital heart lesions as early as 17-19 wk of gestation; however, accuracy at this early stage is still limited and families should understand that these studies cannot totally eliminate the possibility of congenital heart disease. Serial fetal echocardiograms have also demonstrated the importance of flow disturbance in the pathogenesis of congenital heart disease; such studies can show the intrauterine progression of a moderate lesion, such as aortic stenosis, into a more severe lesion, such as hypoplastic left heart syndrome. M-mode echocardiography can diagnose rhythm disturbances in the fetus and can determine the success of antiarrhythmic therapy administered to the mother. A screening fetal echocardiogram is recommended for women with a previous child or 1st-degree relative with congenital heart disease, for those who are at higher risk of having a child with cardiac disease (insulin-dependent diabetics, patients with exposure to teratogenic drugs during early pregnancy), and in any fetus in which a chromosomal abnormality is suspected or confirmed.
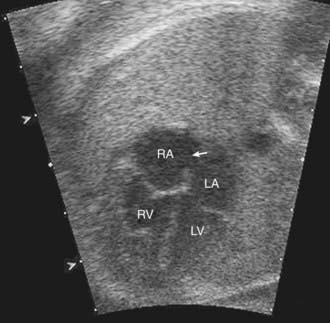
Figure 417-24 Normal four chamber view echocardiogram on a fetus at 20 wk of gestation. The foramen ovale (arrow) can be seen between the right and left atria. LA, left atrium; LV, left ventricle; RA, right atrium; RV, right ventricle.
Early detection provides the opportunity to counsel and educate the parents about the severity of the cardiac lesion and potential therapeutic or palliative care options. Referral to a high risk perinatal service is then performed, for further ultrasound screening for associated anomalies of other organs and potential amniocentesis for karyotyping. For those fetuses with ductal dependent lesions, delivery can be planned at a tertiary care center, avoiding the requirement for postnatal transport of an unstable infant.
Alagarsamy S, Chhabra M, Gudavalli M, et al. Comparison of clinical criteria with echocardiographic findings in diagnosing PDA in preterm infants. J Perinat Med. 2005;33:161-164.
Baker GH, Shirali G, Ringewald JM, et al. Usefulness of live three-dimensional transesophageal echocardiography in a congenital heart disease center. Am J Cardiol. 2009;103:1025-1028.
Benavidez OJ, Gauvreau K, Jenkins KJ, et al. Diagnostic errors in pediatric echocardiography: development of taxonomy and identification of risk factors. Circulation. 2008;117:2995-3001.
DeGroff CG. Doppler echocardiography. Pediatr Cardiol. 2002;23:307-333.
Friedberg MK, Silverman NH, Dubin AM, et al. Mechanical dyssynchrony in children with systolic dysfunction secondary to cardiomyopathy: a Doppler tissue and vector velocity imaging study. J Am Soc Echocardiogr. 2007;20:756-763.
Friedberg MK, Silverman NH, Moon-Grady AJ, et al. Prenatal detection of congenital heart disease. J Pediatr. 2009;15:26-31.
Frommelt PC. Update on pediatric echocardiography. Curr Opin Pediatr. 2005;17:579-585.
Hijazi ZM, Shivkumar K, Sahn DJ. Intracardiac echocardiography during interventional and electrophysiological cardiac catheterization. Circulation. 2009;119:587-596.
Kluckow M, Seri I, Evans N. Echocardiography and the neonatologist. Pediatr Cardiol. 2008;29:1043-1047.
417.5 Exercise Testing
The normal cardiorespiratory system adapts to the extensive demands of exercise with a several-fold increase in oxygen consumption and cardiac output. Because of the large reserve capacity for exercise, significant abnormalities in cardiovascular performance may be present without symptoms at rest or during ordinary activities. When patients are evaluated in a resting state, significant abnormalities in cardiac function may not be appreciated, or if detected, their implications for quality of life may not be recognized. Permission for children with cardiovascular disease to participate in various forms of physical activity is frequently based on totally subjective criteria. As the importance of aerobic exercise is increasingly recognized, even for children with complex congenital heart lesions, exercise testing can provide a quantitative evaluation of the child’s ability to safely participate in both competitive and noncompetitive sports. Exercise testing can also play an important role in evaluating symptoms and quantitating the severity of cardiac abnormalities.
In older children, exercise studies are generally performed on a graded treadmill apparatus with timed intervals of increasing grade and speed. In younger children, exercise studies are often performed on a bicycle ergometer. Many laboratories have the capacity to measure both cardiac and pulmonary function noninvasively during exercise. This allows measurement of both resting and maximal oxygen consumption (VO2max) and the point at which anaerobic threshold (AT) is reached, important indicators of cardiovascular fitness.
As a child grows, the capacity for work is enhanced with increased body size and skeletal muscle mass. All indices of cardiopulmonary function do not increase in a uniform manner. A major response to exercise is an increase in cardiac output, principally achieved through an increase in heart rate, but stroke volume, systemic venous return, and pulse pressure is also increased. Systemic vascular resistance is greatly decreased as the blood vessels in working muscle dilate in response to increasing metabolic demands. As the child becomes older and larger, the response of the heart rate to exercise remains prominent, but cardiac output increases because of growing cardiac volume capacity and, hence, stroke volume. Responses to dynamic exercise are not dependent solely on age. For any given body surface area, boys have a larger stroke volume than size-matched girls. This increase is also mediated by posture. Augmentation of stroke volume with upright, dynamic exercise is facilitated by the pumping action of working muscles, which overcomes the static effect of gravity and increases systemic venous return.
Dynamic exercise testing defines not only endurance and exercise capacity but also the effect of such exercise on myocardial blood flow and cardiac rhythm. Significant ST segment depression reflects abnormalities in myocardial perfusion, for example, the subendocardial ischemia that commonly occurs during exercise in children with hypertrophied left ventricles. The exercise ECG is considered abnormal if the ST segment depression is >2 mm and extends for at least 0.06 sec after the J point (onset of the ST segment) in conjunction with a horizontal-, upward-, or downward-sloping ST segment. Provocation of rhythm disturbances during an exercise study is an important method of evaluating selected patients with known or suspected rhythm disorders. The effect of pharmacologic management can also be tested in this manner.
Braden DS, Strong WF. Cardiovascular responses to exercise in childhood. Am J Dis Child. 1990;144:1255-1260.
Cava JR, Danduran MJ, Fedderly RT, et al. Exercise recommendations and risk factors for sudden cardiac death. Pediatr Clin North Am. 2004;51:1401-1420.
Friedberg MK, Silverman NH, Moon-Grady AJ, et al. Prenatal detection of congenital heart disease. J Pediatr. 2009;15:26-31.
James FW, Blomqvist CG, Freed MD, et al. Standards for exercise testing in the pediatric age group: American Heart Association Council on Cardiovascular Disease in the Young. Ad hoc committee on exercise testing. Circulation. 1982;66:1377A-1397A.
Stephens PJr, Paridon SM. Exercise testing in pediatrics. Pediatr Clin North Am. 2004;51:1569-1587.
Washington RL, van Gundy JC, Cohen C, et al. Normal aerobic and anaerobic exercise data for North American school-age children. J Pediatr. 1988;112:223-233.
417.6 MRI, MRA, CT, and Radionuclide Studies
Magnetic resonance imaging (MRI) and magnetic resonance angiography (MRA) are extremely helpful in the diagnosis and management of patients with congenital heart disease. These techniques produce tomographic images of the heart in any projection (Fig. 417-25), with excellent contrast resolution of fat, myocardium, and lung, as well as moving blood from blood vessel walls. MRI has been useful in evaluating areas that are less well visualized by echocardiography, such as distal branch pulmonary artery anatomy and anomalies in systemic and pulmonary venous return.
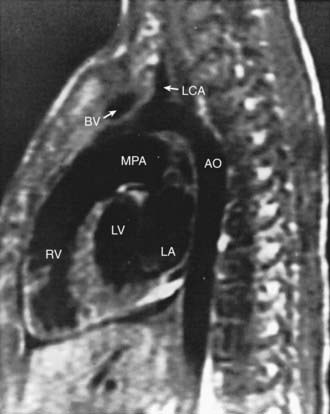
Figure 417-25 Sagittal normal MRI. Ao, aorta; BV, brachiocephalic vein; LA, left atrium; LCA, left coronary artery; LV, left ventricle; MPA, main pulmonary artery; RV, right ventricle.
(From Bisset GS III: Cardiac and great vessel anatomy. In El-Khoury GY, Bergman RA, Montgomery WJ, editors: Sectional anatomy by MRI/CT, New York, 1990, Churchill Livingstone.)
MRA allows the acquisition of images in several tomographic planes. Within each plane, images are obtained at different phases of the cardiac cycle. Thus, when displayed in a dynamic “cine” format, changes in wall thickening, chamber volume, and valve function can be displayed and analyzed. Blood flow velocity and blood flow volume can be calculated. MRA is an excellent technique for following patients serially after repair of complex congenital heart disease, such as tetralogy of Fallot. In these patients, MRA can be used to assess right ventricular volume and mass as well as quantify the amount of regurgitation through either the pulmonary or tricuspid valve. Other MRI techniques, such as myocardial delayed enhancement, can be used to quantify areas of myocardial scar in patients with cardiomyopathy or in patients after congenital heart disease repair, especially tetralogy of Fallot. Magnetic resonance spectroscopy (MRS), predominantly a research tool at present, provides a means of demonstrating relative concentrations of high-energy metabolites (adenosine triphosphate, adenosine diphosphate, inorganic phosphate, and phosphocreatine) within regions of the working myocardium.
Computer processing of MRA images allows the noninvasive visualization of the cardiovascular system from inside of the heart or vessels, a technique known as fly-through imaging. These images allow the cardiologist to image the interiors of various cardiovascular structures (Fig. 417-26). These imaging techniques are especially helpful in imaging complex peripheral arterial stenoses, especially after balloon angioplasty.
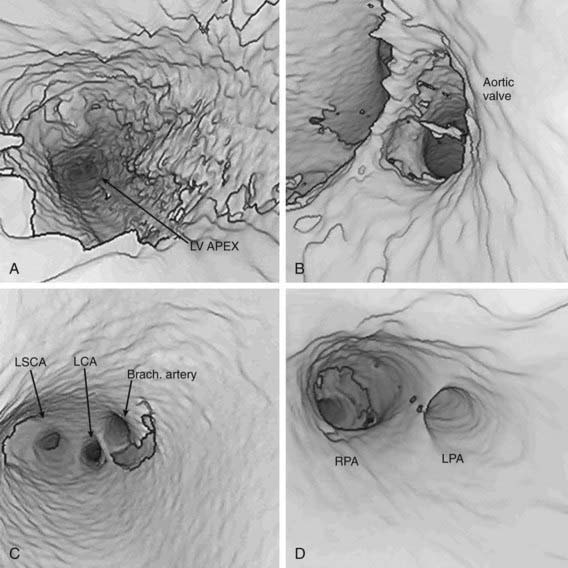
Figure 417-26 Fly-through imaging in a patient with an aortopulmonary window. This series of still frames shows the progression from the left ventricular (LV) chamber (A), through the aortic valve (B), out to the ascending aorta (C), and then through the defect to the branch pulmonary arteries (D). Brach., brachiocephalic artery; LCA, left carotid artery; LPA, left pulmonary artery; LSCA, left subclavian artery; RPA, right pulmonary artery.
CT scanning can now be used to perform rapid, respiration-gated cardiac imaging in children with resolutions down to 0.5 mm. 3-D reconstruction of CT images (Fig. 417-27) are especially useful in evaluating branch pulmonary arteries, anomalies in systemic and pulmonary venous return, and great vessel anomalies such as coarctation of the aorta.
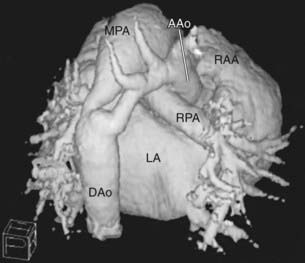
Figure 417-27 3-D reconstruction of electron beam CT images from a neonate with severe coarctation of the aorta. The patent ductus arteriosus can be seen toward the left leading from the main pulmonary artery to the descending aorta. The tortuous and narrow coarctated segment is just to the right of the ductus. The transverse aorta is hypoplastic as well. AAo, ascending aorta; DAo, descending aorta; LA, left atrium; MPA, main pulmonary artery; RAA, right atrial appendage; RPA, right pulmonary artery.
(Image courtesy of Dr. Paul Pitlick, Stanford University, Stanford, CA.)
Radionuclide angiography may be used to detect and quantify shunts and to analyze the distribution of blood flow to each lung. This technique is particularly useful in quantifying the volume of blood flow distribution between the two lungs in patients with abnormalities of the pulmonary vascular tree or after a shunt operation (Blalock-Taussig or Glenn), or to quantify the success of balloon angioplasty and intravascular stenting procedures. Gated blood pool scanning can be used to calculate hemodynamic measurements, quantify valvular regurgitation, and detect regional wall motion abnormalities. Thallium imaging can be performed to evaluate cardiac muscle perfusion. These methods can be used at the bedside of seriously ill children and can be performed serially, with minimal discomfort and low radiation exposure.
Chan FP. MR and CT imaging of the pediatric patient with structural heart disease. Semin Thorac Cardiovasc Surg. 2008;20:393-399.
Feinstein JA, Gatzoulis MA. Use of magnetic resonance imaging and computed tomography. Cardiol Young. 2009;19(Suppl 1):16-22.
Mertens L, Ganame J, Eyskens B. What is new in pediatric cardiac imaging? Eur J Pediatr. 2008;167:1-8.
Prakash A, Powell AJ, Krishnamurthy R, et al. Magnetic resonance imaging evaluation of myocardial perfusion and viability in congenital and acquired pediatric heart disease. Am J Cardiol. 2004;93:657-661.
Wald RM, Haber I, Wald R, et al. Effects of regional dysfunction and late gadolinium enhancement on global right ventricular function and exercise capacity in patients with repaired tetralogy of Fallot. Circulation. 2009;119:1370-1377.
Wolfson BJ. Radiologic interpretation of congenital heart disease. Clin Perinatol. 2001;28:71-89.
417.7 Diagnostic and Interventional Cardiac Catheterization
As echocardiography, MRI, and CT have become the standards for the diagnosis of most forms of congenital heart disease, the catheterization laboratory has become the site of high-technology interventional procedures, allowing for the nonsurgical repair or palliation of heart defects that once required open heart surgery. Some centers have developed hybrid catheterization laboratories, combining standard fluoroscopic imaging with an operating suite, allowing combined approaches to treat complex congenital heart lesions.
Diagnostic Cardiac Catheterization
Diagnostic catheterization is still performed: (1) to assist in the initial diagnosis of some complex congenital heart lesions (e.g., tetralogy of Fallot with pulmonary atresia and major aortopulmonary collateral arteries [MAPCAs], pulmonary atresia with intact ventricular septum and coronary sinusoids, hypoplastic left heart syndrome with mitral stenosis); (2) in cases in which other imaging studies are equivocal; (3) in patients for whom hemodynamic assessment is critical (to determine the size of a left-to-right shunt in borderline cases, or to determine the presence or absence of pulmonary vascular disease in an older patient with a left-to-right shunt); (4) between stages of repair of complex congenital heart disease (e.g., hypoplastic left or right heart syndromes); (5) for myocardial biopsy in the diagnosis of cardiomyopathy or in screening for cardiac rejection after cardiac transplantation; and (6) for electrophysiologic study in the evaluation of cardiac arrhythmias (Chapter 429).
Cardiac catheterization should be performed with the patient in as close to a basal state as possible. Conscious sedation is routine; if a deeper level of general anesthesia is required, careful choice of an anesthetic agent is warranted to avoid depression of cardiovascular function and subsequent distortion of the calculations of cardiac output, pulmonary and systemic vascular resistance, and shunt ratios.
Cardiac catheterization in critically ill infants with congenital heart disease should be performed in a center where a pediatric cardiovascular surgical team is available in the event that an operation is required immediately afterward. The complication rate of cardiac catheterization and angiography is greatest in critically ill infants; they must be studied in a thermally neutral environment and treated quickly for hypothermia, hypoglycemia, acidosis, or excessive blood loss.
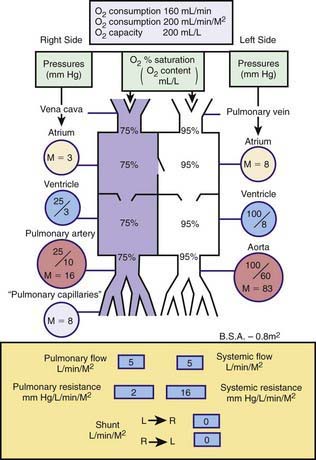
Catheterization may be limited to the right-sided cardiac structures, the left-sided structures, or both the right and left sides of the heart. The catheter is passed into the heart under fluoroscopic guidance through a percutaneous entry point in a femoral or jugular vein. In infants and in a number of older children, the left side of the heart can be accessed by passing the catheter across a patent foramen ovale to the left atrium and left ventricle. If the foramen is closed, the left side of the heart can be catheterized by passing the catheter retrograde via a percutaneous entry site in the femoral artery, or if necessary, via a trans-atrial septal puncture. The catheter can be manipulated through abnormal intracardiac defects (ASDs, VSDs). Blood samples are obtained for measuring oxygen saturation and calculating shunt volumes, pressures are measured for calculating gradients and valve areas, and radiopaque contrast is injected to delineate cardiac and vascular structures. A catheter with a thermosensor tip can be utilized for measurement of cardiac output by thermodilution. Specialized catheters can be utilized to measure more sophisticated indices of cardiac function: Those with pressure-transducer tips can be utilized to measure the first derivative of left ventricular pressure (dP/dt); and conductance catheters can be used to generate pressure-volume loops, from which indices of both contractility (end-systolic elastance) and relaxation can be derived. Complete hemodynamics can be calculated, including cardiac output, intracardiac left-to-right and right-to-left shunts, and systemic and pulmonary vascular resistances. Normal circulatory dynamics are depicted in Figure 417-28.
Thermodilution Measurement of Cardiac Output
The thermodilution method for measuring cardiac output is performed with a flow-directed, thermistor-tipped, pulmonary artery (Swan-Ganz) catheter. A known change in the heat content of the blood is induced at one point in the circulation (usually the right atrium or inferior vena cava) by injecting room temperature saline, and the resultant change in temperature is detected at a point downstream (usually the pulmonary artery). This method is used to measure cardiac output in the catheterization laboratory in patients without shunts. Monitoring cardiac output by the thermodilution method can occasionally be useful in managing critically ill infants and children in an intensive care setting after cardiac surgery or in the presence of shock. In this case, a triple-lumen catheter is used for both cardiac output determination and measurement of pulmonary artery and pulmonary capillary wedge pressure.
Angiocardiography
The major blood vessels and individual cardiac chambers may be visualized by selective angiocardiography, the injection of contrast material into specific chambers or great vessels. This method allows identification of structural abnormalities without interference from the superimposed shadows of normal chambers. Fluoroscopy is used to visualize the catheter as it passes through the various heart chambers. After the cardiac catheter is properly placed in the chamber to be studied, a small amount of contrast medium is injected with a power injector, and cineangiograms are exposed at rates ranging from 15 to 60 frames/sec. Modern catheterization labs utilize digital imaging technology, allowing for a significant reduction in radiation exposure. Biplane cineangiocardiography allows detailed evaluation of specific cardiac chambers and blood vessels in 2 planes simultaneously with the injection of a single bolus of contrast material. This technique is standard in pediatric cardiac catheterization laboratories and allows one to minimize the volume of contrast material used, which is safer for the patient. Various angled views (e.g., left anterior oblique, cranial angulation) are used to display specific anatomic features best in individual lesions.
Rapid injection of contrast medium under pressure into the circulation is not without risk, and each injection should be carefully planned. Contrast agents consist of hypertonic solutions, with some containing organic iodides, which can cause complications, including nausea, a generalized burning sensation, central nervous system symptoms, renal insufficiency, and allergic reactions. Intramyocardial injection is generally avoided by careful placement of the catheter before injection. Hypertonicity of the contrast medium may result in transient myocardial depression and a drop in blood pressure, followed soon afterward by tachycardia, an increase in cardiac output, and a shift of interstitial fluid into the circulation. This shift can transiently increase the symptoms of heart failure in critically ill patients.
Interventional Cardiac Catheterization
The miniaturization of catheter delivery systems has allowed for the safe application of many of these interventional catheterization techniques, even in neonates and premature infants. Catheter treatment is now the standard of practice for most cases of isolated pulmonary or aortic valve stenosis (see Fig. 421-4) as well as for re-coarctation of the aorta. A special catheter with a sausage-shaped balloon at the distal end is passed through the obstructed valve. Rapid filling of the balloon with a mixture of contrast material and saline solution results in tearing of the stenotic valve tissue, usually at the site of inappropriately fused raphe. Valvular pulmonary stenosis can be treated successfully by balloon angioplasty; in most patients, angioplasty has replaced surgical repair as the initial procedure of choice. The clinical results of this procedure are similar to those obtained by open heart surgery, but without the need for sternotomy or prolonged hospitalization. Balloon valvuloplasty for aortic stenosis has also yielded excellent results, although, as with surgery, aortic stenosis often recurs as the child grows and multiple procedures may thus be required. One complication of both valvuloplasty and surgery is the creation of valvular insufficiency. This complication has more serious implications when it occurs on the aortic vs the pulmonary side of the circulation because regurgitation is less well tolerated at systemic arterial pressures. Balloon angioplasty is the procedure of choice for patients with re-stenosis of coarctation of the aorta after earlier surgery. It is controversial whether angioplasty is the best procedure for native (unoperated) coarctation of the aorta because of reports of later aneurysm formation and most centers still refer primary coarctation in infants and young children for surgical repair. However, in older patients with previously undiagnosed coarctation, especially those with decreased left ventricular function, primary angioplasty with possible stent placement, may be considered. Other applications of the balloon angioplasty technique include amelioration of mitral stenosis, dilatation of surgical conduits (Mustard or Senning atrial baffles), relief of branch pulmonary artery narrowing, dilatation of systemic or pulmonary venous obstructions, and the long-used balloon atrial septostomy (Rashkind procedure) for transposition of the great arteries (Chapter 425.2).
Interventional catheterization techniques are being adapted for use in the fetus with lesions such as aortic stenosis in an attempt to prevent their progression to more complex lesions such as hypoplastic left heart syndrome. In these procedures, after administration of appropriate anesthesia, a needle is passed through the maternal abdominal wall, the uterine wall, and the fetal chest wall and directly into the fetal left ventricle (see Fig. 425-13). A coronary angioplasty balloon catheter is passed through the needle and across the stenotic aortic valve, which is then dilated. With the restoration of normal left ventricular blood flow, it is to be hoped that normal left ventricular growth potential is restored. Mid-term results with this technique in a growing number of patients show mixed results with good ventricular growth leading to a two-ventricle circulation in approximately 25% of patients.
In patients with branch pulmonary artery stenoses, the previously mixed results with balloon angioplasty alone have been enhanced with the use of intravascular stents (Fig. 417-29) delivered over a balloon catheter and expanded within the vessel lumen. Once placed, they can often be dilated to successively greater sizes as the patient grows, although their use in younger infants and children is limited by the extent to which they can be further expanded. Research into biodissolvable stents may solve this problem in the future. Stents are also being utilized in adolescents and young adults with coarctation of the aorta.
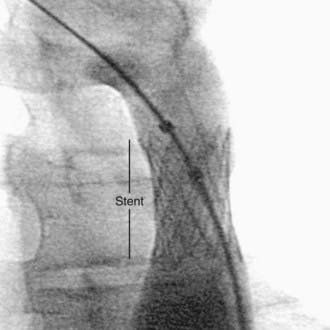
Figure 417-29 Intravascular stent placed in the descending aorta for treatment of recurrent coarctation of the aorta.
Closure of a small PDA is now routinely achieved with catheter-delivered coils (see Fig. 420-11), whereas a larger PDA can be closed with a variety of sandwich-type devices. Closure of anomalous vascular connections (coronary fistulas, veno-venous collaterals in cyanotic heart lesions) can also be achieved using coils. Secundum ASDs are now routinely closed with a double disc occluder device (see Fig. 420-3). Versions of these devices are currently in clinical trials for closure of surgically hard-to-reach muscular VSDs and even for the more common perimembranous VSD. Catheter-delivered devices may also be used as an adjunct to complex surgical repairs (dilation or stenting of branch pulmonary artery or pulmonary vein stenosis or closure of a difficult to reach muscular VSD). High-risk patients undergoing the Fontan operation (Chapter 430.4) often have a small fenestration created between the right and left sides of the circulation to serve as a “popoff valve” for high right-sided pressure in the early surgical period. Patients with these “fenestrated Fontans” are usually candidates for subsequent closure of the fenestration with a catheter-delivered device.
Andrews RE, Tulloh RMR. Interventional cardiac catheterization in congenital heart disease. Arch Dis Child. 2004;89:1168-1173.
Bacha EA, Cao QL, Galantowicz ME, et al. Multicenter experience with periventricular device closure of muscular ventricular septal defects. Pediatr Cardiol. 2005;26:169-175.
Feinstein JA, Kim N, Reddy VM, et al. Percutaneous pulmonary valve placement in a 10-month-old patient using a hand crafted stent-mounted porcine valve. Catheter Cardiovasc Interv. 2006;67:644-649.
Holzer R, Hijazi ZM. Interventional approach to congenital heart disease. Curr Opin Cardiol. 2004;19:84-90.
Knauth AL, Lock JE, Perry SB, et al. Transcatheter device closure of congenital and postoperative residual ventricular septal defects. Circulation. 2004;110:501-507.
Kutty S, Zahn EM. Interventional therapy for neonates with critical congenital heart disease. Catheter Cardiovasc Interv. 2008;72:663-674.
Masura J, Gavora P, Podnar T. Long-term outcome of transcatheter secundum-type atrial septal defect closure using Amplatzer septal occluders. J Am Coll Cardiol. 2005;45:505-507.
Michelfelder E, Polzin W, Hirsch R. Hypoplastic left heart syndrome with intact atrial septum: Utilization of a hybrid catheterization facility for cesarean section delivery and prompt neonatal intervention. Catheter Cardiovasc Interv. 2008;72:983-987.
Tworetzky W, Marshall AC. Fetal interventions for cardiac defects. Pediatr Clin North Am. 2004;51:1503-1513.