Intake
Energy
Sections of this chapter were written by Rachel Johnson, PhD, RD and Carol D. Frary, MS, RD for the previous edition of this text.
Energy may be defined as “the capacity to do work.” The ultimate source of all energy in living organisms is the sun. Through the process of photosynthesis, green plants intercept a portion of the sunlight reaching their leaves and capture it within the chemical bonds of glucose. Proteins, fats, and other carbohydrates are synthesized from this basic carbohydrate to meet the needs of the plant. Animals and humans obtain these nutrients and the energy they contain by consuming plants and the flesh of other animals.
The body makes use of the energy from dietary carbohydrates, proteins, fats, and alcohol; this energy is locked in chemical bonds within food and is released through metabolism. Energy must be supplied regularly to meet needs for the body’s survival. Although all energy eventually takes the form of heat, which dissipates into the atmosphere, unique cellular processes first make possible its use for all of the tasks required for life. These processes involve chemical reactions that maintain body tissues, electrical conduction of the nerves, mechanical work of the muscles, and heat production to maintain body temperature.
Energy Requirements
Energy requirements are defined as the dietary energy intake that is required for growth or maintenance in a person of a defined age, gender, weight, height, and level of physical activity. In children and pregnant or lactating women, energy requirements include the needs associated with the deposition of tissues or the secretion of milk at rates consistent with good health (Institute of Medicine, 2002, 2005). In ill or injured people, the stressors have an effect by increasing or decreasing energy expenditure (Joffe, 2009).
Body weight is one indicator of energy adequacy or inadequacy. The body has the unique ability to shift the fuel mixture of carbohydrates, proteins, and fats to accommodate energy needs. However, consuming too much or too little energy over time results in body weight changes. Thus body weight reflects adequacy of energy intake, but it is not a reliable indicator of macronutrient or micronutrient adequacy. Additionally, because body weight is affected by body composition, a person with a higher lean mass to body fat mass or body fat mass to lean mass may require differing energy intakes compared with the norm or “average” person.
Components of Energy Expenditure
Energy is expended by the human body in the form of basal energy expenditure (BEE), thermic effect of food (TEF), and activity thermogenesis (AT). These three components make up a person’s daily total energy expenditure (TEE) (Figure 2-1).
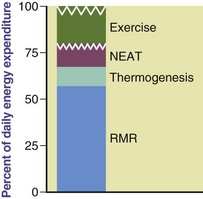
FIGURE 2-1 The components of total energy expenditure: activity, diet-induced thermogenesis, and basal or resting metabolic rate.
Basal and Resting Energy Expenditure
BEE, or basal metabolic rate (BMR), is the minimum amount of energy expended that is compatible with life. An individual’s BEE reflects the amount of energy used during 24 hours while physically and mentally at rest in a thermoneutral environment that prevents the activation of heat-generating processes, such as shivering. Measurements of BEE should be done before an individual has engaged in any physical activity (preferably on awakening from sleep) and 10 to 12 hours after the ingestion of any food, drink, or nicotine. The BEE remains remarkably constant on a daily basis, typically representing 60% to 70% of TEE (see Figure 2-1).
Resting energy expenditure (REE), or resting metabolic rate (RMR), is the energy expended in the activities necessary to sustain normal body functions and homeostasis. These activities include respiration and circulation, the synthesis of organic compounds, and the pumping of ions across membranes. It includes the energy required by the central nervous system and for the maintenance of body temperature. For practical reasons the BEE is now rarely measured. REE measurements are used in its place, which in most cases are higher than the BEE by 10% to 20% (Institute of Medicine, 2002, 2005). The terms REE and RMR and BEE and BMR can be used interchangeably, but REE and BEE are used in this chapter.
Factors Affecting Resting Energy Expenditure
Numerous factors cause the REE to vary among individuals, but body size and composition have the greatest effect. See Chapter 4 for discussion of methods used to determine body composition.
Age: Because REE is highly affected by the proportion of lean body mass (LBM), it is highest during periods of rapid growth, especially the first and second years of life (Butte et al., 2000). The additional energy required for synthesizing and depositing body tissue is approximately 5 kcal/g of tissue gained (Roberts and Young, 1988). Growing infants may store as much as 12% to 15% of the energy value of their food in the form of new tissue. As a child becomes older, the energy requirement for growth is reduced to approximately 1% of TEE. After early adulthood there is a decline in REE of 1% to 2% per kilogram of fat-free mass (FFM) per decade (Keys et al., 1973; Van Pelt, 2001). Fortunately, exercise can help maintain a higher LBM and a higher REE. Decreases in REE with increasing age may be partly related to age-associated changes in the relative size of LBM components (Gallagher et al., 2006).
Body Composition: Fat-free mass (FFM), or LBM, comprises the majority of metabolically active tissue in the body and is the primary predictor of REE. FFM contributes to approximately 80% of the variations in REE (Bosy-Westphal et al., 2004). Because of their greater FFM, athletes with greater muscular development have approximately a 5% higher resting metabolism than nonathletic individuals. Organs in the body contribute to heat production (Figure 2-2). Approximately 60% of REE can be accounted for by the heat produced by high-metabolic-rate organs (HMROs), that is, the liver, brain, heart, spleen, and kidneys (Gallagher et al., 1998). Indeed, differences in FFM between ethnic groups may be related to the total mass of these HRMOs (Gallagher et al, 2006). Relatively small individual variation in HMRO mass significantly affects REE (Javed et al., 2010).
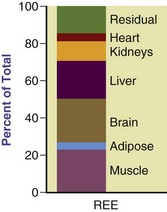
FIGURE 2-2 Proportional contribution of organs and tissues to calculated resting energy expenditure. (Modified and used with permission from Gallagher D et al: Organ-tissue mass measurement allows modeling of REE and metabolically active tissue mass, Am J Physiol Endocrinol Metab 275:E249, 1998. Copyright American Physiological Society.)
Body Size: Larger people generally have higher metabolic rates than smaller people, but tall, thin people have higher metabolic rates than short, wide people. For example, if two people weigh the same but one person is taller, the taller person has a larger body surface area and a higher metabolic rate (Cereda, 2009). The amount of LBM is highly correlated with total body size. For example, obese children have higher REEs than nonobese children, but, when REE is adjusted for body composition, FFM, and fat mass, no REE differences are found (Byrne, 2003).
Climate: The REE is affected by extremes in environmental temperature. People living in tropical climates usually have REEs that are 5% to 20% higher than those living in temperate areas. Exercise in temperatures greater than 86° F imposes a small additional metabolic load of approximately 5% from increased sweat gland activity. The extent to which energy metabolism increases in extremely cold environments depends on the insulation available from body fat and protective clothing (Dobratz et al., 2007).
Gender: Gender differences in metabolic rates are attributable primarily to differences in body size and composition. Women, who generally have more fat in proportion to muscle than men, have metabolic rates that are approximately 5% to 10% lower than men of the same weight and height. However, with aging, this difference becomes less pronounced (Poehlman, 1993).
Hormonal Status: Hormones affect metabolic rate. Endocrine disorders, such as hyperthyroidism and hypothyroidism, increase or decrease energy expenditure, respectively. Stimulation of the sympathetic nervous system during periods of emotional excitement or stress causes the release of epinephrine, which promotes glycogenolysis and increased cellular activity. Ghrelin and peptide YY are gut hormones involved in appetite regulation and energy homeostasis (Larson-Meyer et al., 2010). The metabolic rate of women fluctuates with the menstrual cycle. During the luteal phase (i.e., the time between ovulation and the onset of menstruation), metabolic rate increases slightly (Ferraro, 1992). During pregnancy, growth in uterine, placental, and fetal tissues, along with the mother’s increased cardiac workload, contributes to gradual increases in BEE (Butte et al., 2004).
Temperature: Fevers increase REE by approximately 7% for each degree of increase in body temperature more than 98.6° F or 13% for each degree more than 37° C as noted by classic studies (Hardy and DuBois, 1937). Studies in hospitalized patients have demonstrated increases in energy expenditure during fever as well as during cooling, varying according to the patient’s condition (Bruder et al., 1998).
Other Factors: Caffeine, nicotine, and alcohol use stimulate metabolic rate. Caffeine intakes of 200 to 350 mg in men or 240 mg in women may increase mean REE by 7% to 11% and 8% to 15%, respectively (Compher et al., 2006). Nicotine use increases REE by approximately 3% to 4% in men and by 6% in women; alcohol consumption increases REE in women by 9% (Compher et al., 2006). Under conditions of stress and disease, energy expenditure may increase or decrease, based on the clinical situation. Energy expenditure may be higher in people who are obese (Dobratz et al., 2007), but depressed during starvation or chronic dieting and in people with anorexia nervosa (Sedlet and Ireton-Jones, 1989).
Thermic Effect of Food
The thermic effect of food (TEF) is the increase in energy expenditure associated with the consumption, digestion, and absorption of food. The TEF accounts for approximately 10% of TEE (Institute of Medicine, 2002). The TEF may also be called diet-induced thermogenesis, specific dynamic action, or the specific effect of food. TEF can be separated into obligatory and facultative (or adaptive) subcomponents. Obligatory thermogenesis is the energy required to digest, absorb, and metabolize nutrients, including the synthesis and storage of protein, fat, and carbohydrates. Adaptive or facultative thermogenesis is the “excess” energy expended in addition to the obligatory thermogenesis and is thought to be attributable to the metabolic inefficiency of the system stimulated by sympathetic nervous activity.
The TEF varies with the composition of the diet, with energy expenditure increasing directly after food intake, particularly after consumption of a meal higher in protein compared with a meal higher in fat (Tentolouris et al., 2008). Fat is metabolized efficiently, with only 4% wastage, compared with 25% wastage when carbohydrate is converted to fat for storage. These factors are thought to contribute to the obesity-promoting characteristics of fat (Prentice, 1995). Although the extent of TEF depends on the size and macronutrient content of the meal, TEF decreases after ingestion over 30 to 90 minutes. Furthermore, the macronutrient oxidation rate is not different in lean and obese individuals (Tentolouris et al., 2008).
Spicy foods enhance and prolong the effect of the TEF. Meals with chili and mustard may increase the metabolic rate as much as 33% over that after an unspiced meal, and this effect may last for more than 3 hours (McCrory et al., 1994). Caffeine, capsaicin, and different teas such as green, white, and oolong tea may also increase energy expenditure and fat oxidation (Hursel and Westerterp-Plantenga, 2010). The role of TEF in weight management is discussed in Chapter 22.
Actual measurement of the TEF is appropriate only for research purposes. Thus to measure the TEF, it would be necessary to determine BEE and the energy expended in excess of BEE every 30 minutes for at least 5 hours after a meal. For practical purposes, it is calculated as no more than an additional 10% of the REE added to the sum of the REE and the activity thermogenesis.
Activity Thermogenesis
Beyond REE and TEF, energy is expended in activity, either exercise related or part of daily work and movement. Although it can be broken down into two categories, for most individuals, additional kilocalorieskcals are allocated for the more general term “activity,” which includes activity thermogenesis (AT) and nonexercise activity thermogenesis (NEAT). AT is the energy expended during sports or fitness exercise; the energy expended during activities of daily living is referred to as NEAT (Levine and Kotz, 2005). The contribution of physical activity is the most variable component of TEE, which may be as low as 100 kilocalories (kcal)/day in sedentary people or as high as 3000 kcal/day in athletes. NEAT represents the energy expended during the work day and during leisure-type activities (e.g., shopping, fidgeting, even gum chewing), which may account for vast differences in energy costs among people (Levine and Kotz, 2005); see Appendix 28.
Individual AT varies considerably, depending on body size and the efficiency of individual habits of motion. The level of fitness also affects the energy expenditure of voluntary activity because of variations in muscle mass. AT tends to decrease with age, a trend that is associated with a decline in FFM and an increase in fat mass (Roubenoff et al., 2000). In general, men have a greater skeletal muscle than women, which may account for their higher AT (Janssen et al., 2000).
Excess postexercise oxygen consumption (EPOC) affects energy expenditure. The duration and magnitude of physical activity increase EPOC, resulting in an elevated metabolic rate even after exercise has ceased (Bahr et al., 1992). Habitual exercise does not cause a significantly prolonged increase in metabolic rate per unit of active tissue, but it has been shown to cause an 8% to 14% higher metabolic rate in men who are moderately and highly active, respectively, because of their increased FFM (Horton and Geissler, 1994). These differences seem to be related to the person, not to the activity.
Measurement of Energy Expenditure
The standard unit for measuring energy is the calorie, which is the amount of heat energy required to raise the temperature of 1 ml of water at 15° C by 1° C. Because the amount of energy involved in the metabolism of food is fairly large, the kilocalorie (kcal), 1000 calories, is used to measure it. A popular convention is to designate kilocalorie by Calorie (with a capital C). In this text, however, kilocalorie is abbreviated kcal. The joule (J) measures energy in terms of mechanical work and is the amount of energy required to accelerate with a force of 1 Newton (N) for a distance of 1 m; this measurement is widely used in countries other than the United States. One kcal is equivalent to 4.184 kilojoules (kJ).
Because various methods are available to measure human energy expenditure, it is important to gain an understanding of the differences in these methods and how they can be applied in practical and research settings.
Direct Calorimetry
Direct calorimetry is possible only with very specialized and expensive equipment. An individual is monitored in a room-type structure (a whole-room calorimeter) that permits a moderate amount of activity. It includes equipment that monitors the amount of heat produced by the individual inside. Direct calorimetry provides a measure of energy expended in the form of heat but provides no information on the kind of fuel being oxidized. The method is also limited by the confined nature of the testing conditions. Hence the measurement of TEE using this method is not representative of a free-living (i.e., engaged in normal daily activities) individual in a normal environment because physical activity within the chamber is limited. High cost, complex engineering, and scarcity of appropriate facilities around the world also limit the use of this method.
Indirect Calorimetry
Indirect calorimetry (IC) is a more commonly used method for measuring energy expenditure. An individual’s oxygen consumption and carbon dioxide production are quantified over a given period. The Weir equation (1949) and a constant respiratory quotient value of 0.85 are used to convert oxygen consumption to REE. The equipment varies but usually involves an individual breathing into a mouthpiece (with nose clips), a mask that covers the nose and mouth, or a ventilated hood that captures all expired carbon dioxide (Figure 2-3). Ventilated hoods are useful for short- and long-term measurements.
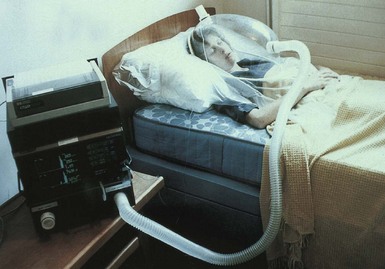
FIGURE 2-3 Measuring resting metabolic rate using a ventilated hood system. (Courtesy of MRC Mitochondrial Biology Unit, Cambridge, England.)
IC measurements are achieved through the use of equipment called a metabolic measurement cart or monitor. There are various types of metabolic measurement carts, varying from larger equipment that measures oxygen consumption and carbon dioxide production only to equipment that also has the capability of providing pulmonary function and exercise testing parameters. These larger carts are more expensive because of the expanded capabilities, including measurement interface for IC measurements of hospitalized patients who are ventilator dependent. Metabolic carts are often used at hospitals to assess energy requirements and are most typically found in the intensive care unit (Ireton-Jones, 2010). Individuals and patients who are spontaneously breathing may have their energy expenditure measured with smaller “handheld” indirect calorimeters designed specifically for measuring oxygen consumption while using a static value for carbon dioxide production (St-Onge, 2004). These have easy mobility and relatively low equipment cost.
A strict protocol should be followed before performing IC measurement. For “normal” healthy people, a minimum of a 5-hour fast after meals and snacks is recommended. Caffeine should be avoided for at least 4 hours and alcohol and smoking for at least 2 hours. Testing should occur no sooner than 2 hours after moderate exercise; following vigorous resistance exercise, a 14-hour period is advised (Compher et al., 2006). To achieve a steady-state measurement, there should be a rest period of 10 to 20 minutes before the measurement is taken. An IC measurement duration of 10 minutes with the first 5 minutes deleted and the remaining 5 minutes having a coefficient of variation less than 10% indicates a steady-state measurement (Compher et al., 2006). When the measurement conditions listed here are met and a steady state is achieved, energy expenditure can be measured at any time during the day.
Energy expenditure can be measured for ill or injured individuals as well. Equipment used for the patient who is ventilator dependent may be different from that used for the ambulatory individual; however, a protocol specifying the conditions of measurement should be used for these patients as well (Ireton-Jones, 2010). When these conditions are met, IC can be applied for measuring the energy expenditure of acute or critically ill inpatients, outpatients, or healthy individuals.
Respiratory Quotient
When oxygen consumption and carbon dioxide production are measured, respiratory quotient (RQ) may be calculated as noted in the following equation. The RQ indicates the fuel mixture being metabolized. The RQ for carbohydrate is 1 because the number of carbon dioxide molecules produced is equal to the number of oxygen molecules consumed.
RQ values:
RQs greater than 1 are associated with net fat synthesis; carbohydrate (glucose) intake or total caloric intake that is excessive, whereas a very low RQ may be seen under conditions of inadequate nutrient intake (Elia and Livesey, 1988; Ireton-Jones and Turner, 1987; McClave et al., 2003). Although RQ has been used to determine the efficacy of nutrition support regimens for hospitalized patients, McClave found that changes in RQ failed to correlate to percent calories provided or required, indicating low sensitivity and specificity that limits the efficacy of RQ as an indicator of overfeeding or underfeeding. It is appropriate to use RQ as a marker of test validity (to confirm measured RQ values are in physiologic range) and a marker for respiratory tolerance of the nutrition support regimen.
Other Methods of Measuring Energy Expenditure
Doubly Labeled Water: The doubly labeled water (DLW) technique for measuring TEE is considered the gold standard for determining energy requirements and energy balance in humans. The method was first applied to humans in 1982, and since that time scientists have developed a database that is used to develop recommendations for energy intake (Institute of Medicine, 2002; 2005). The DLW method is based on the principle that carbon dioxide production can be estimated from the difference in the elimination rates of body hydrogen and oxygen. After administering an oral loading dose of water labeled with deuterium oxide (2H2O) and oxygen-18 (H218O)—hence the term doubly labeled water—the 2H2O is eliminated from the body as water, and the H218O is eliminated as water and carbon dioxide. The elimination rates of the two isotopes are measured for 10 to 14 days by periodic sampling of body water from urine, saliva, or plasma. The difference between the two elimination rates is a measure of carbon dioxide production. Carbon dioxide production can then be equated to TEE using standard IC techniques for the calculation of energy expenditure.
The DLW technique has numerous characteristics that make it a useful method for measuring TEE in various populations (Friedman and Johnson, 2002). First, it provides a measure of energy expenditure that incorporates all the components of TEE, REE, TEF, and AT. The administration is easy, and the person is able to engage in typical activities of daily living throughout the measurement period. Therefore the technique provides a measure of the person’s usual daily TEE, which is beneficial for those such as infants, young children, older adults, and disabled individuals who cannot easily withstand the rigorous testing involved in the measurement of oxygen consumption during various activities. DLW also provides a method by which more subjective estimates of energy intakes (e.g., diet recalls, records) and energy expenditure (e.g., physical activity logs) can be validated (Schoeller, 1990). Most important, the method is accurate and has a precision of 2% to 8% (Plasqui and Westerterp, 2007).
The DLW technique is clearly most applicable as a research tool; the stable isotopes are expensive, and expertise is required to operate the highly sophisticated and costly mass spectrometer for the analysis of the isotope enrichments. These disadvantages make the DLW technique impractical for daily use by clinicians. However, DLW research studies have provided the data used to develop some prediction equations to estimate total energy requirements (Institute of Medicine, 2002; 2005). These equations should be used only as a guide or starting point, after which the person must be monitored closely and interventions developed to promote optimal nutrition status. As with most equations, these apply to healthy individuals, not to those who are ill, injured, or requiring intensive nutrition support (Wells et al., 2002).
Measuring Activity-Related Energy Expenditure
Doubly Labeled Water: The caloric value of AT can be estimated by using the DLW method in conjunction with IC. After the postprandial REE (which includes a measure of the TEF) has been measured using IC, an estimated AT can be determined by subtracting the postprandial REE from the TEE that was measured using DLW (Goran et al., 1995). This method is generally used only in research settings but can be used to validate other, more practical and easily administered methods of measuring physical activity.
Uniaxial Monitors: Uniaxial monitors measure the degree and intensity of movement in a vertical plane. Resembling a pager worn on the hip, the uniaxial monitor is a portable device designed for children and adults to estimate activity-related energy expenditure. Among adults, the uniaxial monitor was found to be an effective tool for measuring energy expenditure when compared with the DLW technique (Gretebeck et al., 1991; 1992). It may be acceptable for estimates of activity-related energy expenditure in groups of people, but it has limited use with individuals.
A triaxial monitor has also been used to measure energy related to activity (Philips Research, Eindhoven, The Netherlands). It more efficiently measures multidirectional movement by employing three uniaxial monitors. In a review of numerous articles, Plasqui and Westerterp (2007) found that a triaxial monitor correlated with energy expenditure measured using DLW technique. Application of an easily accessible and useable monitor allows determination of real activity levels, thereby reducing errors related to overreporting or underreporting of actual energy expenditure for weight management.
Physical Activity Questionnaire
Physical activity questionnaires (PAQs) are the simplest and least expensive tools for gaining information about an individual’s activity level (Winters-Hart et al., 2004.) DLW allows researchers to determine the validity of these questionnaires. The Seven-Day Recall and the Yale Physical Activity Survey are two questionnaires that are validated (Bonnefoy et al., 2001). The Baecke questionnaire and an adapted version of the Tecumseh Community Health Study questionnaire are useful for determining whether a group or an individual is active or inactive (Philippaerts et al., 1999). Reporting errors are common among PAQs, which can lead to discrepancies between calculated energy expenditure and that determined by DLW (Neilson et al., 2008). For normal individuals, this may account for slowed weight loss or gain and, as such, a need to modify caloric intake.
Estimating Energy Requirements
Equations for Estimating Resting Energy Expenditure
Over the years several equations have been developed to estimate the REE. Equations are available that allow the estimation of REE as derived from measurement using IC in adults. Until recently, the Harris-Benedict equations were some of the most widely used equations to estimate REE in normal and ill or injured individuals (Harris and Benedict, 1919). The Harris-Benedict formulas have been found to overestimate REE in normal weight and obese individuals by 7% to 27% (Frankenfield, 2003). A study comparing measured REE with estimated REE using the Mifflin-St. Jeor equations, Owen equations, and Harris-Benedict equations for both males and females found that the Mifflin-St. Jeor equations were most accurate in estimating REE in both normal weight and obese people (Frankenfield et al., 2003; Owen et al., 1986; Owen et al., 1987). The Mifflin-St Jeor equations were developed from measured REE using IC in 251 males and 247 females; 47% of these individuals had a body mass index (BMI) between 30 and 42 kg/m2 (Mifflin et al., 1990). These equations are as follows:
Mifflin-St. Jeor Equations


Although the Harris-Benedict equations have been applied to ill and injured people, these equations, as well as those of Mifflin, were developed for use in “normal” healthy individuals, and their application to any other population is questionable. For energy requirements for critically ill patients, see Chapter 39.
Estimating Energy Requirements from Energy Intake
Traditionally, recommendations for energy requirements were based on self-recorded estimates (e.g., diet records) or self-reported estimates (e.g., 24-hour recalls) of food intake. However, it is now well accepted that these methods do not provide accurate or unbiased estimates of an individual’s energy intake. The percentage of people who underestimate or underreport their food intake ranges from 10% to 45%, depending on the person’s age, gender, and body composition. Underestimating tends to increase as children age, is worse among women than men, and is more prevalent and severe among obese people (Johnson, 2000).
Multiple online programs are available whereby an individual can enter the food and quantity consumed into a program that will estimate the macronutrient and micronutrient content. These programs allow users to enter data and receive a summary report, often with a detailed report provided to the health professional as well. Widely available programs include Food Prodigy and the MyPlate Tracker from the United States Department of Agriculture.
Energy Requirements Prediction Equations
The National Academy of Sciences, Institute of Medicine, and Food and Nutrition Board, in partnership with Health Canada, developed the estimated energy requirements for men, women, children, and infants and for pregnant and lactating women (Institute of Medicine, 2002; 2005). The estimated energy requirement (EER) is the average dietary energy intake that is predicted to maintain energy balance in a healthy adult of a defined age, gender, weight, height, and level of physical activity consistent with good health. In children and pregnant and lactating women, the EER is taken to include the energy needs associated with the deposition of tissues or the secretion of milk at rates consistent with good health. Table 2-1 lists average dietary reference intake (DRI) values for energy in healthy, active people of reference height, weight, and age for each life-stage group (Institute of Medicine, 2002; 2005).
TABLE 2-1
Intensity and Effect of Various Activities on Physical Activity Level in Adults*
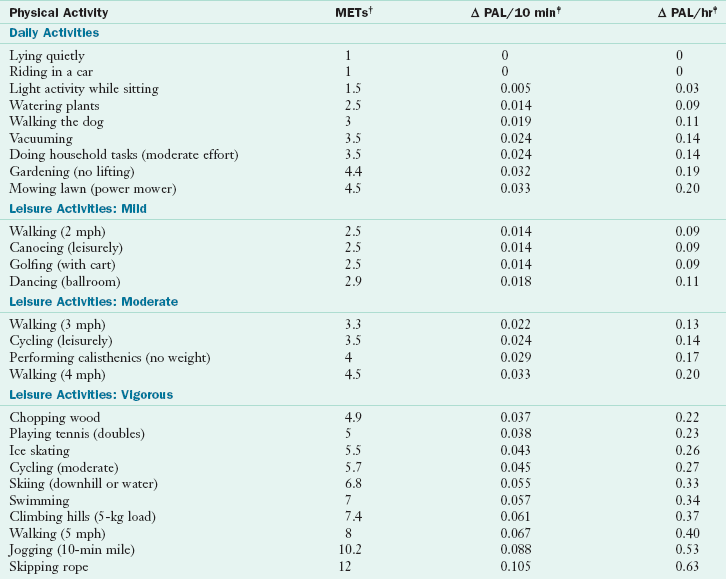
MET, Metabolic equivalent; PAL, physical activity level.
*PAL is the physical activity level that is the ratio of the total energy expenditure to the basal energy expenditure.
†METs are multiples of an individual’s resting oxygen uptakes, defined as the rate of oxygen (O2) consumption of 3.5 ml of O2/min/kg body weight in adults.
‡The Δ PAL is the allowance made to include the delayed effect of physical activity in causing excess postexercise oxygen consumption and the dissipation of some of the food energy consumed through the thermic effect of food.
Modified from Institute of Medicine of The National Academies: Dietary reference intakes for energy, carbohydrate, fiber, fat, fatty acids, protein, and amino acids, Washington, DC, 2002, The National Academies Press.
Supported by DLW studies, prediction equations have been developed to estimate energy requirements for people according to their life-stage group. Box 2-1 lists the EER prediction equations for people of normal weight. TEE prediction equations are also listed for various overweight and obese groups, as well as for weight maintenance in obese girls and boys. All equations have been developed to maintain current body weight (and promote growth when appropriate) and current levels of physical activity for all subsets of the population; they are not intended to promote weight loss (Institute of Medicine, 2002; 2005).
The EER incorporates age, weight, height, gender, and level of physical activity for people ages 3 years and older. Although variables such as age, gender, and feeding type (i.e., breast milk, formula) can affect TEE among infants and young children, weight has been determined as the sole predictor of TEE needs (Institute of Medicine, 2002; 2005). Beyond TEE requirements, additional calories are required for infants and young children and children ages 3 through 18 to support the deposition of tissues needed for growth, and for pregnant and lactating women; thus the EER among these subsets of the population is the sum of TEE plus the caloric requirements for energy deposition.
The prediction equations include a physical activity (PA) coefficient for all groups except infants and young children (see Box 2-1). PA coefficients correspond to four physical activity level (PAL) lifestyle categories: sedentary, low active, active, and very active. Because PAL is the ratio of TEE to BEE, the energy spent during activities of daily living, the sedentary lifestyle category has a PAL range of 1 to 1.39. PAL categories beyond sedentary are determined according to the energy spent by an adult walking at a set pace (Table 2-2). The walking equivalents that correspond to each PAL category for an average-weight adult walking at 3 to 4 mph are 2, 7, and 17 miles per day, respectively (Institute of Medicine, 2002; 2005).
TABLE 2-2
Physical Activity Level Categories and Walking Equivalence*
| PAL Category | PAL Values | Walking Equivalence (miles/day at 3-4 mph) |
| Sedentary | 1-1.39 | |
| Low active | 1.4-1.59 | 1.5, 2.2, 2.9 for PAL = 1.5 |
| Active | 1.6-1.89 | 3, 4.4, 5.8 for PAL = 1.6 |
| 5.3, 7.3, 9.9 for PAL = 1.75 | ||
| Very active | 1.9-2.5 | 7.5, 10.3, 14 for PAL = 1.9 |
| 12.3, 16.7, 22.5 for PAL = 2.2 | ||
| 17, 23, 31 for PAL = 2.5 |
*In addition to energy spent for the generally unscheduled activities that are part of a normal daily life. The low, middle, and high miles/day values apply to relatively heavyweight (120-kg), midweight (70-kg), and lightweight (44-kg) individuals, respectively.
From Institute of Medicine, The National Academies: Dietary reference intakes for energy, carbohydrate, fiber, fat, fatty acids, cholesterol, protein, and amino acids, Washington, DC, 2002/2005, The National Academies Press.
Estimated Energy Expended in Physical Activity
Energy expenditure in physical activity can be estimated using either the method shown in Appendix 28, which represents energy spent during common activities and incorporates body weight and the duration of time for each activity as variables, or using information in the DRI tables (see tables on inside front cover), which represents energy spent by adults during various intensities of physical activity—energy that is expressed as metabolic equivalents (METs) (Institute of Medicine, 2002; 2005).
Estimating Energy Expenditure of Selected Activities Using Metabolic Equivalents
Metabolic equivalents (METs) are units of measure that correspond with a person’s metabolic rate during selected physical activities of varying intensities and are expressed as multiples of REE (Institute of Medicine, 2002; 2005). An MET value of 1 is the oxygen metabolized at rest (3.5 mL of oxygen per kilogram of body weight per minute in adults) and can be expressed as 1 kcal/kg of body weight per hour (Ainsworth et al., 1993). Thus the energy expenditure of adults can be estimated using MET values (1 MET = 1 kcal/kg/hour). For example, an adult who weighs 65 kg and is walking moderately at a pace of 4 mph (which is a MET value of 4.5) would expend 293 calories in one hour (4.5 kcal × 65 kg × 1 = 293).
To estimate a person’s energy requirements using the Institute of Medicine EER equations, it is necessary to identify a PAL value for that person. A person’s PAL value can be affected by various activities performed throughout the day and is referred to as the change in physical activity level (Δ PAL). To determine Δ PAL, take the sum of the Δ PALs for each activity performed for 1 day from the DRI tables (Institute of Medicine, 2002; 2005). To calculate the PAL value for 1 day, take the sum of activities and add the BEE (1) plus 10% to account for the TEF (1 + 0.1 = 1.1). For example, to calculate an adult woman’s PAL value, take the sum of the Δ PAL values for activities of daily living, such as walking the dog (0.11) and vacuuming (0.14) for 1 hour each, sitting for 4 hours doing light activity (0.12), and then performing moderate to vigorous activities such as walking for 1 hour at 4 mph (0.20) and ice skating for 30 minutes (0.13) for a total of (0.7). To that value include the BEE adjusted for the 10% TEF (1.1) for the final calculation (0.7 + 1.1 = 1.8). For this woman the PAL value (1.8) falls within an active range. The PA coefficient that correlates with an active lifestyle for this woman is 1.27.
To calculate the EER for an adult woman, use the EER equation for women 19 years and older (BMI 18.5-25 kg/m2); see Box 2-1 (Institute of Medicine, 2002; 2005). The following calculation estimates the EER for a 30-year-old active woman who weighs 65 kg, is 1.77 m tall, with a PA coefficient (1.27):


A simplified way of predicting physical activity additions to REE is through the use of estimates of the level of physical activity, which are then multiplied by the measured or predicted REE. To estimate TEE for minimal activity, increase REE by 10% to 20%; for moderate activity, increase REE by 25% to 40%; for strenuous activity, increase REE by 45% to 60%. These levels are ranges used in practice and can be considered “expert opinion” rather than evidence-based at this time.
Physical Activity in Children
Energy spent during various activities and the intensity and impact of selected activities can also be determined for children and teens (see Box 2-1) (Institute of Medicine, 2002; 2005).
Calculating Food Energy
The total energy available from a food is measured with a bomb calorimeter. This device consists of a closed container in which a weighed food sample, ignited with an electric spark, is burned in an oxygenated atmosphere. The container is immersed in a known volume of water, and the rise in the temperature of the water after igniting the food is used to calculate the heat energy generated.
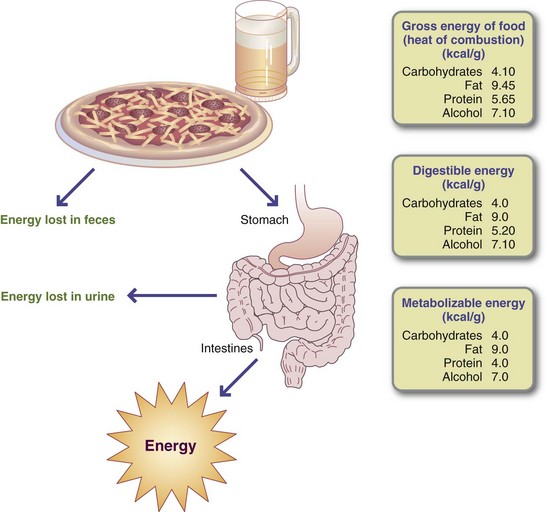
Not all of the energy in foods and alcohol is available to the body’s cells because the processes of digestion and absorption are not completely efficient. In addition, the nitrogenous portion of amino acids is not oxidized but is excreted in the form of urea. Therefore the biologically available energy from foods and alcohol is expressed in values rounded off slightly below those obtained using the calorimeter. These values for protein, fat, carbohydrate, and alcohol (Figure 2-4) are 4, 9, 4, and 7 kcal/g, respectively. Fiber is “unavailable carbohydrate” that resists digestion and absorption; its energy intake is minimal.
Although the energy value of each nutrient is known precisely, only a few foods, such as oils and sugars, are made up of a single nutrient. More commonly, foods contain a mixture of protein, fat, and carbohydrate. For example, the energy value of one medium (50-g) egg calculated in terms of weight is derived from protein (13%), fat (12%), and carbohydrate (1%) as follows:


The energy value of alcoholic beverages can be determined using the following equation (Gastineau, 1976): Alcohol kcal = Amount of beverage (oz) × Proof × 0.8 kcal/proof/1 oz. Proof is the proportion of alcohol to water or other liquids in an alcoholic beverage. The standard in the United States defines 100-proof as equal to 50% of ethyl alcohol by volume. To determine the percentage of ethyl alcohol in a beverage, divide the proof value by 2. For example, 86-proof whiskey contains 43% ethyl alcohol. The latter part of the equation—0.8 kcal/proof/1 oz—is the factor that accounts for the caloric density of alcohol (7 kcal/g) and the fact that not all of the alcohol in liquor is available for energy. For example, the number of kilocalories in 1 1/2 oz of 86-proof whiskey would be determined as follows:
1 1/2 oz × 86% proof × 0.8 kcal/proof/1 oz = 103 kcal. Energy values of foods based on chemical analyses may be obtained from the U.S. Department of Agriculture (USDA) Nutrient Data Laboratory website or from Bowes and Church’s Food Values of Portions Commonly Used (Pennington and Douglass, 2009). Many computer software programs that use the USDA nutrient database as the standard reference are also available and there are many online websites that can be used. See Appendixes 38 and 44.
American Dietetic Association—Evidence Analysis Library
American Society for Parenteral and Enteral Nutrition
National Academy Press—Publisher of Institute of Medicine DRIs for Energy
www.nal.usda.gov/fnic/foodcomp/
References
Ainsworth, BE, et al. Compendium of physical activities: classification of energy costs of human physical activities. Med Sci Sports Exerc. 1993;25:71.
Bahr, R, et al. Effect of supramaximal exercise on excess postexercise O2 consumption. Med Sci Sports Exerc. 1992;24:66.
Bonnefoy, M, et al. Simultaneous validation of ten physical activity questionnaires in older men: a doubly labeled water study. J Am Gerontological Society. 2001;49:28.
Bosy-Westphal, A, et al. Effect of organ and tissue masses on resting energy expenditure in underweight, normal weight and obese adults. Int J Obes Related Metabol Disord. 2004;28:72.
Bruder, N, et al. Influence of body temperature, with or without sedation, on energy expenditure in severe head-injured patients. Crit Care Med. 1998;26:568.
Butte, NF, et al. Energy requirements derived from total energy expenditure and energy deposition during the first 2 years of life. Am J Clin Nutr. 2000;72:1558.
Butte, NF, et al. Energy requirements during pregnancy based on total energy expenditure and energy deposition. Am J Clin Nutr. 2004;79:1078.
Byrne, NM, et al. Influence of distribution of lean body mass on resting metabolic rate after weight loss and weight regain: comparison of responses in white and black women. Am J Clin Nutr. 2003;77:1368.
Cereda, E, et al. Height prediction formula for middle-aged (30-55 y) Caucasians. Nutrition. 2010;26:1075. [[Epub ahead of print 2009.]].
Compher, C, et al. Best practice methods to apply to measurement of resting metabolic rate in adults: a systematic review. J Am Diet Assoc. 2006;106:881.
Dobratz, JR, Sibley, SD, Beckman, TR, et al. Prediction of energy expenditure in extremely obese women. J Parenter Enteral Nutr. 2007;31:217.
Elia, M, Livesey, G. Theory and validity of indirect calorimetry during net lipid synthesis. Am J Clin Nutr. 1988;47:591.
Ferraro, R, et al. Lower sedentary metabolic rate in women compared with men. J Clin Invest. 1992;90:780.
Frankenfield, DC, et al. Validation of several established equations for resting metabolic rate in obese and nonobese people. J Am Diet Assoc. 2003;103:1152.
Friedman, A, Johnson, RK. Doubly labeled water: new advances and applications for the practitioner. Nutr Today. 2002;27:243.
Gallagher, D, et al. Organ-tissue mass measurement allows modeling of REE and metabolically active tissue mass. Am J Physiol Endocrinol Metab. 1998;275:E249.
Gallagher, D, et al. Small organs with a high metabolic rate explain lower resting energy expenditure in African American than in white adults. Am J Clin Nutr. 2006;83:1062.
Gastineau, CF. Alcohol and calories. Mayo Clin Proc. 1976;51:88.
Goran, MI, et al. Energy requirements across the life span: new findings based on measurement of total energy expenditure with doubly labeled water. Nutr Res. 1995;15:115.
Gretebeck, R, et al. Comparison of the doubly labeled water method for measuring energy expenditure with Caltrac accelerometer recordings. Med Sci Sports Exerc. 1991;23:60S.
Gretebeck, R, et al. Assessment of energy expenditure in active older women using doubly labeled water and Caltrac recordings. Med Sci Sports Exerc. 1992;23:68S.
Hardy, JD, DuBois, EF. Regulation of heat loss from the human body. Proc Natl Acad Sci U S A. 1937;23:624.
Harris, JA, Benedict, FG, A biometric study of basal metabolism in man. Pub no. 279. Washington, DC: Carnegie Institute of Washington; 1919.
Horton, T, Geissler, C. Effect of habitual exercise on daily energy expenditure and metabolic rate during standardized activity. Am J Clin Nutr. 1994;59:13.
2010. Hursel, R, Westerterp-Plantenga, MS. Thermogenic ingredients and body weight regulation. Int J Obes (Lond). 2010;34:659. [[Epub ahead of print 2010.]].
Institute of Medicine of the National Academies, Food and Nutrition Board. Dietary reference intakes: for energy, carbohydrate, fiber, fat, fatty acids, cholesterol, protein, and amino acids. Washington, DC: The National Academies Press; 2002.
Institute of Medicine of the National Academies, Food and Nutrition Board. Dietary reference intakes for energy, carbohydrate, fiber, fat, fatty acids, cholesterol, protein, and amino acids. Washington DC: The National Academies Press; 2005. [107-264].
Ireton-Jones, C. Indirect calorimetry. In Skipper A, ed.: The dietitian’s handbook of enteral and parenteral nutrition, ed 3, Sudbury, Mass: Jones and Bartlett, 2010. [(in press)].
Ireton-Jones, CS, Turner, WW. The use of respiratory quotient to determine the efficacy of nutritional support regimens. J Am Diet Assoc. 1987;87:180.
Janssen, I, et al. Skeletal muscle mass and distribution in 468 men and women aged 18-88 yr. J Appl Physiol. 2000;89:81.
Javed, F, et al. Brain and high metabolic rate organ mass: contributions to resting energy expenditure beyond fat-free mass. Am J Clin Nutr. 2010;91:907. [[Epub ahead of print 2010.].].
Joffe A, et al: Nutritional support for critically ill children, Cochrane Database Syst Rev 2:CD005144, 2009 Apr 15.
Johnson, RK. What are people really eating, and why does it matter? Nutr Today. 2000;35:40.
Keys, A, et al. Basal metabolism and age of adult man. Metabolism. 1973;22:579.
Larson-Meyer, DE, et al. Ghrelin and peptide YY in postpartum lactating and nonlactating women. Am J Clin Nutr. 2010;91:366.
Levine, JA, Kotz, CM. NEAT—non-exercise activity thermogenesis—egocentric & geocentric environmental factors vs. biological regulation. Acta Physiol Scand. 2005;184:309.
McClave, SA, et al. Clinical use of the respiratory quotient obtained from indirect calorimetry. J Parenter Enteral Nutr. 2003;27:21.
McCrory, P, et al. Energy balance, food intake and obesity. In: Hills AP, Wahlqvist ML, eds. Exercise and obesity. London: Smith-Gordon, 1994.
Mifflin, MD, St. Jeor, ST, et al. A new predictive equation for resting energy expenditure in healthy individuals. Am J Clin Nutr. 1990;51:241.
Neilson, HK, et al. Estimating activity energy expenditure: how valid are physical activity questionnaires? Am J Clin Nutr. 2008;87:279.
Owen, OE, et al. A reappraisal of caloric requirements in healthy women. Am J Clin Nutr. 1986;44:1.
Owen, OE, et al. A reappraisal of the caloric requirements of men. Am J Clin Nutr. 1987;46:875.
Pennington, JA, Douglass, JS. Bowes and Church’s food values of portions commonly used, ed 19. Philadelphia: Lippincott Williams & Wilkins; 2009.
Philippaerts, RM, et al. Doubly labeled water validation of three physical activity questionnaires. Int J Sports Med. 1999;20:284.
Plasqui, G, Westerterp, KR. Physical activity assessment with accelerometers: an evaluation against doubly labeled water. Obesity. 2007;15:2371.
Poehlman, ET. Regulation of energy expenditure in aging humans. J Am Geriatr Soc. 1993;41:552.
Prentice, AM. All calories are not equal. International dialogue on carbohydrates. 1995;5:1.
Roberts, SB, Young, VR. Energy costs of fat and protein deposition in the human infant. Am J Clin Nutr. 1988;48:951.
Roubenoff, R, et al. The effect of gender and body composition method on the apparent decline in lean mass–adjusted resting metabolic rate with age. J Gerontol Series A: Biol Sci Med Sci. 2000;55:M757.
St-Onge, MP, et al. A new hand-held indirect calorimeter to measure postprandial energy expenditure. Obes Res. 2004;12:704.
Schoeller, DA. How accurate is self-reported dietary energy intake? Nutr Rev. 1990;48:373.
Sedlet, KL, Ireton-Jones, CS. Energy expenditure and the abnormal eating pattern of a bulimic: a case study. J Am Diet Assoc. 1989;89:74.
Tentolouris, N, et al. Diet induced thermogenesis and substrate oxidation are not different between lean and obese women after two different isocaloric meals, one rich in protein and one rich in fat. Metabolism. 2008;57:313.
Van Pelt, RE, et al. Age-related decline in RMR in physically active men: relation to exercise volume and energy intake. Am J Physiol Endocrinol Metab. 2001;281:E633.
Weir, JB. New methods of calculating metabolic rate with special reference to protein metabolism. J Physiol. 1949;109:1.
Wells, JC, et al. Energy requirements and body composition in stable pediatric intensive care patients receiving ventilatory support. Food Nutr Bull. 2002;23:95S.
Winters-Hart, CS, et al. Validity of a questionnaire to assess historical physical activity in older women. Med Sci Sports Exerc. 2004;36:2082.