Data Acquisition Concepts
BASIC SCHEME FOR DATA ACQUISITION
In computed tomography (CT), transmission measurements, or projection data, are systematically collected from the patient. Several schemes are available for such data collection, each based on a specific “geometrical pattern of scanning” (Villafana, 1987).
Data acquisition refers to the method by which the patient is scanned to obtain enough data for image reconstruction. Scanning is defined by the beam geometry, which characterizes the particular CT system and also plays a central role in spatial resolution and artifact production.
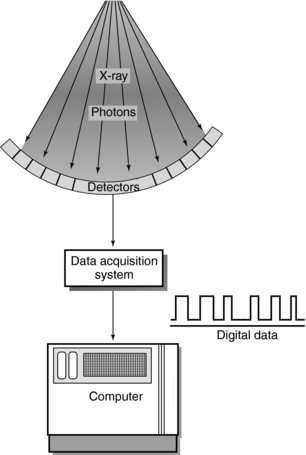
Two elements in a basic scheme for data acquisition (Fig. 5-1) are the beam geometry and the components comprising the scheme. Beam geometry refers to the size, shape, and motion of the beam and its path, and components refer to those physical devices that shape and define the beam, measure its transmission through the patient, and convert this information into digital data for input into the computer.
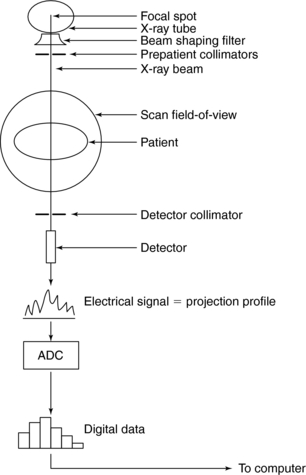
The following points should be noted from Figure 5-1:
1. The x-ray tube and detector are in perfect alignment.
2. The tube and detector scan the patient to collect a large number of transmission measurements.
3. The beam is shaped by a special filter as it leaves the tube.
4. The beam is collimated to pass through only the slice of interest.
5. The beam is attenuated by the patient and the transmitted photons are then measured by the detector.
6. The detector converts the x-ray photons into an electrical signal (analog data).
7. These signals are converted by the analog-to-digital converter (ADC) into digital data.
8. The digital data are sent to the computer for image reconstruction.
Terminology
Consider the first data acquisition scheme used by Hounsfield and others early in the development of CT (Fig. 5-2). The x-ray tube and detector move across the object or patient in a straight line, or translate, to collect several transmission measurements. After the first translation, the tube and detector rotate by 1 degree to collect more measurements. This sequence is repeated until data are collected for at least 180 degrees for one slice of the anatomy. Scanning also includes the movement of the patient through the gantry to scan the next slice. This sequence is repeated until all slices have been scanned.
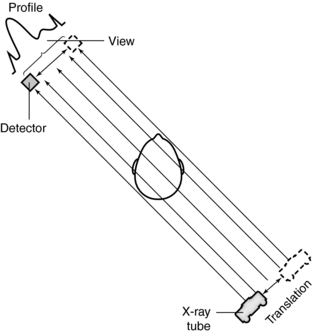
FIGURE 5-2 In CT, a ray is the part of the x-ray beam that falls onto one detector. A view is a collection of these rays for one translation across the object. The view generates what is called a profile.
The x-ray beam that emanates from the tube consists of several rays. In CT, a ray is the part of the beam that falls on one detector. In Figure 5-2, the line from the x-ray tube to the detector is considered a single ray, and a collection of these rays for one translation across the object constitutes a view.
Projection data are collected by the detector because each ray is attenuated by the patient and subsequently transmitted and projected on the detector. The detector in turn generates an electrical signal, which represents a signature of the attenuation as the ray moves across the slice. This signal represents a profile. Although a view generates a profile, a ray generates only a small part of the profile. In addition, each transmission measurement is referred to as a data sample.
The production of a CT image of one slice of the anatomy requires a large set of data samples taken at different locations to satisfy the image reconstruction process. The total number of data samples (DStotal) per scan is given by the following expression:

or

DATA ACQUISITION GEOMETRIES
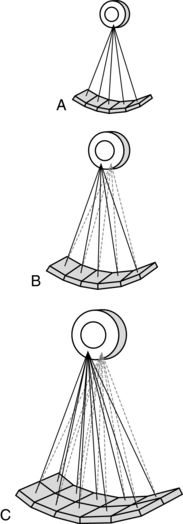
Three primary types of acquisition geometries are parallel beam geometry, fan beam geometry, and CT scanning in spiral geometry, which is the most recently developed geometry. As a result, a simple categorization of CT equipment has evolved based on the scanning geometry, scanning motion, and number of detectors, as follows (Fig. 5-3):
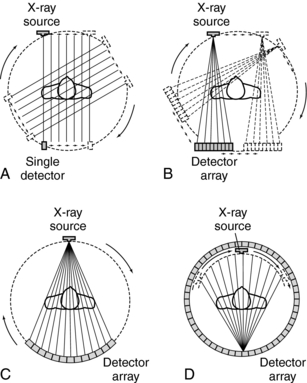
FIGURE 5-3 The geometries of the first four generations of CT scanners. A, First generation, parallel beam, translate and rotate. B, Second generation, fan beam, translate, and rotate. C, Third generation, fan beam, rotate only. D, Fourth generation, fan beam, stationary circular detector.
1. First-generation scanners were based on the parallel beam geometry and translate-rotate scanning motion.
2. Second-generation scanners were based on the fan beam geometry and translate-rotate motion.
3. Third-generation scanners were based on fan beam geometry and complete rotation of the tube and detectors.
4. Fourth-generation scanners were based on fan beam geometry and complete rotation of the x-ray tube around a stationary ring of detectors.
5. Fifth-generation scanners were developed primarily for high-speed CT scanning. These scanners are based on special configurations intended to facilitate very fast scanning.
6. Sixth-generation scanners have multiple x-ray tubes and detectors. These scanners are intended specifically to image moving structures, such as the heart, for example. One such recent scanner is the dual-source CT (DSCT) scanner (McCollough et al, 2007).
7. Seventh-generation scanners use flat-panel digital area detectors similar to the ones used in digital radiography (Flohr et al, 2005; Kalender, 2005).
First-Generation Scanners
Parallel beam geometry was first used by Hounsfield. The first EMI brain scanner and other earlier scanners were based on this concept.
Parallel beam geometry is defined by a set of parallel rays that generates a projection profile (see Fig. 5-2). The data acquisition process is based on a translate-rotate principle, in which a single, highly collimated x-ray beam and one or two detectors first translate across the patient to collect transmission readings. After one translation, the tube and detector rotate by 1 degree and translate again to collect readings from a different direction. This is repeated for 180 degrees around the patient. This method of scanning is referred to as rectilinear pencil beam scanning.
First-generation CT scanners took at least 4.5 to 5.5 minutes to produce a complete scan of the patient, which restricted patient throughput. The image reconstruction algorithm for first-generation CT scanners was based on the parallel beam geometry of the image reconstruction space (a square or circle in which the slice to be reconstructed must be positioned).
Second-Generation Scanners
Second-generation scanners were based on the translate-rotate principle of first-generation scanners with a few fundamental differences, such as a linear detector array (about 30 detectors) coupled to the x-ray tube and multiple pencil beams. The result is a beam geometry that describes a small fan whose apex originates at the x-ray tube. This is the fan beam geometry shown in Figure 5-3, B, C, and D.
Also, the rays are divergent instead of parallel, resulting in a significant change in the image reconstruction algorithm, which must be capable of handling projection data from the fan beam geometry.
In second-generation scanners, the fan beam translates across the patient to collect a set of transmission readings. After one translation, the tube and detector array rotate by larger increments (compared with first-generation scanners) and translate again. This process is repeated for 180 degrees and is referred to as rectilinear multiple pencil beam scanning. The x-ray tube traces a semicircular path during scanning.
The larger rotational increments and increased number of detectors result in shorter scan times that range from 20 seconds to 3.5 minutes. In general, the time decrease is inversely proportional to the number of detectors. The more detectors, the shorter the total scan time.
Third-Generation Scanners
Third-generation CT scanners were based on a fan beam geometry that rotates continuously around the patient for 360 degrees (see Fig. 5-3). The x-ray tube is coupled to a curved detector array that subtends an arc of 30 to 40 degrees or greater from the apex of the fan. As the x-ray tube and detectors rotate, projection profiles are collected and a view is obtained for every fixed point of the tube and detector. This motion is referred to as continuously rotating fan beam scanning. The path traced by the tube describes a circle rather than the semicircle characteristic of first- and second-generation CT scanners. Third-generation CT scanners collect data faster than the previous units (generally within a few seconds). This scan time increases patient throughput and limits the production of artifacts caused by respiratory motion.
Fourth-Generation Scanners
Essentially, fourth-generation CT scanners feature two types of beam geometries: a rotating fan beam within a stationary ring of detectors and a nutating fan beam in which the apex of the fan (x-ray tube) is located outside a nutating ring of detectors.
Rotating Fan Beam Within a Circular Detector Array: The main data acquisition features of a fourth- generation CT scanner are as follows:
1. The x-ray tube is positioned within a stationary, circular detector array (Fig. 5-4).
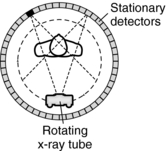
2. The beam geometry describes a wide fan.
3. The apex of the fan now originates at each detector. Figure 5-4 shows two fans that describe two sets of views.
4. As the tube moves from point to point within the circle, single rays strike a detector. These rays are produced sequentially during the point’s circular travel.
5. Scan times are very short and vary from scanner to scanner, depending on the manufacturer.
6. The x-ray tube traces a circular path.
7. The image reconstruction algorithm is for a fan beam geometry in which the apex of the fan is now at the detector, as opposed to the x-ray tube in the third-generation systems.
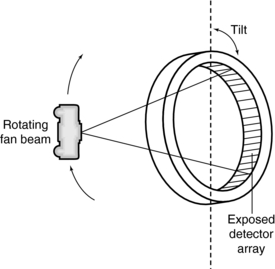
Rotating Fan Beam Outside a Nutating Detector Ring: In this scheme, the x-ray tube rotates outside the detector ring (Fig. 5-5). As it rotates, the detector ring tilts so that the fan beam strikes an array of detectors located at the far side of the x-ray tube while the detectors closest to the x-ray tube move out of the path of the x-ray beam. The term nutating describes the tilting action of the detector ring during data collection. Scanners with this type of scanning motion eliminate the poor geometry of other schemes, in which the tube rotates inside its detector ring, near the object. However, nutate-rotate systems are not currently manufactured.
Multislice CT Scanners: CT Scanning in Spiral-Helical Geometry
Scanning in spiral-helical geometry is the most recent development in CT data acquisition. The need for faster scan times and improvements in three-dimensional (3D) and multiplanar reconstruction have encouraged the development of continuous rotation scanners, or volume scanners, in which the data are collected in volumes rather than individual slices. CT scanning in spiral/helical geometry is based on slip-ring technology, which shortens the high-tension cables to the x-ray tube to allow continuous rotation of the gantry. The path traced by the x-ray tube, or fan beam, during the scanning process describes a spiral (Fig. 5-6) or a helix. The terms spiral geometry (Siemens) and helical geometry (Toshiba) are commonly and synonymously used to describe the data acquisition geometry of continuous rotation scanners. This geometry is obtained during the scanning process. As the tube rotates, the patient is transported through the gantry aperture for a single breath hold. Because this results in a volume of the patient being scanned, the term volume CT is also used.
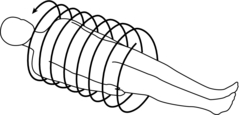
FIGURE 5-6 The path traced by the x-ray tube in CT scanning describes a spiral or helix. These terms are used interchangeably.
Spiral/Helical Geometry Scanners: These systems have evolved through the years from two to eight slices per revolution of the x-ray tube and detectors (360-degree rotation) to 16, 32, 40, 64, and 320 slices per 360-degree rotation. As of 2007, a prototype scanner featuring 256 slices per 360-degree rotation is being developed by Toshiba Medical Systems (Japan) for imaging moving structures such as the heart and lungs. One striking feature of this scanner compared with other multislice scanners is that it covers the entire heart in a single rotation (Fig. 5-7).
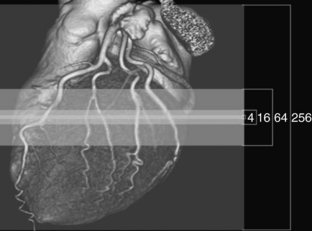
FIGURE 5-7 The 256 prototype CT scanner featuring 256 slices per 360-degree rotation was developed by Toshiba Medical Systems (Japan) for imaging moving structures such as the heart and lungs. One striking feature of this scanner compared with other multislice scanners is that it covers the entire heart in a single rotation. Courtesy Toshiba America Medical Systems.
An interesting point with respect to scanners capable of imaging 16 or greater slices per 360-degree rotation is that the beam becomes a cone. These systems are therefore based on cone-beam geometries (as opposed to fan-beam geometries) because the detectors are two-dimensional detectors. This means that cone-beam algorithms (as opposed to fan-beam algorithms) are used to reconstruct images. Multislice CT (MSCT) scanner principles and concepts are described in detail in the chapter on MSCT.
Fifth-Generation Scanners
Fifth-generation scanners are classified as high-speed CT scanners because they can acquire scan data in milliseconds. Two such scanners are the electron beam CT scanner (EBCT) (Fig. 5-8) and the dynamic spatial reconstructor (DSR) scanner. In the EBCT scanner, the data acquisition geometry is a fan beam of x rays produced by a beam of electrons that scans several stationary tungsten target rings. The fan beam passes through the patient and the x-ray transmission readings are collected for image reconstruction. The DSR scanner was labeled a high-speed CT scanner capable of producing dynamic 3D images of volumes of the patient. The DSR is now obsolete and is not described further in this book.
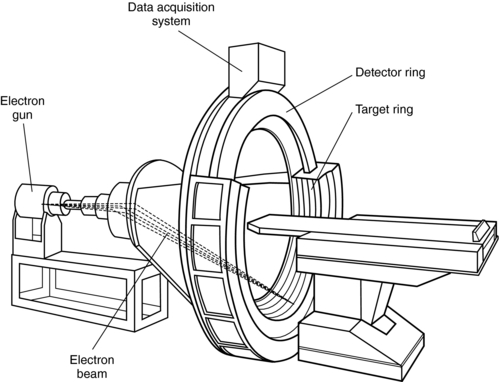
FIGURE 5-8 The essential components of an EBCT scanner. The data acquisition geometry is a fan beam of x rays produced by the electron beam striking the tungsten targets.
The principles and operation of the EBCT scanner were first described by Boyd et al (1979) as a result of research done at the University of California at San Francisco during the late 1970s. In 1983, Imatron developed Boyd’s high-speed CT scanner for imaging the heart and circulation (Boyd and Lipton, 1983). At that time, the machine was referred to by such names as the cardiovascular computed tomography scanner and the cine CT scanner. Today, the machine is known as the EBCT scanner (McCollough, 1995). It is expected that more of these machines will be distributed worldwide in the near future. (Siemens Medical Systems will distribute the EBCT scanner under the name “Evolution.”)
The overall goal of the EBCT scanner is to produce high-resolution images of moving organs (e.g., the heart) that are free of artifacts caused by motion. In this respect, the scanner can be used for imaging the heart and other body parts in both adults and children. The scanner performs this task well because its design enables it to acquire CT data 10 times faster than conventional CT scanners.
The design configuration of the EBCT scanner (see Fig. 5-8) is different from that of conventional CT systems in the following respects:
1. The EBCT scanner is based on electron beam technology and no x-ray tube is used.
2. There is no mechanical motion of the components.
3. The acquisition geometry of the EBCT scanner is fundamentally different compared with those of conventional systems.
The basic configuration of an EBCT scanner is shown in Figure 5-8. At one end of the scanner is an electron gun that generates a 130-kilovolt (kV) electron beam. This beam is accelerated, focused, and deflected at a prescribed angle by electromagnetic coils to strike one of the four adjacent tungsten target rings. These stationary rings span an arc of 210 degrees. The electron beam is steered along the rings, which can be used individually or in any sequence. As a result, heat dissipation does not pose a problem as it does in conventional CT systems.
When the electron beam collides with the tungsten target, x rays are produced. Collimators shape the x-rays into a fan beam that passes through the patient, who is positioned in a 47-cm scan field, to strike a curved, stationary array of detectors positioned opposite the target rings.
The detector array consists of two separate rings holding a 216-degree arc of detectors. The first ring holds 864 detectors, each half the size of those in the second ring, which holds 432 detectors (McCollough, 1995). This arrangement allows for the acquisition of either two image slices when one target ring is used or eight image slices when all four target rings are used in sequence.
Each solid-state detector consists of a luminescent crystal and cadmium tungstate (which converts x rays to light) coupled optically with silicon photodiodes (which convert light into current) connected to a preamplifier. The output from the detectors is sent to the data acquisition system (DAS) (see Fig. 5-8).
The DAS consists of analog-to-digital converters, or digitizers, that sample and digitize the output signals from the detectors. In addition, the digitized data are stored in bulk in random access memory (RAM), which can hold data for hundreds of scans in the multislice and single-slice modes. This information is subsequently sent to the computer for processing.
The computer for the EBCT scanner is capable of very fast reconstruction speeds, and image reconstruction is based on the filtered back-projection algorithm used in conventional CT systems.
The EBCT scanner does not have any moving physical parts and, as noted by Flohr et al. (2005), “the EBCT principle is currently not considered adequate for state-of-the-art cardiac imaging or for general radiology applications.”
Sixth-Generation Scanners: The Dual Source CT Scanner
The overall goal of the MSCT scanners mentioned previously is to improve the volume coverage speed while providing improved spatial and temporal resolution compared with the older four slices per 360-degree rotation scanner. Although the current 64-slice volume scanners produce better spatial resolution in the order of 0.4 mm isotropic voxels (Flohr et al, 2006; McCollough et al, 2007) and temporal resolution compared with the 16-slice volume CT scanner, they fail to deal effectively with artifacts created in CT angiography (CTA) and the problem of the mechanical forces that need to be addressed in attempting to decrease the rotation time of the x-ray tube and detectors (Flohr et al, 2006). To solve these problems, for example, a new-generation scanner has been introduced. This is the DSCT scanner.
This scanner consists of two x-ray tubes and two sets of detectors that are offset by 90 degrees (Fig. 5-9). The DSCT scanner is designed for cardiac CT imaging because it provides the temporal resolution needed to image moving structures such as the heart. The DSCT scanner will be described further in Chapter 13.
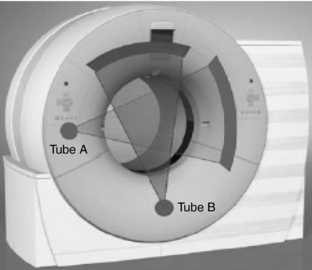
FIGURE 5-9 The DSCT scanner. This scanner consists of two x-ray tubes and two sets of detectors that are offset by 90 degrees and it is particularly designed for cardiac CT imaging. From Flohr TG et al: First performance evaluation of a dual-source CT [DSCT] system. Eur Radiol 16: 256-268, 2006. With kind permission of Springer Science and Business Media.
Seventh-Generation Scanners: Flat-Panel CT Scanners
Flat-panel digital detectors similar to the ones used in digital radiography are now being considered for use in CT; however, these scanners are still in the prototype development and are not available for use in clinical imaging. Perhaps they may be labeled seventh-generation CT scanners on the basis of the simple categorization mentioned above.
A flat-panel CT scanner prototype is shown in Figure 5-10. The x-ray tube and detectors are coupled and positioned in the CT gantry. The detector consists of a cesium iodide (CsI) scintillator coupled to an amorphous silicon thin-film transistor (TFT) array. These flat-panel detectors produce excellent spatial resolution but lack good contrast resolution; therefore, they are also being used in angiography to image blood vessels, for example, where the image sharpness is of primary importance. As noted by Flohr et al. (2005), “the combination of area detectors that provide sufficient image quality with fast gantry rotation speed will be a promising technical concept for medical CT systems. The vast spectrum of potential applications may bring about another quantum leap in the evolution of medical CT imaging.”
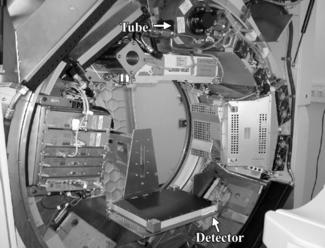
FIGURE 5-10 A flat-panel CT scanner prototype. The x-ray tube and detectors are coupled and positioned in the CT gantry. The detector consists of a CsI scintillator coupled to an amorphous silicon TFT array. From Flohr TG et al: Multi-detector row CT systems and image reconstruction techniques, Radiology 235:756-773, 2005. Reproduced by permission.
In addition, flat-panel detectors are also being investigated for use in CT of the breast, and currently several dedicated breast CT prototypes are being developed (Glick et al, 2007; Kwan et al, 2007). Breast CT is described further in Chapter 13.
SLIP-RING TECHNOLOGY
Spiral-helical CT is made possible through the use of slip-ring technology, which allows for continuous gantry rotation. Slip rings (Fig. 5-11) are “electromechanical devices consisting of circular electrical conductive rings and brushes that transmit electrical energy across a rotating interface” (Brunnett et al, 1990). Today, CT scanners incorporate slip-ring design and are referred to as continuous rotation, volume CT, or slip-ring scanners. Slip-ring technology is not a new idea, for it has been applied previously in CT. For example, the Varian V-360-3 CT scanner (an old model CT scanner) was based on slip-ring design to achieve continuous rotation of the gantry. Such rotation results in very fast data collection, which is mandatory for certain clinical procedures such as dynamic CT scanning and CTA, for example.
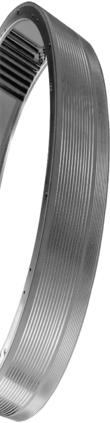
FIGURE 5-11 Conductive rings (upper strips) of one slip-ring system. Each strip carries voltage to components such as the generator, x-ray tube, and collimators. Courtesy Elscint, Hackensack, NJ.
In addition, slip rings not only provide the electrical power to operate the x-ray tube but also transfer the signals from the detectors for input into the image reconstruction computer.
Design and Power Supply
Two slip-ring designs are the disk (Fig. 5-12) and cylinder. In the disk design, the conductive rings form concentric circles in the plane of rotation. The cylindrical design includes conductive rings positioned along the axis of rotation to form a cylinder (Fig. 5-13). The brushes that transmit electrical power to the CT components glide in contact grooves on the stationary slip ring (Fig. 5-13).
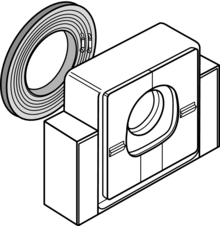
FIGURE 5-12 Slip ring based on the disk design concept. The rings are positioned as concentric circles within the plane of rotation. This is a characteristic design of the Siemens Somatom Plus CT scanner.
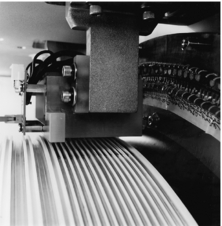
FIGURE 5-13 Slip ring based on the cylindrical design characteristic of the Picker PQ-2000 CT scanner. The brushes glide in contact grooves on the stationary slip ring. Courtesy Picker International, Cleveland, Ohio.
Two common brush designs are the wire brush and the composite brush. The wire brush uses conductive wire as a sliding contact. “A brush consists of one or more wires arranged such that they function as a cantilever spring with a free end against the conductive ring. Two brushes per ring are often used to increase either communication reliability or current carrying capacity” (Brunnett et al, 1990). The composite brush uses a block of some conductive material (e.g., a silver-graphite alloy) as a sliding contact. A variety of different spring designs are commonly used to maintain contact between the brush and ring including cantilever, compression, or constant force.
Slip-ring scanners provide continuous rotation of the gantry through the elimination of the long high-tension cables to the x-ray tube used in conventional start-stop scanners, which must be unwound after a complete rotation. In conventional scanners, these cables originate from the high-voltage generator, usually located in the x-ray room. The high-voltage generators of slip-ring scanners are located in the gantry. Scanners with either low-voltage or high-voltage slip rings, based on the power supply to the slip ring, are available (Fig. 5-14).
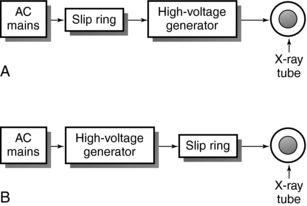
FIGURE 5-14 Basic differences between low-voltage (A) and high-voltage (B) slip-ring CT scanners in terms of high-voltage power to the x-ray tube.
Low-Voltage Slip Ring: In a low-voltage slip-ring system, 480 alternating (AC) power and x-ray control signals are transmitted to slip rings by means of low-voltage brushes that glide in contact grooves on the stationary slip ring. The slip ring then provides power to the high-voltage transformer, which subsequently transmits high voltage to the x-ray tube (see Fig. 5-14, A). In this case, the x-ray generator, x-ray tube, and other controls are positioned on the orbital scan frame.
High-Voltage Slip Ring: In a high-voltage slip-ring system (see Fig. 5-14, B), the AC delivers power to the high-voltage generator, which subsequently supplies high voltage to the slip ring. The high voltage from the slip ring is transferred to the x-ray tube. In this case, the high-voltage generator does not rotate with the x-ray tube.
Advantages
The major advantage of slip-ring technology is that it facilitates continuous rotation of the x-ray tube so that volume data can be acquired quickly from the patient. As the tube rotates continuously, the patient is translated continuously through the gantry aperture. This results in CT scanning in spiral geometry. Other advantages are as follows:
1. Faster scan times and minimal interscan delays
2. Capacity for continuous acquisition protocols
3. Elimination of the start-stop process characteristic of conventional CT scanners
X-RAY SYSTEM
In his initial experiments, Hounsfield used low-energy, monochromatic gamma ray radiation. He later conducted experiments with an x-ray tube because of several limitations imposed by the monochromatic radiation source, such as the low radiation intensity rate, large source size, low source strength, and high cost. Subsequently, CT scanners were manufactured to function with x-ray tubes to provide the high radiation intensities necessary for clinical high-contrast CT scanning. However, the heterogeneous beam was problematic because it did not obey the Lambert-Beer exponential law (see Equation 4-1).
The components of the x-ray system include the x-ray generator, x-ray tube, x-ray beam filter, and collimators (see Fig. 5-1).
X-Ray Generator
CT scanners use three-phase power for the efficient production of x rays. In the past, generators for CT scanners were based on the 60-Hertz (Hz) voltage frequency, so the high-voltage generator was a bulky piece of equipment located in a corner of the x-ray room. A long high-tension cable ran from the generator to the x-ray tube in the gantry.
CT scanners now use high-frequency generators, which are small, compact, and more efficient than conventional generators. These generators are located inside the CT gantry. In some scanners, the high-frequency generator is mounted on the rotating frame with the x-ray tube; in others it is located in a corner of the gantry and does not rotate with the tube.
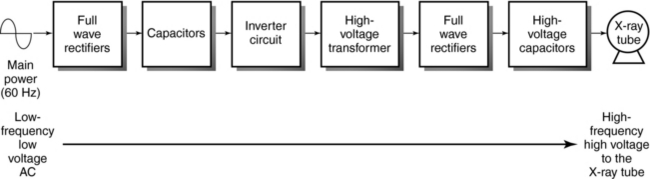
In a high-frequency generator (Fig. 5-15), the circuit is usually referred to as a high-frequency inverter circuit. The low-voltage, low-frequency current (60 Hz) from the main power supply is converted to high-voltage, high-frequency current (500 to 25,000 Hz) as it passes through the components, as shown in Figure 5-15. Each component changes the low-voltage, low-frequency AC waveform to supply the x-ray tube with high-voltage, high-frequency direct current (DC) of almost constant potential. After high-voltage rectification and smoothing, the voltage ripple from a high-frequency generator is less than 1%, compared with 4% from a three-phase, 12-pulse generator. This makes the high-frequency generator more efficient at x-ray production than its predecessor. The x-ray exposure technique obtained from these generators depends on the generator power output. The power ratings of CT generators vary and depend on the CT vendor; however, typical ratings can range from 20 to 100 kilowatts (kW) (Kalender, 2005). An output capacity of, say, 60 kW will provide a range of kilovolt and milliampere settings, where 80,120 to 140 kV and 20 to 500 milliamperes (mA) with 1-mA increments are typical.
X-Ray Tubes
The radiation source requirement in CT depends on two factors: (1) radiation attenuation, which is a function of radiation beam energy, the atomic number and density of the absorber, and the thickness of the object, and (2) the quantity of radiation required for transmission. X-ray tubes satisfy this requirement.
First- and second-generation scanners used fixed-anode, oil-cooled x-ray tubes, but rotating anode x-ray tubes have become common in CT because of the demand for increased output (Fig. 5-16). These rotating anode tubes produce a heterogeneous beam of radiation from a large-diameter anode disk with focal spot sizes to facilitate the spatial resolution requirements of the scanner. The disk is usually made of a rhenium, tungsten, and molybdenum (RTM) alloy and other materials with a small target angle (usually 12 degrees) and a rotation speed of 3600 revolutions per minute (rpm) to 10,000 rpm (high-speed rotation).
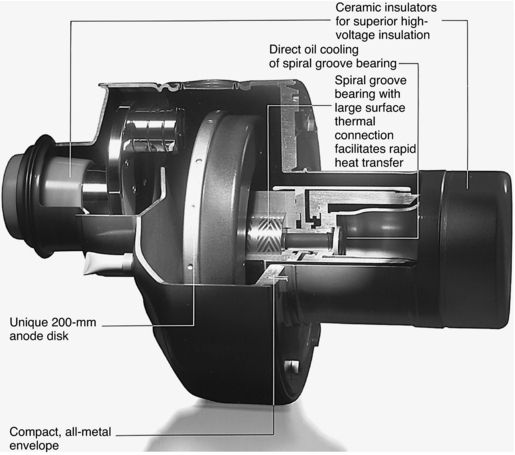
FIGURE 5-16 A modern rotating anode x-ray tube used in CT scanners. Courtesy Philips Medical Systems, Shelton, Conn.
The introduction of spiral/helical CT with continuous rotation scanners has placed new demands on x-ray tubes. Because the tube rotates continually for a longer period compared with conventional scanners, the tube must be able to sustain higher power levels. Several technical advances in component design have been made to achieve these power levels and deal with the problems of heat generation, heat storage, and heat dissipation. For example, the tube envelope, cathode assembly, anode assembly including anode rotation, and target design have been redesigned (Fox, 1995; Homberg and Koppel, 1997).
The glass envelope ensures a vacuum, provides structural support of anode and cathode structures, and provides high-voltage insulation between the anode and cathode. Internal getters (ion pumps) remove air molecules to ensure a vacuum. Although the borosilicate glass provides good thermal and electrical insulation, electrical arcing results from tungsten deposits on the glass caused by vaporization. Tubes with metal envelopes, which are now common, solve this problem. Ceramic insulators (see Fig. 5-16) isolate the metal envelope from the anode and cathode voltage. Metal envelope tubes have larger anode disks; for example, the tube shown in Figure 5-16 has a disk with a 200-mm diameter compared with the 120- to 160-mm diameter typical of conventional tubes. This feature allows the technologist to use higher tube currents. Heat storage capacity is also increased with an improvement in heat dissipation rates.
The cathode assembly consists of one or more tungsten filaments positioned in a focussing cup. The getter is usually made of barium to ensure a vacuum by the absorption of air molecules released from the target during operation.
The anode assembly consists of the disk, rotor stud and hub, rotor, and bearing assembly. The large anode disk is thicker than conventional disks; the three basic designs are the conventional all-metal disk (Fig. 5-17), the brazed graphite disk, and the chemical vapor deposition (CVD) graphite disk. In conventional tubes, the all-metal disk (see Fig. 5-17, A) consists of a base body made of titanium, zirconium, and molybdenum with a focal track layer of 10% rhenium and 90% tungsten. It can transfer heat from the focal track very quickly. Unfortunately, tubes with this all-metal design cannot meet the needs of spiral/helical CT imaging because of their weight.
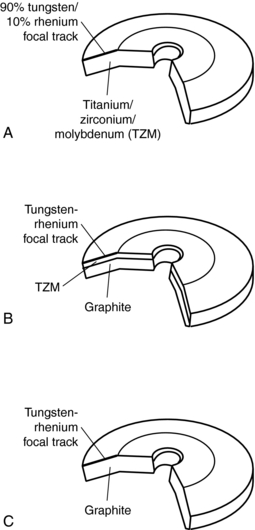
FIGURE 5-17 Three types of disk designs for modern x-ray tubes used in CT scanners: A, conventional all-metal disk; B, brazed graphite anode disk; and C, CVD graphite anode disk.
The brazed graphite anode disk (see Fig. 5-17, B) consists of a tungsten-rhenium focal track brazed to a graphite base body. Graphite increases the heat storage capacity because of its high thermal capacity, which is about 10 times that of tungsten. As noted by Fox (1995), the material used in the brazing process influences the operating temperature of the tube, and the higher temperatures result in higher heat storage capacities and faster cooling of the anode. Tubes for spiral/helical CT scanning are based mostly on this type of design.
The final type of anode design (see Fig. 5-17, C) is also intended for use in spiral/helical CT x-ray tubes. The disk consists of a graphite base body with a tungsten-rhenium layer deposited on the focal track by a chemical vapor process. This design can accommodate large, lightweight disks with large heat storage capacity and fast cooling rates (Fox, 1995).
The purpose of the bearing assembly is to provide and ensure smooth rotation of the anode disk. In CT, high-speed anode rotation allows the use of higher loadability. Rotation speeds of 10,000 rpm are possible with increased frequency to the stator windings. Smooth rotation of the disk is possible because of the ball bearings lubricated with silver; however, because ball-bearing technology results in mechanical problems and limits x-ray tube performance, a liquid-bearing method to improve anode disk rotation was introduced (Fig. 5-18).
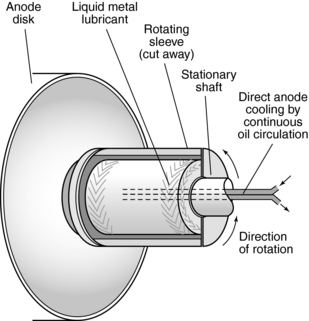
FIGURE 5-18 The anode assembly of a modern x-ray tube used in CT imaging. The main parts of the assembly are the disk, rotor, and bearing assembly that contains liquid metal lubricant.
The stationary shaft of the anode assembly consists of grooves that contain gallium-based liquid metal alloy. During anode rotation, the liquid is forced into the grooves and results in a hydroplaning effect between the anode sleeve and liquid (Homberg and Koppel, 1997). The purpose of this bearing technology is to conduct heat away from the x-ray tube more efficiently than conventional ball bearings with improved tube cooling. Additionally, the liquid bearing technology is free of vibrations and noise.
As noted by Fox (1995), the rotor hub and rotor stud also prevent the transmission of heat from the disk to the bearings. The rotor is a copper cylinder “brazed to an inner steel cylinder with a ceramic coating around the outside to enhance heat radiation” (Fox, 1995).
The working life of the tubes can range from about 10,000 to 40,000 hours, compared with 1000 hours, which is typical of conventional tubes with conventional bearing technology.
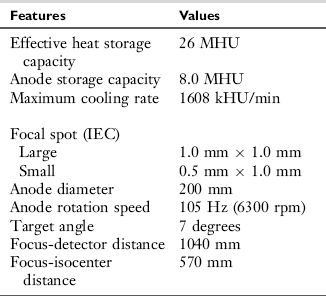
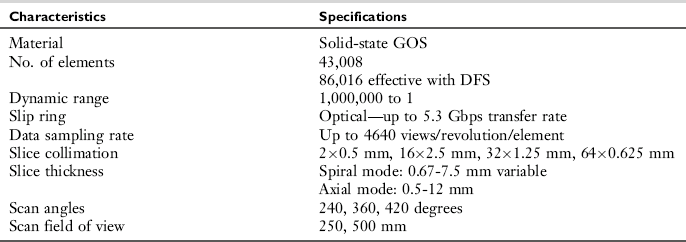
An example of the specifications for one type of x-ray tube is listed in Table 5-1.
Straton X-Ray Tube: A New X-Ray Tube for MSCT Scanning: As noted above, the fundamental problem with conventional x-ray tubes is that of heat dissipation and slow cooling rates. Efforts have been made to deal with these problems by introducing various designs, such as, for example, large anode disks and the introduction of the compound anode design (RTM disk), which has higher heat storage capacities and cooling rates. Additionally, as gantry rotation times increase, higher milliampere values are needed to provide the same milliamperes per rotation. As the electrical load (milliamperes and kilovolts) increases, faster anode cooling rates are needed. Despite these efforts, the problem of heat transfer and slow cooling rates still persist with MSCT scanners, especially for multiple longer scan times and cardiac CT imaging.
To overcome these problems, a new type of x-ray tube has been introduced for use with MSCT scanners. This unique and revolutionary tube was designed by Siemens Medical Solutions (Siemens AG Medical Solutions, Erlangen, Germany). Because this tube represents a new technology for dealing with the problem of x-ray tube heat in multislice CT scanning and leads to an innovative method of improving image quality in CT, it is described here.
A photograph of the tube is shown in Figure 5-19. As can be seen, it is encased in a protective housing that contains oil for cooling. The tube is compact in design and is much smaller than conventional x-ray tubes described earlier. This size ensures a fast gantry rotation of 0.37 seconds (Kalender, 2005).
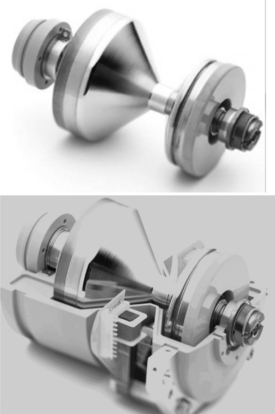
FIGURE 5-19 The Straton x-ray tube, a new x-ray tube for MSCT scanning. See text for further description. Courtesy of Siemens Medical Solutions, Germany.
The Straton x-ray tube, illustrated in Figure 5-20, has anode and cathode structures, deflection coils, an electron beam, and a motor. The electron beam produced by the filament housed in the cathode assembly is deflected to strike the anode (120-mm diameter) to produce x rays used for imaging. The motor provides the rotation of the entire tube, which is immersed in oil. It is important to note that the anode is in direct contact with the oil, which is forced out of the housing for cooling and subsequently circulates back into the housing. The fact that the anode is in direct contact with the circulating oil results in very high cooling rates of 5.0 MHU/min that results in about 0 MHU anode heat storage capacity. The advantage of this is that high-speed volume scanning is possible with high milliamperes and long exposure times for increasing length of anatomical coverage. A comparison of the design structures of both conventional and the Straton x-ray tubes is illustrated in Figure 5-21.
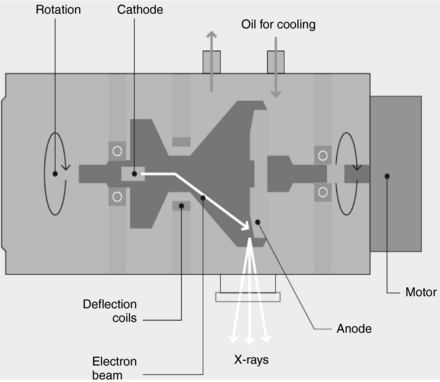
FIGURE 5-20 The Straton x-ray tube. This diagram shows the anode and cathode structures, deflection coils, an electron beam, and a motor. See text for further explanation. Courtesy of Siemens Medical Solutions, Germany.
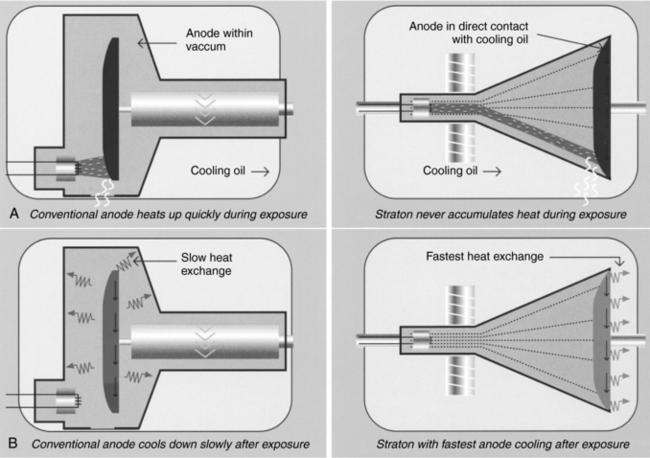
FIGURE 5-21 A comparison of the design structures of both conventional and the Straton x-ray tubes. Courtesy of Siemens Medical Solutions, Germany.
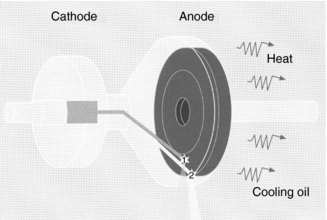
Another important feature of the Straton x-ray tube relates to the electron beam from the cathode. This beam is deflected to strike the anode at two precisely located focal spots (Fig. 5-22) that vary in sizes. Kalender (2005) reports that the sizes can be 0.6 mm × 0.17 mm, 0.8 mm × 1.1 mm, and 0.7 mm × 0.7 mm. The electron beam alternates at about 4640 times per second to create two separate x-ray beams that pass through the patient and fall on the detectors. This is described later in the chapter.
Filtration
Radiation from x-ray tubes consists of long and short wavelengths. The original experiments in the development of a practical CT scanner used monochromatic radiation to satisfy the Lambert-Beer exponential attenuation law. However, in clinical CT, the beam is polychromatic. Because it is essential that the polychromatic beam have the appearance of a monochromatic beam to satisfy the requirements of the reconstruction process, a special filter must be used.
In CT, filtration serves a dual purpose, as follows:
1. Filtration removes long-wavelength x-rays because they do not play a role in CT image formation but instead contribute to patient dose. As a result of filtration, the mean energy of the beam increases and the beam becomes “harder,” which may cause beam-hardening artifacts.
Recall that the total filtration is equal to the sum of the inherent filtration and the added filtration. In CT the inherent filtration has a thickness of about 3 mm Al-equivalent. The added filtration, on the other hand, consists of filters that are flat or shaped filters made of copper sheets, for example, the thickness of which can range from 0.1 to 0.4 mm (Kalender, 2005)
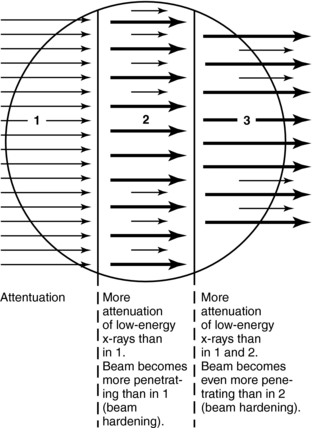
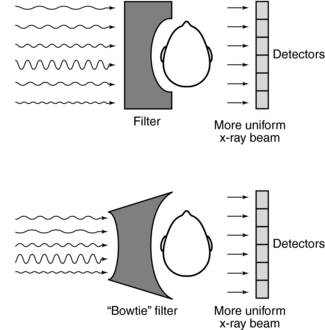
2. Filtration shapes the energy distribution across the radiation beam to produce uniform beam hardening when x-rays pass through the filter and the object.
In Figure 5-23, the attenuation differs in sections 1, 2, and 3 and the penetration increases in sections 2 and 3. This results from the absorption of the soft radiation in sections 1 and 2 that is referred to as hardening of the beam. Because the detector system does not respond to beam-hardening effects for the circular object shown, “the problem can be solved by introducing additional filtration into the beam” (Seeram, 2001). In the original EMI scanner, this problem was solved with a water bath around the patient’s head. Today, specially shaped filters conform to the shape of the object (Fig. 5-24). These filters are called shaped filters such as the “bowtie” filter and are usually made of Teflon, for example, a material that has low atomic number and high density, so as not to have a significant impact on beam hardening. The filters are positioned between the x-ray tube and patient, and they shape the beam to produce more uniformity at the detectors.
Collimation
The purpose of collimation in conventional radiography and fluoroscopy is to protect the patient by restricting the beam to the anatomy of interest only. In CT, collimation is equally important because it affects patient dose and image quality (Fig. 5-25). The basic collimation scheme in CT is shown in Figure 5-25, A, with adjustable prepatient and postpatient collimators and predetector collimators. These detectors must be perfectly aligned to optimize the imaging process. This alignment is accomplished with the fixed collimators, not shown in Fig 5-25, A.
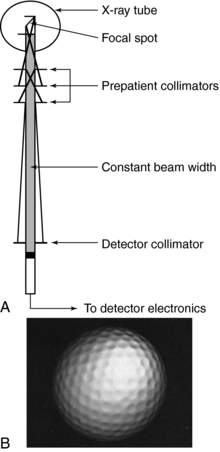
FIGURE 5-25 A, Collimation scheme typical of CT scanning. B, The removal of scattered radiation by the two sets of collimators improves the resolution of the golf ball dimples. Courtesy Shimadzu Medical Systems, Seattle, Wash.
Prepatient collimation design is influenced by the size of the focal spot of the x-ray tube because of the penumbra effect associated with focal spots. The larger the focal spot, the greater the penumbra and the more complicated the design of the collimators.
In general, a set of collimator sections is carefully arranged to shape the beam, which is proximal to the focal spot. Both proximal and distal (predetector) collimators are arranged to ensure a constant beam width at the detector. Detector collimators also shape the beam and remove scattered radiation. Such removal improves axial resolution as illustrated in Figure 5-25, B, in which the golf ball dimples are apparent. The collimator section at the distal end of the collimator assembly also helps define the thickness of the slice to be imaged. Various slice thicknesses are available depending on the type of scanner.
Some scanners incorporate an antiscatter grid to remove radiation scattered from the patient. This grid is placed just in front of the detectors and it is intended to improve image quality.
CT DETECTOR TECHNOLOGY
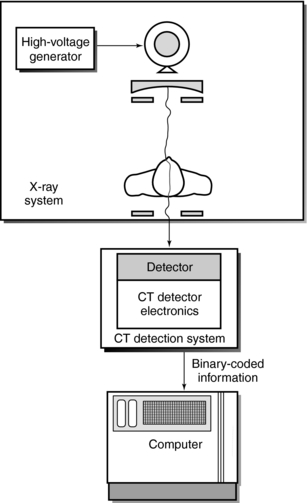
The position of the CT detection system is shown in Figure 5-26. CT detectors capture the radiation beam from the patient and convert it into electrical signals, which are subsequently converted into binary coded information.
Detector Characteristics
Detectors exhibit several characteristics essential for CT image production; however, only the following are highlighted in this book: efficiency, response time, dynamic range, high reproducibility, stability, and afterglow.
Efficiency refers to the ability to capture, absorb, and convert x-ray photons to electrical signals. CT detectors must possess high capture efficiency, absorption efficiency, and conversion efficiency. Capture efficiency refers to the efficiency with which the detectors can obtain photons transmitted from the patient; the size of the detector area facing the beam and distance between two detectors determine capture efficiency. Absorption efficiency refers to the number of photons absorbed by the detector and depends on the atomic number, physical density, size, and thickness of the detector face (Seeram, 2001; Villafana, 1987).
Stability refers to the steadiness of the detector response. If the system is not stable, frequent calibrations are required to render the signals useful.
The response time of the detector refers to the speed with which the detector can detect an x-ray event and recover to detect another event. Response times should be very short (i.e., microseconds) to avoid problems such as afterglow and detector “pile-up.”
The dynamic range of a CT detector is the “ratio of the largest signal to be measured to the precision of the smallest signal to be discriminated (i.e., if the largest signal is 1 μA and the smallest signal is 1 nA, the dynamic range is 1 million to 1)” (Parker and Stanley, 1981). The dynamic range for most CT scanners is about 1 million to 1. The total detector efficiency, or dose efficiency, is the product of the capture efficiency, absorption efficiency, and conversion efficiency (Seeram, 2001; Villafana, 1987).
Afterglow refers to the persistence of the image even after the radiation has been turned off. CT detectors should have low afterglow values, such as < 0.01%, 100 milliseconds after the radiation has been terminated (Kalender, 2005).
Types
The conversion of x-rays to electrical energy in a detector is based on two fundamental principles (Fig. 5-27). Scintillation detectors convert x-ray energy into light, and then the light is converted into electrical energy (Fig. 5-27, A). Gas ionization detectors convert x-ray energy directly to electrical energy (Fig. 5-27, B).
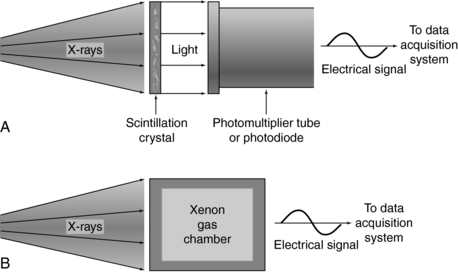
FIGURE 5-27 Two methods to convert x-ray photons into electrical energy. A, Scintillation crystal detection and conversion scheme. B, Conversion of x rays into electrical energy through gas ionization.
Scintillation Detectors: Scintillation detectors are solid-state detectors that consist of a scintillation crystal coupled to a photodiode tube. When x rays fall onto the crystal, flashes of light, or scintillations, are produced. The light is then directed to the photomultiplier, or PM tube. As illustrated in Figure 5-28, the light from the crystal strikes the photocathode of the PM tube, which then releases electrons. These electrons cascade through a series of dynodes that are carefully arranged and maintained at different potentials to result in a small output signal.
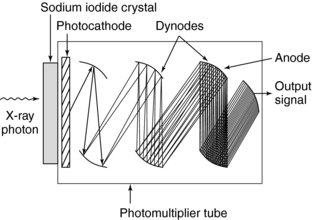
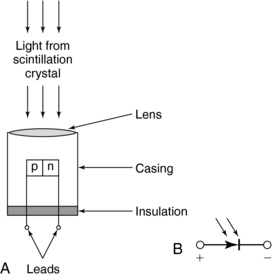
In the past, early scanners used sodium iodide crystals coupled to PM tubes. Because of afterglow problems and the limited dynamic range of sodium iodide, other crystals such as calcium fluoride and bismuth germanate were used in later scanners. Today, solid-state photodiode multiplier scintillation crystal detectors are used (Fig. 5-29). The photodiode is a semiconductor (silicon) whose p-n junction allows current flow when exposed to light. A lens is an essential part of the photodiode and is used to focus light from the scintillation crystal to the p-n junction, or semiconductor junction. When light falls on the junction, electron hole pairs are generated and the electrons move to the n side of the junction while the holes move to the p side. The amount of current is proportional to the amount of light. Photodiodes are normally used with amplifiers because of the low output from the diode. In addition, the response time of a photodiode is extremely fast (about 0.5 to 250 nanoseconds, depending on its design).
Scintillation materials currently used with photodiodes are cadmium tungstate and a ceramic material made of high-purity, rare earth oxides based on doped rare earth compounds such as yttria and gadolinium oxysulfide ultrafast ceramic (Kalender, 2005). Usually these crystals are optically bonded to the photodiodes. The advantages and disadvantages of these two scintillation materials can be discussed in terms of the detector characteristics described earlier. The conversion efficiency and photon capture efficiency of cadmium tungstate are 99% and 99%, respectively, and the dynamic range is 1 million to 1. On the other hand, the absorption efficiency of the ceramic rare earth oxide is 99%, whereas its scintillation efficiency is three times that of cadmium tungstate.
Gas Ionization Detectors: Gas ionization detectors, which are based on the principle of ionization, were introduced in third-generation scanners. The basic configuration of a gas ionization detector consists of a series of individual gas chambers, usually separated by tungsten plates carefully positioned to act as electron collection plates (Fig. 5-30). When x rays fall on the individual chambers, ionization of the gas (usually xenon) results and produces positive and negative ions. The positive ions migrate to the negatively charged plate, whereas the negative ions are attracted to the positively charged plate. This migration of ions causes a small signal current that varies directly with the number of photons absorbed.
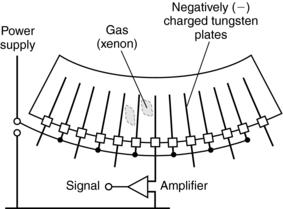
FIGURE 5-30 The basic configuration of a gas ionization detector consists of a series of individual gas chambers separated by tungsten plates.
The gas chambers are enclosed by a relatively thick ceramic substrate material because the xenon gas is pressurized to about 30 atmospheres to increase the number of gas molecules available for ionization. Xenon detectors have excellent stability and fast response times and exhibit no afterglow problems. However, their quantum detection efficiency (QDE) is less than that of solid-state detectors. As reported in the past, the QDE is 95% to 100% for crystal solid-state scintillation detectors and 94% to 98% for ceramic solid-state detectors, it is only 50% to 60% for xenon gas detectors (Arenson, 1995). It is important to note that with the introduction of MSCT scanners with their characteristic multirow detector arrays, gas-ionization detectors and fourth-generation CT systems are not used anymore. MSCT scanners are all based on the third-generation beam geometry (rotate-rotate principle) and use solid-state detector arrays (Kalender, 2005).
Multirow/Multislice Detectors
One major problem with single-slice, single-row detectors is related to the length of time needed to acquire data. The dual-slice, dual-row detector system was introduced to increase the volume coverage speed and thus decrease the time for data collection. CT scanners now use multirow detectors to image multislices during a 360-degree rotation. It is important to realize that other terms such as multidetector and multichannel have been used to describe the detectors for MSCT scanners (Douglas-Akinwande et al, 2006).
Dual-Row/Dual-Slice Detectors: In 1992, Elscint introduced the first dual-slice volume CT scanner. The configuration of the dual-row detector system results in faster volume coverage compared with single-row CT systems (Fig. 5-31). This technology uses a dual-row, solid-state detector array coupled with a special x-ray tube based on a double-dynamic focus system. Figure 5-31 also shows the conventional beam geometry (single focal spot, single fan beam, and single detector arc array) and the beam geometry that arises as a result of the dynamic focal spot system. The dynamic focal spot is where the position of the focal spot is switched by a computer-controlled electron-optic system during each scan to double the sampling density and total number of measurements. Twin-beam technology results in the simultaneous scan of two contiguous slices with excellent resolution (Fig. 5-32) because the fan beam ray density and detector sampling are doubled twice, once for each of the two contiguous slices.
Multirow/Multislice Detectors: The goal of multirow/multislice (MR/MS) detectors is to increase the volume coverage speed performance of both single-slice and dual-slice CT scanners. The MR-MS detector consists of one detector with rows of detector elements (Fig. 5-33). A detector with n rows will be n times faster than its single-row counterpart. MR-MS detectors are solid-state detectors that can acquire 4 to 64 to 320 slices per 360-degree rotation. In addition, the design of these detectors can influence the thickness of the slices.
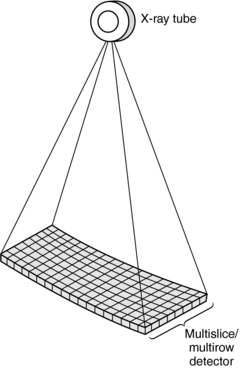
FIGURE 5-33 The basic structure of a multislice/multirow detector used in multislice volume CT scanners.
An MR/MS detector is an array consisting of multiple separate detector rows. For example, these detector rows can range from two (Elscint dual-row detector) to 64 detector rows that can image simultaneously two to 64 slices, respectively, per 360-degree rotation. It is fairly obvious that the number of slices obtained per 360-degree rotation depends on the number of detector rows. For example, while a 16-detector row scanner can produce 16 images per 360-degree rotation, a 64-detector row scanner will produce 64 slices per 360-degree rotation.
Multirow CT detectors fall into two categories (Fig. 5-34), namely, matrix array detectors and adaptive array detectors (Dalrymple et al, 2007; Flohr et al, 2005; Kalender, 2005). The matrix array detector (Fig. 5-34, A) is sometimes referred to as a fixed array detector, contains channels or cells as they are often referred to, that are equal in all dimensions. Because of this, these detectors are sometimes referred to as being isotropic in design, that is, all cells are perfect cubes. The adaptive array detector, on the other hand, is anisotropic in design (Kalender, 2005). This means that the cells are not equal but rather they have different sizes (Fig. 5-34, B). The overall goal of isotropic imaging is to produce improved spatial resolution in both the longitudinal and transverse planes (Dalrymple et al, 2007).
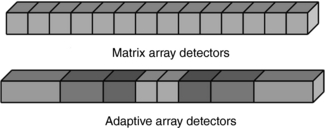
FIGURE 5-34 Multirow CT detectors fall into two categories (see Fig. 5-35), namely, matrix array detectors and adaptive array detectors. (See text for further explanation.)
During scanning, the number of slices and the thickness of each slice are determined by the detector configuration used. This configuration “describes the number of data collection channels and the effective section thickness determined by the data acquisition system settings” (Dalrymple et al, 2007). For the sake of simplicity, the detector configuration for a four-row matrix array detector is illustrated in Figure 5-35. In this example, each detector channel is 1.25 mm and four cells are activated or grouped together to produce four separate images of 1.25-mm thickness per 360-degree rotation. On the other hand, eight cells can be configured to produce four images of 2.5 mm thickness (1.25 mm + 1.25 mm = 2.5 mm) per 360-degree rotation, and so on. Multirow detectors are described further in Chapter 12.
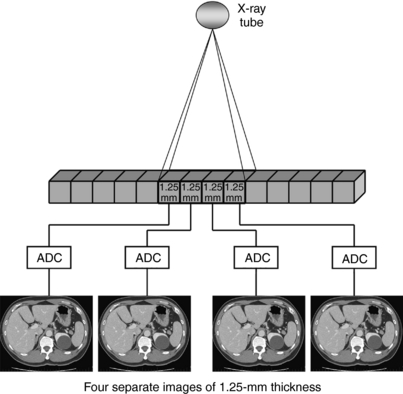
FIGURE 5-35 The detector configuration for a 4-row matrix array detector. In this example, each detector channel is 1.25 mm and four cells are activated or grouped together to produce four separate images of 1.25-mm thickness per 360-degree rotation.
Multirow detectors feature a number of imaging characteristics that are important to the technologist during scanning. These characteristics and specifications are shown in Table 5-2 from one CT vendor.
Area Detectors
As discussed previously, several groups are investigating the use of area detectors for CT imaging and prototypes gave been developed and are currently undergoing clinical testing. Two such CT scanners based on area detector technology are the 256-slice CT scanner prototype (Toshiba Acquilion, Toshiba Medical Systems, Japan) and the flat-panel CT scanner prototypes (one from Siemens Medical Solutions, and another from the Koning Corporation-USA).
The 256-Slice CT Prototype Detector: An illustration of the gantry and detector for this scanner is shown in Chapter 1 (Fig 1-16). The detector is a wide area multirow array detector that has 912 channels × 256 segments and a beam width of 128 mm (four times larger than the third-generation 16-slice Toshiba Acquilion CT Scanner). This wide beam width makes it possible to scan larger volumes such as the entire heart in a single rotation (Mori, 2006, personal communications; Mori et al, 2006). This scanner is described further in Chapter 12.
Flat-Panel Detectors: Flat-panel detectors similar to the ones used in digital radiography are being investigated for use in CT imaging. In this respect, several prototypes have been developed and are currently being evaluated for use in CT imaging. One such prototype is shown in Figure 5-10. Note that the detector is a flat-panel type and is based on the CsI indirect conversion digital radiography detector. More recently, flat-panel detectors are being investigated for use in breast CT, and several prototypes are now undergoing clinical testing (Glick et al, 2007; Kwan et al, 2007). Breast CT is described in Chapter 13.
DETECTOR ELECTRONICS
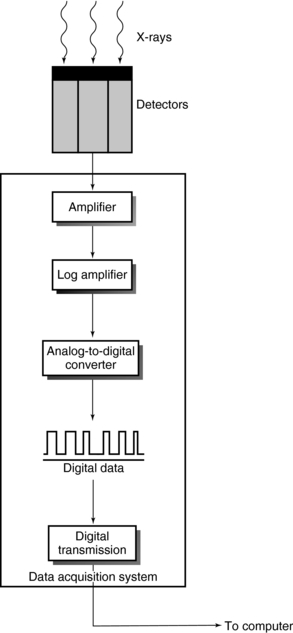
The data acquisition system (DAS) refers to the detector electronics positioned between the detector array and the computer (Fig. 5-36). Because the DAS is located between the detectors and the computer, it performs three major functions: (1) it measures the transmitted radiation beam, (2) it encodes these measurements into binary data, and (3) it transmits the binary data to the computer.
Components
The detector measures the transmitted x-rays from the patient and converts them into electrical energy. This electrical signal is so weak that it must be amplified by the preamplifier before it can be analyzed further (Fig. 5-37).
The transmission measurement data must be changed into attenuation and thickness data. This process (logarithmic conversion) can be expressed as follows:

or

where μ is the linear attenuation coefficient, I0 is the original intensity, I is the transmitted intensity, and x is the thickness of the object.
Logarithmic conversion is performed by the logarithmic amplifier, and these signals are subsequently directed to the ADC. The ADC divides the electrical signals into multiple parts—the more parts, the more accurate the ADC. These parts are measured in bits: a 1-bit ADC divides the signal into two digital values (21), a 2-bit ADC generates four digital values (22), and a 12-bit ADC results in 4096 (212) digital values. These values help determine the gray-scale resolution of the image. Modern CT scanners use 16-bit ADCs.
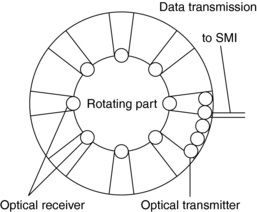
The final step performed by the DAS is data transmission to the computer. CT manufacturers have introduced optoelectronic data transmission schemes for this purpose because of the continuous rotation of the tube or detector arc and vast amount of data generated.
Optoelectronics refers to the use of lens and light diodes to facilitate data transmission (Fig. 5-38). Several optical transmitters send the data to the optical receiver array so that at least one transmitter and one receiver are always in optical contact. These receivers and transmitters are light-emitting diodes capable of very high rates of data transmission; 50 million bits per second is common.
DATA ACQUISITION AND SAMPLING
During data acquisition, the radiation beam transmitted through the patient falls on the detectors. Each detector then measures, or samples, the beam intensity incident on it. If enough samples are not obtained, artifacts such as streaking (an aliasing artifact) appear on the reconstructed image. To solve this problem, the following methods have been devised to increase the number of samples available for image reconstruction and to thus improve the quality of the image:
• Slice thickness: The imaging of thin slices helps reduce streaking artifacts related to sampling.
• Closely packed detectors: When the detectors are closely packed, more detectors are available for data acquisition, which ensures more samples per view and an increase in the total measurements taken per scan.
• In the past, the quarter-shifted detector arc has been used: In conventional CT systems, the fan beam is composed of the same number of beams and detectors, and the spacing of the beams often causes sampling errors. These errors can be minimized if the detector arc is shifted by one-quarter detector space. The goal of detector shifting is to provide two sets of data that can be individually reconstructed or combined to provide a doubly fine sampling grid so more data are available for image reconstruction. In the Siemens Somatom Plus scanner, for example, this shifting is accomplished by the flying focal spot (dual focal spot x-ray tube). The same detector is used more than once to provide a large number of discrete measurements, which eliminates the aliasing artifact. This process is referred to as the multifan measurement technique (Siemens Medical Systems, 1999).
• The double-dynamic focus system used by Elscint in their CT twin scanner was yet another method of increasing detector sampling during data acquisition.
New Sampling Technique: z-Sharp Technology
A more recent innovation is one that involves the use of the Straton x-ray tube described earlier in the chapter. As seen in Figure 5-39, the z-flying focal spot technique (referred to as the z-sharp technology) provides doubling sampling, where two overlapping slices for each detector row are obtained at the same time per 360-degree rotation. The Siemens Somatom 64 CT scanner, for example, will provide 64 slices for the 32 × 0.6 mm detector array. As noted by Kalender (2005) “the data thus acquired with its 32 × 0.6mm detector present the equivalent to the sampling pattern of a 64 × 0.3mm detector. The data set results are representing 64 overlapping slices of 0.6mm width with a sampling distance of 0.3mm.”
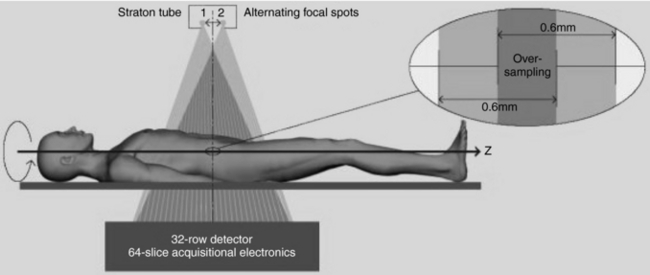
FIGURE 5-39 The z-flying focal spot technique (referred to as the z-sharp technology) provides doubling sampling, where two overlapping slices for each detector row are obtained at the same time per 360-degree rotation. Courtesy Siemens Medical Solutions, Germany.
The results of double sampling in the z-direction by the z-flying focal spot (z-FFS) technique on image quality are illustrated in Figure 5-40. It is clearly apparent that the image is much sharper with the z-FFS (Fig. 5-40, A) sampling technique than without the z-FFS (Fig. 5-40, B) sampling technique.
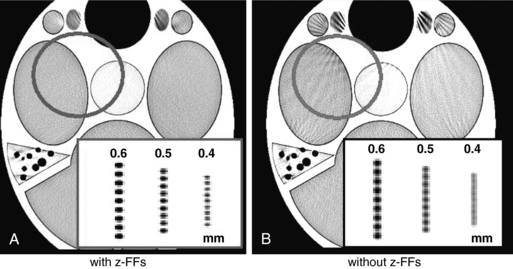
FIGURE 5-40 The results of double sampling in the z-direction by the z-flying focal spot (z-FFS) technique on image quality. It is clearly apparent that the image is much sharper with the z-FFS (A) sampling technique than without the z-FFS (B) sampling technique. Courtesy Siemens Medical Solutions, Germany.
REFERENCES
Arenson, J. Data collection strategies: gantries and dectectors. In: Goldman LW, Fowlkes JB, eds. Medical CT and ultrasound: current technology and applications. College Park, Md: American Association of Physicists in Medicine; 1995:329–347.
Boyd, DP, Lipton, MJ. Cardiac computed tomography,. Proc IEEE. 1983;198:198–307.
Brunnett, CJ, et al. CT design considerations and specifications. Cleveland, Ohio: Picker International, 1990.
Dalrymple, NC, et al. Price of isotropy in multidetector CT,. Radiographics. 2007;27:49–62.
Douglas-Akinwande, AC, et al. Multichannel CT: Evaluating the spine in postoperative patients with orthopedic hardware,. Radiographics. 2006;26:S96–S110.
Flohr, TG, et al. Multi-detector row CT systems and image reconstruction techniques,. Radiology. 2005;235:756–773.
Flohr, TG, et al. First performance evaluation of a dual-source CT (DSCT) system,. Eur Radiol. 2006;16:256–268.
Fox, SH. CT tube technology. In: Goldman LW, Fowlkes JB, eds. Medical CT and ultrasound: current technology and applications. College Park, Md: American Association of Physicists in Medicine; 1995:349–357.
Glick, SJ, et al. Evaluating the impact of x-ray spectral shape on image quality in flat-panel CT breast imaging,. Med Phys. 2007;34:5–20.
Homberg, R, Koppel, R. An x-ray tube assembly with rotating-anode spiral groove bearing of the second generation,. Electromedica. 1997;66:65–66.
Hupke, R, et al. Low-dose CT imaging with the new UFC detector,. Electromedica. 1997;66:56–57.
Kalender, WA. Computed tomography: fundamentals, system technology, image quality, applications, 2. Erlangen, Germany: Publicis Corporate Publishing, 2005.
Kwan, ALC, et al. Evaluating the spatial resolution characteristics of a cone-beam breast CT scanner,. Med Phys. 2007;34:275–281.
McCollough, CH. Principles and performance of electron beam CT. In: Goldman LW, Fowlkes JB, eds. Medical CT and ultrasound, current technology and applications. College Park, Md: American Association of Physicists in Medicine, 1995.
McCollough, CH, et al. Dose performance of a 64-channel dual-source CT scanner,. Radiology. 2007;243:775–784.
Mori S: Personal communication, 2006.
Mori S et al: Comparison of patient doses in 256-slice CT and 16-slice CT scanners, Br J Radiol 79:56-61, 2006.
Parker, DL, Stanley, JH. Glossary. In: Newton TH, Potts DG, eds. Radiology of the skull and brain: technical aspects of computed tomography. St Louis: Mosby, 1981.
Seeram, E. Computed tomography technology. Philadelphia: WB Saunders, 2001.
Siemens Medical Systems. The technology and performance of the Somatom Plus. Iselin, NJ: Siemens, 1999.
Villafana, T. Physics and instrumentation: CT and MRI. In: Lee SH, Rao KCVG, eds. Cranial computed tomography. New York: McGraw-Hill, 1987.