Single-Slice Spiral/Helical Computed Tomography: Physical Principles and Instrumentation
In l990 the first computed tomography (CT) scanner to perform volume data acquisition was introduced (Kalender, 1995). This scanner was invented to overcome the problems imposed by conventional (slice-by-slice scanning) CT scanners. In addition, the scanners provide shorter scan times to subsecond levels and improvement in three-dimensional (3D) imaging. These scanners are referred to as single-slice spiral/helical CT scanners (SSCT) or volume CT scanners on the basis of the beam geometry used during data acquisition.
The purpose of the chapter is to introduce the language of SSCT scanning and describe the fundamental concepts of spiral/helical data acquisition, image reconstruction, major system components, basic scan parameters, and the advantages and limitations of SSCT scanners.
It is important to note that, more recently, multislice CT (MSCT) scanners have become available (see Chapter 1) and are rapidly replacing SSCT scanners. The physical principles and technology of MSCT scanners are described in detail in Chapter 12.
The technical principles and concepts of SSCT scanners described in this chapter serve to lay the foundations necessary for a good understanding of MSCT scanners.
HISTORICAL BACKGROUND
An early pioneer in the development of the technique of volume scanning in CT was Dr. Willi A. Kalender (see Chapter 1) of the Institute of Medical Physics at the University of Erlangen, Germany. Kalender started work on spiral CT in 1988 with Peter Vock from Switzerland, and in 1989 he described the technical details and clinical applications of spiral CT to the Radiological Society of North America (RSNA) meeting in Chicago. Other early investigators included Mori (1987), various Japanese researchers, and Bresler and Skrabecz (1993).
Terminology Controversy
Kalender and Vock’s presentation at the RSNA in 1989 resulted in a flurry of activities related to volume scanning. An interesting debate that surfaced in the early literature was related to the terminology to best describe the method of volume data acquisition. Should volume scanning be called spiral CT or helical CT? In a letter to the editors of the American Journal of Roentgenology (AJR), Towers (1993) used an illustration (Fig. 11-1) to describe the fundamental differences between spiral CT and helical CT. Towers noted that the term helical describes a cylindrical configuration, whereas spiral refers to both cylindrical and conic configurations. He therefore recommended the use of the term spiral CT.
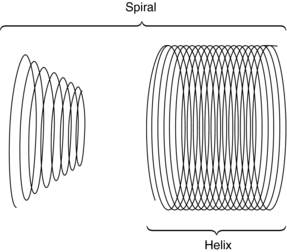
FIGURE 11-1 Spiral geometries. The helix is one type of spiral. From Towers MJ: Spiral or helical CT? [letter], AJR Am J Roentgenol 161:901, 1993.
In another letter to the editors of AJR, Silverman et al (1994) argued that the term helical CT “best describes this new CT technology.” Dr. Mark Bahn of the Mallinckrodt Institute of Radiology offered mathematical definitions to support this view. He pointed out that mathematical dictionaries (Baker, 1961; James and James, 1976) provide more technical definitions of these two terms: a spiral describes a curve on a plane surface; a helix describes a curve in 3D space.
In response, Kalender (1994a) submitted a letter (Appendix A) to the editors of Radiology to support use of the term spiral CT, which convinced the editors to accept either term for CT papers published in Radiology. This book uses both terms as synonyms, as suggested by Kalender (1994a).
CONVENTIONAL SLICE-BY-SLICE CT SCANNING
In conventional CT scanning, the x-ray tube rotates around the patient to collect data from a single slice of tissue, followed by table indexing so that the next contiguous slice can be scanned. This process is repeated until data from several contiguous slices have been collected. The scanning sequence for this type of data acquisition consists of four distinct steps (Fig. 11-2).
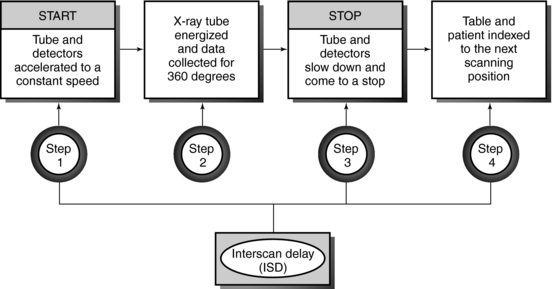
In the first step, the x-ray tube must be accelerated to a constant speed of rotation. This means that the cables that supply power to the x-ray tube must be long enough to allow for the full 360-degree rotation. During this rotation (step 2), the x-ray tube produces x-rays that are transmitted through the patient to fall on the detectors, which measure the relative transmission values (data). At this particular point, the patient holds a breath, and data are collected from a specific axial slice. In step 3, the patient resumes breathing while the x-ray tube slows to a stop. In step 4, it is necessary to unwind the cable because of the 360-degree rotation and to move the patient and table so that the next contiguous slice can be scanned.
This four-step process is repeated until all the required contiguous axial slices have been scanned. The time it takes to accomplish steps 1, 3, and 4 is referred to as the interscan delay time (ISD).
Slices are usually collected in groups while the patient holds a breath, with the ISD after each pair of slices. Between two groups of slices is an intergroup delay, and it is at this point that the patient breathes. Additionally, the scan rate is expressed as the following ratio:
If the study requires more slices, its duration would have to be increased. This requirement places an additional burden on the patient to remain still to ensure that images obtained are free of motion artifacts.
Limitations
The limitations imposed by slice-by-slice sequential CT scanning include the following:
1. Longer examination times because of the stop-start action necessary for patient breathing, table indexing, and cable unwinding. This gives rise to the ISD. The cable wraparound and unwinding is shown in Figure 11-3, A. This wraparound results from the fixed length of the high-voltage cable, which follows the x-ray tube as it rotates through 360 degrees around the patient. The cable is unwound during the imaging of the next slice. In Figure 11-3, B, the cable wraparound process is eliminated through the use of slip-ring technology, which allows the x-ray tube to rotate continuously as the patient moves continuously through the gantry. This is spiral/helical CT scanning.
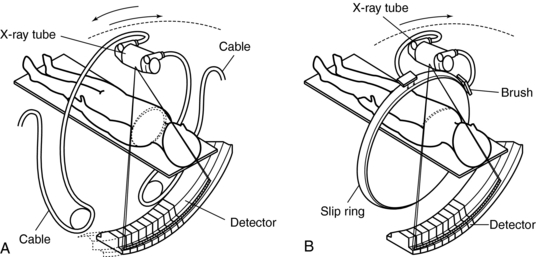
FIGURE 11-3 One advance in CT technology that facilitates CT fluoroscopy is continuous scanning by using slip-ring technology. The cable wraparound typical of conventional slice-by-slice CT results in a delay that prevents real-time image reconstruction and display. A, Reciprocating rotation. B, Fast continuous rotation. From Ozaki M: Development of a real-time reconstruction system for CT fluorography, Toshiba Med Rev 53:12-17, 1995.
2. Certain portions of the anatomy are omitted because the patient respiration phase may not always be consistent between scans (Fig. 11-4). For example, it has been reported that lesions in the liver smaller than 1 centimeter (cm) may be missed because of inconsistent levels of inspiration. This omission of anatomy is often referred to as slice-to-slice misregistration.
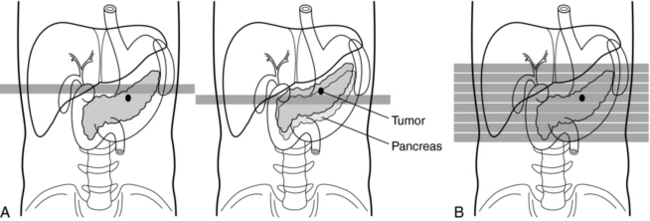
FIGURE 11-4 Removal of the effects of different levels of respiration. A, Conventional scanning. In spiral/helical CT scanning (B) there is no shifting of lesions because of different levels of respiration. Courtesy Toshiba America Medical Systems, Tustin, Calif.
3. Inaccurate generation of 3D images and multiplanar reformatted images, attributed to the inconsistent levels of inspiration from scan to scan. The result is the appearance of “steplike” contours in 3D images. Figure 11-5 illustrates production of the stairstep artifact and its elimination with spiral/helical CT.
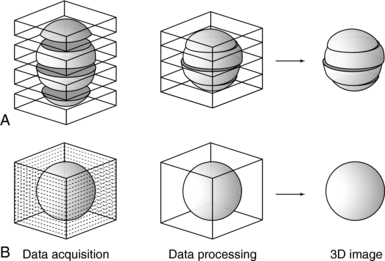
FIGURE 11-5 Comparison of the accuracy of 3D reconstruction for conventional (A) and spiral/helical (B) CT scanning. Courtesy Toshiba America Medical Systems, Tustin, Calif.
4. Only a few slices are scanned during maximum contrast enhancement when the contrast enhancement technique is used. These problems may be overcome if the scan rate is increased and the ISD is eliminated, both of which are technologically feasible. The scan time can be increased by decreasing the time to accomplish the four steps shown in Figure 11-2. The ISD can be eliminated by having the tube (and detector) rotate continuously around the patient (instead of the start-stop action characteristic of slice-by-slice sequential CT scanning) while simultaneously translating the patient through the gantry aperture at a faster speed. Data are acquired during the patient translation.
This chapter concentrates on methods to remove the ISD with the goal of acquiring the data continuously rather than in slices. This technique is only possible with continuous rotation scanners based on slip-ring technology.
PRINCIPLES OF SSCT SCANNERS
The introduction of CT scanners that can scan rapidly with scan times shorter than 1 second has led to the development of the SSCT scanner. The overall goal of this scanner is to increase the volume coverage speed compared with that of the conventional CT scanner.
To do this efficiently requires that the x-ray tube rotate continuously around the patient while the patient moves through the gantry aperture during the scanning to cover an entire volume of tissue (compared with a single slice characteristic of conventional CT scanners). Rotation of the x-ray tube coupled with patient translation through the gantry aperture traces an x-ray beam path with respect to the patient (Fig. 11-6). The path geometry describes a spiral or helical winding and therefore has been referred to as spiral/helical CT. Other terms considered synonymous are spiral volume CT and helical volumetric CT.
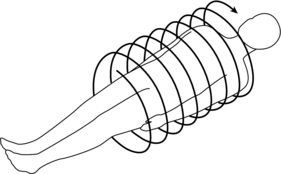
FIGURE 11-6 The spiral/helical geometry created when the x-ray tube rotates continuously around the patient with simultaneous patient translation.
Because a one-dimensional (1D) detector array is used, only a single slice is acquired during one rotation of the tube. Because there are several rotations per required length of anatomy imaged (volume of tissue scanned), several slices of tissue and corresponding images can be computer generated for the volume of the anatomy scanned during a single breath-hold.
Requirements for Volume Scanning
Because the data in spiral/helical CT are collected in volumes rather than slices, the following requirements must be met:
1. Continuously rotating scanner based on slip-ring technology
3. Increase in loadability of the x-ray tube, capable of delivering at least 200 milliamperes per revolution continuously throughout the time it takes to scan the volume of tissue
4. Increased cooling capacity of the x-ray tube
5. Spiral/helical weighting algorithm
6. Mass memory buffer to store the vast amount of data collected
Data Acquisition
The first step in volume scanning is data acquisition (Fig. 11-7). The x-ray tube traces a spiral/helical path with a radius equal to the distance from the focal spot to the center of rotation. This results in an entire volume of tissue being scanned during a single breath-hold compared with slice-by-slice imaging (Fig. 11-8).
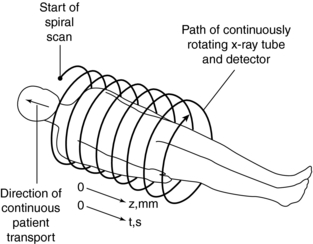
FIGURE 11-7 First step in spiral/helical CT: data acquisition. As the patient is transported through the gantry aperture, the x-ray tube traces a spiral path around the patient, collecting data as it rotates.
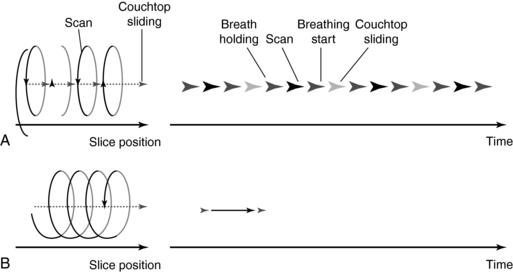
FIGURE 11-8 Comparison of conventional (A) and spiral/helical (B) CT scanning sequences. From Tohki Y: The helical scanning technique, Toshiba Med Rev 38:1-5, 1991.
Transporting the patient too quickly leads to image degradation caused by motion artifacts or may cause the patient to feel motion sickness. It is therefore important that the patient moves at a constant speed. In general, patients are moved at a table speed of about 10 millimeters (mm) per second during a continuous 1-second scanning. If a 24-second scan is taken, then the anatomic volume scanned is 240 mm (24 cm). Scanning times differ by manufacturer but average about 32 seconds. In addition the slice thickness may range from 1 to 10 cm.
Several problems can result from data acquisition with spiral geometry:
1. There is no defined slice, and thus localization of a particular slice is difficult.
2. The geometry of the slice volume is different for spiral/helical scans compared with conventional CT scans (Fig. 11-9). Figure 11-10 explains the origin of the slice volume shown in Figure 11-9, B. In conventional slice-by-slice CT, the tube rotates around the patient for 360 degrees to collect a complete set of data in planar geometry for each individual slice shown in Figure 11-9, A. This data set is said to be consistent; that is, it is collected from one slice or plane. In spiral/helical volume CT scanning, the x-ray tube rotates continuously as the patient moves through the gantry continuously as well. In this situation, data are now collected in nonplanar geometry, resulting in the diagram shown in Figure 11-9, B. The data are collected from different regions of the volume and not through a particular plane.
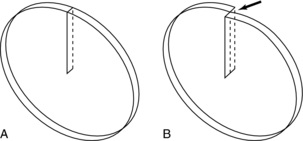
FIGURE 11-9 Geometry of the slice volume characteristic of conventional CT scanning (A) and spiral/helical CT scanning (B).
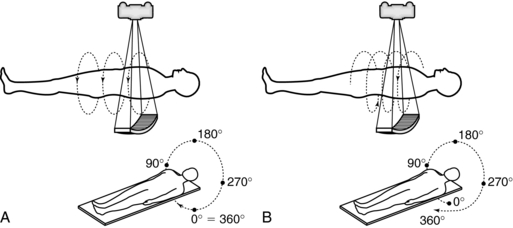
FIGURE 11-10 Data acquisition geometries for conventional slice-by-slice CT (A) and spiral/helical CT (B).
3. The effective slice thickness increases because it is influenced by the width of the fan beam and the speed of the table.
4. Because of the absence of a defined slice, the projection data are inconsistent (consistent projection data are needed to satisfy the standard reconstruction process).
5. When inconsistent projection data are used with the standard reconstruction process, streak artifacts akin to motion artifacts are clearly apparent on the image.
These problems can be solved through the use of special postprocessing techniques. One such method involves a “dedicated reconstruction algorithm that synthesizes raw data representing a perfectly planar slice from the original spiral data by interpolation” (Kalender, 1995). Interpolation is a mathematical technique whereby an unknown value can be estimated given two known values on either side (see Chapter 6). Interpolation and extrapolation are illustrated in Figure 11-11.
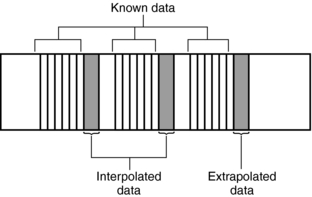
Image Reconstruction
Inconsistent data that are obtained from 360-degree spiral/helical scan rotation are used directly in the image reconstruction process. Motion artifacts are apparent as shown in Figure 11-12, A, for phantom images and in Figure 11-13, A, for patient images.
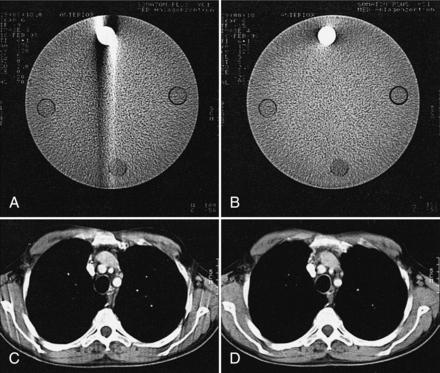
FIGURE 11-12 Comparison of image quality using direct reconstruction of the spiral data (A, C) as opposed to reconstruction using the interpolation algorithm (B, D) for phantom (A, B) and mediastinal (C, D) studies. The streak artifacts are removed when the interpolation algorithm is used. From Kalender WA et al: Spiral CT scanning for fast and continuous volume data acquisition. In Fuchs WA, editor: Advances in CT, New York, 1990, Springer-Verlag.
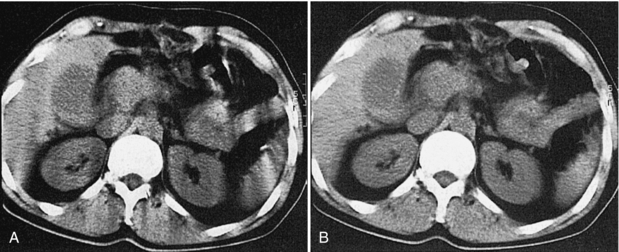
FIGURE 11-13 Image reconstruction principles in spiral/helical CT. A, Direct reconstruction of an image from a 360-degree spiral segment results in motion artifacts. B, Image reconstruction from a planar data set calculated by slice interpolation from the spiral data set results in images free of artifacts. From Kalender W: Principles and performance of spiral CT. In Goldman LW, Fowlkes JB, editors: Medical CT and ultrasound: current technology and applications, College Park, Maryland, 1995, American Association of Physics in Medicine.
To eliminate these motion artifacts arising from the continuous movement of the patient during scanning, two steps are needed:
1. Calculation (using interpolation) of a planar data set from the tissue volume data set for every image (Fig. 11-14). The planar data set (the image plane in Fig. 11-14) approximates the transverse axial section as with conventional CT. Within the volume scanned, a slice can be selected anywhere between the start and end positions in addition to the spacing and the number of slices (Fig. 11-15).
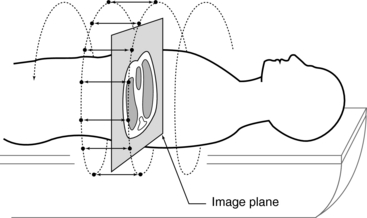
FIGURE 11-14 The first step to produce an image in spiral/helical CT scanning is to calculate a planar data set (image plane) from the volume data set (measured data). This is accomplished by using linear interpolation.
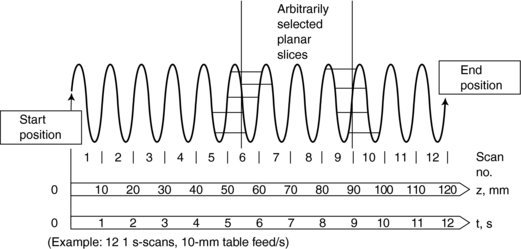
FIGURE 11-15 The second major step in spiral/helical CT is interpolation. Images of arbitrarily selected slices can be reconstructed with an interpolation algorithm. Courtesy Siemens Medical Systems, Iselin, NJ.
2. Reconstruction of images similar to conventional CT by use of the filtered back-projection algorithm. The results of these two processes are free of blurring as shown in Figure 11-13, B.
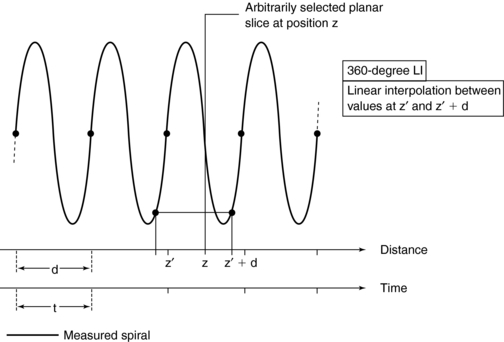
A number of interpolation algorithms are used to produce the planar data set, and linear interpolation (LI) represents the “simplest approach” (Kalender, 1995). Two interpolation algorithms for single-slice spiral/helical CT are the 360-degree LI algorithm and the 180-degree LI algorithm.
360-Degree Linear Interpolation Algorithm: The 360-degree LI algorithm was the interpolation algorithm used during the initial development of spiral/helical CT scanners (Fig. 11-16). The basis for this algorithm is illustrated in Figure 11-16. The planar slice is interpolated by use of data points measured 360 degrees apart. The fundamental problem with the 360-degree LI algorithm is related to the image quality of the planar slice. This algorithm broadens the slice sensitivity profile (SSP) and hence degrades image quality. To overcome this problem, the 180-degree LI algorithm was introduced.
180-Degree Linear Interpolation Algorithm: The 180-degree LI algorithm improves the image quality of the 360-degree LI algorithm by using points that are closer to the planar slice to be interpolated (Fig. 11-17). The basic difference between the 360-degree and the 180-degree LI algorithms is that a second spiral (the dotted line in Fig. 11-17) is calculated from the measured spiral/helical data set and is offset by 180 degrees. In this situation, the planar slice can then be interpolated with use of data points that are closer to it compared with the 360-degree LI algorithm. This process improves on the SSP and therefore enhances image quality.
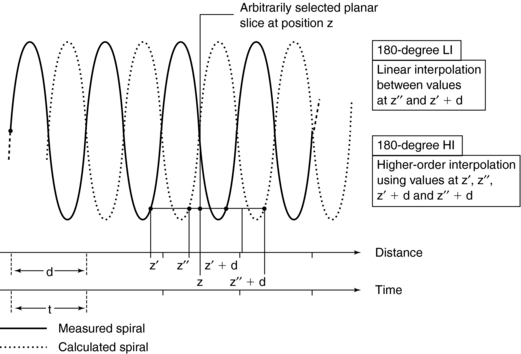
FIGURE 11-17 The 180-degree LI algorithm. Interpolation between measured data points derived from 180-degree opposite views allows to limit the scan range used per image. Higher-order interpolation schemes can also be implemented.
In addition to the algorithms, Kalender (1995) states that “higher-order nonlinear interpolation algorithms can be implemented. While they preserve the shape of the sensitivity profiles even better, their influence on noise and image quality is not easy to predict and control. On a given scanner, the exact algorithm and above all its implementation, which may have significant influence on image quality and artifact behavior, are not documented as they are considered confidential by the manufacturers in most cases.” These algorithms are not within the scope of this book. The reader should refer to Kalender (2005) for a further description of nonlinear interpolation algorithms.
INSTRUMENTATION
Spiral/helical CT scanners (Fig. 11-18) are not different in external appearance from conventional CT scanners. However, there are significant differences in several major equipment components.
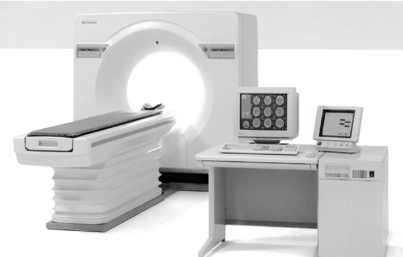
FIGURE 11-18 A spiral/helical CT scanner is similar in external appearance to conventional CT scanners. Courtesy Shimadzu Medical Systems, Seattle, Wash.
Equipment Components
A block diagram of the major equipment components of a spiral/helical CT scanner is shown in Figure 11-19. The most noteworthy feature is the use of slip rings to connect the stationary and rotating parts of the scanner.
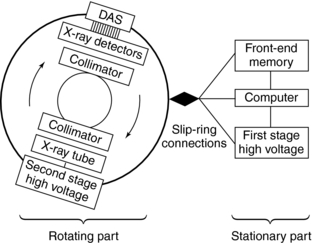
FIGURE 11-19 The major equipment components of a spiral/helical CT scanner. Connection between the stationary and rotating parts of the scanner is made possible by slip-ring technology.
The rotating part of the system consists of the x-ray tube, high-voltage generator, detectors, and detector electronics (DAS). The stationary part consists of the front-end memory and computer and the first-stage high-voltage component.
The x-ray tube and detectors rotate continuously during data collection because the cable wraparound problem has been eliminated by slip-ring technology. Because large amounts of projection data are collected very quickly, increased storage is needed. This is accommodated by the front-end memory, fast solid state, and magnetic disk storage.
In spiral/helical CT scanners, the x-ray tube is energized for longer periods of time compared with conventional CT tubes. This characteristic requires x-ray tubes that are physically larger than conventional x-ray tubes and have heat storage capacities greater than 3 million heat units (MHU) and anode cooling rates of 1 MHU per minute (Bushong, 2004).
X-ray detectors for single-slice spiral/helical CT scanning are 1D arrays and should be solid state because their overall efficiency is greater than gas ionization detectors.
The high-voltage generator for spiral/helical CT scanners is a high-frequency generator with a high power output. The high-voltage generator is mounted on the rotating frame of the CT gantry and positioned close to the x-ray tube (see Fig. 11-19). X-ray tubes operate at high voltages (about 80 to 140 peak kilovolts) to produce x-rays with the intensity needed for CT scanning. At such high voltages, arcing between the brushes and rings of the gantry may occur during scanning. To solve this problem, one approach is to divide the power supply into a first stage on the stationary part of the scanner, where the voltage is increased to an intermediate level, and a second stage on the rotating part of the scanner, where the voltage is increased to the required high voltages needed for x-ray production and finally rectified to direct current potential (see Fig. 11-19) (Napel, 1995). Another approach passes a low voltage across the brushes to the slip rings, the high-voltage generator, and then the x-ray tube. In both designs, only a low to intermediate voltage is applied to the brush/slip-ring interface, thus decreasing the chances of arcing.
Slip-Ring Technology
One of the major technical factors that contribute to the success of spiral/helical CT scanning is slip-ring technology (see Fig. 11-19). The purpose of the slip ring is to allow the x-ray tube and detectors (in third-generation CT systems, see Fig. 11-19) to rotate continuously so that a volume of the patient, rather than one slice, can be scanned very quickly in a single breath hold. The slip rings also eliminate the long, high-tension cables to the x-ray tube used in conventional start-stop CT scanners. As the x-ray tube rotates continuously, the patient also moves continuously through the gantry aperture so that data can be acquired from a volume of tissue.
The technical aspects of using slip rings for data acquisition are described in Chapter 5. These include the design and power supply to the rings and a comparison of low-voltage and high-voltage slip-ring CT scanners in terms of the high voltage supplied to the x-ray tube.
BASIC SCAN PARAMETERS
Several scan parameters for spiral/helical CT are the same as for conventional CT; however, there are a few parameters and a set of terms associated only with spiral/helical CT. Typical parameters include spiral scan time, table feed per 360-degree rotation, table speed, number of revolutions, scan range or volume coverage, z-axis (the axis of rotation of the scanner or the longitudinal axis of the patient), collimation, and the reconstruction increment and z-interpolation (“calculation of planar attenuation data for desired table position interpolation between data points measured for the same projection angle at neighboring z-axis positions [synonyms: slice interpolation, section interpolation, z-axis interpolation]”) algorithms (Kalender, 1995). It is not within the scope of this chapter to describe all these parameters; however, the pitch, volume coverage, collimation, table speed, and reconstruction increment are highlighted here.
Pitch
The pitch is a term associated with a fastener, and it is actually the distance between the turns on the fastener. In spiral/helical CT, the pitch is defined as the distance (in mm) that the CT table moves during one revolution of the x-ray tube (Fig. 11-20). The pitch is used to calculate the pitch ratio, which is a ratio of the pitch to the slice thickness or beam collimation. The pitch ratio is as follows:
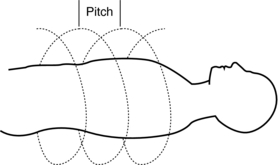
FIGURE 11-20 The pitch is the distance the CT table moves during one complete revolution of the x-ray tube.

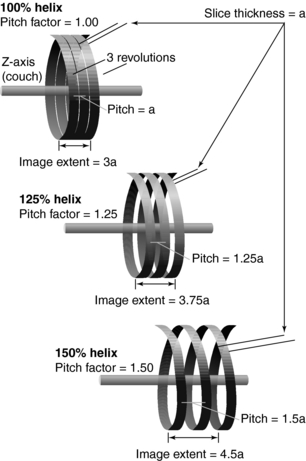
When the distance the table travels during one complete revolution of the x-ray tube equals the slice thickness or beam collimation, the pitch ratio (pitch) is 1:1, or simply 1. A pitch of 1 results in the best image quality in spiral/helical CT scanning. The pitch can be increased to increase volume coverage and speed up the scanning process (Fig. 11-21). Pitch is of particular significance because it affects image quality and patient dose and also plays a role in the overall outcome of the clinical examination.
Volume Coverage
The volume coverage is given by the following relationship:

for fixed scan time and fixed slice thickness (Bushong, 2004).
Another factor that influences the volume coverage is gantry rotation time. The volume coverage in this case becomes:
Collimation and Table Speed
Collimation determines the slice thickness and in most cases is equal to the table increment (a pitch of 1). Collimation selection also depends on the type of tissue to be examined. Smaller structures usually require narrow collimation, whereas larger structures are imaged with wider collimation.
Another parameter of importance is the table increment (mm per second), also referred to as the table feed or table speed. As the table increment increases with respect to the collimation, pitch increases, resulting in a loss of image quality. To cover a certain volume, it is important to keep in mind two parameters that influence image quality: collimation and table incrementation. The goal is to use the smallest possible collimation at a pitch of 2 (with 180-degree interpolation algorithm). Hence, for a volume length of 30 cm, either a 5-mm or 8-mm collimation can be used with a table speed of 10 mm.
Scan Time
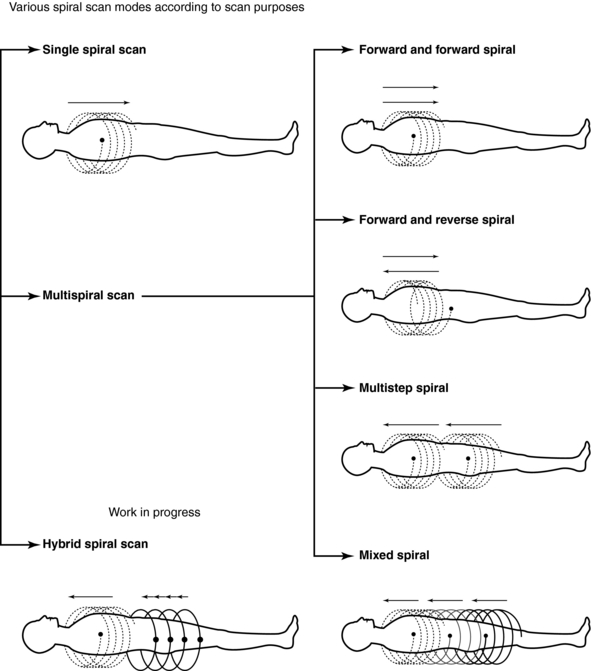
Another operator-defined parameter in spiral/helical CT that affects the outcome of the examination is the scan time, which refers to the duration of the scan. The choice of scan time depends on the patient’s respiratory condition. Most current scanners feature various spiral/helical scan modes (Fig. 11-22) for patients who have difficulty holding the breath. For example, in a multistep spiral/helical scan mode, multiple scans are obtained with a pause between scans to enable patients to breathe so that the required length of tissue can be imaged successfully.
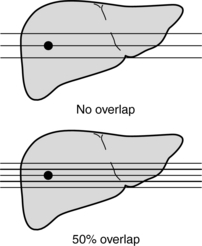
Reconstruction Increment
Another parameter unique to spiral/helical CT is the reconstruction increment (RI), also referred to as the reconstruction interval or reconstruction spacing. The RI determines the degree of sectional overlap to improve image quality. As RI decreases, image quality generally improves. Urban et al (1993) found that for the detection of small lesions in the liver, a 50% overlap (Fig. 11-23) resulted in better visualization of these lesions by 10%. In a set of simulations conducted by Brink et al (1994) to find whether an increased degree of overlap would provide better results, the researchers recommended “reconstructing one or two sections per table increment for routine diagnosis and at least three sections per table increment for multidimensional imaging.”
SSCT/CONVENTIONAL CT: IMAGE QUALITY/DOSE COMPARISON
In this section, a comparison is made of SSCT scanners and conventional CT scanners on several image quality parameters. These are discussed here to provide the reader with some historical notes relating to the performance of the SSCT scanners introduced and used in the past.
A number of workers have investigated the physical performance characteristics of spiral/helical CT (Kalender et al, 1994b). These characteristics include image quality parameters such as spatial resolution, image uniformity, and contrast; image noise and slice sensitivity profiles; radiation dose; and artifacts.
In general, most characteristics appear to be affected only slightly. As noted by Kalender (1995), image quality in spiral/helical CT is equivalent to that of conventional CT “in every respect” because the basic imaging parameters are the same.
Spatial and Contrast Resolution
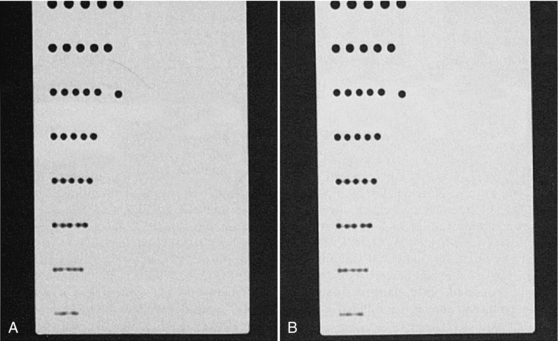
For the same image reconstruction parameters, contrast and spatial resolution should be about the same for both spiral/helical CT and conventional CT. For example, measurements of the scan plane (image plane) spatial resolution conducted by Kalender (1995) with a standard poly(methyl methacrylate (Perspex) hole pattern phantom demonstrate this similarity between spatial resolution for conventional CT and spiral/helical CT. The visual evidence is shown in Figure 11-24. However, as noted by Kalender (1995), the contrast for small objects and the spatial resolution along the z-axis (longitudinal direction) may be somewhat different. For example, in simulations, phantom experiments, and specimen studies that compared contrast and spatial resolution along the z-axis for both conventional and spiral/helical CT, Kalender et al (1994) found that spiral/helical CT provides “significantly better” contrast and spatial separation of 5-mm spheres imaged with a 5-mm slice thickness.
Noise
Noise in spiral/helical CT is affected by a range of parameters, including beam intensity, beam quality (energy), slice thickness, and matrix size (pixel size). Additionally, noise in spiral/helical CT is also affected by the interpolation algorithm. Compared with conventional CT (all other factors held constant), the 360-degree LI algorithm produces less noise; however, when the 360-degree LI and the 180-degree LI algorithms were compared, it was found that the 180-degree LI algorithm produced more noise and thus degraded image quality (Kalender, 1994b). However, this problem has little effect on the image quality of bony structures because the subject contrast of bone is greater than its surrounding soft tissues (Fig. 11-25).
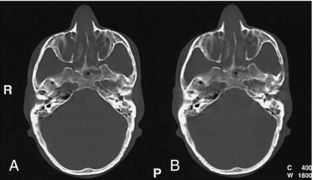
FIGURE 11-25 The difference in image quality and noise in studies carried out using a pitch of 1 (360-degree interpolation algorithm) and a pitch of 2 (180-degree interpolation algorithm) may be inconsequential in bone studies because of the high inherent subject contrast, especially when other imaging parameters are optimized, as evidenced by these phantom studies. A, Pitch 1, 360 degrees. B, Pitch 2, 180 degrees. From Cinnamon J: Multislice volumetric spiral CT: principles and applications, Liege, Belgium, 1998, Massoz.
Slice Sensitivity Profile
The SSP “describes how thick a section is imaged and to what extent details within the section contribute to the signal” (Kalender, 1994b). For conventional CT, the shape of the SSP is rectangular (Fig. 11-26, A). The section thickness is measured in the middle of the rectangle. This point is referred to as the full width at half maximum (FWHM). For spiral/helical CT, the SSP also depends on the pitch and the interpolation algorithm. Figure 11-26, B, shows the SSPs for a pitch of 1 and 2. Figure 11-26, C, shows SSPs for a 180-degree LI algorithm and a 360-degree algorithm. The SSP degrades with a pitch of 2 and a 360-degree LI algorithm. (The FWHM does not approximate closely the actual slice thickness selected.) As the SSP widens, image quality degrades.
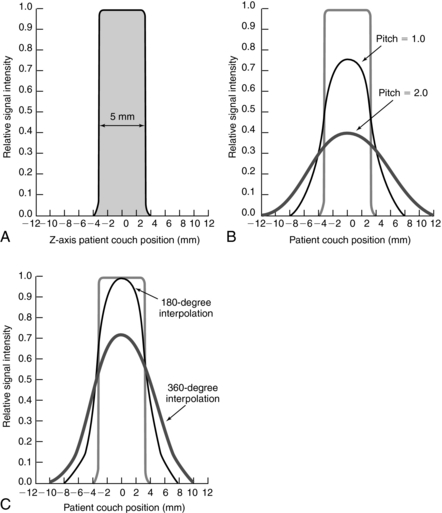
FIGURE 11-26 The SSP for conventional CT and spiral/helical CT. A, The SSP is almost a rectangle and closely approximates the slice thickness. B, The SSPs for spiral/helical CT are shown for a pitch of 1 and a pitch of 2. C, The influence of two linear interpolation algorithms on SSP. SSP is wider for the 360-degree LI, resulting in a loss of image quality.
Dose Comparison
During the early development and use of spiral/helical CT, it was thought that the dose would be higher simply from volume data acquisition. Comparison studies show that the dose in conventional CT is about equal to that of spiral/helical CT.
There are several reasons why patient dose is less in SSCT than in conventional CT, as follows:
1. Tube currents in spiral/helical CT are set to lower values than in conventional CT.
2. Spiral/helical CT largely eliminates the need to retake single scans.
3. Spiral/helical CT arbitrarily calculates overlapping images from one spiral scan without renewed exposure, whereas conventional CT must take many overlapping images to obtain high display quality.
4. Unlike contiguous scanning, spiral/helical CT can reduce patient dose by using pitch values >1 (Kalender, 1994b).
The effective doses from spiral/helical CT for the head, chest, abdomen and pelvis are 1.1, 6.7, 4.3, and 2.7 millisieverts (mSv), respectively (Kalender, 1994b). The effective dose allows the quantification of the risk from partial-body exposure on the basis of that received from an equal whole-body dose.
Huda et al (1997), for example, reported effective dose range from 1.5 to 5.3 mSv for abdominal examinations in pediatric and adult patients. To place all this in perspective, the effective dose from natural background radiation is about 2.4 mSv per year (Kalender, 1994b).
TECHNICAL APPLICATIONS OF SSCT
In addition to the routine imaging modes that generate transverse axial images, the volume scanning capability of spiral/helical CT opens new dimensions in CT imaging. The vast amount of data collected from the patient volumes, when subjected to appropriate computer processing, have created techniques such as real-time CT fluoroscopy (continuous imaging), 3D imaging, CT angiography, and virtual reality imaging or CT endoscopy.
Today these applications have become more refined and efficient, and they provide additional clinical information for the medical management of the patient. Each of these technical applications of volume CT scanning are described further in later chapters.
REFERENCES
Baker, CCT. Dictionary of mathematics. New York: Hart, 1961.
Bresler, Y, Skrabacz, C. Optimal interpolation in helical scan 3D computerized tomography. Natl Sci Found. 1993;MIP88-10412:1472–1475.
Brink, JA, et al. Helical CT: principles and technical considerations. Radiographics. 1994;14:887–893.
Bushong, S. Radiologic science for technologists, 8. Philadelphia: Mosby, 2004.
Gay, SB, Matthews, AB. Ten reasons why spiral CT is worth a million bucks. Diagn Imag. 1998:111–113. [Nov].
Huda, W, et al. An approach for the estimation of effective radiation dose in CT for pediatric patients. Radiology. 1997;203:417–422.
James G, James R, eds. Mathematics dictionary, 4, New York: Van Nostrand Reinhold, 1976.
Kalender, WA. Spiral or helical CT: right or wrong? Radiology. 1994;193:583.
Kalender, WA. Technical foundations of spiral CT. Semin Ultrasound CT MRI. 1994;15:81–89.
Kalender, WA. Principles and performance of spiral CT. In Goldman LW, Fowlkes JB, eds.: Medical CT and ultrasound: current technology and applications, College Park, Maryland: American Association of Physics in Medicine, 1995.
Kalender, WA. Computed tomography-fundamentals, system technology, image quality, applications. Erlangen: Publicis, 2005.
Kalender, WA, et al. A comparison of conventional and spiral CT: an experimental study on the detection of spherical lesions. CAT. 1994;18:167–176.
McGhee, PI, Humphreys, S. Radiation dose associated with spiral computed tomography. J Can Assoc Radiol. 1944;45:124–129.
Mori I: Computerized tomographic apparatus utilizing a radiation source, U.S. Patent No. 4630202, 1987.
Napel, SA. Basic principles of spiral CT. In: Fishman ED, Jeffrey RB, Jr., eds. Spiral CT: principles, techniques, and clinical applications. New York: Raven Press, 1995.
Silverman, PM, et al. Helical vs spiral. AJR Am J Roentgenol. 1994;162:1247.
Towers, MJ. Spiral geometries: the helix is one type of spiral. From spiral or helical CT? [letter]. AJR Am J Roentgenol. 1993;161:901.
Urban, BA, et al. Detection of focal hepatic lesions with spiral CT: comparison of 4-mm and 8-mm interscan spacing. AJR Am J Roentgenol. 1993;160:783–787.