Chapter 2 Influences on health
Overview
Chapter 1 showed that there is a wide range of meanings attached to the concept of health, and different perspectives offered by the scientific medical model and social science. It emphasized the importance of social factors in the construction and meaning of health. This chapter shows how the major influences on mortality and morbidity are social and environmental factors. It summarizes recent research which suggests that there are inequalities in health status between groups of people which reflect structural inequalities in society such as social class, gender and ethnicity.
Determinants of health
Since the decline in infectious diseases in the 19th and early 20th centuries, the major causes of sickness and death are now circulatory disease, including coronary heart disease (CHD) and stroke (36%), cancers (27%) and respiratory disease (14%) (Office of National Statistics 2007a). In the UK increased longevity and the current life span of women to 81 years and men to 76 years account for the increase in degenerative diseases in the population as a whole. Despite the increase in life expectancy, epidemiologists who study the pattern of diseases in society have found that not all groups have the same opportunities to achieve good health and there are population patterns which make it possible to predict the likelihood that people from different groups will die prematurely.
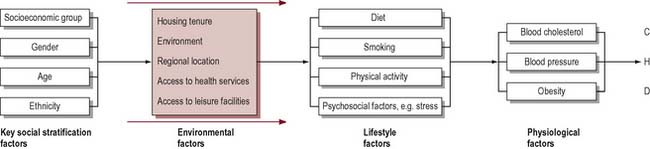
In trying to determine what affects health, social scientists and epidemiologists will seek to compare at least two variables: firstly, a measure of health, or rather ill health, such as mortality or morbidity; and, secondly, a factor such as gender or occupation that could account for the differences in health. Of course, effects on health can be due to several variables interacting together. For example, research into CHD has linked a large number of factors with the incidence of the disease: high levels of blood cholesterol, high blood pressure, obesity, cigarette smoking and low levels of physical activity. Other research indicates there may be links between CHD and psychosocial factors, such as stress and lack of social support, depression and anger (Stansfield & Marmot 2001). Many studies have also tried to establish whether there is a coronary-prone personality that is competitive, impatient and hostile (known as type A). We also know that mortality from CHD is higher among lower socioeconomic groups, among men rather than women, and among South Asians (Department of Health 2000). Figure 2.1 illustrates in a simple form how health status can be accounted for not by one variable, but by many factors interacting together. It shows that some factors have an independent effect on health or they may be mediated by other intervening variables. Whilst physical inactivity, smoking and raised blood cholesterol are the major risk factors for CHD (Britton & MacPherson 2000), it is important to look ‘upstream’ and understand the causes of these causes and their roots in the social context of people’s lives.
What is clear is that ill health does not happen by chance or through bad luck. The Lalonde report, published in Canada in 1974, was influential in identifying four fields in which health could be promoted:
Genetic factors remain largely unalterable and what limited scope there is for intervention lies in the medical field. Chapter 1 outlined McKeown & Lowe’s work (1974) which showed that medical interventions in the form of vaccination had remarkably little impact on mortality rates. This suggests that factors other than the purely biological determine health and well-being and that probably the greatest opportunities to improve health lie in the environment and individual lifestyles.
 BOX 2.1
Lifestyles are frequently the focus of health promotion interventions. Figure 2.2 shows a whole range of factors that may influence smoking behaviour. Take another of the factors implicated in coronary heart disease such as nutrition and identify the influences on that health behaviour.
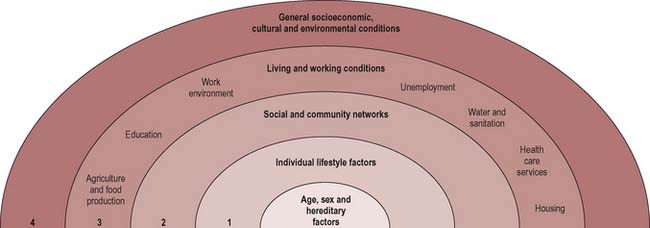
Dahlgren & Whitehead (1991) thus talk of ‘layers of influence on health’ that can be modified (Figure 2.2):
In all societies, health behaviours and physical and mental health vary between social groups. The main axes of variation include socioeconomic status, gender, ethnicity and place of residence. The specific features and pathways by which societal conditions affect health are termed the social determinants.
Social class and health
Most research which has sought to identify the major determinants of health and ill health has focused on the links between social class and health. A report was published of a Department of Health and Social Security working group on inequalities in health (Townsend & Davidson 1982). The report, which is known as the Black report, after the group’s chairman, Sir Douglas Black, provided a detailed study of the relationship between mortality and morbidity, and social class.
The terms social class, social disadvantage, socioeconomic status and occupation are often used interchangeably. The classification of social class derived from the Registrar General’s scale of five occupational classes ranging from professionals in class I to unskilled manual workers in class V. This was largely unchanged from 1921 (class III was divided into manual and non-manual work in 1971). From 2001 the National Statistics Socio-Economic Classification (NS-SEC) has been used for all official statistics and surveys (Table 2.1).
Table 2.1 Social class classification
| 1. | Higher managerial and professional |
| 1.1 | e.g. company directors, bank managers, senior civil servants |
| 1.2 | e.g. doctors, barristers and solicitors, teachers, social workers |
| 2 | Lower managerial and professional |
| e.g. nurses, actors and musicians, police, soldiers | |
| 3 | Intermediate |
| e.g. secretaries, clerks | |
| 4 | Small employers and own-account workers |
| e.g. publicans, playgroup leaders, farmers, taxi drivers | |
| 5 | Lower supervisory, craft and related occupations |
| e.g. printers, plumbers, butchers, train drivers | |
| 6 | Semi-routine occupations |
| e.g. shop assistants, traffic wardens, hairdressers | |
| 7 | Routine occupations |
| e.g. waiters, road sweepers, cleaners, couriers | |
| 8 | Never worked and long-term unemployed |
Although social class classification is not a perfect tool, it does serve as an indicator of the way of life and living standards experienced by different groups. It correlates with other aspects of social position such as income, housing, education and working and living environments.
The Black report and a later report commissioned by the Health Education Authority, The Health Divide (Whitehead 1988), found significant differences in death rates between socioeconomic classes. More recent reports (Acheson 1998) draw together data which show that, far from ill health being a matter of bad luck, health and disease are socially patterned with the more affluent members of society living longer and enjoying better health than disadvantaged social groups. Although the health of the population has steadily improved, there is still a strong relationship between socioeconomic group and health status. This is evident in life expectancy, infant mortality, causes of death, prematurity and long-standing illness.
 BOX 2.2
The extent and nature of health inequalities
Infant mortality
Causes of death
Figure 2.3 shows that there are substantial differences in life expectancy according to social class. Although infant deaths are declining, children from manual backgrounds are more likely to die in the first year of life or from accidental injury. Low birth weight is probably the most important predictor of death in the first month of life and this is clearly class-related, with two-thirds of babies under 2500 g born to mothers in social class V (Office of National Statistics 2007b). Although it is common to talk of ‘diseases of affluence’ such as CHD being the major killers in contemporary Britain, most disease categories are more common among lower socioeconomic groups. Particularly large differentials have developed for respiratory disease, lung cancer, accidents and suicide. An exception to this is death rates from breast cancer, which is evenly distributed across social groups. People from lower socioeconomic groups also experience more sickness and ill health. Measures of mental health and well-being also reflect a social gradient (Bromley et al 2005). This pattern of class and health gradient is thus visible in many ways including death rates, cause of death and reports of ill health.
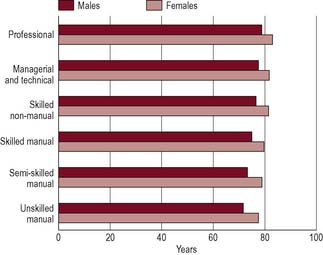
Figure 2.3 Differences in life expectancy: life expectancy at birth by social class and sex, 1997–1999, in England and Wales.
Source: National Statistics website: www.statistics.gov.uk. Crown copyright material is reproduced with the permission of the Controller Office of Public Sector Information (OPSI).
In our companion book Public Health and Health Promotion: Developing Practice (Naidoo & Wills 2005) we discuss the determinants developing practice of health in more detail.
The most immediate causes of socioeconomic inequalities in health have been summarized by Macintyre (2007) as:
The pathways by which members of different socioeconomic status groups are at risk of such exposures and vulnerabilities are often due to political and economic forces and social stratifications in society. Some of these pathways are discussed in the next section.
Income and health
In the UK better health is strongly associated with income. It is estimated that in the UK 10 million live in poverty, defined as having incomes below half the national average after allowing for housing costs (Department of Work and Pensions 2005). Those most likely to be in this category are the unemployed, pensioners, lone parents, families with three or more children and the low-paid.
Poverty can affect health directly by, for example, children not having enough to eat, eating a high-processed diet and limited access to food outlets. Across the UK dietary initiatives such as breakfast clubs, cookery clubs and community cafés promote healthy eating in low-income communities (for an example, see www.communityfoodandhealth.org.uk).
In low-income countries, infectious diseases such as diarrhoeal illness and malaria are associated with lack of income resulting in lack of access to clean water, food and medical services. Disease then further impoverishes the poor, preventing people from working and incurring high medical costs.
Housing and health
Frank Dobson, briefly Minister for Health in 1997, remarked: ‘everyone with a grain of sense knows that it’s bad for your health if you don’t have anywhere to live’. The issues of housing stock, dampness, inadequate heating and energy efficiency are recognized as key determinants of health (Department of Health 1999 paras. 4.28–4.31).
For example, there are 40 000 excess winter deaths (deaths which would not be expected if the average death rate for the rest of the year applied in winter) each year in the UK. These are attributable to:
Cold and damp housing have been shown to contribute to illness. Children living in damp houses are likely to have higher rates of respiratory illness, symptoms of infection and stress (Marsh et al 1999). These will be exacerbated by overcrowding. The high accident rates to children in social class V are associated with high-density housing where there is a lack of play space and opportunities for parental supervision. Psychological and practical difficulties accompany living in high-rise flats and isolated housing estates, which may adversely affect the health of women at home or older people.
Linda visits her GP with Alex, aged 4, who has a chronic wheeze. Linda has two other children under 7 whom she is bringing up alone on a high-rise estate which is due for demolition in the next 5 years. The flats are damp with condensation running down the walls. There has been a recent infestation of cockroaches. Linda last visited her GP 6 weeks ago for her own bronchitis. The GP told her to stop smoking.
Employment and health
Work is important to consider as a social determinant of health:
The traditional focus of occupational health has been to consider how particular types of employment carry high occupational health risks. This may be because of the risk of accidents (for example, in mining), exposure to hazardous substances or because of stress. Some occupations encourage lifestyles which may be damaging to health. Publicans, for example, are at high risk of developing cirrhosis.
Consider how the following differences between manual and non-manual occupations can influence health:
There has been considerable interest in how the psychosocial environment of work can affect health (Marmot et al 2006). Most research has identified high demands and low control over work decisions as contributing to job stress and cardiovascular risk. These factors together with the amount of social support people get at work have been confirmed in workplace studies in many developed countries (see Chapter 14 for further discussion). There is also a considerable body of evidence, mostly gathered in the 1980s, that unemployment can damage health (McLean et al 2005). It is however uncertain whether unemployment itself can lead to a deterioration in health or whether it is the poverty associated with unemployment which contributes to the poor health of the unemployed.
Consider the following evidence concerning the effects of unemployment on health. What could account for this relationship?
It seems that unemployment has a profound effect on mental health, damaging a person’s self-esteem and social structure. Part of its effect on health must also arise from the material disadvantage of living on a low income and social isolation (McLean et al 2005).
Gender and health
Gender refers to the social categorization of people as men or women, and the social meaning and beliefs about sexual difference.
What could account for the following evidence of gender differences in health?
Some of the sex differences in morbidity have been attributed as an artefact of measurement of the use of health services. Women are more likely to report illness as they are less likely to be in full-time employment and have easier access to primary care or because they are more inclined to take care of their health, resulting in increased consultation rates. However, this does not explain the sex difference in mortality. Nor is there a consistent tendency for women’s greater willingness to consult: women are no more likely than men to visit their GP for musculoskeletal, respiratory or digestive problems.
The biological explanation suggests that women are more resistant to infection and benefit from a protective effect of oestrogen, accounting for their lower mortality rates. Paradoxically, female hormones and the female reproductive system are claimed to render women more liable to physical and mental ill health. Biological explanations are unable to account for the social class difference in women’s health whereby women in professional and managerial social classes experience better health than women in lower socioeconomic groups. It is also important to note that greater female longevity only arose in the 20th century and is mostly attributable to the dramatic decline in infectious disease mortality and a decline in the number of births. It is also not evident in low-income countries.
Lifestyle explanations argue that women are socialized to be passive, dependent and sick. Women readily adopt the sick role because it fits with preconceived notions of feminine behaviour. Men, by contrast, are encouraged to be aggressive and risk-taking both at work and in their leisure time. The higher rates for accidents and alcoholism amongst men are cited as evidence for this.
Recent research is much more nuanced about gender, finding men and women in ‘masculine’ or ‘feminine’ roles and thus provides fewer easy answers to account for gender differences in health (Annandale & Hunt 2000).
Many explanations have been offered to account for women’s ill health. With which of the following do you most agree?
Finally, it has been argued that women’s social position as both carers and workers inside and increasingly outside the home is a dual burden which leads to increased stress and ill health. Some 42% of the employed workforce is female and yet women receive on average two-thirds of the male wage for equal work. Most women work part-time with less security and benefits than full-time workers, and working conditions at home and in the workplace may be hazardous, especially for poorer women in social classes IV and V (Doyal 1995). Employment outside the home does have a protective benefit for some women but this seems to be dependent on material circumstances (Arber 1990).
Health of ethnic minorities
Race is a biological marker of difference and is widely used to describe populations, e.g. ‘Asian’ or ‘Chinese’. Actually there is little variation in the genetic composition of different groups.
Ethnicity is a complex concept that is used to refer to those with a shared culture, social background, language or religion.
The Fourth National Survey of Ethnic Minorities in England and Wales (Nazroo 1997) notes:
Figure 2.4 shows the distribution of self-reported ill health amongst Black and minority ethnic groups. That particular diseases, poor perceived health or premature death is commoner in these population groups is a complex issue. In the past explanations tended to focus on simple differences in culture.
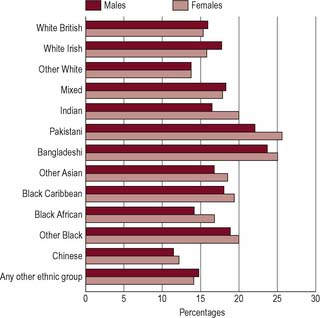
Figure 2.4 Differences in health between ethnic groups: age-standardized long-term illness by ethnic group and sex, 1997–1999, in England and Wales.
Source: National Statistics website: www.statistics.gov.uk. Crown copyright material is reproduced with the permission of the Controller Office of Public Sector Information (OPSI).
Why is coronary heart disease so common in South Asians?
In the UK the highest record rates of CHD mortality are in people born in the Indian subcontinent countries of India, Pakistan and Bangladesh (South Asians). Several factors are implicated:
The factors influencing ethnic health inequalities have been summarized by Bhopal (2007) as:
Socioeconomic factors have profound impact but it is important not to put all members of ethnic minorities into one disadvantaged category. More data would enable us to find out how many people from ethnic-minority groups are disadvantaged, and how. It would also then be possible to determine whether the poor health of black and ethnic-minority groups is associated with the low income, poor working conditions or unemployment, and poor housing shared by those in lower social classes, or whether there is, in addition, ill health resulting from other factors. Racism in service delivery, either directly or through the ethnocentrism of services which are based on the needs of the majority, is often invoked as the explanation for inequalities.
 BOX 2.9
Place and health
In the 1980s mortality rates were shown to increase steadily in the UK, moving from the south-east to the north-west, with a north–south divide present for most diseases. This seemed to be associated with poverty and disadvantage. Glasgow Shettleston, for example, has twice the average mortality rate. More recent studies have shown that there are variations within cities and regions (Dorling et al 2000). One obvious explanation for the geographic differences in death rates might be differences in social class distribution, those areas with high mortality rates being those areas with a greater proportion of people in lower socioeconomic groups. Increasingly, the effect of place on health has been seen as more complex, including not only the socioeconomic characteristics of individuals concentrated in particular places but also the local physical and social environment and the shared norms and traditions that might promote or inhibit health.
Explaining health inequalities
Inequality means a lack of uniformity, or difference. In this chapter we have noted differences in health outcomes according to gender and ethnicity. In the context of health and health care, the term inequalities is mainly used to refer to differences that arise from socioeconomic factors including income, work, housing or location of residence. Our companion volume Public Health and Health Promotion: Developing Practice (Naidoo & Wills 2005) explores these social determinants of health in more detail.
You may believe that people in the lower social classes choose more unhealthy ways of living, or you may believe that they have low incomes which prevent them adopting a healthy lifestyle and cause them to live in unhealthy conditions. There is a continuing debate over this question and no simple answer. Explanations suggested by the Black report of 1980 were of four broad types: artefact, social selection, cultural/behavioural and materialist/structural. More recently, attention has focused on psychosocial explanations and the ‘life course’ explanation that suggests that adverse environmental conditions at different points can lead to ill health.
Health inequalities as an artefact
The artefact explanation argues that the widening gap in mortality figures between the social classes is not real, but an effect of the way in which class and health are measured. Because there have been changes in the classification of occupations and in the structure of social classes, it is impossible to make comparisons over time. For example, the assignment of occupations to social classes has changed over several decades, as has the relative size of the classes. Using the old social classification, there is a much smaller proportion of the population in class V and comparisons between class I and class V over 30–50 years are not comparing similar-sized segments of the population. There may have been changes in the relative status of the classes also. The smaller class I before 1945 may be very different from the expanded class I in the 1980s when the Black report was published. It is also argued that the mortality rates of lower socioeconomic groups are skewed because, as social mobility continues, this class contains a greater proportion of older people at risk from dying.
Establishing a relationship between social class and health, particularly over time, is difficult. However, a considerable amount of research supports the view that the relationship is a real phenomenon and not merely an artefact of the data. When other indicators of disadvantage are used, such as housing, access to a car, education, household possessions and income, they all show a similar pattern of health inequalities between the top and bottom of the social scale.
Health inequalities as a selection process
Social selection theory argues that the relationship between class and health is a causal one, but that it is health which determines people’s class, and not vice versa. The healthy experience upward social mobility and mortality rates are kept low in the upper classes. People with higher levels of illness drift down the social scale and thus inflate the rates of death and disability among lower social groups. There is some evidence that health can affect social status. A study of women in Aberdeen found that those who were taller tended to marry into a higher social class. As height may be taken as an indicator of health, this evidence suggests some sort of health selection taking place at marriage (Illsley 1986). Chronic illness can also account for downward social mobility. Manual workers with failing health are often moved into other jobs because of sickness and are more likely to have difficulty finding new work.
The argument suggests that health is a static property rather than a shifting state of being which is influenced by social and economic circumstance. Thus some people, because of their genetic health potential, are able to overcome disadvantage and ‘climb out of poverty’. Although this may be true for some people, the extent of social mobility is not sufficient to account for the overall scale of social class differences in health (Wilkinson 1986).
Health inequalities as a result of lifestyles
This argument suggests that the social distribution of ill health is linked with differences in risk behaviours. These behaviours – smoking, high alcohol consumption, lack of exercise, high-fat and high-sugar diets – are more common among lower socioeconomic groups.
For example, although smoking has decreased in all social classes over the last 20 years, there are still major differences in the proportion of smokers in classes I–V, as shown in Figure 2.5.
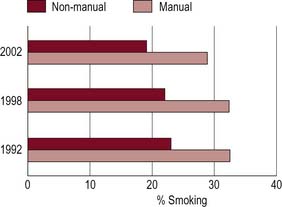
Figure 2.5 Prevalence of cigarette smoking by sex and socioeconomic group, England, 1992, 1998 and 2002.
Behaviour cannot, however, be separated from the social context in which it takes place. Graham (1992), in many studies on smoking, has shown how the decision to smoke by many working-class women is a coping strategy to deal with the stress associated with poverty and isolation. The decision to smoke is a choice but it is not taken through recklessness or ignorance; it is rather a choice between ‘health evils’ – stress versus smoking.
Smoking is the biggest single cause of the differences in death rates between rich and poor people. Which of the following comes closest to your own view?
‘Poor people bring ill health upon themselves. They don’t care about their health. If they are so poor how can they afford to smoke and drink and eat junk food?’
‘People’s use of tobacco and alcohol is to a large extent determined by their social relations and networks, which in turn affects their self-esteem and levels of stress. Tobacco offers a prop of sorts.’
Some writers claim that there are cultural differences between social groups in their attitudes towards health and protecting their health for the future. Thus giving up cigarettes, as a form of deferred gratification, is more likely to appeal to middle-class people who, as we saw in Chapter 1, may have a stronger locus of control and may believe that they determine the course of their life. Working-class people who may have to struggle to get by each day do not make long-term plans and have a fatalistic view of health, believing it to be a matter of luck. Thus attitudes are passed on from generation to generation. This phenomenon is referred to as the ‘culture of poverty’ or ‘cycle of deprivation’. According to such views, ill health can be explained in terms of the characteristics of poor people themselves and their inadequacy and incompetence. In 1986, Edwina Currie, a newly appointed health minister, caused a storm of controversy by suggesting that the high levels of premature death, permanent sickness and low birth weights in the northern regions were due to ignorance and people failing to realize that they had some control over their lives.
A behavioural explanation which sees lifestyles and cultural influences determining health has considerable appeal to any government that is concerned to reduce public expenditure. If individuals are seen as responsible for their own health, government inactivity is legitimized. Such viewpoints, which are particularly associated with neoliberal governments (see Chapter 7) have been widely criticized as victim-blaming, in that people are seen as being responsible for factors which disadvantage them but over which they have no control.
Health inequalities as a consequence of the life course
This explanation for health inequalities suggests that early life circumstances predict future morbidity and mortality rates. Parental income and education determine housing conditions, food quality and employment and thus the future socioeconomic position of the child.
There is some evidence that intrauterine conditions affect birth outcomes and low birth weight has been shown to be associated with health outcomes many years later in respect of CHD, stroke and respiratory disease.
Health inequalities as a consequence of psychosocial factors
There is a growing body of evidence demonstrating that it is relative inequalities in income and material resources, coupled with the resulting social exclusion and marginalization, which are linked to poor health (Blane et al 1996; Wilkinson 1996). The key evidence on this comes from international data on income distribution and national mortality rates. In high-income countries it is not the richest countries which have the best health but the most egalitarian, such as Sweden. Whilst the exact mechanisms linking social inequality to ill health are uncertain, it is likely that relative inequality in relation to others can provoke distrust and stress, resulting in increased risk of disease (Wilkinson 1996; Wilkinson and Marmot 2003). Healthy, egalitarian societies are more socially cohesive and have a stronger community life with greater social capital.
The quality of the social life of a society is one of the most powerful determinants of health (and this, in turn, is very closely related to the degree of income equality) (Wilkinson 1996, p. 5).
Which of the following, in your view, reflects the characteristics of life of a healthy society?
The degree to which an individual is integrated into society and has a social support network has been shown to have a significant impact on health. Research has shown that those with few friends or family are more likely to die early and less likely to survive a heart attack. Social exclusion is a term now widely used to describe those unable, usually because of low income, to participate in everyday social activities.
Health is an important dimension of social exclusion which involves not only social but also economic and psychological isolation. Although people may know what affects their health, they can find it difficult to act on what they know, setting up a downward spiral of deprivation and poor health (Department of Health 1999, p. 44).
The negative emotional experience that arises from living in an unequal society is illustrated in the Whitehall II study (Marmot 2006), a longitudinal study of civil servants and their experience of ill health. Irrespective of health behaviour, those in control of their working lives (those in higher grades) are less likely to suffer from CHD, diabetes and metabolic syndrome.
Health inequalities as a result of material disadvantage
This explanation argues that the distribution of health and ill health in the population reflects a profoundly unequal distribution of resources in society. Thus those who experience ill health are those who are lower in the social hierarchy, who are least educated, who have least money and fewest resources. Low income may be the result of unemployment or ill-paid hazardous occupations; it can lead to poor housing in polluted and unsafe environments with few opportunities to build social support networks; and in turn such conditions lead to poor health. Lack of money can make it difficult for households to implement what they may know to be healthy choices.
A common response to the evidence of health inequalities is to see it as a consequence of restricted access to services. The intention of the National Health Service – to provide a universal service freely available to all – might have been expected to reduce inequalities in health status. Yet in the early 1970s a GP writing in The Lancet put forward a radical view that good health care tends to vary inversely with the need of the population (Tudor Hart 1971).
In areas with most sickness and death, GPs have more work, larger lists, less hospital support and inherit more clinically ineffective traditions of consultation than in the healthiest areas; and the hospital doctors shoulder heavier caseloads with less staff and equipment, more obsolete buildings and suffer recurrent crises in the availability of beds and replacement of staff. These trends can be summed up as the Inverse Care Law: that the availability of good medical care tends to vary inversely with the needs of the population served (Tudor Hart 1971).
Consider the following evidence on the nature and extent of childhood accidents:
Even in the UK, where services are universally available and not dependent on the ability to pay, some groups are more adept at accessing services than others. Why is this?
There is evidence of variation in the quality and quantity of care available to people in different social groups, between regions and between different ethnic groups. However, since medical care has had little impact on the overall death rate from heart disease or cancers, and probably only about 5% of deaths are preventable through medical treatment, it must be concluded that differences in health status are not wholly attributable to variations in the amount and type of care received.
Tackling inequalities in health
Life expectancy, health and health-related behaviours have shown a steady improvement over the last 50 years but there are gross inequalities in health between countries. Life expectancy at birth, for example, ranges from 34 in Sierra Leone to 81.9 in Japan (World Health Organization 2004). Within countries, too, there are inequalities. In the USA Native Americans from South Dakota can expect to live only 58 years whilst Asian-American women from New Jersey have the highest national life expectancy of 91 years (Murray et al 2005). Mortality statistics can reveal a social gradient in disease in all countries.
Such disparities are linked to chronic non-communicable diseases related principally to tobacco, alcohol, diet and obesity; to poverty; to violence; to access to health services; and to the circumstances in which people live and work.
There is also wordwide a considerable burden of non-fatal disease and, in particular, mental illness. The Ottawa Charter (World Health Organization 1986) identified key action areas.
Saving Lives: Our Healthier Nation
To achieve its aims [of improving the health of the population as a whole and improving the health of the worst-off in society and narrowing the health gap] the government is setting out its third way between the old extremes of individual victim-blaming on the one hand and nanny-state social engineering on the other …
Connected problems require joined-up solutions. This means tackling inequality which stems from poverty, poor housing, pollution, low educational standards, joblessness and low pay. Tackling inequalities generally is the best means of tackling health inequalities in particular (Department of Health 1999, pp. 5, 12).
Tackling inequalities requires both ‘upstream’ and ‘downstream’ interventions – those that create an environment in which the healthier choice is easier and those that support people to change.
Education, employment and income are the key to reducing health inequalities. Education increases employability and ability to cope with many issues. Employment provides income and thus access to health-promoting resources such as food, housing and heating. Addressing inequalities in the UK has thus included early education initiatives such as Sure Start and neighbourhood renewal programmes.
Interventions to reduce inequalities in health, e.g. in relation to diet, could address:
Although many health promoters may feel powerless to effect change at a macro structural level, it is possible to address health inequalities in planning health promotion interventions, as the above examples illustrate. One of the central tasks for health promoters is to acknowledge socioeconomic factors as crucial in determining individual and population health (Naidoo & Wills 2005).
Conclusion
Health promotion is not a purely technical activity. As we have seen, even identifying the causes of ill health will lead to political judgements being made.
Consider the following points of view about the causes of health and illness. Which comes closest to your own?
In any area of work or discipline, there will always be debate about what constitutes good practice. It is important to clarify your thinking and where you stand because it will affect your views on the purpose of health promotion and what would be appropriate health promotion activities. It is also important that you share these thoughts with colleagues and clients to reach a common understanding of the ideals upon which health promotion activities are based.
In practice, behavioural and structural explanations are often aligned to the right or left of the political spectrum, and have become linked with very different policies and approaches to health promotion. The behavioural approach, which focuses on individual lifestyles, has informed much of health education because it suggests that information, advice or mass media messages can change behaviours such as smoking or sexual activity. A structural approach, which sees health as determined by social and economic conditions, and reflecting the unequal distribution of power and resources in society, requires the health promoter to become involved in political activity.