Chapter 18 Clinical imaging in drug development
Introduction
Preclinical and clinical imaging has already made a significant contribution to drug development. Almost 30% of new molecular entities approved for neuropsychiatric indications by the FDA between 1995 and 2004 were developed with contributions from imaging (Zhang and Raichle, 2010) and there will be a growing need in drug development for information provided by imaging. New ways of thinking about clinical development are putting a premium on integration of early biology and clinical development in the context of ‘experimental medicine’.
Therapeutics development increasingly involves research that is hypothesis led, performed across levels of biological complexity (e.g. cells to the whole human), or inspired by concepts translated across species (e.g. mouse to man). Similar non-invasive imaging methods can be applied in both clinical and preclinical applications. Regulatory authorities also are putting an increasing emphasis on the need to have a deeper understanding of pharmacology and the biology of disease in approvals for new chemical entities, as well as the potential for delivering individualized therapies. The Critical Path Initiative (CPI) (www.fda.gov/ScienceResearch/SpecialTopics/CriticalPathInitiative/default.htm) sets out a strategy for transforming the way FDA-regulated products – drugs, biological products, medical devices and veterinary drugs – are developed and manufactured. Central to this is developing better evaluation methods (including specifically better imaging methods, as well as advancing genetics and bioinformatics – see also Chapter 7) and applying these to the acceleration of development of personalized medicine.
A useful way of considering how imaging tools can contribute to clinical drug development is through their roles in addressing major questions in new drug development:
1. Target validation: does the chosen therapeutic target potentially play a central role in determining the disease or symptom of interest?
2. Biodistribution: does the molecule reach the tissue of interest in potentially pharmacologically active concentrations?
3. Target interactions: does the molecule interact with the target of interest? What is the relationship between administered dose and interaction with the target?
4. Pharmacodynamics: what are the effects of the drug and how long do they last?
5. Patient stratification and personalized medicine: how can the most responsive patient population be identified for more efficient clinical trials? How can a medicine be given in the clinic to patients who will experience the greatest benefit?
This chapter will provide a brief overview of clinical imaging applications in drug development. Preclinical imaging is a larger topic, beyond the scope of this review, although reference will be made to some aspects of imaging for direct translation of pharmacological hypotheses from preclinical to clinical applications. Preclinical studies also enable the validation of innovative imaging methods that can be applied to clinical development applications.
Imaging methods
Positron emission tomography (PET)
PET imaging relies on the design and manufacture of radiolabelled ligands which can bind selectively to a target of interest with minimal non-specific binding. These ligands are most typically labelled with positron-emitting radioisotopes that decay with a relatively short half-life (Table 18.1). The short half-life allows high enough doses to be administered for a strong imaging signal without substantially increasing long-term health risks associated with the ionizing radiation.
Table 18.1 Some examples of PET radioisotopes useful in drug development applications
| Radioisotope | Half-life (min) |
|---|---|
| 15O | 2.1 |
| 11C | 20.4 |
| 68Ga | 68 |
| 18F | 109 |
PET imaging is based on the principle that emitted positrons collide with local electrons to produce pairs of photons that travel at 180° to each other and can be detected as coincident events by γ-detectors surrounding the subject. The relative positions of detection of coincident events and their precise timing enable localization of the original annihilation events for reconstruction of the spatial distribution of the radiolabelled ligand. By following the time course of the emissions (and appropriate instrument corrections) across different tissues, the rates of delivery of the radiotracer and the amount retained can be modelled.
Only microdoses of radioligands or other radiolabelled molecules need to be used; PET is exquisitely sensitive and even nanomoles of labelled material (e.g. with 11C-labelling) can be detected. However, spatial resolution is limited intrinsically by the distance over which the annihilation event occurs (and, in practice, is typically ~4 mm). The PET data can be co-registered with structural data from computed tomography (CT) or MRI images to localize the signal anatomically.
Magnetic resonance imaging (MRI)
MRI imaging conventionally relies on the interaction of the weak magnetic dipole of the hydrogen nucleus with a strong applied magnetic field varying in a well-defined way across the body. Energy in the radiofrequency range modulates this with a specific frequency that depends on the precise magnetic field at each point in the body. As most hydrogen atoms in the body are in water (or fat), the frequencies of the mix of signals detected can be used to reconstruct tissue morphology as an image. Additional information comes from the intensity and duration of the signal detected. These are determined by the concentration of hydrogen atoms (e.g. how much water or fat) and their local environment, respectively.
The effect of the environment of the hydrogen atoms is expressed as two parameters: the T1 and T2 relaxation times. Changes in the way in which the radiofrequency is applied and the signal received by the scanner, mix the relative contributions of T1 and T2 parameters to signal in different ways. This allows image contrast (grey scale variation) between different tissues (e.g. grey matter and white matter in the brain) or regions of a heterogenous tissue to be generated. Images thus allow tissue size and shape to be measured and are sensitive to the state of tissue (e.g. changing with evolution of the pathology of stroke in the brain).
The signal of blood relative to tissue can be enhanced on a T1-weighted imaged by intravenous injection of a gadolinium chelate ‘contrast agent’ that alters local relaxation properties of water in the blood. Quantitative assessments of signal change after the injection of contrast agent provides one way by which MRI can measure blood volume and flow. Leak of plasma across the vascular endothelium (e.g. with a damaged blood–brain barrier or with tumour neovascularization) can be detected as abnormal, sustained tissue signal enhancement after this contrast administration.
MRI images usually measure volumes between 1 and 5 mm3. Morphological measures can be conducted with high precision because of the high soft tissue contrast. Moreover, the method is non-ionizing and without known health risks.
Functional magnetic resonance imaging (fMRI)
fMRI is based on indirect measures of neuronal response by being sensitive to changes in relative blood oxygenation (Jezzard, 2001). Increased neuronal activity is associated with a local haemodynamic response involving both increased cerebral blood flow and blood volume. This neurovascular coupling appears to be a consequence predominantly of presynaptic neurotransmitter release and thus reflects local signalling.
The most commonly used fMRI (or pHMRI) imaging method applies blood oxygen level dependent contrast (BOLD). MRI is sensitive to changes in blood oxygenation because deoxyhaemoglobin is paramagnetic and, therefore, locally distorts the static magnetic field used for MR imaging. In the MRI magnet, the magnetic field is made highly homogeneous, but the presence of deoxyhaemoglobin leads to small magnetic field inhomogeneities around blood vessels, the magnitude of which increases with the amount of paramagnetic deoxyhaemoglobin. A relationship between neuronal activation and blood oxygenation is observed because blood flow increases with higher neuronal activity and this increase in blood flow is larger than is needed simply for increased oxygen delivery with greater tissue demands: the local oxygen extraction fraction decreases with synaptic signalling. The signal, therefore, is not a measure of blood flow directly. Note also that these signal changes are small (typically, 0.5–5% at 3T).
A typical experiment would involve acquisition of a series of brain images during infusion of a drug or over the course of a changing cognitive state (e.g. performing a visually presented working memory task vs. attending to a simple matched visual stimulus). Regions of significant signal change with drug infusion or between cognitive states then are defined by statistical analysis of the time series of signal change. Quantitative measurement of this change allows measures relevant to drug action on the brain to be defined.
Human target validation
Confidence in progression of drug development from target validation in preclinical models (e.g. by demonstration of a phenotype plausibly related to the human disease with knockout of the gene of interest) is often limited. The approach arguably is particularly problematic for chronic diseases, for diseases that are determined by the interaction of multiple biological factors and the environment and particularly for those with uniquely human phenotypes (e.g. most neurological or psychiatric disorders). This has brought an increasing interest in validation of new therapeutic targets using experimental medicine and human disease ‘models’. Imaging supports this by providing a range of methods for directly assessing molecular interactions, biochemistry and physiology in humans non-invasively. To date, most applications have been to targets for neuropsychiatric diseases.
Human models can support target validation for symptom management. For example, sleep deprivation has been used as a model for mild cognitive impairment. FMRI can be applied as a probe for physiological changes specific to sleep deprivation-associated cognitive impairment to enable assessment of any responses to a test agent interacting with the target of interest (Chuah and Chee, 2008). In this instance, the ability of fMRI to report quantitatively on physiological modulation in specific functional anatomical regions relevant both to diseases of cognitive impairment and the model (e.g. the hippocampus) adds specificity to associated behavioural measures. Modulation of impaired hippocampal activation during memory tasks after sleep deprivation by a molecule interacting with a novel target provides compelling evidence supporting validation of the target for symptomatic treatment of disorders of memory.
An alternative concept for target validation in humans involves testing for modulation of disease-related brain systems by allelic variation at candidate target loci. This approach employs structural MRI or fMRI outcomes as endophenotypes (heritable quantitative traits). For example, indirect evidence has suggested that glycogen synthase kinase-3beta (GSK3β) and canonical Wnt pathway function contribute to the molecular pathology of major depressive disorder (MDD). Brain structural changes also have been associated with MDD. To test the hypothesis that GSK3β is relevant to the disease, variations in brain grey volume were associated with GSK3β polymorphisms in a mixed population of healthy controls and MDD patients to demonstrate an interaction between genetic variation and MDD (Inkster et al., 2009). Supporting evidence for a functional association also can come from similar analyses linking brain structural variation to genetic polymorphisms related to genes encoding multiple proteins contributing to the same signalling pathway (Inkster et al., 2010).
Functional imaging methods can be used in similar ways. Patients with a history of affective disorders carrying the S allele of the common 5-HTTLPR polymorphism in the serotonin transporter gene (SLC6A4) have an exaggerated fMRI response (in the amygdala) to environmental threat relative to L allele homozygotes (Hariri et al., 2002). Other work has supported hypotheses regarding genetic variation associated with other disorders. For example, polymorphisms linked to the genes DISC1, GRM3 and COMT all have been related to imaging endophenotypes for schizophrenia and associated with altered hippocampal structure and function (Callicott et al., 2005), glutamatergic fronto-hippocampal function (Egan et al., 2004) and prefrontal dopamine responsiveness (Egan et al., 2004), respectively.
Application of functional MRI approaches that define neurobiological bases for general cognitive processes (such as in the context of psychiatric disease, motivation or reward) facilitate understanding of the general importance of targets relevant to more than one disease. For example, fMRI approaches have contributed to the current appreciation for neural mechanisms common to addictive behaviours across a wide range of substance abuse states. Studies of cue-elicited craving have defined similar activities of the mesolimbic reward circuit in a range of addictions (e.g. nicotine (David et al., 2005)). Combination of fMRI with PET receptor mapping on the same subjects has the potential to relate systems-level dysfunction directly with the molecular targets of drug therapies to further speed target validation in appropriate circumstances.
With the potential to define the relationship between in vivo molecular pathology and disease expression, the relevance of a target can be inferred more confidently in some instances than is possible based on post-mortem studies only. For example, central to current therapeutic hypotheses for schizophrenia is targeting of dopamine receptor signalling. PET imaging with a receptor-specific radiotracer allows the receptor densities and distributions to be mapped in vivo in patient and healthy control populations. Using this approach, D2/D3 binding potential values have been shown to be abnormal in schizophrenics in both striatal and extrastrial regions and to vary with age (Kegeles et al., 2010).
A limitation of the PET measure, however, is that it does not distinguish between effects of abnormal receptor availability or dopamine release (and neurotransmitter occupancy of the receptor that reduces the free receptor available for binding to the radiotracer). To more specifically test the therapeutic hypothesis that dopamine receptor antagonism is relevant to schizophrenia, dynamic changes in receptor binding potential can be studied before and after an intervention modulating dopamine release. For example, dopamine depletion leads to a larger increase in PET D2 receptor availability in patients with schizophrenia than in healthy controls, suggesting a higher synaptic dopamine concentration in the patients (Kegeles et al., 2010).
The relevance of a target to symptoms or behaviours can be validated in a similar fashion. For example, because dopamine is known to be an important mediator of the reinforcing effects of cocaine, it was hypothesized that alterations in dopamine function are involved in cocaine dependence. To validate dopamine receptor modulation as a therapeutic target for the treatment of drug dependence, pre- and postsynaptic dopamine function were characterized by assessing the receptor-specific binding of a PET radiotracer in recently detoxified cocaine-dependent subjects and related directly to drug-seeking behaviour in the same group of subjects (Martinez et al., 2007).
Biodistribution
Microdialysis can provide accurate measurements of the free concentration of a drug in the brain or other organ or direct assays of tissue uptake can be performed on biopsies or performed post mortem. However, because of its relative inaccessibility, whether a drug intended for a CNS target crosses the blood–brain barrier in sufficient amounts to be pharmacologically active can be very difficult to answer early in new drug development using conventional approaches to Phase I and IIa studies (see also Chapter 10). Confidence in extrapolation of measures directly from rodents to humans is limited (Figure 18.1). Recognized species differences in blood–brain barrier penetration are related to species-specific patterns of expression of transport enzymes, for example. PET provides the most general method for assessing distribution of a drug molecule. Imaging biodistribution can answer the question: does a molecule reach the tissue of interest in concentrations high enough to be potentially pharmacologically active?

Fig. 18.1 Species differences in blood–brain barrier penetration. A novel CNS active molecule was labelled with 11C for PET biodistribution studies in a rodent, pig and human. The studies illustrate how poorly predictive rodent studies can be regarding distribution into the human brain. The small rodent brain lies at the arrowhead. A detected signal scale (standardized uptake value or SUV) is shown to the right.
Images courtesy of the GSK Clinical Imaging Centre, London.
The principles for a PET biodistribution study are straightforward. The time course of data from the blood and tissue allow the clearance from plasma to tissue (a function of the blood flow and the tissue extraction of the molecule from the blood) to be estimated. If the tissue uptake is low, then separate estimates of the blood volume and allowance in the kinetics for the amount of the labelled molecule in the blood at any point are needed. An important caution, however, is that it is only the distribution of the positron-emitting isotope ‘label’ that is being measured with PET. Information also is needed regarding the concentration and the nature of any metabolites carrying the isotope that are generated during the imaging period and appropriate corrections made to the uptake model.
Molecules in the tissue will distribute to varying extents into tissue ‘free’ and ‘bound’ compartments. Binding can be either specific (e.g. binding to a receptor) or non-specific, reflecting, for example, lipophilic interactions or the action of non-specific uptake mechanisms. In the general case, a non-linear relationship between the relative tissue distribution of a molecule and the amount that is specifically bound is expected. To define this, a kinetic analysis of the tissue compartment signal change over time is needed, ideally with respect to another compartment in which there is similar non-specific, but no specific, binding (a ‘reference’ region).
Moreover, if the plasma free concentration of the labelled molecule is measured and it is assumed that the molecule distributes passively, measures over the time course to a steady-state distribution allow an estimation of the tissue free concentration (Slifstein and Laruelle, 2001). Defining the volume of distribution of a molecule along with measurement of the plasma free concentration allows the occupancy of a receptor (OR) to be estimated if the assumption that the in vitro and in vivo KD are equivalent, where:
The passive distribution assumption can be tested with separate, invasive preclinical experiments (ideally in a non-human primate for brain studies) exploring the relationship between plasma concentration of the molecule and the concentration in the tissue of interest as demonstrated by microdialysis.
The passive distribution model does not hold in situations in which there is high expression of active transporters for the molecule of interest, such as P-glycoprotein, at the blood–brain barrier. Evidence for transporters can be derived from demonstration of exclusion of tracer doses of the radiolabelled molecule but increasing tissue uptake with increasing plasma concentrations of the unlabelled molecule or after a transporter inhibitor is administered (Loscher and Potschka, 2005).
Reaching the tissue of interest in amounts sufficient to have a pharmacological effect is such a fundamental requirement for drug action that, if there is uncertainty, biodistribution data should be acquired at the earliest stages of new drug development. Relative biodistribution can be a factor contributing to selection of the lead molecule for development at candidate selection. Non-human primate or other preclinical studies can be performed efficiently prior to filing for registration of a labelled drug molecule as an investigational medicinal product (IMP). However, as the labelled drug molecule is used in microdoses only, toxicity testing for IMP filing can be limited to studies in a single species, allowing even human volunteer studies to progress early in a drug development programme.
While the greatest application of biodistribution studies thus far has been in the development of CNS drugs, biodistribution studies should also play an important role in optimizing anticancer drugs, as up-regulation of pumps that may exclude drugs from tumours is well described. When a pump mechanism is suspected, then the dependence of distribution on the dose of the unlabelled molecule can be explored. This approach was used to characterize the brain and tumour distribution of temozolomide, an alkylating agent used in the treatment of brain tumours. Normal brain and brain tumour temozolomide concentration profiles were estimated for different temozolomide dosing regimens. A relatively impaired plasma–tissue barrier in the tumour (presumed to be related to both breakdown of the blood–brain barrier and tumour angiogenesis) was demonstrated for the drug (Rosso et al., 2009).
There is a potential for integration of PET with conventional drug metabolism and pharmacokinetic (DMPK) radiotracer studies of new molecules, although it is not an approach that has been used widely. Subjects can be administered simultaneously both 11C and 14C-labelled molecules. The radiation burden added by the 14C molecule at radiotracer doses is small. The long half-life of 14C (5700 years) means that there is no time pressure on sample handling for the additional analyses! This potentially allows the 14C to be used to provide more detailed information on PK behaviour, which can improve modelling in the PET experiment. An alternative would be to use 13C label with GC-MS, allowing additional information on molecule absorption, distribution, metabolism and excretion (ADME) to be obtained. The value of the information can be enhanced by performing the study after administering varying pharmacological doses of the unlabelled ‘cold’ drug. However, the cost of this combined approach is high, limiting its use to specialized applications.
A creative extension of the traditional biodistribution experiment was demonstrated in use of the differential distribution of alternatively labelled molecules to provide information on drug metabolism directly from the PET experiment. The approach demands sophisticated radiochemistry, but provides an elegant reminder that what is measured by PET is the distribution of the label, not the molecule specifically. Temozolomide undergoes decarboxylation and ring opening in the 3–4 position to produce the highly reactive methyldiazonium ion that alkylates DNA. To evaluate this directly in humans, a dual radiolabelling strategy was employed in which [11C]temozolomide was radiolabelled separately both in the 3-N-methyl and 4-carbonyl positions. 11C in the C-4 position of [4-11C-carbonyl]temozolomide will be converted to [11C]CO2 and an inactive metabolite. Paired studies were performed with both forms of [11C]temozolomide in 6 patients with gliomas. A third PET scan was performed with 11C-radiolabelled bicarbonate to provide data allowing quantitative modelling of the labelled CO2 release from the independently performed temozolomide experiment. Data were obtained on activities of [11C]temozolomide and [11C]metabolites in plasma collected during scanning and [11C]CO2 was measured in the expired air. Greater amounts of [11C]CO2 in the plasma and exhaled air and lower tumour [11C]temozolomide signal with the [4-11C-carbonyl]temozolomide relative to that labelled in the 3-N-methyl position confirmed ring-opening as a mechanism for metabolic activation of temozolomide (Saleem et al., 2003).
Monoclonal antibodies and other biopharmaceuticals are becoming an increasingly important part of new therapeutics development. An increasing range of methods are available for labelling such large molecules with positron emitting isotopes in well-defined ways (van Dongen and Vosjan, 2010). Because of the much longer distribution times for these large molecules, long-lived position emitters such as 89zirconium, 64copper or 124iodine have been used. Considerable information potentially is available, but the slow approaches to steady-state and the distinct range of non-specific interactions and metabolism of these large molecules makes the conduct and interpretation of these studies more challenging than for small molecules. While promising, this area still is in an early stage of development. There are special challenges in defining a meaningful distribution for radiotracers with very high affinities (especially if the binding site availability [Bavail] also is high), as the distribution may reflect delivery (blood flow) more than the distribution of specific binding sites.
Target interaction
Does a potential drug interact with the intended target to an extent that could be pharmacologically active? What is the relationship between plasma concentrations (and, thus, administered dose) and the extent of target interaction?
Direct demonstration of interaction of a molecule with the tissue target confirms distribution into the tissue. Target interaction studies also allow estimation of relevant tissue binding of a molecule without making assumptions regarding correspondences between in vivo and in vitro measures or between human and preclinical in vivo receptor affinities.
Target interaction studies are more informative if there is a strong hypothesis concerning the degree of target interaction needed for a pharmacological effect. In such cases, data relating plasma concentration to target occupancy can guide dose selection directly. For example, for inhibitors of G-protein coupled receptors, preclinical (and clinical) studies suggest that free concentrations sufficient to provide at least 70% receptor occupancy are needed. By demonstrating the relationship between plasma concentration and target interaction, doses sufficient to achieve this degree of interaction can be defined. If this information is available before dose ranging studies, the range of doses that need to be explored is reduced, allowing the number of volunteers exposed to the experimental molecule (and cost) to be minimized at this early stage.
Target interaction studies demand availability of a radioligand that has good affinity and relative specificity for the target (Cunningham, 2005). The selected radioligand with relative target selectivity then can be used for imaging the extent of target available before and after a pharmacological dose of the molecule of interest. The ratio of the specifically bound radioligand to its free concentration (estimated from the plasma free concentration) in the tissue is termed the ‘binding potential’ (BP). The estimated BP at equilibrium is the ratio of the target availability (Bavail) relative to the radioligand dissociation constant from the receptor (Bavail/KD). With prior administration of the unlabelled (drug) molecule that binds to the same target, the measured BP varies with the local concentration and the affinity of the unlabelled molecule. Over a range of doses of the unlabelled molecule, the variation in radioligand BP thus allows binding affinity of the unlabelled molecule to be estimated. As a rule of thumb, the radiotracer BP before any drug administration should be greater than about 0.5 for sufficient signal to detect binding changes.
Estimates of in vivo BP for alternative candidate molecules for a target can provide particularly important information if there are dose limiting toxicities (Figure 18.2). In such cases, the BP measures and simultaneous measures of plasma concentration allow estimation of the pharmacologically active dose range, the upper limit of which can be related directly to the minimum dose at which adverse events are expected.
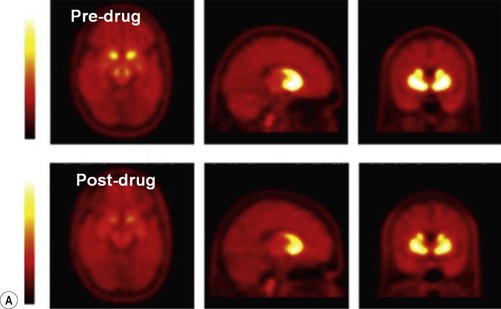
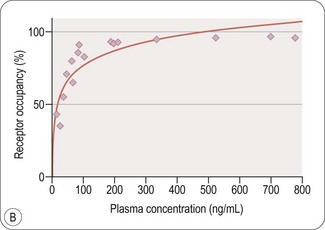
Fig. 18.2 A, Images illustrating the specific binding of a receptor-specific radioligand before and after administration of pharmacological doses of a drug targeting the same receptor binding site. The reduced specific signal on the PET scans after dosing reflects decreased receptor site availability in the presence of the drug. B, Quantitative modelling of the PET signal to measure specific binding of the radioligand as a function of plasma concentration for the drug allows the in vivo receptor affinity of the drug to be estimated.
Images courtesy of the GSK Clinical Imaging Centre, London.
PET studies are expensive and theoretically confer some additional long-term health risks for volunteers arising from the additional radiation exposure. It therefore is important to optimize the efficiency of study designs to use the smallest number of subjects and the optimal selection of doses for defining the in vivo binding affinity. In contrast to the approach with a fixed dose design, adaptive designs use information gained from each experiment to improve the selection of the subsequent dose (see also Chapter 17). Adaptive designs are well suited to PET measurements of this type, as outcomes data can be provided soon after completion of a study of any one subject to contribute to dose selection for the next. The less prior knowledge concerning dosing that is available, the greater the potential efficiency gains with adaptive designs (Zamuner et al., 2010) .
Is there ‘added value’ from human in vivo target interaction studies in drug development? In some cases, human in vivo binding potentials can be very different from those measured in vitro or in preclinical models. A histamine H3 subtype antagonist, for example, was shown to have an in vivo binding potential in humans substantially greater than that estimated on the basis of preclinical studies. This observation had a substantial impact on the related drug-development programme, as it gave a rationale and confidence for a major reduction in dosing and subsequent evaluation of doses that were well tolerated by patients. The study also highlighted unexpectedly slow receptor ‘off’ rates for the molecule, leading to a re-estimation of the optimal dosing frequency. In general, tissue PK or target interactions and plasma PK are not the same except for the limiting case of molecules with fast equilibrium binding properties that diffuse passively between the plasma and relevant tissue compartments.
Non-human primate or preclinical studies of other species can be used to estimate relevant plasma concentration-time-target interaction relationships prior to obtaining approval of IMP approval for a molecule. Potentially important information for prioritization of candidate molecules prior to selection for clinical development can be obtained in this way. Data from preclinical (especially non-human primate) studies also can establish ‘priors’ that will reduce the number of volunteers needed for estimation of the human in vivo BP.
An interesting variant of this application is to the ‘reverse engineering’ of empirically established treatments to better define factors that may be driving therapeutic efficacy. A recent example was to better understand differences in dopamine receptor subtype interactions between atypical and typical antipsychotics. PET imaging was used in baboons with [11C]PHNO to determine the binding of clozapine and haloperidol to dopaminergic D2 and D3 receptor subtypes. Scans were acquired following single doses of antipsychotic drugs and compared with baseline scans. The percent changes in binding (ΔBP(ND)) following challenges with antipsychotic drugs were measured. A regression model, based on published values of regional D2 and D3 fractions of [11C]PHNO BP(ND) in six brain regions then was used to infer the specific occupancy separately on the D2 and D3 receptors (Girgis et al., 2011).
Target interaction studies typically have been conducted with single dose studies for experimental convenience. A follow-up study, informed by the prior data, then is possible after repeat dosing to confirm dose–occupancy relationships with more chronic drug administration. However, if it is known (or can reasonably be assumed) that repeat dosing does not induce changes in receptor expression or availability, a consistent relationship between plasma concentration and target occupancy can be assumed and repeat-dose brain target occupancy can be estimated based on the basis of the combined occupancy data obtained after administration of a single dose and plasma pharmacokinetic (PK) data. The principles behind this kind of analysis were illustrated with a study of single and repeat dose target interactions for the antidepressant duloxetine. Integrated plasma concentration-time-target occupancy models were fitted to the single dose data to characterize the model parameters and then applied to an estimated repeat dose duloxetine plasma time course to predict the 5-HTT occupancy after repeat dosing (Abanades et al., 2011).
Pharmacodynamics
Imaging methods can provide information on in vivo tissue structure, physiology or biochemistry. Based on questions derived from the pharmacological hypotheses for the study, these approaches thus can be used to provide pharmacodynamic information for proof of principle or molecule differentiation. The full range of imaging methods has been – or could be – applied with the common objective of answering the question: does a molecule exert a pharmacological effect on the biological system of therapeutic interest? The potential range of applications is illustrated by some general principles and specific examples (Box 18.1).
Box 18.1
Selected applications of imaging in drug development
Early phase development
• Biodistribution studies confirming molecule reaches the target tissue and does not accumulate in non-target sites of potential toxicity
• Target PK (dose-target occupancy) measurements guiding dose selection
• Pharmacodynamic biomarkers for proof of pharmacology, stronger ‘reasons to believe’ or contributing key rationale for proof of concept
• Translational preclinical imaging to identify or validate new imaging biomarkers or provide early differentiation between candidates based on target PK or PD responses
Pharmacological studies of diseases of the brain have been a particularly important area for the development of new imaging pharmacodynamic markers, in part simply because the privileged localization of the brain limits access to tissue and the informativeness of circulating biomarkers. MRI fundamentally changed how clinical trials in multiple sclerosis (MS) were performed. An initial therapeutic goal was to limit new inflammatory lesions, which are sensitively marked by gadolinium-enhancement of T1-weighted images in the hyperacute stage and hyperintensity on T2-weighted images in the acute and chronic stages. The observation that the frequency of new gadolinium enhancement is as much as 10-fold the rate of disease relapse (Arnold and Matthews, 2002) and validation of the correlation between changes in these imaging markers and changes in relapse rate with treatments (Sormani et al., 2009) have given confidence that early phase trials with MRI endpoints for anti-inflammatory therapies can be reliably informative, demand smaller numbers of patients for meaningful endpoints and can be completed more quickly than trials with clinical outcome measures. An additional advantage of the close MRI monitoring is that adverse consequences of immune modulation also can be identified early. In such cases, the costs and complexity of serial MRI scans for the evaluation of the frequency of new enhancing lesions or the volume of T2 hyperintense lesions is well offset by the gains in trial efficiency and informativeness. Additional endpoints are now in various stages of validation, allowing specific neuropathological changes to be monitored to report on drug actions for remyelination, axonal loss or neurodegeneration, for example.
Alzheimer’s disease (AD) has been a major recent area of new research for evaluation of imaging markers in therapeutics development because of the slow rate of progression of the disease and thus long periods over which clinical measures need to be followed for meaningful outcomes. The most striking neuropathological feature of AD is the progressive brain atrophy related to neuronal dystrophy (retraction of the extensive ramification of neurites extending from the neuronal cell body) and death. This is reflected in shrinking of the cortex (and other grey matter), which leads to generalized brain atrophy. Measurement of the rate of brain atrophy provides a pharmacodynamic index related to neurodegeneration (assuming that changes in water content or the relative size of associated cell compartments, such as glia, are not significant). Robust, automated brain MRI measures of volume and volume change provide reproducible indices of the progression of disease (Smith et al., 2009). Recent interest has focused on development of similarly robust approaches for the measurement of regional brain volumes defining atrophy specifically of the hippocampus, for example, which begins in the earliest stages of the disease and progresses faster than that for the whole brain.
Pharmacodynamic biomarkers ideally should be tailored very specifically to the drug development question. For example, a number of preclinical and pilot clinical studies had suggested that peroxisome proliferator activated receptor gamma (PPAR-γ) -gamma agonism could reverse bioenergetic defects related to abnormal insulin signalling and reduced glucose uptake in AD that might be contributing to neurodegeneration. The brain has a high metabolic rate and glucose is the preferred substrate. A reduced rate of glucose utilization, particularly in the hippocampus and temporal-parietal cortex, is an early discriminant of people at risk of developing AD. The cerebral glucose metabolic rate slows progressively over time with development of the disease. Changes are also disproportionate to decreases in volume, suggesting that they represent neuronal dysfunction prior to the neuronal dystrophy or loss assessed by structural measures. Together, this prior knowledge allowed a precise pharmacodynamic hypothesis to be generated a proof of principle study of the efficacy of the PPAR-gamma agonist rosiglitazone in AD: does treatment enhance uptake of the glucose analogue [18F]-fluoro-dexoyglucose (FDG) as measured by PET and is this associated with slowing of the progressive reduction in FDG uptake expected with the natural history of the disease? A novel multi-centre FDG PET trial with 80 subjects demonstrated a trend for an improvement in FDG uptake over the first month of treatment, but provided no evidence for slowing of the progression of neurodegeneration (Tzimopoulou et al., 2010; Fig. 18.3). These data were consistent with clinical results from two large phase III trials (involving many hundreds of patients) that had been conducted in parallel. The experience highlights how directly well-selected imaging pharmacodynamic markers can be related to underlying pharmacological hypotheses. It also suggests the potential cost and trial efficiency gains that could come with optimal staging of imaging studies able to address key pharmacodynamic questions like this in a clinical development plan.
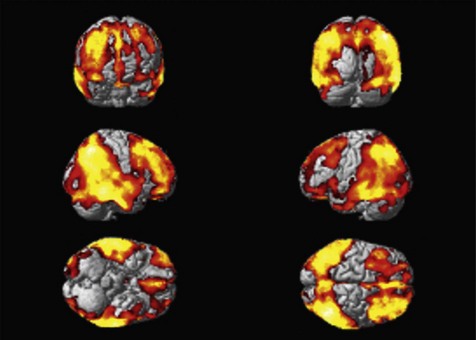
Fig. 18.3 FDG PET as an imaging biomarker for the progression of neuropathology in Alzheimer’s disease. Rendering of the location of voxels with significant decreases in glucose metabolism (red) over a 12-month period are overlaid on the surface of a reference brain (grey). Changes in the rate of decrease of brain glucose metabolism can be used as a pharmacodynamic marker for therapies intended to slow neurodegeneration (Tzimopoulou et al., 2010).
Images courtesy of the GSK Clinical Imaging Centre, London.
This is further illustrated by a recent study of treatment effects on brain amyloid deposition in AD. Genetic findings in families with familial disease have suggested that excessive or abnormal amyloid protein may be a cause of neurodegeneration in AD. This has led a number of pharmaceutical companies to develop anti-amyloid antibodies intended to provide a ‘peripheral sink’ binding amyloid and lowering the free plasma and brain amyloid concentrations. Brain amyloid deposits can be assessed by PET measures of brain binding of the radiotracer [11C]-Pittsburgh compound B (PIB), which shows a relative affinity for the beta sheet structure of the deposits. In a recent Phase IIa study, time- and dose-dependent reductions in brain PIB binding were reported with use of the amyloid binding antibody bapineuzumab (Rinne et al., 2010). Imaging in this case is molecularly specific and provides a pharmacodynamic marker. PIB PET does not report directly on the free amyloid peptide or amyloid oligomers, however, and would not necessarily provide a useful pharmacodynamic marker for a treatment addressing another, independent mechanism of genesis, expression or progression of AD. Pharmacodynamic markers – whether imaging or other kinds of biomarkers – need to be tailored to meet the demands of the specific treatment question.
Similar considerations hold for the development of therapeutics in oncology. A growing ‘toolkit’ of imaging markers for activity of biological processes commonly altered by many therapies is becoming available. For example, quantitative FDG PET provides a marker for the elevated glucose metabolism in tumours as a concern of the upregulation of glycolysis (the ‘Warburg’ effect). Changes in FDG uptake can reflect specific effects on insulin signalling and glucose uptake (e.g. of use with Akt or PI3 kinase specific inhibitors), as well as non-specific effects on glycolytic enzyme expression or cell viability. Relative cell turnover rates can be probed through assessment of the activity of the thymidine salvage pathway with [18F] fluoro-L-thymidine (FLT). Dynamic contrast enhanced (DCE) MRI uses the time course of signal change in a tumour after injection of a bolus of gadiolinium contrast into the circulation to model tissue blood volume, perfusion and the contrast agent permeability, which is increased with tumour neoangiogenesis. Pharmacodynamic effects of angiogenesis inhibitors should be reflected in these parameters.
Less specific markers also can be useful. X-ray computed tomography (CT) estimates of tumour size changes are at the basis of the current, widely accepted RECIST criteria for assessment of longitudinal changes with treatment. Several MRI markers of tumour volume, tissue microstructure or metabolism promise additional approaches (Workman et al., 2006). PET radiotracers are being developed to image hypoxic, apoptotic or dying cells or other parameters relevant to potential tissue responses.
fMRI is an emerging imaging pharmacodynamic marker for drugs that have actions – direct or indirect – on brain activity, for example, for measurement of brain activity while the symptom of interest is experienced, or during performance of tasks that engage cognitive processes putatively related to the symptom. The method is of particular interest as a way of providing an objective, neurophysiological measure of brain events related to subjective experiences such as pain. This could be of special value in patients who are unwilling or – as for those with AD – unable to report accurately. An advantage of fMRI is that similar imaging approaches can be adapted to address a broad range of pharmacodynamic questions simply by applying them in the context of different behavioural task challenges.
An emerging alternative to task-related fMRI is the use of resting state fMRI, which probes a class of functional interactions between brain regions (Zhang and Raichle, 2010). There is a continued background activity in the brain, the modulation of which is measured with task-constrained fMRI. A component of this background activity can be monitored as fMRI signal fluctuations at rest that occur at low frequencies (0.01–0.05 Hz) and show with coherent changes between widely separated brain regions. These consistent spatiotemporal coherence patterns define common activity networks that correspond functional anatomically with those engaged by task-constrained activations (Smith et al., 2009). These and related coherence measures can define drug effects (Cole et al., 2010).
Pharmacodynamic measures can be integrated with those for biodistribution to define PK-pharmacodynamic relationships directly. This innovative strategy was applied to the characterization of a novel antisense oligonucleotide strategy for tumour treatment. The antisense oligonucleotide was labelled with 11C and a PET biodistribution study performed to demonstrate its accumulation within the tumour tissue, while biochemical studies performed on samples obtained from biopsies of the same tumours were used to relate these measures to direct tests of the pharmacodynamic hypothesis (Talbot et al., 2010).
Patient stratification and personalized medicine
A critical issue in early drug development is to establish an appropriate level of confidence in the potential of a new molecule to become a therapy. One way in which this can be facilitated is by better controlling for intrinsic variations in therapeutic responses between individuals. As well demonstrated in oncology, stratification of patients based on specific disease characteristics can allow for more powerful trial designs. Consider, hypothetically, the difference in outcomes of trials first for a population in which a new molecule has a 50% treatment effect in 20% of patients (leading to a 10% net treatment effect) and then in a stratified population enriched so that 70% are responders (net 35% treatment effect). If able to predict potential responders, imaging could suggest ways of best selecting optimal patient groups for applications of new molecules. Of course, developing such a strategy is predicated on having an understanding of pharmacology sufficient to make useful guesses regarding the selection of stratification criteria.
Imaging-based stratification is already applied in clinical practice to better ensure efficacy and limit adverse outcomes, e.g. to limit surgical treatments to patients with localized neoplastic disease, or tissue plasminogen activator (tPA) therapy to patients presenting within a few hours after ischaemic stroke. Enrichment of clinical trials based on imaging indices also is well established in specific areas, e.g. enrichment of MS trial populations for active inflammatory disease by screening for gadolinium-enhancing lesions at trial entry.
There are obvious cautions to the use of enrichment or stratification methods. First, they can increase trial cost or complexity to an undesirable extent. Individual scans and the additional demands for image data management, quality control and expert support in analysis add to trial cost. The demands of research imaging in busy clinical settings can limit times for scheduling subjects in a trial, introducing constraints that make trial execution more difficult. Information sheets for volunteers and consent forms inevitably become more difficult to understand as imaging procedures and their safety concerns are explained, potentially reducing recruitment. Specialized types of imaging (e.g. PET scanning with advanced radiotracers) may be able to be performed at a very limited number of sites. A consequence can be less efficient trial design and execution. These consequences need to be factored into decisions to use imaging for stratification. Optimally efficient statistical methods able to evaluate likelihoods of causality to derive maximum utility from the data and an understanding of the clinical relevance of strategies add value. In addition, for situations where imaging metrics derived from imaging that is part of routine clinical care can be used for stratification, immediate gains may be expected.
However, the gains can be lower than might initially be expected. There are a number of reasons for this. One is that use of quantitative imaging methods demands explicit consideration of ways of controlling for inter-session or inter-site variance in measurements with a care that generally has not been needed for good diagnostic imaging. A recent report also has highlighted the possibility that a stratified population behaves differently from the general population, so that gains from the investment in stratification are reduced. In this example, modelling showed that an increase in outcome variance in a subgroup of mild cognitive impairment (MCI) patients selected according to proposed criteria significantly offset the gains expected from the population as a whole (Schneider et al., 2010).
Towards personalized medicine
Personalized medicine (PM) is an extension of the concept of stratification of patients in trials to their stratification in medical care delivery. The President’s Council of Advisors on Science and Technology (PCAST), in their September 2008 report entitled ‘Priorities for Personalized Medicine’, define ‘personalized medicine’ as ‘the tailoring of medical treatment to the individual characteristics of each patient. The intent is for treatments to be concentrated on those who will benefit, sparing expense and side effects for those who will not.’
The underlying concepts are not novel. Healthcare delivery has long relied on physiological or pathological indices, as well as their clinical assessments to optimize (personalize) the diagnosis and treatment of patients. Current efforts in PM are evaluating the use of new biomarkers (including imaging based measures) together with an understanding of both pharmacology and disease to make more rational treatment choices for individual patients. Potential applications of this approach in an imaging context would include:
• Selection of patients for a treatment based on imaging
• Dose adjustment based on imaging measures
• Identification of risks or early markers of adverse events with use of the drug based on imaging
• Using imaging to monitor treatment responses
• Selection of pre-symptomatic people with developing pathology for treatment based on imaging criteria.
PM approaches ultimately will demand a common vision from the pharmaceutical industry and regulatory agencies, and likely will be most powerfully applied when a PM strategy can be incorporated into new drug development. Treatments ultimately approved for use with imaging support will need to be able to include sufficient information in the drug label to ensure that the correct patients can be selected for treatment in routine practice. This will demand that measures are both available and able to be appropriately standardized. Instrument manufacturers and relevant professional bodies are already implementing approaches to facilitate this.
Imaging as a surrogate marker
Enthusiasts of imaging in drug development often explain the benefits of any imaging approach through its potential to become a surrogate marker for clinical treatment responses in pivotal trials. However, the instances in which this will be possible are likely to be rather limited.
The Food, Drug and Cosmetics Act is interpreted by the FDA as demanding evidence that the drug confers a clinical benefit. This establishes a clear need to acquire data for efficacy, as the usual, most meaningful clinical measures which, in general, are not expressed simply as imaging outcomes. While this does not mean that key questions cannot be addressed with primary imaging endpoints in early phase development or that imaging data may not become a general part of regulatory packages to support the therapeutic rationale, it does not suggest that primary outcomes for late phase studies will often be able to be framed as an imaging measure.
There are circumstances in which registration based on imaging markers could be possible. For example, especially if the relationship between amyloid and Alzheimer’s disease becomes firmly established, therapies to lower brain amyloid might be approved on the basis of PET molecular imaging markers of brain amyloid.
This and other special situations in which imaging may provide a primary outcome measure may be considered within the provisions of subpart H, 21 CFR 314.50 of the Accelerated Approval Provision, which allows approval on the basis of a surrogate marker likely to predict clinical benefit. However, a central tenet of this regulation is that it is applied in a situation in which there is an ‘inability’ to assess a clinical outcome with a feasible trial. Applications to the evaluation of treatments for rare diseases with known pathophysiological mechanisms, for which there are well established imaging markers, may be the most obvious areas for immediate application, e.g. in rare storage disorders such as adrenomyeloneuropathy.
Even in such situations, for the first agent in a new therapeutic class, the use of imaging markers is unlikely to meet generally acceptable criteria as a measure of efficacy. The most obvious example of how such an approach would be developed would be to follow imaging observational studies of the disease and validation of the biomarker against usual measures of progression or even against a ‘gold standard’ intervention. However, a simple correlation between the natural history of progression and a measure will not establish predictive likelihood in the context of a new treatment. Even validation against a ‘gold standard’ treatment does not establish the general relationship because of the potential for multiple mechanisms or therapeutic effects other than those originally postulated.
Imaging in the real world – challenges to implementation
As with any aspect of trial conduct, conceptually elegant, robust implementation of clinical imaging in the context of a new drug trial brings substantial challenges. While imaging markers can have a high statistical power in some pharmacological applications, the measures are quantitative, continuous and often dependent on multiple factors. Controlling for variance in data between sites or even between examinations at a single site can be demanding. Reasonable prior estimates of the expected treatment effect size and the reproducibility of measures is needed to estimate the potential study power. Progression of over-powered studies incorporating complex and expensive outcomes will be not be sustainable.
In general, studies with designs based on reproducibility of measures within a single site can substantially underestimate true variance. For example, structural measures based on MRI are dependent on the homogeneity and linearity of the MR gradients, which can vary between instruments and installations of even the same instruments. Fortunately, considerable effort has been expended in standardizing measurements (Boellaard et al., 2008; Friedman and Glover, 2006; Stocker et al., 2005). In analogous ways, the sensitivity of PET scanners varies. In both cases, calibrations with standard phantoms used across sites can be used to minimize variances. Even so, instrument or site bias in measurements can be introduced in many ways, e.g. differences in radiofrequency coil coupling for MRI, detection mode for PET scanners or injection timing for radiopharmaceuticals or contrast agents. Analysis of results allowing for confounding of site-to-site variation helps to ensure that site bias can be recognized and optimally accounted for.
More fundamentally, introduction of more sophisticated imaging endpoints can limit the availability sites. Training on specialized techniques may not be accessible widely, e.g. cardiac MRI demands cardiologist and radiographer training and ongoing experience to maintain skills if it is to be performed well. Some methods may be implemented only at institutions with relevant research interests. PET methods relying on molecular probes other than the few that are obtainable commercially are only available at a limited number of sites and shorter-lived isotopes (e.g., for [11C] PET radiotracers) can only be used where there are radiopharmaceutical manufacturing facilities and a cyclotron are accessible on site.
The outcomes from many methods depend on precisely how they are implemented. Consensus criteria have been developed to minimize site variation in DCE-MRI measures, for example (Leach et al., 2003). Analytical techniques can be designed that are relatively robust to many aspects of patient or site variability. The issues have been discussed before in different contexts, e.g. for precision in the assessment of brain atrophy rates or dynamic changes in FDG measures of brain glucose utilization in AD (Smith et al., 2002; Tzimopoulou et al., 2010).
Imaging approaches are variably complex (or can confer additional health risks) for patients or volunteers. These factors limit volunteer interest and complicate recruitment. MRI studies can be as short as 7–10 min (e.g. a whole body scan for fat-water assessment) or less, but multi-sequence studies demand cooperation for periods of 30–60 min in what to the volunteers may be the alien environment of the high field magnet bore and with the sometimes distressing noise from the MR gradients. Prior familiarization of subjects with both the magnet and the noise, and attentive support from staff, can reduce complaints of claustrophobia and increase tolerance of more extended procedures. Contrast or radiopharmaceutical injections demand placement of intravenous catheters, so are not strictly non-invasive. While intravenous catheters are generally well tolerated, the intra-arterial (typically placed in the radial artery) cannulation needed for serial blood sampling to allow accurate estimation of the input function for fully quantitative PET can be uncomfortable. Finally, all of the imaging methods using ionizing radiation carry some estimated additional health risks for subjects. It is important, therefore, to minimize demands on volunteers to those strictly needed to answer the question(s) of interest and to ensure that the procedures and risks are explained well, that procedures are optimized to give subjects the best experience possible, and that they are conducted by highly trained staff to minimize risk or discomfort.
Some kinds of clinical studies for drug development already are incorporating imaging routinely to provide data for development decisions because of the demands of usual clinical care delivery or the need for imaging-based safety readouts. For these, the extra care in site setup and data analysis needed for quantitative imaging endpoints may add minimally to either trial cost or complexity. However, in other instances, imaging endpoints typically add substantially to cost and trial complexity and can make recruitment more difficult. Feasibility of the design of any imaging supported clinical trial needs to be carefully explored with potential trial sites. Sometimes, relatively small issues – such as the extra time needed in the clinical centre for a full imaging examination – add so much to the burden of the trial for patients communicating into a research centre, that recruitment within desired time frames is not possible. It is important, therefore, that the value of the imaging outcome is high, commensurate with these direct and indirect costs. In the planning stage, designs and development plans that do not rely on imaging need to be considered to balance the information available with respect to both ease of implementation by the sites and participation by volunteers.
Imaging supported clinical drug development is still an immature field and experience is limited. Validation of methods in the context of novel targets or classes of therapeutic molecules is even more limited. Potential applications need to be anticipated sufficiently and investments made well in advance of need if imaging is to be applied most powerfully in these contexts. This is most easily illustrated by considering molecular imaging markers. Biodistribution studies demand the site-specific labelling and quantitative modelling of the distribution of signal in the tissues of interest. Implementation demands evaluation of labelling feasibility under the constraints of automated or semi-automated radiochemical methods, tailored for the appropriate half-life and the development and validation of the specific radiopharmaceutical and metabolite quantitative analysis methods for the radiotracer of interest. While timelines are highly variable and depend on both the molecule and on particular capabilities of the imaging centre, typical estimates from our site with recent molecules suggest that even an optimal progression timeline demands at least 3–4 months for feasibility to be established, and 3 months for validation of a novel-labelled molecule. Thus, the decision to incorporate a PET biodistribution study needs to be made well in advance of the need for information. Fortunately, as a microdosing experiment, this planning can be done and implementation completed as one of the earliest experiments in the sequence of clinical development studies.
Target occupancy studies are more demanding, especially if a radioligand suitable for use as a reporter for the target needs to be developed. Radioligand development is as challenging as the first stages of any drug development programme, as affinity and specificity need to be balanced for the molecule. Candidate radioligands show high attrition along the course of development and validation. Limiting non-specific binding is a particular challenge. In general, useful radioligands should be lipophilic enough to diffuse well between tissue compartments without being so lipophilic that they accumulate in fatty tissues to a substantial extent. However, recent advances in a design based biomathematical modelling approaches (Guo et al., 2009) and the great potential for radioligand development to benefit from medicinal chemistry experience in the syntheses of related drug candidates suggest that there are substantial opportunities for more efficient development in the future.
Pharmacological fMRI offers the advantages of a potentially general marker for brain pharmacodynamic studies and has been used for a broad range of applications in healthy volunteers and patients. However, major challenges to the meaningful quantitative interpretations of pHMRI measures remain. First, the relationship of blood flow changes with altered presynaptic activity depends on the physiological (and, potentially, pharmacological) context. Even the direction of changes in relative activation in pathological states may be difficult to interpret precisely. For example, reduced activation in the aging brain may reflect either brain functional impairment or improved efficiency. Experimental designs need to accommodate this, for example by studying dose–response relations and behavioural correlates in individual studies. Additionally, BOLD signal changes arising from any direct (or indirect, e.g. with changes in ventilation rate (Wise et al., 2004)) need to be controlled. Nonetheless, experience has shown that fMRI provides pharmacologically discriminative measures (Matthews, 2009) and that studies can be implemented across multiple sites and the resulting data meaningfully integrated (Bosnell et al., 2008).
Future methodological developments promise to make fMRI even more informative. Computational advances already allow robust analyses in real time. In the context of pHMRI, this could enable improved quality control during an examination or more precise tailoring of the protocol to the question being asked about an individual patient. Some limitations to interpretation of the BOLD response can also be addressed with use of complementary forms of MRI contrast or through the integration of BOLD MRI and other measures in simultaneous data acquisition. For example, direct measures of brain blood flow can be made using non-invasive ‘arterial spin labelling’ (ASL) MRI methods which have greater stability over time for better assessment of slow (of the order of a minute or more) changes in brain responses now can be implemented robustly (Xie et al., 2010). With care for safety issues and correction of the artefacts induced by the shifting magnetic field gradients used for MRI, high-quality EEG now can be obtained simultaneously during an fMRI examination (Lemieux, 2004), allowing simultaneous pHMRI and pharmaco-EEG studies. Variance in measures can be reduced by correcting for variations in pCO2 across the ventilatory cycle (Wise et al., 2004). In the near future, advances in positron detection methods should support commercial availability of combined human PET/MRI scanners that will allow integrated experiments examining target occupancy and pharmacodynamics (Herzog et al., 2010).
Summary
Clinical imaging has an important role in drug development. The utility already has been well demonstrated in several applications reviewed here. It can facilitate more seamless transitions from preclinical to clinical development. Imaging also will facilitate answering critical questions earlier in development and directly with human studies, adding to confidence in decision-making. While implementation of imaging-supported protocols can add to trial complexity and cost per patient, where imaging has greater sensitivity, the gains can translate into smaller numbers of subjects in trials. This would have a particularly large impact on the potential to pursue studies for rare diseases for which it may be possible to recruit only small numbers of subjects or for highly stratified populations amongst even prevalent diseases for which PM is sought.
There now is an opportunity to substantially extend the range of situations in which, and the extent to which, imaging is used in clinical drug development. However, optimal use will demand the development of preclinical and clinical imaging strategies to support molecule development from the earliest stages of programme planning to ensure that methods are validated and ready to be implemented as critical decision points in projects are being approached. Wider use in development should catalyse new applications for imaging-based PM to better ensure that the right medicine is used by the right patient.
Acknowledgments
The author would like to thank his colleagues in the GSK Clinical Imaging Centre for their substantial contributions to the ideas that have developed into this chapter. He also wishes to thank Mrs Rachel Green for careful editorial assistance.
Abanades S, van der Aart J, Barletta JA, et al. Prediction of repeat-dose occupancy from single-dose data: characterisation of the relationship between plasma pharmacokinetics and brain target occupancy. Journal of Cerebral Blood Flow and Metabolism. 2011;31:944–952. Epub Oct 13 2010
Arnold DL, Matthews PM. MRI in the diagnosis and management of multiple sclerosis. Neurology. 58, 2002. S23–31
Boellaard R, Oyen WJ, Hoekstra CJ, et al. The Netherlands protocol for standardisation and quantification of FDG whole body PET studies in multi-centre trials. European Journal of Nuclear Medicine and Molecular Imaging. 2008;35:2320–2333.
Bosnell R, Wegner C, Kincses ZT, et al. Reproducibility of fMRI in the clinical setting: implications for trial designs. Neuroimage. 2008;42:603–610.
Callicott JH, Straub RE, Pezawas L, et al. Variation in DISC1 affects hippocampal structure and function and increases risk for schizophrenia. Proceedings of the National Academy of Sciences of the USA. 2005;102:8627–8632.
Chuah LY, Chee MW. Cholinergic augmentation modulates visual task performance in sleep-deprived young adults. Journal of Neuroscience. 2008;28:11369–11377.
Cole DM, Beckmann CF, Long CJ, et al. Nicotine replacement in abstinent smokers improves cognitive withdrawal symptoms with modulation of resting brain network dynamics. Neuroimage. 2010;52:590–599.
Cunningham VJ, Parker CA, Rabiner EA, et al. PET studies in drug development: methodological considerations. Drug Discovery Today: Technologies. 2005;2:311–315.
David SP, Munafo MR, Johansen-Berg H, et al. Ventral striatum/nucleus accumbens activation to smoking-related pictorial cues in smokers and nonsmokers: a functional magnetic resonance imaging study. Biology and Psychiatry. 2005;58:488–494.
Egan MF, Straub RE, Goldberg TE, et al. Variation in GRM3 affects cognition, prefrontal glutamate, and risk for schizophrenia. Proceedings of the National Academy of Sciences of the USA. 2004;101:12604–12609.
Friedman L, Glover GH. Report on a multicenter fMRI quality assurance protocol. Journal of Magnetic Resonance Imaging. 2006;23:827–839.
Girgis R, Xu X, Miyake N, et al. In vivo binding of antipsychotics to D(3) and D(2) receptors: a PET study in baboons with [(11)C]-(+)-PHNO. Neuropsychopharmacology. 2011;36:887–895. Epub Dec 22 2010
Guo Q, Brady M, Gunn RN. A biomathematical modeling approach to central nervous system radioligand discovery and development. Journal of Nuclear Medicine. 2009;50:1715–1723.
Hariri AR, Mattay VS, Tessitore A, et al. Serotonin transporter genetic variation and the response of the human amygdala. Science. 2002;297:400–403.
Herzog H, Pietrzyk U, Shah NJ, et al. The current state, challenges and perspectives of MR-PET. Neuroimage. 2010;49:2072–2082.
Inkster B, Nichols TE, Saemann PG, et al. Association of GSK3beta polymorphisms with brain structural changes in major depressive disorder. Archives of General Psychiatry. 2009;66:721–728.
Inkster B, Nichols TE, Saemann PG, et al. Pathway-based approaches to imaging genetics association studies: Wnt signaling, GSK3beta substrates and major depression. Neuroimage. 2010;53:908–917.
Jezzard P, Matthews PM, Smith S. Functional magnetic resonance imaging: methods for neuroscience. Oxford: Oxford University Press; 2001.
Kegeles LS, Abi-Dargham A, Frankle WG, et al. Increased synaptic dopamine function in associative regions of the striatum in schizophrenia. Archives of General Psychiatry. 2010;67:231–239.
Leach MO, Brindle KM, Evelhoch JL, et al. Assessment of antiangiogenic and antivascular therapeutics using MRI: recommendations for appropriate methodology for clinical trials. British Journal of Radiology. 1(76 Spec No), 2003. S87-91
Lemieux L. Electroencephalography-correlated functional MR imaging studies of epileptic activity. Neuroimaging Clinics of North America. 2004;14:487–506.
Loscher W, Potschka H. Role of drug efflux transporters in the brain for drug disposition and treatment of brain diseases. Progress in Neurobiology. 2005;76:22–76.
Martinez D, Narendran R, Foltin RW, et al. Amphetamine-induced dopamine release: markedly blunted in cocaine dependence and predictive of the choice to self-administer cocaine. American Journal of Psychiatry. 2007;164:622–629.
Matthews PM, Filippi M. Pharmacological applications of fMRI. In: fMRI Techniques and Protocols. Heidelberg and New York: Springer-Verlag; 2009.
Rinne JO, Brooks DJ, Rossor MN, et al. 11C-PiB PET assessment of change in fibrillar amyloid-beta load in patients with Alzheimer’s disease treated with bapineuzumab: a phase 2, double-blind, placebo-controlled, ascending-dose study. Lancet Neurology. 2010;9:363–372.
Rosso L, Brock CS, Gallo JM, et al. A new model for prediction of drug distribution in tumor and normal tissues: pharmacokinetics of temozolomide in glioma patients. Cancer Research. 2009;69:120–127.
Saleem A, Brown GD, Brady F, et al. Metabolic activation of temozolomide measured in vivo using positron emission tomography. Cancer Research. 2003;63:2409–2415.
Schneider LS, Kennedy RE, Cutter GR. Requiring an amyloid-beta1-42 biomarker for prodromal Alzheimer’s disease or mild cognitive impairment does not lead to more efficient clinical trials. Alzheimers and Dementia. 2010;6:367–377.
Slifstein M, Laruelle M. Models and methods for derivation of in vivo neuroreceptor parameters with PET and SPECT reversible radiotracers. Nuclear Medicine and Biology. 2001;28:595–608.
Smith SM, Zhang Y, Jenkinson M, et al. Accurate, robust, and automated longitudinal and cross-sectional brain change analysis. Neuroimage. 2002;17:479–489.
Smith SM, Fox PT, Miller KL, et al. Correspondence of the brain’s functional architecture during activation and rest. Proceedings of the National Academy of Sciences of the USA. 2009;106:13040–13045.
Sormani MP, Bonzano L, Roccatagliata L, et al. Magnetic resonance imaging as a potential surrogate for relapses in multiple sclerosis: a meta-analytic approach. Annals in Neurology. 2009;65:268–275.
Stocker T, Schneider F, Klein M, et al. Automated quality assurance routines for fMRI data applied to a multicenter study. Human Brain Mapping. 2005;25:237–246.
Talbot DC, Ranson M, Davies J, et al. Tumor survivin is downregulated by the antisense oligonucleotide LY2181308: a proof-of-concept, first-in-human dose study. Clinical Cancer Research. 2010;16:6150–6158.
Tzimopoulou S, Cunningham VJ, Nichols TE, et al. A multi-center randomized proof-of-concept clinical trial applying [(1)F]FDG-PET for evaluation of metabolic therapy with rosiglitazone XR in mild to moderate Alzheimer’s disease. Journal of Alzheimer’s Disease. 2010;22:1241–1256.
van Dongen GA, Vosjan MJ. Immuno-positron emission tomography: shedding light on clinical antibody therapy. Cancer Biotherapy and Radiopharmaceuticals. 2010;25:375–385.
Wise RG, Ide K, Poulin MJ, et al. Resting fluctuations in arterial carbon dioxide induce significant low frequency variations in BOLD signal. Neuroimage. 2004;21:1652–1664.
Workman P, Aboagye EO, Chung YL, et al. Minimally invasive pharmacokinetic and pharmacodynamic technologies in hypothesis-testing clinical trials of innovative therapies. Journal of the National Cancer Institute. 2006;98:580–598.
Xie J, Clare S, Gallichan D, et al. Real-time adaptive sequential design for optimal acquisition of arterial spin labeling MRI data. Magnetic Resonance in Medicine. 2010;64:203–210.
Zamuner S, Di Iorio VL, Nyberg J, et al. Adaptive-optimal design in PET occupancy studies. Clinical Pharmacology and Therapeutics. 2010;87:563–571.
Zhang D, Raichle ME. Disease and the brain’s dark energy. Nature Reviews. Neurology. 2010;6:15–28.