6 The orthodontic patient
examination and diagnosis
Successful orthodontic treatment begins with the correct diagnosis, which involves patient interview, examination and the collection of appropriate records. At the end of this process, the orthodontist should have assimilated a comprehensive database for each patient, from which the appropriate treatment plan can be formulated. Examination and record collection are discussed in this chapter, whilst treatment planning is the subject of Chapter 7.
Patient’s complaint and motivation
The demand for orthodontic treatment is primarily patient-driven and one of the most important components of an examination is the initial interview with the patient and their parent or guardian. It is important to ascertain what their main concerns are and the expectations of treatment. Over the past two decades there has been an increasing uptake in orthodontic treatment, with a greater awareness and demand for improved dental and facial aesthetics. Unfortunately this does not always accompany an appreciation of what orthodontic treatment involves (Tulloch et al, 1984). It can also be the case that the patient has no particular concerns regarding his/her dentition and it is the parent or dentist who has requested the consultation, which may make the acceptance of orthodontic treatment more difficult to obtain.
Dental history
Patients being considered for orthodontic treatment should be in good dental health and under the care of a general dental practitioner. It is important that the orthodontist and dental practitioner have a good working relationship because the orthodontist may often need to work closely with the dentist in a number of circumstances:
The general dental practitioner should be fully aware of the orthodontic treatment goals and good communication between the orthodontist, patient and dentist is therefore essential.
Medical history
A number of medical conditions may impact upon the provision of orthodontic treatment:
Infective endocarditis
Infective endocarditis (IE) is a serious condition characterized by colonization or invasion of the heart valves or mural endocardium by a microbiological agent, following a transient entry into the bloodstream (bacteraemia). A number of factors can put a patient at high risk of developing an endocarditis:
A number of invasive medical procedures have been causally associated with bacteraemia and endocarditis in susceptible patients and these include dental treatment. The British Society for Antimicrobial Chemotherapy previously recommended the use of antibiotic prophylaxis for any form of dentogingival manipulation in high-risk patients. These recommendations have now changed in the UK.
The National Institute of Health and Clinical Excellence (NICE) now advise that antibiotics to prevent IE should not be given to adults and children with structural cardiac defects at risk of IE who are undergoing dental interventional procedures and this includes orthodontic treatment. According to NICE, current evidence suggests that such antibiotic prophylaxis is not cost effective and may lead to a greater number of deaths through fatal anaphylactic reactions than from not using preventive antibiotics.
Bleeding disorders
Severe bleeding disorders such as haemophilia A do not contraindicate orthodontic treatment, but factor transfusion will be required to achieve haemostasis if dental extractions are necessary. Any risks of potential bleeding in the oral cavity during orthodontic treatment can be kept to a minimum by:
These minor intraoral bleeds are an irritation to most patients, but can be a serious problem in this group. The orthodontist should also be aware of the increased risk of these patients being carriers for hepatitis or the human immunodeficiency virus (HIV).
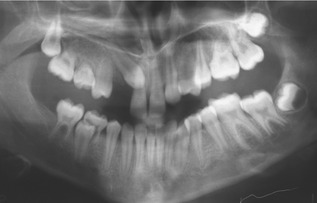
Childhood malignancy
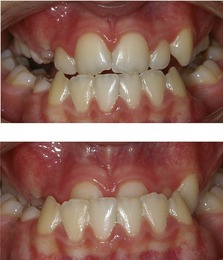
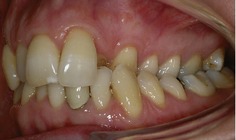
The commonest malignancies in childhood are the leukaemias, and amongst these, acute lymphoblastic leukaemia accounts for around 80% of cases. This condition mostly occurs in early childhood, before orthodontic treatment is routinely carried out. Treatment for a variety of malignancies in children often involves the use of radiotherapy, which can affect the tooth-bearing tissues. This may result in tooth agenesis and root shortening (Fig. 6.1). Orthodontic treatment should be delayed for these patients until they are in a period of remission and if diagnosis occurs during orthodontic treatment it is usually advisable to suspend treatment and remove the appliances. For patients with severe root shortening orthodontic treatment is contraindicated.
Diabetes
Patients with insulin-dependent diabetes are more susceptible to periodontal disease and therefore excellent oral hygiene accompanied by regular periodontal maintenance is essential during orthodontic treatment.
Immunosuppression
Immunosuppressant drugs such as cyclosporin, which are routinely used in transplant patients to prevent rejection of the donor organ, can cause gingival hyperplasia, which can be exacerbated by orthodontic appliances. Excellent oral hygiene needs to be maintained during treatment and this can be reinforced with a chlorhexidine mouthwash. Gingivectomy of hyperplastic tissue may be necessary before or even during treatment.
Epilepsy
Removable orthodontic appliances should be avoided in the poorly controlled epileptic as there is a potential risk to the airway from displacement during seizures. These patients can also be at risk from gingival hyperplasia due to the use of certain anticonvulsant drugs; therefore a high standard of oral hygiene must be maintained during treatment.
Asthma
The regular use of steroid-based inhalers can result in oral candida infections on the palate, which can be made worse by the use of palate-covering removable appliances. Patients with autoimmune and hyper-allergenic conditions can also be more prone to root resorption during orthodontic treatment.
Allergies
A patient may present with a reported history of allergic reaction. Although many materials used in orthodontics are capable of inducing an allergic response, the most relevant are natural rubber latex and nickel.
Allergy to latex was first recognized in the 1970s and its occurrence has increased in recent years, particularly amongst healthcare workers following the universal adoption of wearing protective gloves. Latex allergy has been reported in orthodontic practice in relation to gloves and orthodontic elastics. The most common allergic response is a type IV delayed hypersensitivity reaction triggered by the chemical accelerators used in the manufacture of latex. This causes a localized contact dermatitis, typically associated with a pruritic eczematous rash. The IgE-mediated type I reaction is less common but has more serious consequences, including anaphylaxis. Amongst the general public, type I sensitivity has been estimated to occur in around 6% of the population (Ownby et al, 1996). Investigation is via skin prick testing or immunoassay. Patients with a confirmed type I allergy should be treated in a ‘latex-screened’ environment where potential exposure to any allergens is minimized. Synthetic gloves composed of vinyl or nitrile are available as an alternative to latex gloves, whilst the use of orthodontic elastomeric auxiliaries containing natural rubber latex should be avoided. Latex-free silicone elastics are available but show greater force decay and as such, require more frequent replacement.
Orthodontic wires and brackets contain nickel and nickel allergy is thought to be present in approximately 10% of Western populations and more common in females. It is usually a type IV allergic reaction related to the wearing of jewellery or watches and body piercing. Fortunately, oral reactions are rare, although prolonged exposure to nickel-containing oral appliances may increase sensitivity to nickel (Bass et al, 1993). Intraoral signs are nonspecific and have been reported to include erythema, soreness at the side of the tongue and severe gingivitis, despite good oral hygiene. Definitive diagnosis is usually achieved via patch testing. Stainless steel wires and brackets contain a relatively low proportion of nickel and are considered safe to use in a patient with diagnosed nickel allergy although titanium or cobalt chromium nickel-free brackets are available. In contrast, nickel titanium archwires have a much higher content, and should be avoided in these patients.
Extraoral examination
Assessment of the patient should begin with an examination of the facial features because orthodontic treatment can impact on the soft tissues of the face. Although a number of absolute measurements can be taken, a comprehensive facial assessment involves looking at the balance and harmony between component parts of the face and noting any areas of disharmony. Extraoral examination should start as the patient enters the room and it is important to look at the face and soft tissues both passively and in an animated state. Once in the dental chair, the patient should be asked to sit and the face examined from the front and in profile, in a position of natural head posture (Box 6.1).
Natural head posture (NHP) is the position that the patient naturally carries their head and is therefore the most relevant for assessing skeletal relationships and facial deformity. It is determined physiologically rather than anatomically and varies between individuals; however, it is relatively constant for each individual (Moorrees & Keane, 1958). As such, NHP should be used whenever possible to assess the orthodontic patient. The patient is asked to sit upright and look straight ahead to a point at eye level in the middle distance. This can be a point on the wall in front of them, or a mirror so that they look into their own eyes. Ideally NHP should also be used when taking a lateral skull radiograph, allowing the clinical examination to be related more accurately to the cephalometric data.
Frontal view
The frontal view of the face should be assessed vertically and transversely, with attention being paid to the presence of any asymmetry. In addition, the relationship of the lips within the face is examined in detail.
Vertical relationship
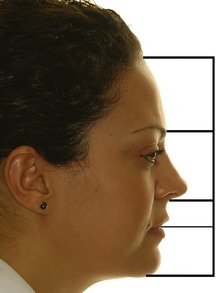
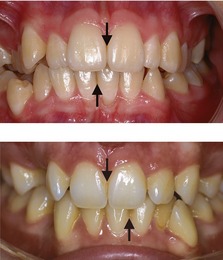
Vertically the face is split into thirds, with these dimensions being approximately equidistant. Any discrepancy in this rule of thirds will give an indication of disharmony within the facial proportions and where this lies. Of particular relevance is an increase or decrease in the lower face height. The lower third of the face can be further subdivided into thirds, with the upper lip falling into the upper third and the lower lip into the lower two-thirds (Fig. 6.2).
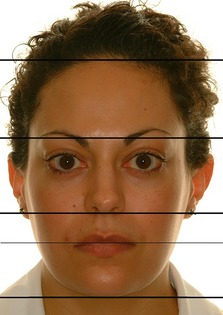
Figure 6.2 The face can be divided into thirds.
The upper face extends from the hairline or top of forehead (trichion) to the base of the forehead between the eyebrows (glabellar). The midface extends from the base of the forehead to the base of the nose (subnasale). The lower face extends from the base of the nose to the bottom of the chin (menton). The lower third of the face can be further subdivided into thirds, with the upper lip in the upper one-third and the lower lip in the lower two-thirds.
Lip relationship
The relationship of the lips should also be evaluated from the frontal view (Fig. 6.3):
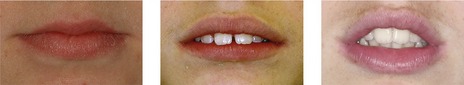
Lip incompetence is common in preadolescent children and competence increases with age due to vertical growth of the soft tissues, especially in males (Mamandras, 1988).
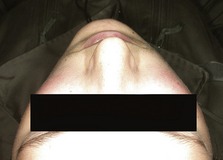
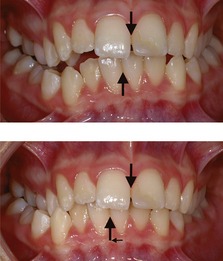
Incisor show at rest
In adolescents and young adults, 3 to 4-mm of the maxillary incisor should be displayed at rest (Fig. 6.4). In general, females tend to show more upper incisor than males, with the amount of incisor show reducing with age in both sexes. An increased incisor show is usually due to an increase in anterior maxillary dentoalveolar height or vertical maxillary excess. Occasionally it is due to a short upper lip. The average upper lip length is 22-mm in adult males and 20-mm in females.
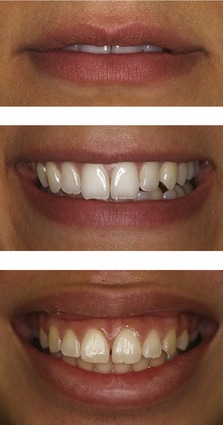
Incisor show on smiling
Ideally 75 to 100% of the maxillary incisor should be shown when smiling (Fig. 6.4), but this also reduces with age. Some gingival display is acceptable, although excessive show or a ‘gummy smile’ is considered unattractive (Fig. 6.4).
Smile aesthetics is also an important component of orthodontic treatment planning and should be formally assessed (Box 6.2).
Box 6.2 Aesthetics of the smile
During examination of an orthodontic patient the soft tissues should be assessed in animation and not just at rest. A key component of this is the smile. Smiling is an important part of communication and an unattractive smile can be a considerable social handicap, often providing a reason to seek treatment. Creating a pleasing smile is therefore a fundamental aim in orthodontics. Three principle characteristics of the smile need to be assessed (Sarver, 2001):
Pleasing gingival aesthetics. The gingival margin of the maxillary central incisors and canines are level, with the lateral incisor margin situated slightly below this. The embrasure spaces between the teeth (dotted lines) increase in size from the maxillary central incisors back. The connector areas (where the teeth appear to meet and indicated by red arrows) should be approximately 50, 40 and 30% of the maxillary central incisor crown length for the maxillary central incisors, central-lateral incisors and lateral incisors-canines, respectively (left panel). The maxillary incisor edges should also lie parallel to the curvature of the lower lip to produce a consonant smile arc (right panel) (Gill et al, 2007).
Transverse relationship and symmetry
The transverse proportions of the face should divide approximately into fifths (Fig. 6.5). No face is truly symmetrical; however, any significant facial asymmetry and the level at which it occurs should be noted. This can be done by assessing the patient from the front and also from behind and above, looking down the face (Fig. 6.6). The relative position of each dental midline to the relevant dental base should be recorded. Asymmetries of the lower face are particularly common in class III malocclusion with mandibular prognathism.
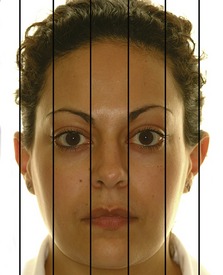
Figure 6.5 Transverse facial proportions should divide approximately into fifths (each one the width of the eye).
Mandibular asymmetry has been described as primarily of two types (Obwegeser & Makek, 1986):
Profile view
The facial profile should be assessed anteroposteriorly and vertically.
Anteroposterior relationship
An assessment should be made of the skeletal dental base relationship between the upper and lower jaws in the anteroposterior plane (Fig. 6.7). This can be achieved by mentally dropping a true vertical line down from the bridge of the nose (often called the zero meridian). The upper lip should rest on or slightly in front of this line and the chin slightly behind. Alternatively, the dental bases can be palpated labially.
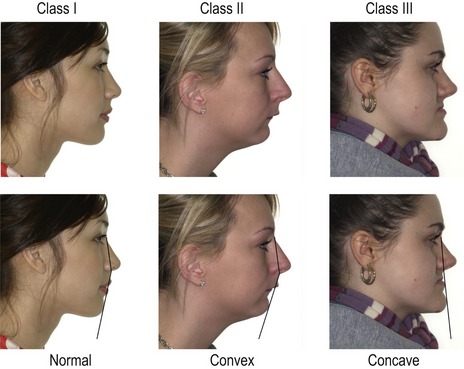
Figure 6.7 Skeletal class I (left), class II (middle) and class III (right) profiles.
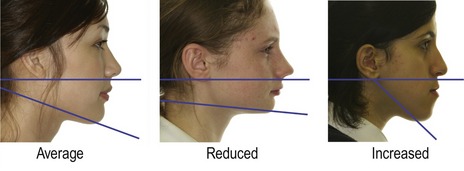
Facial convexity can also be described in relation to the angle between the upper and lower face.
An assessment can also be made of the angle between the middle and lower third of the face (Fig. 6.7), with the profile being described as:
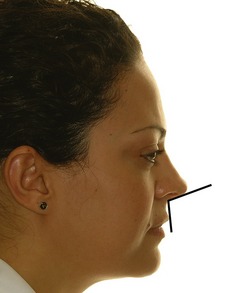
Nasolabial angle and lip protrusion
The nasolabial angle is formed between the upper lip and base of the nose (columella) and should be between 90° and 110° (Fig. 6.8). It gives an indication of upper lip drape in relation to the upper incisor position. A high or obtuse nasolabial angle implies a retrusive upper lip, whilst a low or acute angle is associated with lip protrusion.
The lips should be slightly everted at their base, with several millimetres of vermillion show at rest, although they do tend to become more retrusive with age. Protrusion of the lips varies between ethnic groups, with patients of African origin being more protrusive than Caucasians. Lip protrusion is also relative to the size and shape of the chin. Generally, lips are considered too protrusive when both are prominent and incompetent.
Vertical relationship
The face can also be divided into thirds as described earlier and direct measurements made of the facial heights (Fig. 6.9).
The angle of the lower border of the mandible to the cranium should also be assessed. This can be done by placing an index finger along the lower border and approximating where this line points. If it points to the base of the skull around the occipital region, the angle is considered average. If it points below this, the angle is reduced, whilst above it the angle is increased (Fig. 6.10). This usually, but not always, correlates with measurements made of the anterior face height.
Intraoral examination
The intraoral examination is concerned primarily with the teeth in each dental arch, in both isolation and occlusion.
Dental health
The teeth present clinically should be noted and an assessment made of the general dental condition, including the presence of untreated caries, existing restorations and the standard of oral hygiene. Evidence of previous dentoalveolar trauma, such as chipped or discoloured incisor teeth, should also be recorded. Previous trauma will warrant further investigation in the form of vitality testing and radiographs. Other pathological signs, such as erosion or attrition, should also be noted.
Dental arches
Each dental arch is assessed independently, with the mandible usually described first. The following features should be recorded for both arches:
Box 6.3 How is crowding measured?
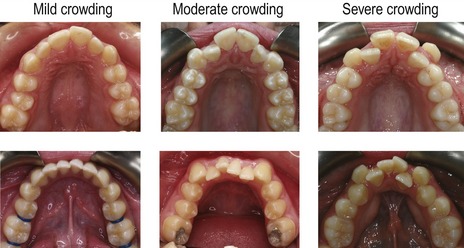
Crowding represents a discrepancy between the size of the dental arch and the size of the teeth. It is important that the degree of crowding is assessed as accurately as possible. Ideally the mesiodistal widths of the teeth in each dental arch should be measured, added together and compared to the overall size of the arch. During the initial examination this can be done in the patient’s mouth using a small metal ruler; however, a more detailed assessment can be made from the dental study casts during treatment planning. An important aspect of this process is deciding upon a suitable dental arch form. A number of ideal arch forms have been suggested in the orthodontic literature, but as a general rule the orthodontist should not attempt to change the existing arch form significantly. Generally it is best to decide on which of the incisors represents the ideal arch form for an individual patient and base the assessment of crowding upon this. It should also be borne in mind that rotations in the labial segments are a manifestation of crowding, whilst in the buccal segments they represent spacing. In general, crowding is usually described as mild (0 to 4-mm), moderate (5 to 8-mm) or severe (greater than 9-mm).
Static occlusion
When each dental arch has been assessed the patient is asked to occlude in intercuspal position (ICP) and the static occlusal relationship is recorded.
Incisor relationship
The incisor relationship is described using the British Standards Classification, but also needs to be supplemented with a description of the overjet and overbite.
Overjet
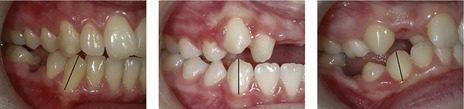
The overjet should be measured from the labial surface of the most prominent maxillary incisor to the labial surface of the mandibular incisors (Fig. 6.14). The normal range is 2 to 4-mm. If there is a reverse overjet, as can occur in a class III incisor relationship, this is also measured and given a negative value.
Figure 6.14 Occlusal variation.
Class I occlusion; reduced overjet associated with a class II division 2 incisor relationship (the buccal segment relationship is half a unit class II); increased overjet associated with a class II division 1 incisor relationship (the buccal segment relationship is a full unit class II); reverse overjet associated with a class III incisor relationship.
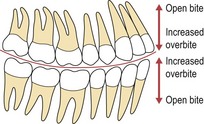
Overbite
The normal range is for the maxillary incisors to overlap the mandibular by 2 to 4-mm vertically, or one-third to one-half of their crown height (Fig. 6.15). Overbite is described as:
Figure 6.15 Variation in overbite.
Normal (upper left), reduced (upper right), increased (lower left) and anterior open bite (lower right).
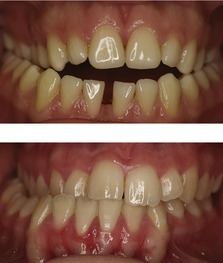
If the overbite is complete to the gingival tissues, it is described as traumatic if there is evidence of damage. This is most commonly seen on the palatal aspect of the upper incisors or labial aspect of the lower (Fig. 6.16).
Anterior crossbite
Teeth in anterior crossbite should also be noted along with the presence and size of any displacement of the mandible that may occur when closing in the retruded contact position (RCP) into the intercuspal position (ICP) (Fig. 6.17). An anterior crossbite with displacement can cause labial gingival recession associated with the lower incisors in traumatic occlusion, which if present, should be recorded.
Centrelines
Maxillary and mandibular dental centrelines are assessed in relation to the facial midline and to each other. Displacement of a centreline can be due to:
Buccal segments
The buccal segment relationship is described using the Angle classification (see Chapter 1). The molar and canine relationships should also be noted (see Fig. 6.14).
Posterior crossbite
The transverse relationship of the dental arches is described in occlusion. Crossbites are described in relation to the arch, whether they are localized or affect the whole segment of the dentition and if they occur uni- or bilaterally:
Teeth in crossbite should be recorded and any associated displacement of the mandible on closing from RCP to ICP. This can be achieved by ensuring the mandible is fully retruded by placing gentle pressure on the chin and asking the patient to put the tip of their tongue up towards the soft palate until initial occlusal contact is made on closing.
Functional occlusion
Any discrepancy between RCP and ICP should be recorded. The patient should also be asked to slide from ICP to the left and right, and the following should be detailed for each lateral excursion:
The patient should also be asked to slide the mandible forwards to check for disclusion of the posterior teeth.
Temporomandibular joint
The patient should be questioned about and examined for any signs and symptoms associated with both temporomandibular joints. These include:
Although some occlusal traits have a weak correlation with temporomandibular dysfunction, orthodontic treatment should be regarded as being neutral in relation to this condition. Treating a malocclusion is unlikely to have any long-term effect on symptoms, either positive or negative. However, a baseline record of temporomandibular joint health should be taken and any signs or symptoms should be recorded. If these represent the main complaint, they should be investigated further and managed before orthodontic treatment is considered.
Orthodontic records
Clinical orthodontic records are used primarily for diagnosis, monitoring of growth and development, and are a medico-legal requirement. They provide an accurate representation of the patient prior to orthodontic treatment, demonstrate treatment progress and allow communication between orthodontists, other healthcare professionals and the patient. Records also play an important role in research and clinical audit. It is essential that accurate clinical records are taken before commencing orthodontic treatment.
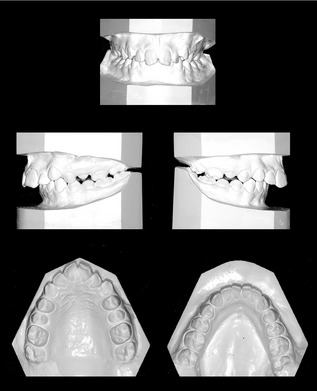
Study models
Impressions showing all the erupted teeth, full depth of the palate and good soft tissue extension are needed. These can be taken in alginate for study models and poured in dental stone (Fig. 6.23). A wax or polysiloxane bite should be taken with the teeth in ICP (Box 6.4). Orthodontic models should be trimmed with the occlusal plane parallel to the bases, so the teeth are in occlusion when the models are placed on their back. The bases are also trimmed symmetrically so the archform can be assessed and they are neat enough to be used for demonstration to the patient.
Box 6.4 Should articulated study models be used for orthodontic diagnosis?
The use of articulated study models has been advocated as a potential aid to orthodontic diagnosis and treatment planning. There is often a discrepancy between the occlusal relation in RCP and the full or habitual occlusion in ICP. Whilst a small shift is very common and not generally considered to be clinically important, larger shifts have been considered potentially damaging for both periodontal and temporomandibular joint health, although there is little substantial evidence for this. Small shifts can only be detected by articulating study models, but if these are unimportant, the value of articulation in most cases remains unproven (Ellis & Benson, 2003).
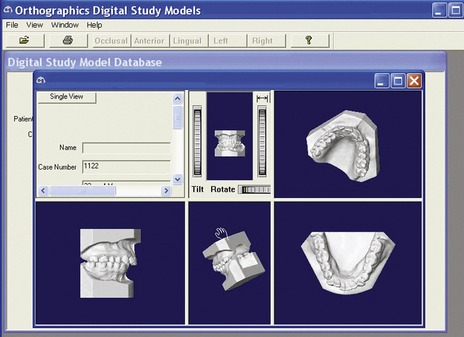
Accurate digital study casts are also now available, which have the advantages of occupying no physical storage space and having no deterioration over time, enabling indefinite storage (Fig. 6.24) (Santoro et al, 2003).
Clinical photographs
Good clinical photographs form an essential part of the clinical record. They provide a baseline record of the presenting malocclusion, are important in treatment planning especially in relation to facial and dental aesthetics, allow monitoring of treatment progress and are useful for teaching. The following views should be taken:
Radiographs
Radiographs are usually required prior to orthodontic treatment to assess:
Radiation protection
Currently in the UK, the medical use of ionizing radiation is covered by two articles of legislation, which have been in force since 2000. The Ionising Radiation Regulations (1999) are concerned primarily with the safety of workers and members of the general public; whilst the Ionising Radiation (Medical Exposure) Regulations (2000) relate to the safety and protection of the patient. This legislation is based on the three basic principles of the International Commission for Radiological Protection (ICRP) that provide the foundation for all radiation protection measures:
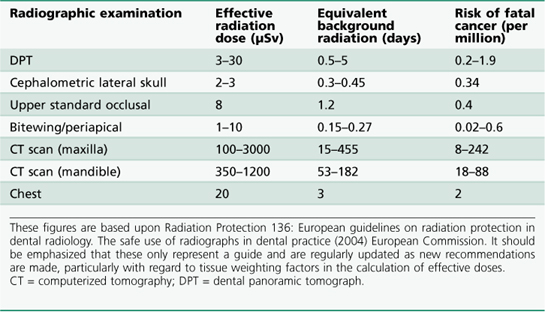
The dental practitioner is responsible for justifying the exposure of a patient to ionizing radiation and this should be based upon a defined clinical need. Once an exposure is clinically justified it should be optimized, keeping the dose as low as reasonably practicable (the ALARP principle) and maximizing the risk–benefit ratio to the patient. The main elements of this relate to the type of equipment and image receptor being used and to the use of selection criteria—the number, type and frequency of radiographs requested. Practical recommendations include using high kV equipment, fast speed film, rare earth intensifying screens or switching to digital radiography and collimating the size of the beam to the area of interest. Each view carries an estimated effective dose of radiation (Table 6.1). The effective dose for all diagnostic medical procedures is a converted whole body measurement, which takes into account the varying sensitivity of different organs and tissues to radiation and is usually measured using the Sievert (Sv) or micro-Sievert (µSv) subunit. The effective annual natural exposure to background radiation is approximately 2400 µSv and it is often easier to think of any further exposure in relation to this. To place the risks of dental radiographic exposure in context, a long haul flight to Singapore would result in an additional effective radiation dose of approximately 30 µSv, around 10 times that of a cephalometric lateral skull radiograph.
Comprehensive guidelines on how all these principles can be achieved in general dental and orthodontic practice have been published (Faculty of General Dental Practitioners UK, 2004; Isaacson et al, 2008). The fundamental principle, however, is that radiographs are only taken when clinically justified.
Routine radiographs used in orthodontic assessment
A number of radiographic views are routinely used by the orthodontist:
Dental panoramic tomograph
Panoramic radiography or, more specifically, the dental panoramic tomograph (DPT) provides a useful screen for the presence or absence, position and general health of the teeth and their supporting structures with a relatively low-radiation dose. Because these radiographs are sectional in nature, they can be unclear in some regions, particularly the labial segments where variations in the depth of the anterior focal trough for different patients can influence clarity of the incisors.
Occlusal radiographs
Occlusal radiographs are taken with the film placed on the occlusal plane and can offer greater detail in the labial segments. They are particularly useful in the maxillary arch, for assessing root form of the incisors, the presence of midline supernumerary teeth and canine position, either alone or in combination with additional views using parallax.
Periapical radiographs
Periapical radiographs are also useful for the assessment of local pathology, root form and the presence or position of unerupted teeth. They can also be used for parallax, particularly in identifying the position of maxillary canine teeth. Either two periapicals are taken, incorporating a horizontal tube shift between them; or a single periapical is taken in conjunction with another radiographic view, such as an upper standard occlusal or DPT and a vertical tube shift utilized.
Bitewing radiographs
Bitewings are useful for the accurate detection of caries, the assessment of existing restorations and periodontal status.
Cephalometric lateral skull radiograph
A cephalometric lateral skull radiograph is a specialized view of the facial skeleton and cranial base from the lateral aspect, with the head position at a specific distance from the film. The uses and analysis of cephalometric radiographs are discussed in the next section.
When to take radiographs
The need for radiographic investigation will vary according to the age of the patient and their stage of dental development, in addition to the clinical presentation. Comprehensive guidelines regarding the need for orthodontic radiographic investigation are available (Isaacson et al, 2008).
Deciduous dentition
Radiographs are not routinely indicated in the preschool child. Indications include:
Mixed dentition
Radiographic investigation during the mixed dentition is indicated with evidence of dental disease or abnormal dental development. Specific orthodontic indications include:
Permanent dentition
Radiographic investigation is indicated prior to active orthodontic tooth movement for assessing dental health and root form. This will usually consist of a panoramic view supplemented with an anterior occlusal if the incisor region is unclear, or bimolar views plus an anterior occlusal. A cephalometric lateral skull radiograph is indicated as an aid to treatment planning in the presence of a skeletal discrepancy, or when treatment is being planned in both dental arches that involves extractions and bodily movement of incisors.
Three-dimensional imaging
Plain film and cephalometric radiography are invaluable for accurate diagnosis and treatment planning, but they only provide a two-dimensional image of a three-dimensional structure, with all the associated errors of projection, landmark identification, measurement and interpretation. A number of three-dimensional imaging techniques have been developed over the past decade, which help to overcome some of these shortcomings and give the orthodontist greater information for diagnosis, treatment planning and research (Box 6.5).
Box 6.5 Three-dimensional imaging in orthodontics
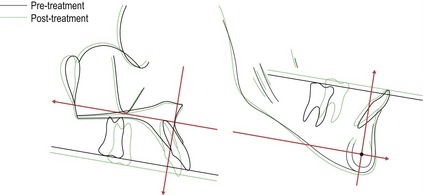
CBCT images of an impacted maxillary canine causing resorption of the central incisor (top). Soft tissue laser scan shows soft tissue facial changes following orthodontic treatment. Colours show areas of change from two superimposed scans (bottom).
The use of CBCT for exact localization of ectopic teeth, including maxillary canines has revealed much higher levels of root resorption associated with adjacent teeth than previously diagnosed from plain film radiography. Optical laser scanning offers the potential to image soft tissue changes in a safe, non-invasive and simple manner.
Imaging of the hard tissues composing the jaws and dentition using computed tomography (CT) had remained impractical until relatively recently, due to the high radiation dosage, lack of vertical resolution and cost. However, with the introduction of cone-beam computed tomography (CBCT), doses have been reduced and resolution increased, and although not yet used for routine orthodontic diagnosis, this technique is proving a very valuable tool in certain circumstances, particularly the diagnosis of impacted and ectopic teeth. It can also be very useful in airway analysis, assessment of alveolar bone height and volume prior to implant placement and imaging of temporomandibular joint morphology (Merrett et al, 2009).
Other less invasive techniques for generating three-dimensional images of the facial soft tissues have also been developed. Optical laser scanning utilizes a laser beam, which is captured by a video camera at a set distance from the laser and produces a three-dimensional image. Stereo photogrammetry involves taking two pictures of the facial region simultaneously, which creates a three-dimensional model image using sophisticated stereo triangulation algorithms. These techniques have been used to study facial growth and soft tissue changes in normal populations and following orthodontic and surgical treatment.
Cephalometric radiography
Cephalometric radiography is a specialized radiographic technique concerned with imaging the craniofacial region in a standardized and reproducible manner. A cephalometric analysis identifies defined anatomical landmarks on the film and measures the angular and linear relationships between them. This numerical assessment can provide detailed information on the relationship of skeletal, dental and soft tissue elements within the craniofacial region.
Cephalometric analysis
Cephalometric analysis relies upon the production of a standardized lateral or (less commonly) posteroanterior head film. This is achieved by using a cephalostat, which holds the mid-sagittal plane of the head at a fixed distance from both the X-ray source and film, keeping the magnification constant for every radiograph (Fig. 6.25). For a cephalometric lateral skull radiograph, the mid-sagittal plane is orientated perpendicular to the X-ray beam and parallel to the film, whilst a posteroanterior film requires the mid-sagittal plane to be parallel to the X-ray beam and perpendicular to the film. Subjects are usually orientated in natural head posture or with the Frankfort plane horizontal and teeth in RCP. Because cephalometric films are reproducible, longitudinal views of the same subject or views of different subjects can be compared with one another. However, all machines produce some magnification of the image and this can vary. For accurate comparison of linear values between radiographs taken on different machines, the in-built magnification needs to be known.
Figure 6.25 The cephalostat consists of ear rods to stabilize the position of the head, an aluminium wedge filter to reduce the intensity of X-rays that have passed through the soft tissues (and therefore improve their visibility on the film) and a film cassette holder.
The X-ray source is at a fixed distance from the cephalostat and film. In addition, the beam is collimated to reduce irradiation by exposing only those structures of interest to the orthodontist, the cranial base, facial skeleton and jaws.
Uses of cephalometrics
Cephalometric analysis can provide the orthodontist with much useful clinical information. Conventionally, this usually involves a lateral skull radiograph, but a posteroanterior film can also be useful, particularly in the diagnosis of facial asymmetry and in aiding visualization of impacted teeth. The taking of any cephalometric radiograph is not justified in all cases, particularly if only minor tooth movements are planned. A cephalometric analysis should supplement a thorough clinical examination and not attempt to replace it.
Diagnosis and treatment planning
Information on the relationship of the jaws and dentition in both the anteroposterior and vertical planes of space and their relationship with the soft tissue profile is an important factor in orthodontic diagnosis and treatment planning. A detailed analysis of the dentoskeletal relationship aids in treatment planning and determining the appropriate treatment approach.
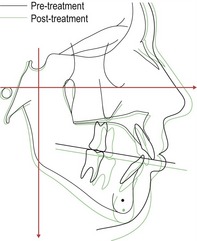
Treatment decisions should be made with the use of a prognostic tracing; whereby planned tooth and jaw movements can be simulated on a radiograph and both the effects and feasibility of such movements studied in detail. A cephalometric radiograph can also provide information regarding:
Monitoring treatment progress
A cephalometric radiograph taken during orthodontic therapy can provide information on how treatment is progressing. This allows the orthodontist to evaluate skeletal, dental and soft tissue relationships and assess what further changes will be required to produce an aesthetic and stable result. This is particularly useful for analysing the labiolingual position of the lower incisors. A cephalometric lateral skull radiograph is also essential prior to planning surgical movement of the jaws.
Research
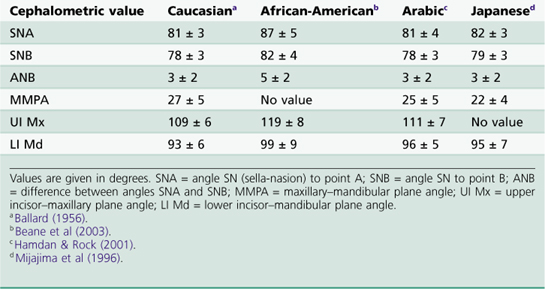
The cephalometric analysis of head films derived from a number of human populations has provided normal average values (and standard deviations) for a variety of skeletal, dentoalveolar and soft tissue relationships, which are useful for orthodontic diagnosis and treatment planning (Table 6.2).
In addition, the serial comparison of films derived from both cross-sectional and longitudinal growth studies has produced important data on:
Cephalometric analysis also forms the basis of evaluating the effects of orthodontic treatment and is still the principle method for measuring treatment response in clinical studies.
Growth prediction
A number of workers have suggested that certain discreet features can be identified on a cephalometric lateral skull radiograph and used to predict the pattern of future jaw growth. There is little substantial evidence for this and the taking of such radiographs on the basis of growth prediction alone cannot be justified. A more accurate assessment of growth can be made from serial lateral skull radiographs taken approximately one year apart. These can be especially useful in those patients who present with a class III malocclusion; treatment decisions are delayed until the direction and extent of the growth discrepancy between the jaws can be determined.
Tracing a lateral skull cephalometric radiograph
A lateral skull radiograph should be hand-traced in a darkened room with suitable back illumination using a hard pencil and high-quality tracing paper attached to the radiograph. The peripheral regions of the radiograph should be masked to highlight the cranial base and facial complex. Bilateral structures should be traced independently and then averaged. Alternatively, the landmarks and tracing can be digitized directly into a computer using specialized software, which will instantly produce an analysis (see Fig. 12.11). A simple tracing and landmark identification is shown in Fig. 6.26.
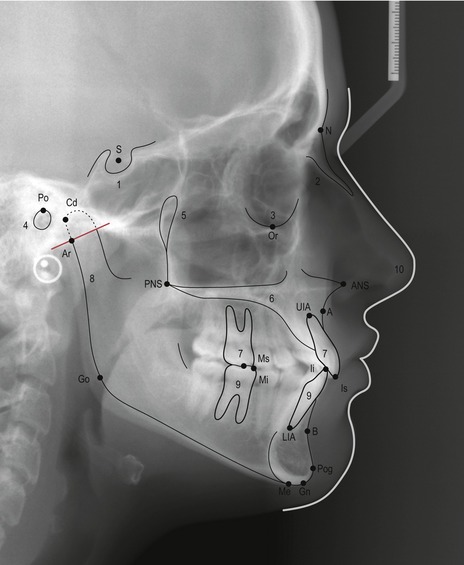
Figure 6.26 A simple cephalometric analysis can be achieved by identifying and tracing the following regions:
The following landmarks should also be identified:
Horizontal reference planes
A number of horizontal planes are commonly used as references in the construction of other measurements or they are related to each other within a cephalometric analysis (Fig. 6.27). In particular, they are used in the evaluation of skeletal relationships and the anteroposterior position of the dentition.
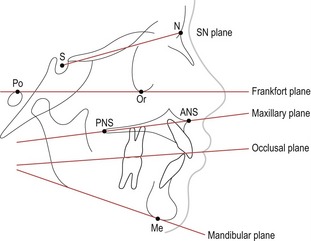
Frankfort horizontal plane
The Frankfort plane is a horizontal reference constructed as a line through porion to orbitale (Figs 6.27 and 6.28), which can be used both clinically and cephalometrically to orientate the head. It was first described at the Frankfort Congress of Anthropology in 1884 and was originally used for the orientation and comparison of dry skulls. The defining landmarks are easily located on a skull or subject in the clinic; however, several disadvantages are associated with the Frankfort horizontal as a cephalometric reference plane:
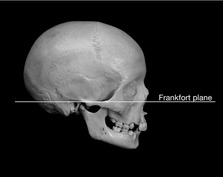
However, the Frankfort horizontal is one of the few reference planes that can be identified both clinically and on a radiograph, and it is used as the principle plane of reference in a number of cephalometric analyses.
Sella-nasion plane
The sella-nasion (SN) plane is constructed as a line extending from sella to nasion and represents the anteroposterior extent of the anterior cranial base (Fig. 6.27). It is commonly used as a reference plane because of its reliability:
The SN reference plane is used principally:
It should be remembered that nasion is not actually part of the anterior cranial base and can be subject to both vertical and horizontal growth changes, which can affect the accuracy of this plane (see Box 3.1).
Maxillary plane
The maxillary plane is constructed using a line connecting the anterior and posterior nasal spines, and serves as a horizontal reference for the maxilla (Fig. 6.27). It is useful for assessing:
Occlusal plane
A problem with both of these planes is the significant error associated with their construction.
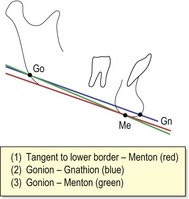
Mandibular plane
The mandibular plane serves as a horizontal reference line for the mandible and can be constructed using several methods (Fig. 6.29). The mandibular plane is useful for assessing:
Assessing the anteroposterior skeletal relationship
A number of methods for assessing the anteroposterior jaw relationship have been proposed.
The ANB angle
This method was first described as part of a cephalometric analysis proposed by Richard Riedel and relates the maxilla and mandible to the anterior cranial base (Riedel, 1952). The SN plane represents the anterior cranial base, whilst points A and B represent the anterior surfaces of the maxillary and mandibular apical bases, respectively (Fig. 6.30):
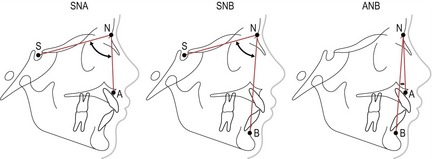
The ANB angle provides a relatively simple and commonly used assessment of anteroposterior jaw relations (Table 6.3). However, it is not beyond criticism:
Table 6.3 Classification of anteroposterior skeletal pattern using the ANB angle
| Skeletal class | ANB angle |
|---|---|
| Class I | 2–4° |
| Class II | > 4° |
| Class III | < 2° |
Mills’ Eastman correction
A potential problem of relating the maxilla and mandible to each other using the anterior cranial base is that any significant deviation in the position of this region within the skull will potentially affect interpretation of the jaw relationship (Fig. 6.31). Variation in the position of nasion can alter the SNA value. For example, the more anterior or superior the position of nasion, the lower the value of SNA, whilst a posterior or inferior position will produce a corresponding increase in SNA. Alterations in the value of SNA will, in turn, influence ANB and therefore estimation of the skeletal pattern. Mills introduced a correction for erroneous values of SNA (Mills, 1970):

Figure 6.31 Anterior or superior positioning of Nasion (N1) will reduce the SNA angle, whilst posterior or inferior positioning (N2) will increase the SNA angle. Both these changes will ultimately influence the ANB angle.
The vertical position of sella will also influence orientation of the SN line, but unlike variations in the position of nasion, it affects SNA and SNB to the same extent and therefore does not alter ANB. In these circumstances, Mills’ correction should not be applied. A simple check to ensure that sella is not in an erroneous position can be carried out by measuring the SN–maxillary plane angle, which should be 8° ± 3°.
Because of the problems associated with assessing the jaw relationship using the anterior cranial base, a number of alternative methods that assess the anteroposterior jaw position either in isolation or in relation to other regions of the skull have been described. It is useful to use at least one of these methods in addition to the angle ANB when assessing the skeletal pattern.
Wits appraisal
Alexander Jacobson described the Wits appraisal of jaw disharmony as a simple diagnostic aid that related the anteroposterior jaw relationship in isolation (Wits derives from an abbreviation for University of the Witwatersrand in South Africa where Jacobsen was employed) (Jacobson, 1975, 1976). The appraisal was based upon a sample of 21 adult males and 25 adult females selected on the basis of the excellence of their occlusion (Fig. 6.32).
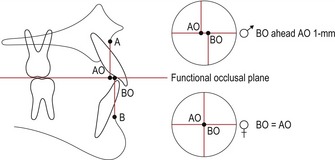
Perpendicular lines are dropped from A and B points to the functional occlusal plane. For males BO should lie 1-mm ahead of AO, whilst for females AO and BO should coincide. In a skeletal class II AO lies ahead of BO, whilst in a class III discrepancy BO is significantly ahead of AO.
By relating the maxilla and mandible to each other using the occlusal plane (which is common to both), this method avoids problems associated with relating them to the anterior cranial base, but gives no indication of the jaw position in relation to the face. Wits appraisal is useful as an additional measurement of the jaw relationship and should be used to supplement other methods of assessing the skeletal pattern. The most significant problem with this method is the potential error associated with localizing the occlusal plane.
Ballard’s conversion tracing
Clifford Ballard described a simple method for assessing the anteroposterior jaw relationship by using the axial inclination of the incisor teeth (Ballard, 1951). This method removes any potential influence of the soft tissues and dentoalveolar compensation for a skeletal discrepancy by adjusting the inclination of the maxillary and mandibular incisors to their normal value relative to the maxillary and mandibular planes. By then measuring the overjet, a simple analysis of the skeletal pattern is achieved (Fig. 6.33):
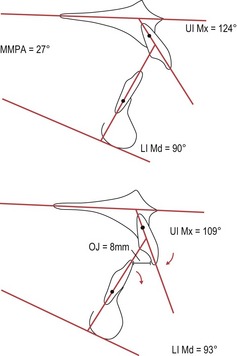
Figure 6.33 Ballard’s conversion tracing.
In the upper tracing, the UI to maxillary plane angle is 124°, whilst the LI to mandibular plane is 90°. The normal values should be 109° and 93°, respectively (the lower incisor to mandibular plane value is calculated by subtracting the MMPA from 120°). By adjusting these teeth to their normal values around a fulcrum approximately one-third of the root length from the apices, it can be seen that the overjet is still increased and therefore the skeletal pattern is class II.
The validity of Ballard’s method depends upon the premises that:
As none of these premises are necessarily true, disagreement exists as to the validity of this technique (Bhatia & Akpabio, 1979; Houston, 1975).
Assessing the vertical skeletal relationship
The vertical jaw relationship can also be assessed in a number of ways (Fig. 6.34):
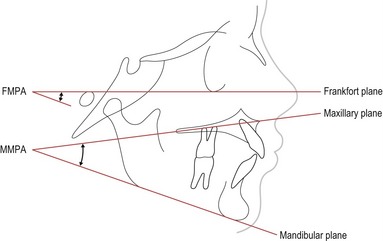
Maxillary–mandibular plane angle (MMPA)
The MMPA is a common method for evaluating the vertical jaw relationship, with horizontal reference planes that are easily located. The mean value is 27° ± 5°.
Frankfort–mandibular plane angle (FMPA)
The FMPA uses the Frankfort plane as a horizontal reference to the mandibular plane. This method ignores the maxillary plane, which if affected by a significant cant can give a misleading value to the vertical jaw relationship. It is useful to use this measurement in conjunction with the MMPA plane angle. The mean value is 27° ± 5°.
Anterior and posterior face heights
Anterior and posterior face heights are also used as a measure of vertical facial relationships (Fig. 6.35):
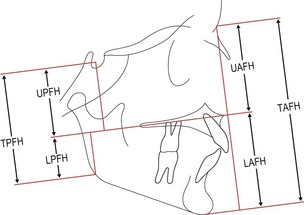
It should be noted that the TPFH (unlike the TAFH) is influenced by a particularly superior or inferior position of sella and this will affect the TPFH/TAFH ratio. Referring to the SN–maxillary plane angle can check the relative position of sella within the cranium.
Assessing the dental relationship
Several methods of assessment are available for positioning the maxillary and mandibular dentition in relation to the jaws and face.
Maxillary incisor relationship
The inclination of the most prominent maxillary incisor is constructed using a line through UIA–Is and measured in relation to the maxillary plane (Fig. 6.36). The mean value is 109° ± 6°.
Mandibular incisor relationship
The inclination of the most prominent mandibular incisor is constructed using a line through LIA–Ii and measured in relation to the mandibular plane (Fig. 6.36). The mean value is 93° ± 6°; however, mandibular incisor inclination can be influenced by orientation of the mandibular plane. As the mandibular plane becomes steeper, the incisors will tend to retrocline. An alternative method of evaluating the correct mandibular incisor relationship is to subtract the MMPA from 120°.
Mandibular incisor position within the face
The position of the mandibular incisors is so fundamental to orthodontic treatment planning that many individual analyses have been described for assessing position of these teeth.
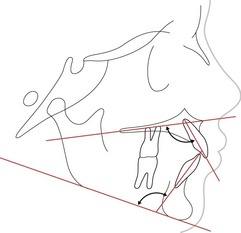
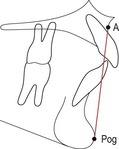
Mandibular incisor to A–Pogonion
Relating the anteroposterior incisor position to a line drawn from point A to pogonion (A–Pog) was originally described in the Downs analysis for the upper incisors. However, it was Robert Ricketts who popularized the use of this line, for positioning the lower incisors within the face. He placed great emphasis on this measurement, suggesting that the lower incisor edge should be approximately 1-mm (±2) ahead of the A–Pog line for optimal facial aesthetics (Fig. 6.37) (Ricketts, 1960). This idea was further developed by Raleigh Williams, who emphasized the importance of this relationship for both aesthetics and long-term stability when planning treatment with the Begg fixed appliance (Williams, 1969). However, whilst this line provides a simple cephalometric assessment of lower incisor position in relation to the jaws, there is no evidence that deliberately positioning the lower incisor edges on the A–Pog line at the end of treatment will produce either improved aesthetics or stability (Park and Burstone, 1986; Houston and Edler, 1990).
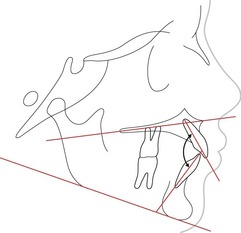
Interincisal angle
The angle formed between the most prominent maxillary and mandibular incisors (Fig. 6.38). The mean value is 135° ± 10°.
Cephalometric analyses
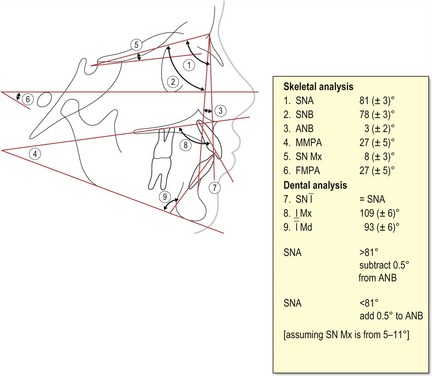
The orthodontic literature contains many different cephalometric analyses that have been described by individual clinicians; each providing a detailed description of how the facial skeleton and dentition should be positioned for maximal aesthetics. The scientific basis for many of these analyses is weak, with the quoted normal values often based upon very small sample sizes. In reality, very few are still used today in their entirety; however, individually they do contain many of the elements applied in modern analysis and it is useful to understand the origins of these measurements. A simple cephalometric analysis is shown in Table 6.4.
Table 6.4 A simple cephalometric analysis
| SNA | 81° (± 3)° |
| SNB | 78° (± 3)° |
| ANB | 3° (± 2)° |
| SN Mx plane | 8° (± 3)° |
| WITS | BO + 1 mm ahead AO ( ) ) |
BO = AO ( ) ) |
|
| MMPA | 27° (± 5)° |
| UI Mx plane | 109° (± 6)° |
| LI Md plane | 93° (± 6)° |
| I/I | 135° (± 10)° |
| LI APo | 1 (± 2) mm |
| TAFH | Mean 119 mm |
| UAFH | Mean 54 mm |
| LAFH | Mean 65 mm |
| % LAFH | Mean 55% |
| NLA | 100° (± 8)° |
| Lip relation to E-line | Upper −4 mm |
| Lower −2 mm |
SNA = angle SN (sella-nasion) to point A; SNB = angle SN to point B; ANB = difference between angles SNA and SNB; SN Mx plane = SN–maxillary plane angle; MMPA = maxillary–mandibular plane angle; UI Mx plane = upper incisor–maxillary plane angle; LI Md plane = lower incisor–mandibular plane angle; I/I = interincisal angle; LI APo = distance from lower incisor tip to A–Pog line; TAFH = total anterior face height; UAFH = upper anterior face height; LAFH = lower anterior face height; NLA = nasolabial angle.
Downs analysis
William Downs was one of the first to propose a cephalometric analysis that attempted to describe the basis of facial skeletal pattern in the presence of normal occlusion (Fig. 6.39). His rationale was that if normal pattern and its range of variation could be described, then the abnormal could be judged by comparison (Downs, 1948, 1952, 1956).
Downs based his analysis on a study of 20 Caucasian boys and girls ranging in age from 12 to 17 years and selected on the basis of excellent occlusion and facial harmony. His analysis used the Frankfort plane as a horizontal reference and was subdivided into an assessment of the skeletal and dental patterns:
Relationship of the dentition to the skeletal pattern
Downs analysis was made simpler to interpret by plotting the results on a two-polygon graph or ‘wiggleogram’, one representing the skeletal pattern and one the denture pattern (Fig. 6.40) (Downs, 1956; Vorhies & Adams, 1951). Average values for each measurement were represented through the centre of the graph and the extremes of variation extended laterally, the best-balanced retrognathic faces to the left and prognathic faces to the right. By plotting the results of an analysis on such a graph, a very rapid quantitative and qualitative illustration of the facial type is generated.
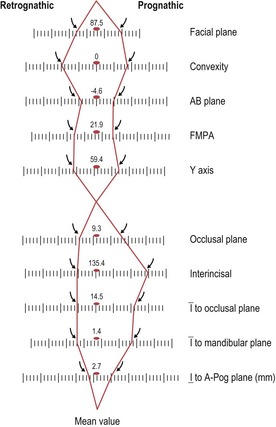
Steiner analysis
The Steiner analysis was first described in 1953 by Cecil Steiner, an orthodontist in Beverly Hills, California (Steiner, 1953) and many elements of this analysis are still in popular use today (Fig. 6.41). Steiner utilized the SN plane as a point of horizontal reference, favouring it over the Frankfort horizontal for two main reasons:
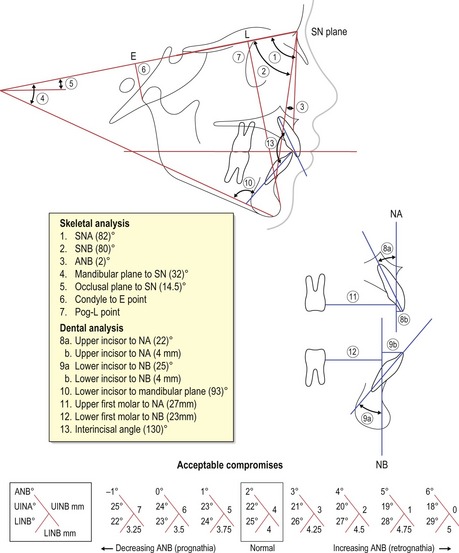
Steiner compartmentalized his assessment into skeletal and dental components, later introducing a method of compromise for positioning the dentition in the presence of skeletal discrepancy.
Further attention was placed upon locating the mandible and defining its relationship to other craniofacial structures:
Steiner recognized that not every individual would conform to a single set of cephalometric measurements and he further modified his analysis with the introduction of acceptable compromises for incisor position, if the values of ANB deviated from the ideal (Fig. 6.41) (Steiner, 1956).
McNamara analysis
James McNamara described his analysis as a method of evaluating the position of the dentition and jaws both to each other and to the cranial base for a more modern era, where the increasing use of functional appliances and orthognathic surgery was producing new possibilities in the treatment of skeletal discrepancies (Fig. 6.42) (McNamara, 1984). Normal values for the analysis were obtained by combining average values from three longitudinal cephalometric growth studies carried out in North America: Bolton, Burlington and Ann Arbor.
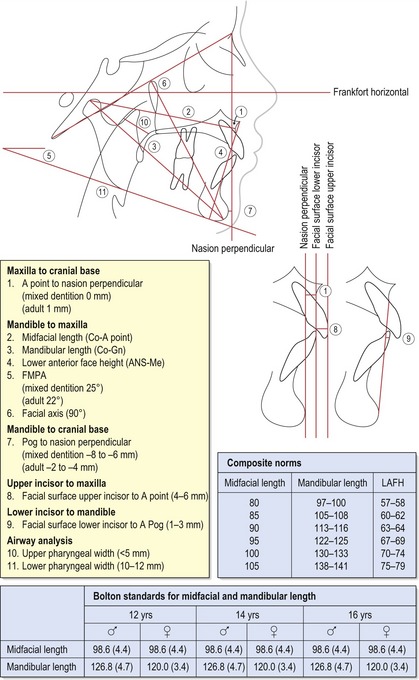
McNamara used the Frankfort plane as a horizontal reference and constructed a perpendicular line through nasion to provide a vertical reference. The analysis is subdivided into five principle sections defining the hard tissues, and an additional analysis of the airway:
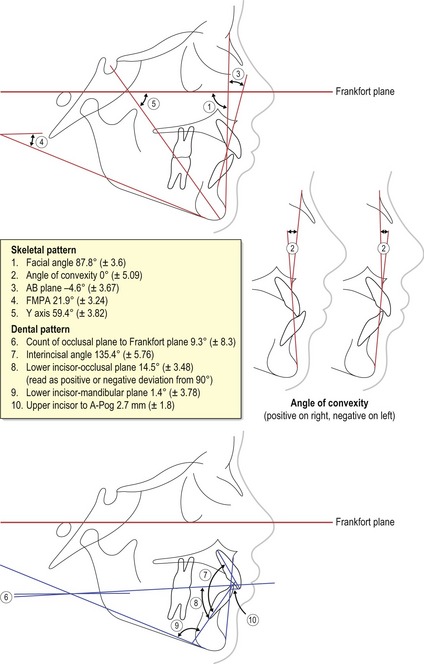
Eastman analysis
The origin of this analysis is found in the work of Clifford Ballard who pioneered the use of cephalometric radiography in orthodontic diagnosis and treatment planning at the Eastman Dental Hospital in London. He based his standard values upon a random selection of 250 individuals gathered from a range of age groups (Ballard, 1956). The Eastman analysis was further developed by Richard Mills (Mills, 1982) and the core elements are still in popular use within the UK today, although usually supplemented with additional measurements. The original Eastman analysis was divided into skeletal and dental assessments (Fig. 6.43):
Soft tissue cephalometric analysis
The soft tissue profile can also be seen on a lateral skull cephalometric radiograph, and various methods for measuring this have been described.
Ricketts’ E-line
Ricketts’ E-line is a line drawn from tip of the nose to soft tissue pogonion. The upper lip should be 4-mm and the lower lip 2-mm behind this line. This line is age-related, as the lips tend to become more retrusive with age.
Nasolabial angle
The nasolabial angle can also be identified from the soft tissue profile on a cephalometric radiograph. The landmarks and mean values have been described previously (see Fig. 6.8).
Errors in cephalometric analysis
Cephalometrics is not an exact science and it should be recognized that a significant amount of error is associated with any cephalometric analysis (Houston, 1983).
It is important for the identification of a particular landmark to be reproducible, with successive measurements of the same dimension being identical. Reproducibility is influenced primarily by measurement error:
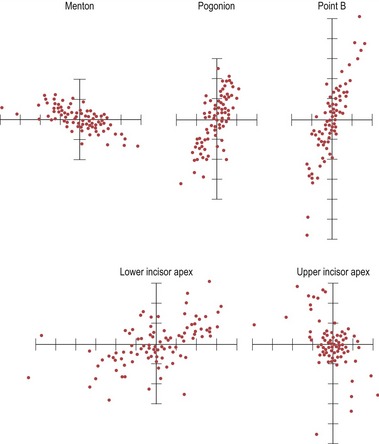
Figure 6.44 Envelope of error associated with cephalometric point identification.
(Redrawn from Baumrind and Frantz, 1971a).
Another source of potential error is the validity of what is actually being measured. There is little merit in identifying landmarks and measuring particular dimensions to a high degree of accuracy if they do not represent what they are supposed to:
Methods to reduce cephalometric error include the following:
Cephalometric superimposition
The comparison of longitudinal or cross-sectional cephalometric radiographs taken at different time points is a useful method for evaluating the effects of craniofacial growth, orthodontic treatment or both. Most commonly, superimposition is employed to evaluate:
A prerequisite for accurate superimposition is that the anatomical structures used to superimpose one radiograph onto the other are stable over the period of observation between the films. In addition, for radiographs taken on different machines, the magnification must be taken into account.
Analysing changes in the facial skeleton
To accurately evaluate facial change, the region of superimposition not only needs to be stable, but must also be located outside the facial skeleton itself. The cranial base has completed much of its growth by 6 years of age and, therefore, is commonly used as a reference plane for this type of cephalometric superimposition. Several techniques have been described, but the most popular use the anterior cranial base:
Superimposition on anterior cranial base anatomy
Lucien de Coster described the basicranial line or anterior cranial base as a stable structure, which represented the axis of the skull base and was therefore suitable for the comparison of changes in the facial bones (Fig. 6.45) (de Coster, 1952). The de Coster line extends along the following landmarks:
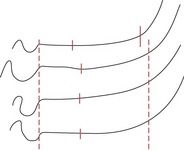
Figure 6.45 De Coster’s line drawn from four members of the same family.
Reproduced from de Coster (1952) with permission from Oxford University Press.
Björk and Skieller subsequently modified this method of regional superimposition, further defining the precise anatomical landmarks along the anterior cranial base that should be utilized on the basis of stability (Fig. 6.46) (Björk & Skieller, 1983):
Superimposition on the SN plane, registered at S
The identification of anterior cranial base anatomy can be difficult because of a lack of radiographic clarity in this region and a degree of skill is required to carry out this procedure. An alternative method uses the SN plane, with registration at S. The clarity of sella and nasion, their relative stability and the position of SN in the mid-sagittal plane of the skull make this reference line an attractive and widely used alternative for cranial base superimposition. However, the position of nasion can change during growth of the frontonasal suture, and if this occurs in a vertical direction it can affect the accuracy of SN as a reference (see Box 3.1).
Studies comparing the accuracy of these different methods of anterior cranial base superimposition have demonstrated that all have appreciable levels of error and none are significantly more reliable (Baumrind et al, 1976; Ghafari et al, 1987).
Grid analysis
A number of grid-based analyses that attempt to differentiate between dental and skeletal changes that have occurred in the region of the jaws as a result of orthodontic treatment mechanics have been described. These analyses use cranial base superimposition and the construction of a vertical reference line to measure anteroposterior change.
Analysing changes in the maxilla and mandible
Superimposing on landmarks within or around the maxilla and mandible allows an analysis of the local growth and dentoalveolar change that has occurred in isolation from that produced by growth displacement. A number of techniques have been described for each jaw and they also rely on using stable or near-stable structures associated with each bone.
Analysing changes in the maxilla
A number of methods for analysing changes in the maxilla have been described:
Analysing changes in the mandible
Brown M. Eight methods of analysing a cephalogram to establish anteroposterior skeletal discrepancy. Br J Orthod. 1981;8:139-146.
FACULTY OF GENERAL DENTAL PRACTITIONERS UK. Selection Criteria for Dental Radiography, 2nd edn. London: Royal College of Surgeons of England; 2004.
McDonald F, Ireland AJ. Diagnosis of the Orthodontic Patient. Oxford: Oxford University Press; 1998.
RADIATION PROTECTION 136. European guidelines on radiation protection in dental radiology. The safe use of radiographs in dental practice. Luxembourg: Office for Official Publications of the European Communities; 2004.
Sarver DM, Proffit WR, Ackerman JL. Contemporary Treatment of Dentofacial Deformity. St Louis: Mosby; 2003.
Whaites E. Essentials of Dental Radiography and Radiology, 4th edn. Edinburgh: Churchill Livingstone Elsevier; 2007.
Williams P. Lower incisor position in treatment planning. Br J Orthod. 1986;13:33-41.
Ballard CF. Recent work in North America as it affects orthodontic diagnosis and treatment. Dental Record. 1951;71:85-97.
Ballard CF Morphology and treatment of class II division 2 occlusions Trans Eur Orth Soc 1956 44-55
Bass JK, Fine H, Cisneros GJ. Nickel hypersensitivity in the orthodontic patient. Am J Orthod Dentofacial Orthop. 1993;103:280-285.
Baumrind S, Frantz RC. The reliability of head film measurements. 1. Landmark identification. Am J Orthod. 1971;60:111-127.
Baumrind S, Frantz RC. The reliability of head film measurements. 2. Conventional angular and linear measures. Am J Orthod. 1971;60:505-517.
Baumrind S, Miller D, Molthen R. The reliability of head film measurements. 3. Tracing superimposition. Am J Orthod. 1976;70:617-644.
BEANE, BEANE RA, REIMANN G, PHILLIPS C, et al. A cepholometric comparison of black open-bite subjects and black normals. Angle Orthod. 2003;73:294-300.
Bhatia SN, Akpabio TA. A correlation study of two methods of assessing skeletal pattern. Br J Orthod. 1979;6:187-193.
Björk A, Skieller V. Roentgencephalometric growth analysis of the maxilla. Trans Eur Orth Soc. 1977;53:51-55.
Björk A, Skieller V. Normal and abnormal growth of the mandible. A synthesis of longitudinal cephalometric implant studies over a period of 25 years. Eur J Orthod. 1983;5:1-46.
Broadbent BH. Bolton standards and technique in orthodontic practice. Angle Orthod. 1937;7:209-233.
de Coster L The familial line, studied by a new line of reference Trans Eur Orth Soc 1952 50-55
Downs WB. Variations in facial relationships: their significance in treatment and prognosis. Am J Orthod. 1948;34:812-840.
Downs WB. The role of cephalometrics in orthodontic case analysis and diagnosis. Am J Orthod. 1952;38:162-182.
Downs WB. Analysis of the dentofacial profile. Angle Orthod. 1956;26:191-212.
Ellis PE, Benson PE. Does articulating study casts make a difference to treatment planning? J Orthod. 2003;30:45-49.
Ghafari J, Engel FE, Laster LL. Cephalometric superimposition on the cranial base: a review and a comparison of four methods. Am J Orthod Dentofacial Orthop. 1987;91:403-413.
Gill DS, Naini FB, Tredwin CJ. Smile aesthetics. Dent Update. 2007;34:152-158.
HAMDAM, HAMDAM AM, ROCK WP. Cepholometric norms in an arabic population. J Orthod. 2001;28:297-300.
Houston WJ. The analysis of errors in orthodontic measurements. Am J Orthod. 1983;83:382-390.
HOUSTON WJ, EDLER R. Long-term stability of the lower labial segment relative to the A-Pog line. Eur J Orthod. 1990;12:302-310.
Houston WJB. Assessment of the skeletal pattern from the occlusion of the incisor teeth: a critical review. Br J Orthod. 1975;2:167-169.
Isaacson KG, Thom AR, Horner K, et al. Orthodontic radiographs. British Orthodontic Society. 2008.
Jacobson A. The ‘Wits’ appraisal of jaw disharmony. Am J Orthod. 1975;67:125-138.
Jacobson A. Application of the ‘Wits’ appraisal. Am J Orthod. 1976;70:179-189.
Johnston LEJr. Balancing the books on orthodontic treatment: an integrated analysis of change. Br J Orthod. 1996;23:93-102.
Mamandras AH. Linear changes of the maxillary and mandibular lips. Am J Orthod Dentofacial Orthop. 1988;94:405-410.
McNamara JAJr. A method of cephalometric evaluation. Am J Orthod. 1984;86:449-469.
MERRETT SJ, DRAGE NA, DURNING P. Cone beam computed tomography: a useful tool in orthodontic diagnosis and treatment planning. J Orthod. 2009;36:202-210.
MIJAMIMA, MIJAMIMA K, MCNAMARA JA, KIMURA T, et al. Craniofacial structure of Japanese and European-American adults with normal occlusions and well-balanced faces. Am J Orthod Dentofacial Orthop. 1996;110:431-438.
Mills JRE. The application and importance of cephalometry in orthodontic treatment. The Orthodontist. 1970;2:32-47.
Mills JRE. Principles and Practice of Orthodontics. Edinburgh: Churchill Livingstone; 1982.
Moorrees CFA, Keane MR. Natural head position, a basic consideration in the interpretation of cephalometric radiographs. Am J Phys Anthropol. 1958;16:213-234.
Obwegeser HL, Makek MS. Hemimandibular hyperplasia–hemimandibular elongation. J Maxillofac Surg. 1986;14:183-208.
Ownby DR, Ownby HE, McCullough J, et al. The prevalence of anti-latex IgE antibodies in 1000 volunteer blood donors. J Allergy Clin Immunol. 1996;97:1188-1192.
Pancherz H. The mechanism of Class II correction in Herbst appliance treatment. A cephalometric investigation. Am J Orthod. 1982;82:104-113.
PARK YC, BURSTONE CJ. Soft-tissue profile–fallacies of hard-tissue standards in treatment planning. Am J Orthod Dentofacial Orthop. 1986;90:52-62.
Ricketts RM. A foundation for cephalometric communication. Am J Orthod. 1960;46:330-357.
Riedel RA. The relation of maxillary structures to cranium in malocclusion and in normal occlusion. Angle Orthod. 1952;22:142-145.
Salzmann JA. The research workshop on cephalometrics. Am J Orthod. 1960;46:834-847.
Santoro M, Galkin S, Teredesai M, et al. Comparison of measurements made on digital and plaster models. Am J Orthod Dentofacial Orthop. 2003;124:101-105.
Sarver DM. The importance of incisor positioning in the esthetic smile: the smile arc. Am J Orthod Dentofacial Orthop. 2001;120:98-111.
Steiner C. Cephalometrics for you and me. Am J Orthod. 1953;39:729-755.
Steiner C. Cephalometrics in clinical practice. Angle Orthod. 1956;29:8-29.
Tulloch JF, Shaw WC, Underhill C, et al. A comparison of attitudes toward orthodontic treatment in British and American communities. Am J Orthod. 1984;85:253-259.
Vorhies JM, Adams JW. Polygonic interpretation of cephalometric findings. Angle Orthod. 1951;21:194-197.
Williams R. The diagnostic line. Am J Orthod. 1969;55:458-476.