
Walter F. Boron
Acid-base physiology is really the study of the proton, or hydrogen ion (H+). Although they are present in exceedingly low concentrations in most intracellular and extracellular fluids, protons nevertheless have a major impact on biochemical reactions and on a variety of physiological processes that are critical for the homeostasis of the entire body and individual cells. Not surprisingly, the body has evolved sophisticated systems to maintain [H+] values within narrow and precise ranges in the blood plasma, intracellular fluid, and other compartments.
This chapter provides the introduction to acid-base physiology, including the chemistry of buffers, the CO2/HCO−3 buffer system, the competition between the CO2/HCO−3 buffer system and other buffers, and the regulation of intracellular pH. In other chapters, we will discuss how blood pH—and, by extension, the pH of extracellular fluid—is under the dual control of the respiratory system, which regulates plasma [CO2] (see Chapter 31), and the kidneys, which regulate plasma [HCO−3] (see Chapter 39). In addition, we discuss the control of cerebrospinal fluid pH in Chapter 32.
According to Brønsted’s definition, an acid is any chemical substance (e.g., CH3COOH, NH+4) that can donate an H+. A base is any chemical substance (e.g., CH3COO−, NH3) that can accept an H+. The term alkali can be used interchangeably with base. (See Note: Hydrogen Ions in Aqueous Solutions)
[H+] varies over a large range in biological solutions, from more than 100 mM in gastric secretions to less than 10 nM in pancreatic secretions. In 1909, the chemist Sørensen introduced the pH scale in an effort to simplify the notation in experiments in which he was examining the influence of [H+] on enzymatic reactions. He based the pH scale on powers of 10: (See Note: The Origin of the ’p’ of pH)
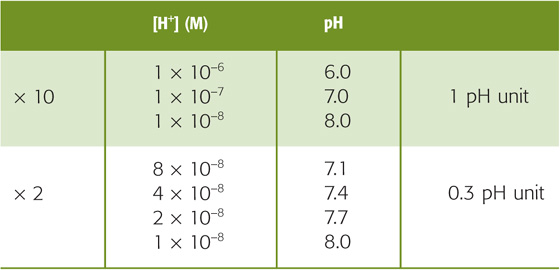
Thus, when [H+] is 10−7 M, the pH is 7.0. The higher the [H+], the lower the pH (Table 28-1). A 10-fold change in [H+] corresponds to a pH shift of 1, whereas a 2-fold change in [H+] corresponds to a pH shift of ~0.3.
Table 28-1 Relationship Between [H+] and pH Values
Even small changes in pH can have substantial physiological consequences because most biologically important molecules contain chemical groups that can either donate an H+ (e.g., R–COOH → R–COO− + H+) and thereby act as a weak acid or accept an H+ (e.g., R–NH2 + H+ → R–NH+3) and thus behave as a weak base. To the extent that these groups donate or accept protons, a pH shift causes a change in their net electrical charge (or valence) that can, in turn, alter a molecule’s conformation and thus its biological activity.
pH-sensitive molecules include a variety of enzymes, receptors and their ligands, ion channels, transporters, and structural proteins. For most proteins, pH sensitivity is modest. The activity of the Na-K pump (see Chapter 5), for example, falls by about half when the pH shifts by ~1 pH unit from the optimum pH, which is near the resting pH of the typical cell. However, the activity of phosphofructokinase, a key glycolytic enzyme (see Chapter 58), falls by ~90% when pH falls by only 0.1. The overall impact of pH changes on cellular processes can be impressive. Therefore, cell proliferation in response to mitogenic activation is maximal at the normal, resting intracellular pH but may fall as much as 85% when intracellular pH falls by only 0.4.
Table 28-2 summarizes the pH values in several body fluids. Because the pH of neutral water at 37°C is 6.81, most major body compartments are alkaline.
Table 28-2 Approximate pH Values of Various Body Fluids
Compartment |
pH |
Gastric secretions (under conditions of maximal acidity) |
0.7 |
Lysosome |
5.5 |
Chromaffin granule |
5.5 |
Neutral H2O at 37°C |
6.81 |
Cytosol of a typical cell |
7.2 |
Cerebrospinal fluid |
7.3 |
Arterial blood plasma |
7.4 |
Mitochondrial inner matrix |
7.5 |
Secreted pancreatic fluid |
8.1 |
A buffer is any substance that reversibly consumes or releases H+. In this way, buffers help stabilize pH. Buffers do not prevent pH changes; they only help to minimize them.
Consider a hypothetical buffer B for which the protonated form HB(n + 1), with a valence of n + 1, is in equilibrium with its deprotonated form B(n), which has the valence of n:

Here, HB(n + 1) is a weak acid because it does not fully dissociate; B(n) is its conjugate weak base. Conversely, B(n) is a weak base and HB(n + 1) is its conjugate weak acid. The total buffer concentration, [TB], is the sum of the concentrations of the protonated and unprotonated forms:

The valence of the acidic (i.e., protonated) form can be positive, zero, or negative:
In these examples, NH+4 (ammonium), H2CO3 (carbonic acid), and H2PO−4 (“monobasic” inorganic phosphate) are all weak acids; NH3 (ammonia), HCO−3 (bicarbonate), and HPO2−4 (“dibasic” inorganic phosphate) are the respective conjugate weak bases. Each buffer reaction is governed by a dissociation constant, K:
If we add to a physiological solution a small amount of HCl—which is a strong acid because it fully dissociates—the buffers in the solution consume almost all added H+:

For each H+ buffered, one B(n) is consumed. The tiny amount of H+ that is not buffered remains free in solution and is responsible for the decrease in pH.
If we instead titrate this same solution with a strong base such as NaOH, H+ derived from HB(n + 1) neutralizes almost all the added OH−:

For each OH− buffered, one B(n) is formed. The tiny amount of added OH− that is not neutralized by the buffer equilibrates with H+ and H2O and is responsible for an increase in pH. (See Note: Buffering of H+)
A useful measure of the strength of a buffer is its buffering power (β), which is the number of moles of strong base (e.g., NaOH) that one must add to a liter of solution to increase pH by one pH unit. This value is equivalent to the amount of strong acid (e.g., HCl) that one must add to decrease the pH by one pH unit. Thus, buffering power is
In the absence of CO2/HCO−3, the buffering power of whole blood (which contains erythrocytes, leukocytes, and platelets) is ~25 mM/pH unit. This value is known as the non-HCO−3 buffering power (βnon-HCO−3). In other words, we would have to add 25 mmol of NaOH to a liter of whole blood to increase the pH by one unit, assuming that β is constant over this wide pH range. For blood plasma, which lacks the cellular elements of whole blood, the non-HCO−3 buffering power is only ~5 mM/pH unit, which means that only about one fifth as much strong base would be needed to produce the same pH increase.
The most important physiological buffer pair is CO2 and HCO−3. The impressive strength of this buffer pair is due to the volatility of CO2, which allows the lungs to maintain stable CO2 concentrations in the blood plasma despite ongoing metabolic and buffer reactions that produce or consume CO2. Imagine that a beaker contains an aqueous solution of 145 mM NaCl (pH = 6.81) but no buffers. We now expose this solution to an atmosphere containing CO2 (Fig. 28-1). The concentration of dissolved CO2 ([CO2]Dis) is governed by Henry’s law (see Chapter 26 for the box on that topic):

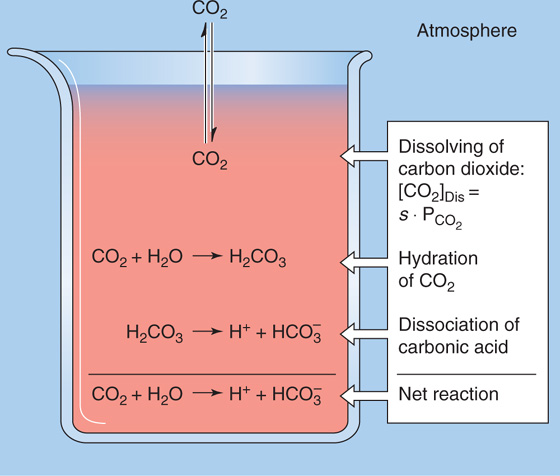
Figure 28-1 Interaction of CO2 with water.
At the temperature (37°C) and ionic strength of mammalian blood plasma, the solubility coefficient, s, is ~0.03 mM/mm Hg. Because the alveolar air with which arterial blood equilibrates has a PCO2 of ~40 mm Hg, or torr, [CO2]Dis in arterial blood is

So far, the entry of CO2 from the atmosphere into the aqueous solution has had no effect on pH. The reason is that we have neither generated nor consumed H+. CO2 itself is neither an acid nor a base. If we were considering dissolved N2 or O2, our analysis would end here because these gases do not further interact with simple aqueous solutions. The aqueous chemistry of CO2, however, is more complicated because CO2 reacts with the solvent (i.e., H2O) to form carbonic acid:

This CO2 hydration reaction is very slow. In fact, it is far too slow to meet certain physiological needs. The enzyme carbonic anhydrase, present in erythrocytes and elsewhere, catalyzes a reaction that effectively bypasses this slow hydration reaction. Carbonic acid is a weak acid that rapidly dissociates into H+ and HCO−3: (See Note: Out-of-Equilibrium CO2/HCO–3 Solutions; Carbonic Anhydrases)

This dissociation reaction is the first point at which pH falls. Note that the formation of HCO−3 (the conjugate weak base of H2CO3) necessarily accompanies the formation of H+ in a stoichiometry of 1 : 1. The observation that pH decreases, even though this reaction produces the weak base HCO−3, is sometimes confusing. A safe way to reason through such an apparent paradox is to focus always on the fate of the proton. If the reaction forms H+, pH falls. Thus, even though the dissociation of H2CO3 leads to generation of a weak base, pH falls because H+ forms along with the weak base.
Unlike the hydration of CO2, the dissociation of H2CO3 is extremely fast. Thus, in the absence of carbonic anhydrase, the slow CO2 hydration reaction limits the speed at which increased [CO2]Dis leads to the production of H+. HCO−3 can accept a proton to form its conjugate weak acid (i.e., H2CO3) or release a second proton to form its conjugate weak base (i.e., CO2−3). Because this reaction generally is of only minor physiological significance for buffering in mammals, we will not discuss it further.
We may treat the hydration and dissociation reactions that occur when we expose water to CO2 as if only one reaction were involved:
Moreover, we can define a dissociation constant for this pseudoequilibrium:
In logarithmic form, this equation becomes (See Note: Derivation of the Henderson-Hasselbalch Equation)

Finally, we may express [CO2] in terms of PCO2, recalling from Henry’s law that [CO2] = s · PCO2:
This is the Henderson-Hasselbalch equation, a logarithmic restatement of the CO2/HCO−3 equilibrium in Equation 28-14. Its central message is that pH depends not on [HCO−3] or PCO2 but on their ratio. Human arterial blood has a PCO2 of ~40 mm Hg and a [HCO−3] of ~24 mM. If we assume that the pK governing the CO2/HCO−3 equilibrium is 6.1 at 37°C, then
Thus, the Henderson-Hasselbalch equation correctly predicts the normal pH of arterial blood.
The buffering power of a buffer pair such as CO2/HCO−3 depends on three factors:
1. Total concentration of the buffer pair, [TB]. Other things being equal, β is proportional to [TB].
2. The pH of the solution. The precise dependence on pH will become clear later.
3. Whether the system is open or closed. That is, can one member of the buffer pair equilibrate between the “system” (the solution in which the buffer is dissolved) and the “environment” (everything else)?
If neither member of the buffer pair can enter or leave the system, then HB(n + 1) can become B(n), and vice versa, but [TB] is fixed. This is a closed system. An example of a closed-system buffer is inorganic phosphate in a beaker of water or a titratable group on a protein in blood plasma. In a closed system, the buffering power of a buffer pair is (See Note: Derivation of Expressions for Buffering Power in Closed and Open Systems)

Two aspects of Equation 28-18 are of interest. First, at a given [H+], βclosed is proportional to [TB]. Second, at a given [TB], βclosed has a bell-shaped dependence on pH (green curve in Fig. 28-2A). βclosed is maximal when [H+] = K (i.e., when pH = pK). Most non-HCO−3 buffers in biological fluids behave as if they are in a closed system. Although many fluids are actually mixtures of several non-HCO−3 buffers, the total βnon-HCO−3 in such a mixture is the sum of their βclosed values, each described by Equation 28-18. The red curve in Figure 28-2B shows how total βnon-HCO−3 varies with pH for a solution containing a mixture of nine buffers (including the one described by the green curve), each present at a [TB] of 12.6 mM, with pK values evenly spaced at intervals of 0.5 pH unit. In this example, total βnon-HCO−3 is remarkably stable over a broad pH range and has a peak value that is the same as that of whole blood: 25 mM/pH unit. Indeed, whole blood is a complex mixture of many non-HCO−3 buffers. The most important of these are titratable groups on hemoglobin and, to a far lesser extent, other proteins. Even less important than the “other proteins” are small molecules such as inorganic phosphate. The [TB] values for these many buffers are not identical, and the pK values are not evenly spaced. Nevertheless, the buffering power of whole blood is nearly constant near the physiological pH.
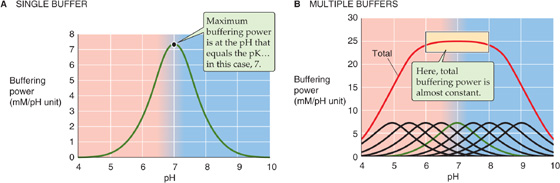
Figure 28-2 Buffering power in a closed system. In B, the solution contains nine buffers, each at a concentration of 12.6 mM and with pK values evenly spaced 0.5 pH unit apart.
The second physiologically important condition under which a buffer can function is in an open system. Here, one buffer species (e.g., CO2) equilibrates between the system and the environment. A laboratory example is a solution containing CO2 and HCO−3, in which dissolved CO2 equilibrates with gaseous CO2 in the atmosphere (Fig. 28-1). A physiological example is blood plasma, in which dissolved CO2 equilibrates with gaseous CO2 in the alveoli. In either case, [CO2]Dis is fixed during buffering reactions. However, the total CO2—[CO2] + [HCO−3]—can vary widely. Because total CO2 can rise to very high values, CO2/HCO−3 in an open system can be an extremely powerful buffer. Consider, for example, a liter of a solution having a pH of 7.4, a PCO2 of 40 mm Hg (1.2 mM CO2), and 24 mM [HCO−3]—but no other buffers (Fig. 28-3, stage 1). What happens when we add 10 mmol of HCl? Available [HCO−3] neutralizes almost all of the added H+, forming nearly 10 mmol H2CO3 and then nearly 10 mmol CO2 plus nearly 10 mmol H2O (Fig. 28-3, stage 2A). The CO2 that forms does not accumulate but evolves to the atmosphere so that [CO2]Dis is constant. What is the final pH? If [CO2]Dis remains at 1.2 mM in our open system, and if [HCO−3] decreases by almost exactly 10 mM (i.e., the amount of added H+) from 24 to 14 mM, the Henderson-Hasselbalch equation predicts a fall in pH from 7.40 to 7.17, corresponding to an increase in free [H+] of
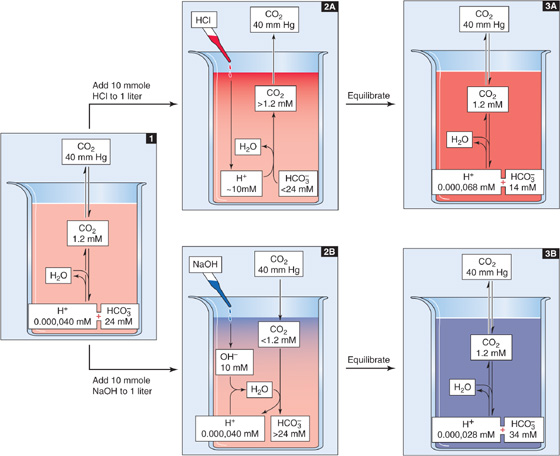
Figure 28-3 Buffering of strong acids and bases by CO2/HCO−3 in an open system.
Even though we have added 10 milli moles HCl to 1 L, [H+] increased by only 28 nano molar (Fig. 28-3, stage 3A). Therefore, the open-system buffer has neutralized 9.999,972 mmol of the added 10 mmol H+. The buffering provided by CO2/HCO−3 in an open system (βopen) is so powerful because only depletion of HCO−3 limits neutralization of H+. The buildup of CO2 is not a limiting factor because the atmosphere is an infinite sink for newly produced CO2.
The opposite acid-base disturbance occurs when we add a strong base such as NaOH. Here, the buffering reactions are just the reverse of those in the preceding example. If we add 10 mmol of NaOH to 1 L of solution, almost all added OH− combines with H+ derived from CO2 that enters from the atmosphere (Fig. 28-3, stage 2B). One HCO−3 ion forms for each OH− neutralized. Buffering power in this open system is far higher than that in a closed system because CO2 availability does not limit neutralization of added OH−. Only the buildup of HCO−3 limits neutralization of more OH−. In this example, even though we added 10 mmol NaOH, free [H+] decreased by only 12 nM (Fig. 28-3, stage 3B) as pH rose from 7.40 to 7.55.
Whether CO2/HCO−3 neutralizes an acid or a base, the open-system buffering power is (See Note: Derivation of Expressions for Buffering Power in Closed and Open Systems)

Notice that βopen does not have a maximum. Because βopen is proportional to [HCO−3], βopen rises exponentially with pH when PCO2 is fixed (Fig. 28-4, blue curve). In normal arterial blood (i.e., [HCO−3] = 24 mM), βopen is ~55 mM/pH unit. As we have already noted, the buffering power of all non-HCO−3 buffers (βnon-HCO−3) in whole blood is ~25 mM/pH unit. Thus, in whole blood, βopen represents more than two thirds of the total buffering power. The relative contribution of βopen is far more striking in interstitial fluid, which lacks the cellular elements of blood and also has a lower protein concentration.
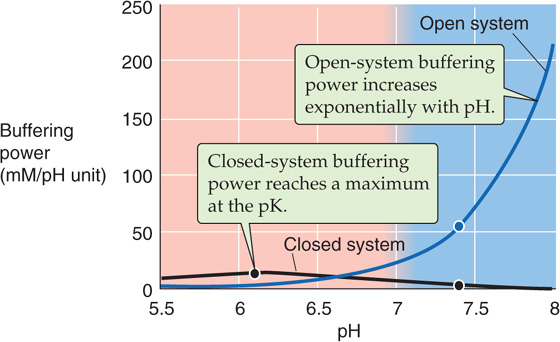
Figure 28-4 Buffering power of the CO2/HCO−3 system. At pH 7.4 on the blue curve, the solution has the same composition as does arterial blood plasma: a PCO2 of 40 mm Hg and an [HCO−3] of 24 mM. If the system is open (i.e., CO2 equilibrates with atmosphere), βopen is ~55 mM/pH unit at pH 7.40 and rises exponentially with pH (see Equation 28-20). If the system is closed, βclosed is only ~2.6 mM/pH unit at pH 7.4 and is maximal at the pK of the buffer (see Equation 28-18).
CO2/HCO−3 does not necessarily behave as an open-system buffer. In the preceding example, we could have added NaOH to a CO2/HCO−3 solution in a capped syringe. In such a closed system, not only does accumulation of HCO−3 limit neutralization of OH−, but the availability of CO2 is limiting as well. Indeed, for fluid having the composition of normal arterial blood, the closed-system CO2/HCO−3 buffering power is only 2.6 mM/pH unit (Fig. 28-4, black curve), less than 5% of the βopen value of 55 mM/pH unit. You might think that the only reason the closed-system buffering power is so low in this example is that the pH of 7.4 is 1.3 pH units above the pK. However, even if pH were equal to the pK of 6.1, the closed-system CO2/HCO−3 buffering power in our example would be only ~14 mM/pH unit, about one quarter of the open-system value at pH 7.4. A physiological example in which the CO2/HCO−3 system is “poorly open” is ischemia, wherein a lack of blood flow minimizes the equilibration of tissue CO2 with blood CO2. Thus, ischemic tissues are especially susceptible to large pH shifts.
In this section, we consider buffering by CO2 and HCO−3 when these are the only buffers present in the solution. We defer to the following section the more complex example, in which both CO2/HCO−3 and non-HCO−3 buffers are present in the same solution.
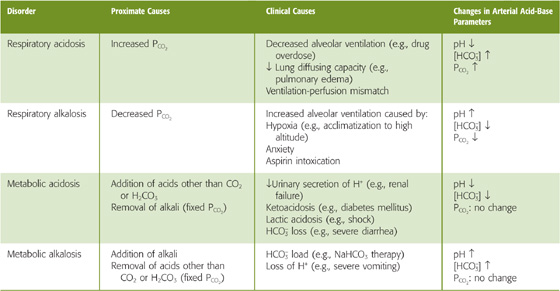
Figure 28-5 represents 1 L of a solution with the same CO2/HCO−3 composition as arterial blood plasma but no buffers other than CO2/HCO−3. What are the consequences of increasing PCO2 in the gas phase? The resulting increase in [CO2]Dis causes the CO2/HCO−3 equilibrium to shift toward formation of H+ and HCO−3. This disturbance is an example of a CO2 titration because we initiated it by altering PCO2. More specifically, it is a respiratory acidosis—“acidosis” because pH falls, and “respiratory” because pulmonary problems (Table 28-3) are the most common causes of an increase in the PCO2 of arterial blood (see Chapter 31).
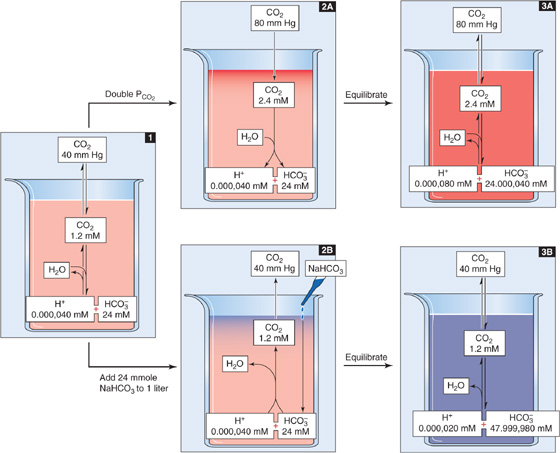
Figure 28-5 Doubling of CO2 or HCO−3 concentrations.
Table 28-3 The Four Major Acid-Base Disorders
In the absence of non-HCO−3 buffers, how far pH falls during respiratory acidosis depends on the initial pH and PCO2 as well as on the final PCO2. For example, doubling of PCO2 from 40 mm Hg (Fig. 28-5, stage 1) to 80 mm Hg causes [CO2]Dis to double to 2.4 mM (Fig. 28-5, stage 2A). At this point, the 1-L system is far out of equilibrium and can return to equilibrium only if some CO2 (x mmol) combines with x H2O to form x H+ and x HCO−3. Thus, according to Equation 28-14, the following must be true at equilibrium:
Solving this equation for x yields an extremely small value, nearly 40 nmol, or 0.000,040 mmol. x represents the flux of CO2 that passes through the reaction sequence CO2 + H2O → H2CO3→ H+ + HCO−3 to re-establish the equilibrium. CO2 from the atmosphere replenishes the CO2 consumed in this reaction, so that [CO2]Dis remains at 2.4 mM after the new equilibrium is achieved (Fig. 28-5, stage 3A). The reason that the flux x is so small is that with no other buffers present, every H+ formed remains free in solution. Thus, only a minuscule amount of H+ needs to be formed before [H+] nearly doubles from 40 to ~80 nM. However, [HCO−3] undergoes only a tiny fractional increase, from 24 to 24.000,040 mM. The doubling of the denominator in Equation 28-21 is matched by a doubling of the numerator, nearly all of which is due to the near-doubling of [H+]. The final pH in this example of respiratory acidosis is

Another way of arriving at the same answer is to insert the final values for [HCO−3] and PCO2 into the Henderson-Hasselbalch equation:

The opposite acid-base disturbance, in which PCO2 falls, is respiratory alkalosis. In a solution containing no buffers other than CO2/HCO−3 reducing PCO2 by half, from 40 to 20 mm Hg, would cause all of the aforementioned reactions to shift in the opposite direction, so that pH would rise by 0.3, from 7.4 to 7.7. We could produce respiratory alkalosis in a beaker by lowering the PCO2 in the gas phase. In humans, hyperventilation (Table 28-3) lowers alveolar and thus arterial PCO2 (see Chapter 31).
Thus, in the absence of non-HCO−3 buffers, doubling of [CO2] causes pH to fall by 0.3, whereas halving of [CO2] causes pH to rise by 0.3 (Table 28-1). Remember, the log of 2 is 0.3.
What would happen if we doubled [HCO−3] rather than PCO2? Starting with 1 L of solution that has the ionic composition of arterial blood (Fig. 28-5, stage 1), adding 24 mmol of HCO−3 (e.g., NaHCO3) drives the CO2/HCO−3 equilibrium toward CO2 (Fig. 28-5, stage 2B). The new equilibrium is achieved when x mmol of HCO−3 combines with x H+ to produce x CO2 and x H2O. Because the system is open to CO2, the generation of x mmol CO2 causes no change in [CO2]Dis; the newly formed CO2 simply evolves into the atmosphere. Thus, according to Equation 28-14, the following must be true at equilibrium:
Solving this equation yields an x of nearly 0.000,020 mM. Thus, in the absence of other buffers, an initial doubling of [HCO−3] from 24 to 48 mM causes [H+] to fall by nearly half, from 40 to 20 nM. Although [HCO−3] also decreases by 20 nM, its fractional change from 48 to 47.999,980 mM is insignificant. The final pH is

The Henderson-Hasselbalch equation yields the same result:
Thus, in the absence of non-HCO−3 buffers, doubling of [HCO−3] causes pH to increase by ~0.3. Rather than adding HCO−3, we could produce an identical effect by adding the same amount of strong base (e.g., NaOH), as we did in Figure 28-3 (stages 2B and 3B), or by removing the same amount of strong acid (e.g., HCl). Although the removal of HCl from a solution in a beaker may seem artificial, the removal of gastric HCl from the body occurs during vomiting (Table 28-3). We also could add a weak base (e.g., NH3) or remove any weak acid (e.g., lactic acid) other than CO2 or H2CO3. However, to produce the same alkali load, we would have to add or remove more of a weak base or acid than for a strong base or acid. All of these maneuvers, carried out at a fixed PCO2, are examples of metabolic alkalosis— “alkalosis” because the pH increases, and “metabolic” because derangements in metabolism are common clinical causes. (See Note: Metabolic Alkalosis Caused by Vomiting)
The opposite acid-base disturbance—in which we remove HCO−3 or another alkali or add an acid other than CO2 or H2CO3—is metabolic acidosis. Starting with a solution having the ionic composition of arterial blood, removing half of the initial HCO−3 or removing 12 mM NaOH or adding 12 mM HCl would cause all of the aforementioned reactions to shift in the opposite direction, so that pH would fall by 0.3, from 7.4 to 7.1. Common causes of metabolic acidosis in humans are renal failure and metabolic problems (Table 28-3).
We saw in Equation 28-26 that the pH of a CO2/HCO−3 solution does not depend on [HCO−3] or PCO2 but on their ratio. Because it is the kidney that controls [HCO−3] in the blood plasma (see Chapter 39), and because it is the lung that controls PCO2 (see Chapter 31), the pH of blood plasma is under the dual control of both organ systems, a concept embodied by a whimsical variant of the Henderson-Hasselbalch equation:
So far, our discussion has focused on simple systems in which the only pH buffers are either (1) one or more non-HCO−3 buffers or (2) CO2/HCO−3. Under these circumstances, it is relatively easy to predict the effects of acid-base disturbances. Real biological systems, however, are mixtures of CO2/HCO−3 and many non-HCO−3 buffers. Thus, to understand the effects of respiratory and metabolic acid-base disturbances in a biological system, we must consider multiple competing equilibria—one for CO2/HCO−3 (described by Equation 28-16) and one for each of the non-HCO−3 buffers (each described by its version of Equation 28-5). Obtaining a precise solution to such clinically relevant problems is impossible. One approach is to use a computer to make increasingly more precise approximations of the correct answer. Another, more intuitive approach is to use a graphical method to estimate the final pH. The Davenport diagram is the best such tool.
What happens to the pH of blood—a complex mixture that includes many non-HCO−3 buffers—when PCO2 doubles? We simplify matters by lumping together the actions of all non-HCO−3 buffers, so that H+ + B(n) ⇄ HB(n + 1) represents the reactions of all non-HCO−3 buffers. When we raise PCO2, almost all of the newly formed H+ reacts with B(n) to form HB(n + 1) so that the free [H+] rises only slightly.
In this simplified approach, the final pH depends on two competing buffer reactions—one involving CO2/HCO−3, and the other involving HB(n + 1)/B(n). Computation of the final pH requires solving of two simultaneous equations, one for each buffer reaction.
The CO2/HCO−3 Buffer The first of the two equations that we must solve simultaneously is a rearrangement of the Henderson-Hasselbalch equation (Equation 28-16):

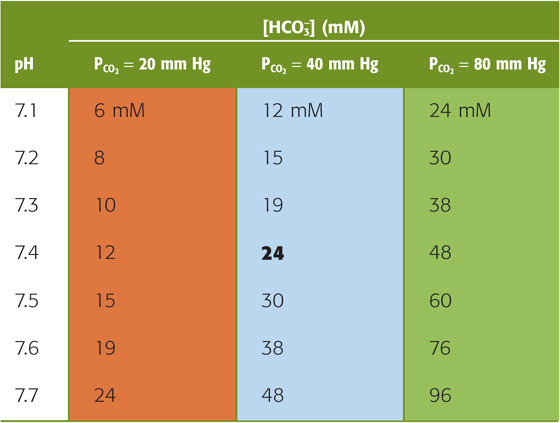
For a PCO2 of 40 mm Hg, the equation requires that [HCO−3] be 24 mM when pH is 7.40—as in normal arterial blood plasma. If pH decreases by 0.3 at this same PCO2, Equation 28-29 states that [HCO−3] must fall by half to 12 mM. Conversely, if pH increases by 0.3, [HCO−3] must double to 48 mM. The blue column of Table 28-4 lists the [HCO−3] values that Equation 28-29 predicts for various pH values when PCO2 is 40 mm Hg. Plotting these [HCO−3] values against pH yields the blue curve labeled PCO2 = 40 mm Hg in Figure 28-6A. This curve, which is known as a CO2 isobar or isopleth (from the Greek isos [equal] + plethein [to be full]), represents all possible combinations of [HCO−3] and pH at a PCO2 of 40 mm Hg. Table 28-4 also summarizes [HCO−3] values prevailing at PCO2 values of 20 mm Hg and 80 mm Hg. Note that at a PCO2 of 20 mm Hg (orange column), representing respiratory alkalosis, [HCO−3] values are half those for a PCO2 of 40 mm Hg at the same pH. At a PCO2 of 80 mm Hg (green column), representing respiratory acidosis, [HCO−3] values are twice those at a PCO2 of 40 mm Hg. Each of the isopleths in Figure 28-6A rises exponentially with pH. The slope of each isopleth also rises exponentially with pH and represents βopen for CO2/HCO−3. At a particular pH, an isopleth representing a higher PCO2 (i.e., a higher [HCO−3]) has a steeper slope, as Equation 28-20 predicts.
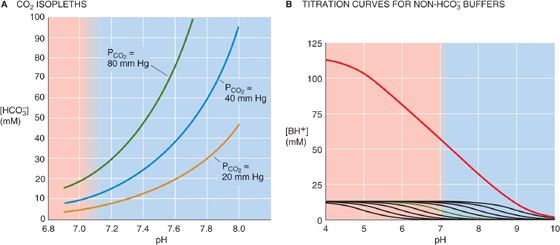
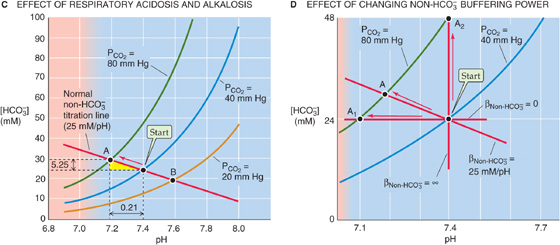
Figure 28-6 Davenport diagram. In A, the three isopleths are CO2 titration curves. In B, the solution contains nine buffers, each at a concentration of 12.6 mM and with pK values evenly spaced 0.5 pH unit apart, as in Figure 28-2B. In C, the red arrow represents the transition from a normal acid-base status (Start) for blood to respiratory acidosis (point A) produced by raising PCO2 to 80 mm Hg. Point B represents respiratory alkalosis produced by lowering PCO2 to 20 mm Hg. In D, the labeled points represent the results of respiratory acidosis when the non-HCO−3 buffering power βnon-HCO−3 is zero (point A1), 25 mM/pH (point A), and infinity (point A2).
Table 28-4 Relationship Between [HCO−3] and pH at Three Fixed Levels of PCO2
Non-HCO−3 Buffers The second of the two equations that we must solve simultaneously describes the lumped reaction of all non-HCO−3 buffers. To understand the origin of this equation, we begin with the green curve in Figure 28-6B, the titration curve of a single non-HCO−3 buffer with a pK of 7 and total buffer concentration of 12.6 mM (as for the green curve in Fig. 28-2B). At a pH of 10, [HB(n + 1)] for this single buffer is extremely low because almost all of the “B” is in the form B(n). As we lower pH by successively adding small amounts of HCl, [HB(n + 1)] gradually rises—most steeply when pH equals pK. Indeed, at any pH, the slope of this curve is the negative of β for this single buffer. The black curves in Figure 28-6B are the titration curves for eight other buffers, each present at a [TB] of 12.6 mM, with pK values evenly spaced at intervals of 0.5 pH unit on either side of 7. The red curve in Figure 28-6B is the sum of the titration curves for all nine buffers. Its slope—the negative of the total buffering power of all nine buffers—is remarkably constant over a broad pH range. (The red curve in Figure 28-2B shows how β, the slope of the red curve here in Figure 28-6B, varies with pH.) The red curve in Figure 28-6B represents the second of the two equations that we must solve simultaneously. (See Note: Davenport Diagram: Constructing the Non-HCO–3 Buffer Line)
Solving the Problem Figure 28-6C is a Davenport diagram, a combination of the three CO2 isopleths in Figure 28-6A and the linear part of the red non-HCO−3 titration curve in Figure 28-6B. The red non-HCO−3 titration line (representing βnon-HCO−3 for whole blood, 25 mM/pH unit) intersects with the CO2 isopleth for a PCO2 of 40 mm Hg at the point labeled Start, which represents the initial conditions for arterial blood. At this intersection, both CO2/HCO−3 and non-HCO−3 buffers are simultaneously in equilibrium.
We are now in a position to answer the question raised at the beginning of this section: What will be the final pH when we increase the PCO2 of whole blood from 40 to 80 mm Hg? The final equilibrium conditions for this case of respiratory acidosis must be described by a point that lies simultaneously on the red non-HCO−3 titration line and the green isopleth for 80 mm Hg. Obtaining the answer by use of the Davenport diagram requires a three-step process:
Step 1: Identify the point at the intersection of the initial PCO2 isopleth and the initial non-HCO−3 titration line (Fig. 28-6C, Start).
Step 2: Identify the isopleth describing the final PCO2 (80 mm Hg in this case).
Step 3: Follow the non-HCO−3 titration line to its intersection with the final PCO2 isopleth. In Figure 28-6C, this intersection occurs at point A, which corresponds to a pH of 7.19 and an [HCO−3] of 29.25 mM.
As discussed earlier, in the absence of non-HCO−3 buffers, this same doubling of PCO2 causes a larger pH decrease, from 7.4 to 7.1.
By following three similar steps, we can use the Davenport diagram to predict the final pH and [HCO−3] under conditions of a respiratory alkalosis. For example, what would be the effect of decreasing PCO2 by half, from 40 to 20 mm Hg? Follow the red non-HCO−3 titration line from Start to its intersection with the orange isopleth for a PCO2 of 20 mm Hg (point B), which corresponds to a pH of 7.60 and an [HCO−3] of 19 mM. If the solution had not contained non-HCO−3 buffers, halving of the PCO2 would have caused a larger pH increase, from 7.4 to 7.7.
Although it is reasonable to focus on CO2 during respiratory acid-base disturbances, it would be wrong to assume that [HCO−3] is constant. For example, in Figure 28-6C, where βnon-HCO−3 is 25 mM/pH unit, increasing PCO2 from 40 to 80 mm Hg causes [HCO−3] to increase from 24 to 29.25 mM. Thus, in each liter of solution, 5.25 mmol CO2 combines with 5.25 mmol H2O to form 5.25 mmol HCO−3 (which we see as the Δ[HCO−3] value between Start and A) and 5.25 mmol H+. Nearly all of this H+ disappears as nearly 5.25 mmol of the deprotonated non-HCO−3 buffers (B(n)) consumes H+ to form nearly 5.25 mmol of their conjugate weak acids (HB(n + 1)). Thus, the flux through the reaction sequence in Equation 28-28 is nearly 5.25 mmol for each liter of solution.
Thus, the non-HCO−3 buffers drive the conversion of CO2 to HCO−3. These buffers minimize the increase in free [H+] that a given flux of CO2 can produce. Thus, with a high βnon-HCO−3, a large amount of CO2 must “flux” through Equation 28-30 before the free concentrations of HCO−3 and H+ rise sufficiently to satisfy the CO2/HCO−3 equilibrium (Equation 28-14).
βnon-HCO−3 varies with the hemoglobin content of blood. Thus, patients with anemia have a low βnon-HCO−3, whereas patients with polycythemia have a high βnon-HCO−3.
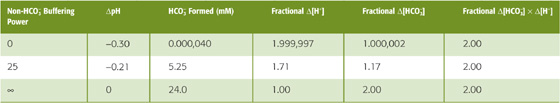
Figure 28-6D illustrates the importance of βnon-HCO−3. If βnon-HCO−3 is zero, the non-HCO−3 titration line is horizontal, and doubling of PCO2 from 40 to 80 mm Hg does not change [HCO−3] significantly (Fig. 28-6D, point A1), verifying our earlier conclusion (Fig. 28-5, stage 3A). Simultaneously, pH falls by 0.3, which corresponds to a near-doubling of [H+]. Thus, doubling of [CO2] leads to a doubling of the product [HCO−3] [H+], so that the ratio [HCO−3] [H+]/[CO2]—the equilibrium constant, K—is unchanged (Table 28-5, top row). Figure 28-6D also shows what happens if βnon-HCO−3 has the normal value of 25 mM/pH unit. Here, point A is the same as point A in Figure 28-6C, and it shows that [HCO−3] increases by 5.25 mM, or 17% (Table 28-5, middle row). Finally, if βnon-HCO−3 were ∞, the non-HCO−3 titration line would be vertical, and doubling of PCO2 would not change pH at all (point A2 in Fig. 28-6D). In this case, [HCO−3] would double, so that the doubling of the product [HCO−3]·[H+] would match the doubling of PCO2 (Table 28-5, bottom row).
Table 28-5 Relationship Between HCO−3 Buffering Power and the Amount of HCO3 Formed in Response to a Doubling of PCO2
Earlier, we examined the effect of adding HCl in the absence of other buffers (Fig. 28-3). Predicting the pH change for such an acid-base disturbance was straightforward because the titration of HCO−3 to CO2 consumed all buffered H+. The situation is more complex when the solution also contains non-HCO−3 buffers (Fig. 28-7, stage 1). When we add 10 mmol of HCl to 1 L of solution, the open-system CO2/HCO−3 buffer pair neutralizes most of the added H+, non-HCO−3 buffers handle some, and a minute amount of added H+ remains free and lowers pH (Fig. 28-7, stage 2A). Because the system is open, the CO2 formed during buffering of the added H+ escapes to the atmosphere. If this buffering reaction were occurring in the blood, the newly formed CO2 would escape first into the alveolar air and then into the atmosphere.
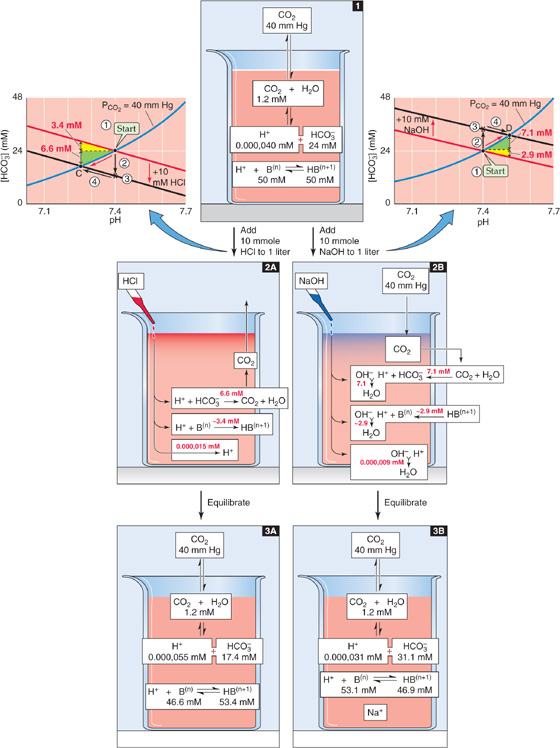
Figure 28-7 Metabolic acidosis and alkalosis in the presence of non-HCO−3 buffers. The red arrows in the Davenport diagrams represent the transition to metabolic acidosis (point C) and metabolic alkalosis (point D). This example differs from Figure 28-3, in which the solution contained no buffers other than CO2/HCO3.
How much of the added H+ (Δ[Strong acid] = 10 mM) follows each of the three pathways in this example of metabolic acidosis? Answering this question requires dealing with two competing equilibria, the CO2/HCO−3 and the non-HCO−3 buffering reactions. As for respiratory acid-base disturbances, we cannot precisely solve the equations governing metabolic acid-base disturbances. However, we can use the Davenport diagram on the left of Figure 28-7 to obtain a graphical estimate of the final pH and [HCO−3] through a four-step process:
Step 1: Identify the point describing the initial conditions (Fig. 28-7, Start, graph on left).
Step 2: Following the arrow labeled #2, move downward (in the direction of decreased [HCO−3]) by 10 mM—the concentration of added H+—to the point labeled *. In this maneuver, we assume that the reaction HCO−3 + H+ → CO2 + H2O has initially consumed all of the added H+. Of course, if this were true, the CO2/HCO−3 reaction would be far out of equilibrium and the pH would not have changed at all. Also, the non-HCO−3 buffers would not have had a chance to participate in the buffering of H+.
Step 3: Through *, draw a line (Fig. 28-7, black line on left) that is parallel to the non-HCO−3 titration line.
Step 4: Following the arrow labeled #4, move to the intersection of the new black line and the original PCO2 isopleth. In Figure 28-7, left, this intersection occurs at point C, which corresponds to a pH of 7.26 and an [HCO−3] of 17.4 mM. This maneuver tracks the reaction CO2 + H2O → HCO−3 + H+. Non-HCO−3 buffers consume nearly all of this H+ in the reaction H+ + B(n) → HB(n + 1). As a result, [HCO−3], [H+], and [HB(n + 1)] all rise and the system equilibrates.
As a shortcut, we could bypass the two black arrows and simply follow the red arrow along the CO2 isopleth from Start to point C.
We now can return to the question of how much of the added H+ follows each of the three pathways in Figure 28-7, stage 2A. Because [HCO−3] decreased by 24 − 17.4 = 6.6 mM, the amount of H+ buffered by CO2/HCO−3 must have been 6.6 mmol in each liter. Almost all of the remaining H+ that we added, nearly 3.6 mmol, must have been buffered by non-HCO−3 buffers. A tiny amount of the added H+, ~0.000,015 mmol, must have remained unbuffered and was responsible for decreasing pH from 7.40 to 7.26 (Fig. 28-7, stage 3A).
Figure 28-7 also shows what would happen if we added 10 mmol of a strong base such as NaOH to our 1-L solution. The open-system CO2/HCO−3 buffer pair neutralizes most of the added OH−, non-HCO−3 buffers handle some, and a minute amount of added OH− remains unbuffered, thus raising pH (Fig. 28-7, stage 2B). The Davenport diagram on the right of Figure 28-7 shows how much of the added OH− follows each of the three pathways in this example of metabolic alkalosis. The approach is similar to the one we used earlier for metabolic acidosis, except that in this case, we generate a new black line that is displaced 10 mM above the non-HCO−3 titration line. We follow the PCO2 isopleth to its intersection with this black line at point D, which corresponds to a final pH of 7.51 and an [HCO−3] of 31.1 mM. Thus, [HCO−3] rose by 31.1 − 24.0 = 7.1 mM. This is the amount of added OH− that CO2/HCO−3 buffered. Non-HCO−3 buffers must have buffered almost all of the remaining OH− that we added, ~2.9 mmol in each liter. The unbuffered OH−, which was responsible for the pH increase, must have been in the nanomolar range (Fig. 28-7, stage 3B).
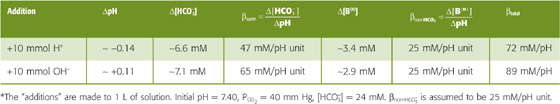
In Figure 28-7, CO2/HCO−3 neutralized 7.1 mmol of the 10 mmol of OH− added to 1 L (ΔpH = +0.11) but only 6.6 mmol of the added 10 mmol H+ (ΔpH = −0.14). The reason for this difference is that the buffering power of CO2/HCO−3 in an open system increases exponentially with pH (Fig. 28-4, blue curve). In the Davenport diagram, this pH dependence of βopen appears as the slope of the CO2 isopleth, which increases exponentially with pH. Thus, adding alkali will always cause a smaller pH change than adding an equivalent amount of acid. In our example of metabolic alkalosis (Fig. 28-7, right), the mean βopen is (7.1 mM)/(0.11 pH unit) = 65 mM/pH unit in the pH range 7.40 to 7.51 (Table 28-6). On the other hand, in our example of metabolic acidosis (Fig. 28-7, left), the mean βopen is (6.6 mM)/(0.14 pH unit) = 47 mM/pH unit in the pH range 7.26 to 7.40, substantially less than in the more alkaline range. Because βnon-HCO−3 is 25 mM/pH unit over the entire pH range, βtotal is greater in the alkaline pH range.
Table 28-6 Buffering Produced by CO2/HCO−3 and Non-HCO−3 Buffers*
We have already seen that βopen is proportional to [HCO−3] (see Equation 28-20) and that—at a fixed pH—[HCO−3] is proportional to PCO2 (see Equation 28-29). Thus, other things being equal, the contribution of βopen to total buffering increases with PCO2. Patients with a high PCO2 due to respiratory failure will therefore have a higher buffering power than normal individuals at the same pH.
Because CO2/HCO−3 and non-HCO−3 buffers compete for added OH− or H+, the contribution of CO2/HCO−3 to total buffering also depends on βnon-HCO−3. Figure 28-8 illustrates the effects of adding 10 mmol NaOH to our standard 1-L CO2/HCO−3 solution at βnon-HCO−3 values of 0, 25 mM/pH unit, and ∞. We saw in Figure 28-3 (stage 3B) that adding 10 mmol NaOH to a 1-L solution containing CO2/HCO−3 but no other buffers causes [HCO−3] to increase from 24 to 34 mM and pH to increase from 7.40 to 7.55. To use a Davenport diagram to solve the same problem (Fig. 28-8A), we generate a non-HCO−3 titration line, with slope of zero (because βnon-HCO−3 = 0), through the Start point. We also draw a black line with the same slope but displaced 10 mM higher. Following the blue PCO2 = 40 mm Hg isopleth from Start to the point where the isopleth intersects with the black line at point D1, we see that—as expected—the final pH is 7.55 and the final [HCO−3] is 34 mM. Thus, CO2/HCO−3 must buffer virtually all 10 mmol of OH− added to 1 L. Because the total buffering power is simply βopen, the pH increase must be rather large, 0.15.
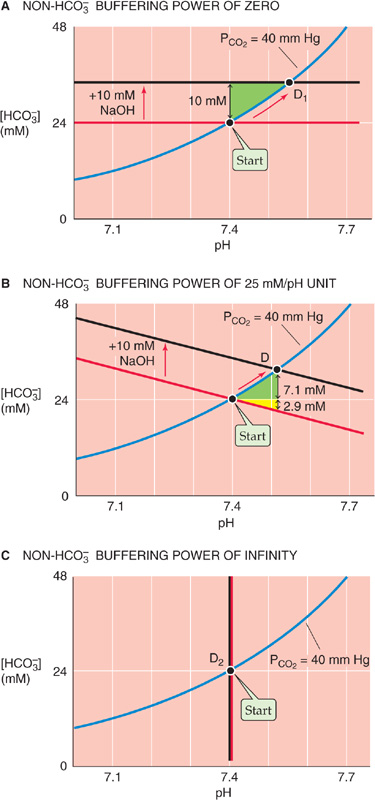
Figure 28-8 The effect of non-HCO−3 buffering power on the pH increase caused by metabolic alkalosis.
When βnon-HCO−3 is 25 mM/pH unit, as in the Davenport diagram on the upper right panel of Figure 28-7 (replotted in Fig. 28-8B), CO2/HCO−3 can buffer only 7.1 mmol because the non-HCO−3 buffers neutralize 2.9 mmol. With the increased total buffering power, the pH increase is only 0.11.
Finally, when βnon-HCO−3 is ∞, the black line lies right on top of the vertical non-HCO−3 titration line (Fig. 28-8C). Thus, neither [HCO−3] nor pH changes at all. However, [HB(n + 1)] increases by 10 mM because the infinitely powerful non-HCO−3 buffers do all of the buffering.
This set of three examples—for βnon-HCO−3 values of 0, 25 and ∞—is comparable to the set that we discussed earlier for respiratory acidosis in Figure 28-6D.
Thus far, we have considered what happens during primary respiratory and metabolic acid-base disturbances. When it is challenged by such acid or alkaline loads in the blood plasma, the body compensates by altering [HCO−3] or PCO2, returning pH toward its initial value and minimizing the magnitude of the overall pH change.
In Figure 28-9A we revisit an example, originally introduced in Figure 28-6C, in which we produced a primary respiratory acidosis by increasing PCO2 from 40 to 80 mm Hg (red arrow in Figure 28-9A between Start and point A at pH 7.19). If the high PCO2 persists, the only way we can restore pH toward its initial value of 7.40 is to add an alkali (e.g., HCO−3 or OH−) or to remove an acid (e.g., H+), which are equivalent. Adding 10 mmol of OH− to 1 L, for example, superimposes a metabolic alkalosis on the primary respiratory acidosis—a metabolic compensation to respiratory acidosis. (See Note: Equivalency of Adding HCO–3, Adding OH–, or Removing H+)
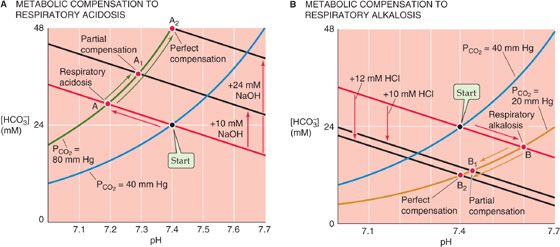
Figure 28-9 Metabolic compensation to primary respiratory acid-base disturbances.
The Davenport diagram predicts the consequences of adding 10 mmol of OH− to 1 L. We start by generating a black line that is parallel to the red non-HCO−3 titration line but displaced upward by 10 mM. Point A1, the intersection of the black line and the PCO2 isopleth for 80 mm Hg, represents a final pH of 7.29, still lower than the normal 7.40 but much higher than the 7.19 prevailing before compensation.
If we add an additional 14 mmol OH−, for a total addition of 24 mmol OH− to 1 L, pH returns to exactly its initial value of 7.40 (point A2 in Fig. 28-9A). In other words, we can perfectly compensate for doubling of PCO2 from 40 mm Hg (Start) to 80 mm Hg (point A) by adding an amount of OH− equivalent to the amount of HCO−3 that was present (i.e., 24 mM) at Start. Perfect compensation of respiratory acidosis is an example of isohydric hypercapnia (i.e., the same pH at a higher PCO2):
The kidneys are responsible for the metabolic compensation to a primary respiratory acidosis. They acutely sense high PCO2 and may also chronically sense low blood pH. The response is to increase both the secretion of acid into the urine and the transport of HCO−3 into the blood (see Chapter 39), thereby raising plasma pH—a compensatory metabolic alkalosis. The renal compensation to a substantial respiratory acidosis is not perfect, so that pH remains below the normal value of 7.40.
The kidneys can also perform a metabolic compensation to a respiratory alkalosis. In Figure 28-9B we revisit a second example, originally introduced in Figure 28-6C, in which we produced a primary respiratory alkalosis by decreasing PCO2 from 40 to 20 mm Hg (red arrow in Figure 28-9B between Start and point B at pH 7.60). We can compensate for most of this respiratory alkalosis by adding 10 mmol of H+ to each liter of solution or by removing 10 mmol NaHCO3 or NaOH, which produces the same effect. A black line is generated parallel to the red non-HCO−3 titration line but displaced downward by 10 mM. Point B1 (pH 7.44), at the intersection of the black line and the PCO2 isopleth for 20 mm Hg, represents a partial compensation.
If we add an additional 2 mmol H+, for a total addition of 12 mmol of H+ to each liter, pH returns to exactly its initial value of 7.40 (point B2 in Fig. 28-9B). Why is this amount so much less than the 24 mmol of OH− that we added to each liter to compensate perfectly for a doubling of PCO2? When we halve PCO2, we need only add an amount of H+ equivalent to half the amount of HCO−3 that was present (24/2 = 12 mM) at Start.
In response to a primary respiratory alkalosis, the kidneys secrete less acid into the urine and transport less HCO−3 into the blood (see Chapter 39), thereby lowering plasma pH—a compensatory metabolic acidosis.
Just as metabolic changes can compensate for respiratory disturbances, respiratory changes can compensate for metabolic ones. In Figure 28-10A we return to an example originally introduced on the left of Figure 28-7, in which we produced a primary metabolic acidosis by adding 10 mmol of HCl to 1 L of arterial blood (red arrow in Fig. 28-10A between Start and point C at pH 7.26). Other than by removing the H+ (or adding OH− to neutralize the H+), the only way we can restore pH toward the initial value of 7.40 is to lower PCO2. That is, we can superimpose a respiratory alkalosis on the primary metabolic acidosis—a respiratory compensation to a metabolic acidosis. For example, we can compensate for most of the metabolic acidosis by reducing PCO2 from 40 to 30 mm Hg. Starting at C, follow the black line from the PCO2 isopleth for 40 mm Hg to the new isopleth for 30 mm Hg at point C1 (pH 7.34). This maneuver represents a partial compensation.
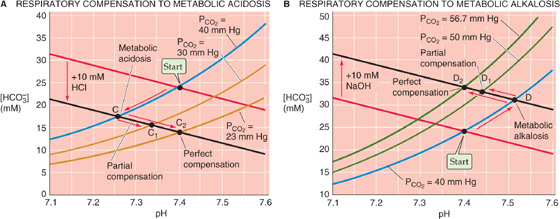
Figure 28-10 Respiratory compensation to primary metabolic acid-base disturbances.
If we reduce PCO2 by an additional 6.6 mm Hg to 23.4 mm Hg, we produce a perfect compensation, which we represent in Figure 28-10A by following the black line from C until we reach pH 7.40 at point C2, which is on the PCO2 isopleth for 23.4 mm Hg. Perfect compensation requires that we reduce PCO2 by a fraction (i.e., [40 − 23.4]/40 ≅ 0.42) that is identical to the ratio of added HCl to the original [HCO−3] (i.e., 10/24 ≅ 0.42).
Not surprisingly, the respiratory system is responsible for the respiratory compensation to a primary metabolic acidosis. The low plasma pH or [HCO−3] stimulates the peripheral chemoreceptors and, if sufficiently long-standing, also the central chemoreceptors. (See Chapter 32.) The result is an increase in alveolar ventilation, which lowers PCO2 (see Chapter 31) and thus provides the respiratory compensation.
The body achieves a respiratory compensation to a primary metabolic alkalosis in just the opposite manner. In Figure 28-10B we revisit an example originally presented in the right of Figure 28-7, in which we produced a primary metabolic alkalosis by adding 10 mmol of NaOH to 1 L (red arrow in Fig. 28-10B between Start and point D at pH 7.51). If we now increase PCO2 from 40 to 50 mm Hg, we partially compensate for the metabolic alkalosis by moving from D to D1 (pH 7.44). If we raise PCO2 by an additional 6.7 mm Hg to ~56.7 mm Hg, the compensation is perfect, and pH returns to 7.40 (D2).
In response to a primary metabolic alkalosis, the respiratory system decreases alveolar ventilation and thereby raises PCO2. The compensatory respiratory acidosis is the least “perfect” of the four types of compensation we have discussed. The reason is that one can decrease alveolar ventilation—and thus oxygenation—only so far before compromising one’s very existence.
In a real person, each of the four primary acid-base disturbances—points A, B, C, and D in Figures 28-9 and 28-10—occurs in the extracellular fluid. In each case, the body’s first and almost instantaneous response is to use extracellular buffers to neutralize part of the acid or alkaline load. In addition, cells rapidly take up some of the acid or alkaline load and thus participate in the buffering, as discussed later. Furthermore, renal tubule cells may respond to a metabolic acidosis of extrarenal origin (e.g., diabetic ketoacidosis) by increasing acid secretion into the urine or to a metabolic alkalosis (e.g., NaHCO3 therapy) by decreasing acid secretion—examples of metabolic compensation to a metabolic disturbance. Points C and D in Figure 28-10 include the effects of the actual acid or alkaline load, extracellular and intracellular buffering, and any renal (i.e., metabolic) response.
The only tools needed to characterize acid-base status (i.e., pH, [HCO−3], and PCO2) are a Davenport diagram and electrodes for measurement of pH and PCO2. From these last two parameters, we can compute [HCO−3] by use of the Henderson-Hasselbalch equation. The acid-base status of blood plasma—or of any aqueous solution—must fall into one of five major categories:
1. Normal. For arterial blood, pH is 7.40, [HCO−3] is 24 mM, and PCO2 is 40 mm Hg. This point was Start in the previous figures and is the central point in Figure 28-11A–D.
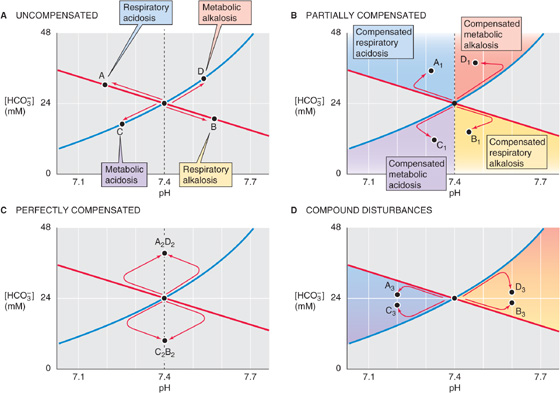
Figure 28-11 Acid-base states represented by position on a Davenport diagram.
2. One of the four primary (or uncompensated) acid-base disturbances. The coordinates for pH and [HCO−3] fall on either of the following: the non-HCO−3 titration line but off the 40 mm Hg isopleth for uncompensated respiratory acidosis (point A, Fig. 28-11A) or alkalosis (point B); or the 40 mm Hg isopleth but off the non-HCO−3 titration line for an uncompensated metabolic acidosis (point C) or alkalosis (point D).
3. A partially compensated disturbance. The coordinates for pH and [HCO−3] fall in any of the four colored regions of Figure 28-11B. For example, point A1 in the blue region represents a partially compensated respiratory acidosis. In a subject for whom a respiratory acidosis has existed for longer than a few hours, increased renal H+ excretion has probably already begun producing a metabolic compensation. Depending on the extent of the original acidosis and the degree of compensation, point A1 could lie anywhere in the blue region. We can reach similar conclusions for the other three disturbances and compensations.
4. A perfectly compensated disturbance. The point falls on the vertical line through pH 7.4. As indicated by point A2D2 in Figure 28-11C, a perfect compensation following respiratory acidosis is indistinguishable from that following metabolic alkalosis. In either case, the final outcome is isohydric hypercapnia. Similarly, point B2C2 represents a perfect compensation from either metabolic acidosis or respiratory alkalosis (isohydric hypocapnia).
5. A compound respiratory-metabolic disturbance. The point falls in one of the two colored regions in Figure 28-11D. For example, points A3 and C3 represent a respiratory acidosis complicated by metabolic acidosis, or vice versa. The second disturbance causes the pH to move even farther away from “normal,” as might occur in an individual with both respiratory and renal failure (Table 28-3). Of course, it is impossible to determine if one of the two compounding disturbances developed before the other.
Clinicians focus on the acid-base status of blood plasma, the fluid compartment whose acid-base status is easiest to assess. However, the number of biochemical reactions and other processes that occur outside a cell pales in comparison to the number of those that occur inside. It stands to reason that the most important biological fluid for pH regulation is the cytosol. It is possible to monitor intracellular pH (pHi) continuously in isolated cells and tissues by use of pH-sensitive dyes or microelectrodes. Moreover, with magnetic resonance techniques, one can monitor pHi in living humans (e.g., skeletal muscle). The pH of cells both influences and is influenced by extracellular pH.
Figure 28-12A shows a hypothetical cell with two acid-base transporters, a Na-H exchanger, and a Cl-HCO3 exchanger. We will use the Na-H exchanger as a prototypic acid extruder, a transporter that tends to raise intracellular pH (pHi). The Na-H exchanger uses the energy of the Na+ gradient to move H+ out of the cell. We will take the Cl-HCO3 exchanger as a prototypic acid loader. This exchanger, driven by the steep out-to-in Cl− gradient, moves HCO−3 out of the cell. The intracellular acid loading produced by Cl-HCO3 exchange is a chronic acid load because it tends to acidify the cell as long as the transporter is active. In our example, the chronic acid extrusion through Na-H exchange balances the chronic acid loading through Cl-HCO3 exchange, producing a steady state. In real cells, several other acid extruders and acid loaders may contribute to pHi regulation. (See Chapter 5.)
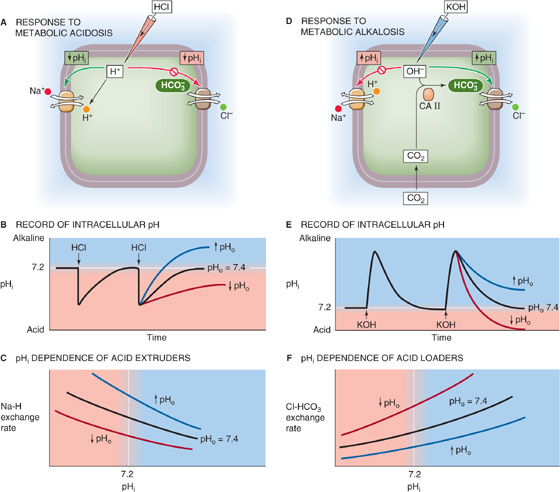
Figure 28-12 Recovery of a cell from intracellular acid and alkali loads.
Imagine that we use a micropipette to inject HCl into the cell in Figure 28-12A. This injection of an acute acid load—a one time–only introduction of a fixed quantity of acid—causes an immediate fall in pHi (Fig. 28-12B, black curve), an example of intracellular metabolic acidosis. If we add HCl to a beaker, the pH remains low indefinitely. However, when we acutely acid load a cell, pHi spontaneously recovers to the initial value. This pHi recovery cannot be due to passive H+ efflux out of the cell, inasmuch as the electrochemical gradient for H+ (see Chapter 5) usually favors H+ influx. Hence, the pHi recovery reflects the active transport of acid from the cell—a metabolic compensation to a metabolic acid load. (See Note: Acid Extruders and Acid Loaders in a Cell)
During the recovery of pHi from the acid load in Figure 28-12B, the Na-H exchanger not only must extrude the quantity of H+ previously injected into the cell (the acute acid load), it also must counteract whatever acid loading the Cl-HCO3 exchanger continues to impose on the cell (the chronic acid load).
Acid extrusion rates tend to be greatest at low pHi values and fall off as pHi approaches its resting value (Fig. 28-12C, black curve). As discussed later, low pHi also inhibits Cl-HCO3 exchange and thus acid loading. The response to low pHi therefore involves two feedback loops operating in push-pull fashion, stimulating acid extrusion and inhibiting acid loading.
In addition to pHi, hormones, growth factors, oncogenes, cell volume, and extracellular pH (pHo) all can modulate these transporters. The pHo effect is especially important. In general, a low pHo slows the rate of pHi recovery from acute acid loads and reduces the final steady-state pHi (Fig. 28-12B, red curve), whereas a high pHo does the opposite (blue curve). The underlying cause of these pHo effects is a shift of the pHi dependence of acid extrusion (Fig. 28-12C, red and blue curves) and, as we shall see, changes in acid loading.
Cells also spontaneously recover from acute alkaline loads. If we inject a cell with potassium hydroxide (KOH; Fig. 28-12D), pHi rapidly increases but then slowly recovers to its initial value (Fig. 28-12E, black curve), reflecting stimulation of acid loading and inhibition of acid extrusion. The injection of OH− represents a metabolic alkalosis, whereas increased Cl-HCO3 exchange represents a metabolic compensation. The Cl-HCO3 exchanger is most active at high pHi values (Fig. 28-12F). As discussed previously, increases in pHi generally inhibit acid extruders. Thus, the response to alkaline loads—like the response to acid loads—includes dual feedback loops operating in push-pull fashion, stimulating acid loading and inhibiting acid extrusion. During the pHi recovery from an acute alkaline load, Cl-HCO3 exchange must not only neutralize the alkali previously injected into the cell (the acute alkali load) but also counteract the alkalinizing effect of acid extruders such as the Na-H exchanger. (See Note: Acid Extruders and Acid Loaders in a Cell)
Like the Na-H exchanger, the Cl-HCO3 exchanger is under the control of hormones and growth factors. It also probably has a pHo sensitivity that is opposite to that of the acid extruders, with low pHo enhancing Cl-HCO3 exchange. In general, an extracellular metabolic acidosis, with its simultaneous fall in both pHo and [HCO−3] (Table 28-3), should stimulate Cl-HCO3 exchange (Fig. 28-12F, red curve). During the recovery from acute alkali loads, metabolic acidosis therefore causes pHi to fall more rapidly and to reach a lower steady-state value (Fig. 28-12E, red curve).
Clinicians have long known that extracellular acidosis leads to a release of K+ from cells and thus hyperkalemia. Conversely, hyperkalemia leads to the exit of H+ from cells, resulting in extracellular acidosis. These observations, which one can duplicate at the level of single cells, led to the suggestion that cells generally have a K-H exchanger. It is true that specialized cells in the stomach (see Chapter 42) and kidney (see Chapter 39) do have an ATP-driven pump that extrudes H+ in exchange for K+. Moreover, the K/HCO3 cotransporter described in certain cells could mimic a K-H exchanger. Nevertheless, the effects that long ago led to the K-H exchange hypothesis probably reflect indirect interactions of H+ and K+.
One example of apparent K-H exchange is that hyperkalemia causes an intracellular alkalosis. Not only is this effect not due to a 1 : 1 exchange of K+ for H+, it is not even due to the increase in [K+]o per se. Instead, the high [K+] o depolarizes the cell, and this positive shift in membrane voltage can promote the net uptake of HCO−3 through the electrogenic Na/HCO3 cotransporter (see Chapter 5) and thus a rise in pHi—a depolarization-induced alkalinization. Depolarization also can indirectly stimulate other transporters that alkalinize the cell. We discuss the converse example of acidemia causing hyperkalemia in Chapter 37: extracellular acidosis lowers pHi and inhibits transporters responsible for K+ uptake, leading to net K+ release from cells. Although we have no evidence that a K-H exchanger exists in humans, imagining that it exists is sometimes a helpful tool for quickly predicting interactions of H+ and K+ in a clinical setting.
By definition, acid extrusion (e.g., Na-H exchange) equals acid loading (e.g., Cl-HCO3 exchange) in the steady state. Disturbing this balance shifts pHi. For example, extracellular metabolic acidosis inhibits acid extrusion and stimulates acid loading, thus lowering steady-state pHi. This intracellular acidosis is not instantaneous but develops during a few minutes. Conversely, extracellular metabolic alkalosis leads to a slow increase in steady-state pHi. In general, a change in pHo shifts pHi in the same direction, but ΔpHi is usually only 20% to 60% of ΔpHo. In other words, an extracellular metabolic acidosis causes a net transfer of acid from the extracellular to the intracellular space, and an extracellular metabolic alkalosis has the opposite effect. Thus, cells participate in buffering of extracellular acid and alkali loads.
Extracellular respiratory acidosis generally affects pHi in three phases. First, the increase in extracellular [CO2]Dis creates an inwardly directed gradient for CO2. This dissolved gas rapidly enters the cell (Fig. 28-13A) and produces HCO−3 and H+. This intracellular respiratory acidosis manifests itself as a rapid fall in pHi (Fig. 28-13B, phase 1 in lower panel). Carbonic anhydrase greatly accelerates the formation of HCO−3 and H+ from CO2, so that pHi can complete its decline in just a few seconds.
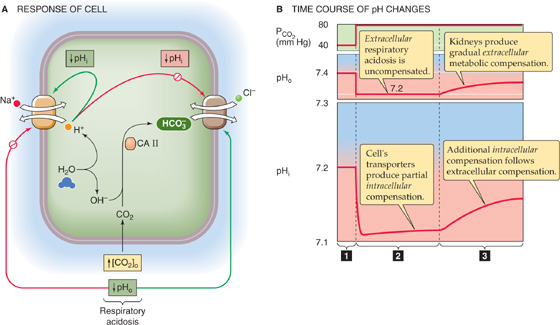
Figure 28-13 Response of cell to extracellular respiratory acidosis. In A, respiratory acidosis sends conflicting messages to the acid-base transporters. The rise in [CO2] leads to a fall in intracellular pH (pHi), which stimulates the Na-H exchanger but inhibits the Cl-HCO3 exchanger—tending to cause pHi to recover. However, the low extracellular pH (pHo) directly inhibits the Na-H exchanger but stimulates the Cl-HCO3 exchanger. In B, the influx of CO2 produces a rapid intracellular metabolic acidosis (1). The low pHo initially hampers the ability of the cell to recover from the acid load (2). The delayed recovery of pHo, through its effects on the transporters, leads to an additional recovery of pHi as well (3).
In the second phase, the cell recovers from this acid load, but only feebly (Fig. 28-13B, phase 2 in lower panel) because the decrease in pHo inhibits acid extrusion and stimulates acid loading. During a period of minutes, pHi may recover only partially if at all.
In the third phase, the extracellular respiratory acidosis stimulates the kidneys to upregulate acid-base transporters and thus stimulate urinary acid secretion (see Chapter 39). The net effect, during a period of hours or days, is an extracellular metabolic compensation that causes pHo to increase gradually (Fig. 28-13B, phase 3 in upper panel). As pHo rises, it gradually relieves the inhibition of Na-H exchange and other acid extruders and cancels the stimulation of Cl-HCO3 exchange and other acid loaders. Thus, intracellular pH recovers in parallel with extra cellular pH, albeit by only 20% to 60% as much as pHo (Fig. 28-13B, phase 3 in lower panel). The pHi recovery represents an intracellular metabolic compensation to the intracellular respiratory acidosis.
Not all cell types have the same resting pHi. Moreover, different cell types often have very different complements of acid-base transporters and very different ways of regulating these transporters. Nevertheless, the example in Figure 28-13 illustrates that the fate of pHi is closely intertwined with that of interstitial fluid and thus blood plasma. During respiratory acid-base disturbances, the lungs generate the insult, and virtually every other cell in the body must defend itself against it. In the case of metabolic acid-base disturbances, however, some cells may generate the insult, whereas the others attempt to defend themselves against it. From a teleological point of view, one can imagine that the primary reason that the body regulates the pH of the blood plasma and extracellular fluids is to allow the cells to properly regulate their pHi. The primary reason that the clinical assessment of blood acid-base parameters can be useful is that these parameters tend to parallel cellular acid-base status.
Books and Reviews
Bevensee MO, Alper S, Aronson PS, Boron WF: Control of intracellular pH. In Seldin DW, Giebisch G (eds). The Kidney: Physiology and Pathophysiology, 3rd ed, Philadelphia: JB Lippincott, 2000: 391-442.
Davenport HW: The ABC of Acid Base Chemistry, 6th ed. Chicago: University of Chicago Press, 1974.
Mount DB, Romero MF: The SLC26 gene family of multifunctional anion exchangers. Pflügers Arch 2004; 447:710-721.
Orlowski J, Grinstein S: Diversity of the mammalian sodium/proton exchanger SLC9 gene family. Pflügers Arch 2004; 447:549-565.
Romero MF, Fulton CM, Boron WF: The SLC4 family of HCO−3 transporters. Pflügers Arch 2004; 447:495-509.
Roos A, Boron WF: Intracellular pH. Physiol Rev 1981; 61:296-434.
Journal Articles
Boron WF, De Weer P: Intracellular pH transients in squid giant axons caused by CO2, NH3, and metabolic inhibitors. J Gen Physiol 1976; 67:91-112.
Thomas RC: The effect of carbon dioxide on the intracellular pH and buffering power of snail neurones. J Physiol 1976; 255:715-735.
Zhao J, Hogan EM, Bevensee MO, Boron WF: Out-of-equilibrium CO2/HCO−3 solutions and their use in characterizing a novel K/HCO3 cotransporter. Nature 1995; 374:636-639.