CHAPTER 58
Gerald I. Shulman and Kitt Falk Petersen
The body’s metabolism encompasses all the chemical processes involved in energy production, energy release, and growth. These processes can be anabolic (formation of substances) or catabolic (breakdown). Ultimately, all energy contained in ingested nutrients manifests as heat, work done on the environment, or growth. A healthy young man requires ~30 kcal/kg body weight to sustain resting metabolism for 1 day. Thus, a 70-kg human requires 2100 kcal/day, an amount known as the resting metabolic rate (RMR). The number of calories rises with increased activity, illness, or other stress. For example, the metabolic rate can rise 2-to 3-fold with exposure to a cold environment or during the performance of heavy exercise. The basal metabolic rate (BMR) is a clinical definition for metabolism that is measured under standardized conditions in which the subject (1) has had a full night of restful sleep, (2) has been fasting for 12 hours, (3) is in a neutral thermal environment (see Chapter 59), (4) has been resting physically for 1 hour, and (5) is free of psychic and physical stimuli. The BMR (units: kcal per hour and per square meter of body surface area) in adults is ~5% higher for male than for female subjects and falls with age. The BMR is less than the RMR.
Regulation of energy metabolism in humans involves a complex interplay among ingested nutrients, hormones, and interorgan exchanges of substrates to maintain a constant and adequate supply of fuel for all organs of the body. Because energy acquisition by the body is intermittent, whereas energy expenditure is continuous, the body needs to store and then parcel out energy in a carefully coordinated fashion. Insulin (see Chapter 51) is the key hormone that orchestrates this exchange and distribution of substrates between tissues under fed and fasting conditions. Glucagon and catecholamines (see Chapter 51), cortisol (see Chapter 50), and growth hormone (see Chapter 48) play major roles in energy regulation at times of acute energy needs, which occur during exercise, in conditions of stress, or in response to hypoglycemia. The major organs involved in fuel homeostasis are as follows: (1) the liver, which is normally the only major producer of glucose; (2) the brain, which in the fed state or early in the fasted state is a near-obligate glucose consumer; and (3) the muscle and adipose tissue, which respond to insulin and store energy in the form of glycogen and fat, respectively. The purpose of this chapter is to review how humans use energy and the means by which the body manages its energy stores during times of feeding, fasting, and exercise. (See Note: Role of Kidney in Fuel Homeostasis)
Virtually all energy that sustains human life is derived directly or indirectly from breaking of carbon-carbon bonds, which are created in plants during photosynthesis. Cellulose, the principal form of this stored energy in the biosphere, consists of polymers of glucose joined by β-1, 4 linkages that we cannot digest (see Chapter 45). However, ruminants can degrade cellulose to glucose because they have cellulose-producing bacteria in their digestive tracts. Humans obtain their energy from food in three forms: (1) carbohydrates, (2) proteins, and (3) lipids. Moreover, each form consists of building blocks: monosaccharides (glucose, fructose, and galactose) for carbohydrates, amino acids for proteins, and fatty acids (FAs) for lipids.
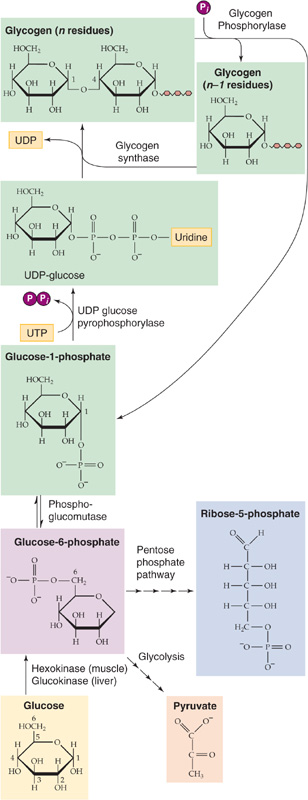
Carbohydrates, which exist in the body mainly in the form of glucose, contain 4.1 kcal/g of energy. The major storage form is glycogen, a polymer of glucose (106 to 108 Da) that consists of glucose molecules linked together by α-1, 4 linkages in the straight portions of the polymer (Fig. 58-1) and by α-1, 6 linkages at the frequent branch points (see Fig. 45-3). Virtually all cells of the body store glycogen; the highest concentrations occur in liver and muscle. Cells store glycogen in cytoplasmic granules that also contain the enzymes needed for glycogen synthesis and degradation, Glycogen is highly hydrophilic; 1 to 2 g of water is stored with each gram of glycogen, thus providing a handy storage depot for glucose without affecting the osmotic pressure of the intracellular space. However, this packaging of glycogen with water makes glycogen a relatively inefficient means of storing energy because it yields only 1 to 2 kcal for each gram of hydrated glycogen instead of the theoretical 4.1 kcal/g of dry carbohydrate. In contrast to the other potential stored forms of energy (lipid and protein), the liver can quickly break down glycogen by glycogenolysis to provide glucose for the brain during hypoglycemia. Muscle can quickly break down glycogen to glucose-6-phosphate (G6P) to provide the energy necessary to run a high-intensity anaerobic sprint.
Figure 58-1 Glycogen synthesis and glycogenolysis. After entering a liver or skeletal muscle cell, glucose is immediately phosphorylated to G6P, which can have three fates: glycolysis, breakdown through the pentose phosphate shunt, and glycogen synthesis. Glycogenolysis directly yields G1P and is thus not simply the reverse of glycogen synthesis. (See Note: Glycogen Supercompensation)
The liver normally contains 75 to 100 g of glycogen but can store up to 120 g (8% of its weight) as glycogen. Muscle stores glycogen at much lower concentrations (1% to 2% of its weight). However, because of its larger mass, skeletal muscle has the largest store of glycogen in the body (300 to 400 g). A typical 70-kg human has up to ~700 g of glycogen (~1% of body weight). Thus, the total energy stored in the body in the form of glycogen can be nearly 3000 kcal (Table 58-1), which is still only a tiny fraction of that stored in the form of lipid, enough to supply resting metabolism for less than a day and a half, assuming 100% efficiency. Nonetheless, carbohydrate stores are essential because certain tissues, particularly the brain, rely heavily on carbohydrates for their fuel. Whereas muscle contains the largest store of glycogen in the body, this pool of glycogen cannot contribute directly to blood glucose in response to hypoglycemia because muscles lack G6Pase, which is necessary to convert G6P derived from glycogenolysis to glucose. Instead, the primary role of muscle glycogen is to supply energy locally for muscle contraction during intense exercise. (See Note: The Pentose Phosphate Pathway and Shunt)
Table 58-1 Energy of Body Stores
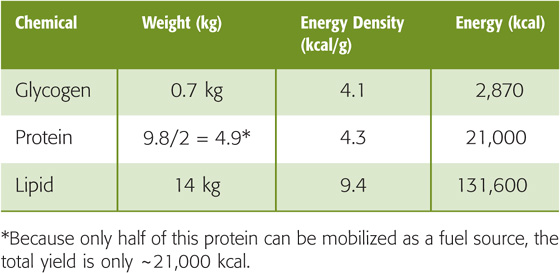
Proteins are linear polymers of L-amino acids (Fig. 58-2), which have the general molecular structure +H3N—HC(R)—COO−. Different functional R groups distinguish the 20 amino acids incorporated into nascent proteins during mRNA translation. In addition, four other amino acids are present in mature proteins: γ-carboxyglutamic acid, hydroxylysine, 4-hydroxyproline, and 3-hydroxyproline. However, these amino acids result from post-translational modification of amino acids that are already in the polypeptide chain. In α-amino acids, the amino group (—NH+3), the carboxyl group (—COO−), and R all attach to the central or α-carbon atom. In proteins, the amino acids are linked together by peptide bonds that join the α-amino group of one amino acid with the α-carboxyl group of another. Nine of the amino acids are termed essential amino acids (Table 58-2) because the body cannot synthesize them at rates sufficient to sustain growth and normal functions. Thus, we must obtain these amino acids in the diet. Proteins contain 4.3 kcal/g, which is approximately the same as carbohydrates. A typical 70-kg human with 14% protein (9.8 kg)—only about half of which is available as a fuel source—can thus store ~21,000 kcal (Table 58-1) in the form of available protein—which could potentially provide ~10 days’ worth of energy. Unlike carbohydrate, protein is not a primary energy reserve in human. Instead, proteins serve other important structural and functional roles. Structural proteins make up skin, collagen, ligaments, and tendons. Functional proteins include enzymes that catalyze reactions, muscle filaments such as myosin and actin, and various hormones. The body constantly breaks down proteins to amino acids, and vice versa, thereby allowing cells to change their protein make-up as demands change. Thus, it is not surprising that protein catabolism makes only a small contribution—much less than 5%—to normal resting energy requirements. In contrast, during starvation, when carbohydrate reserves are exhausted, protein catabolism can contribute as much as 15% of the energy necessary to sustain the resting metabolic requirements by acting as major substrates for gluconeogenesis (see later).
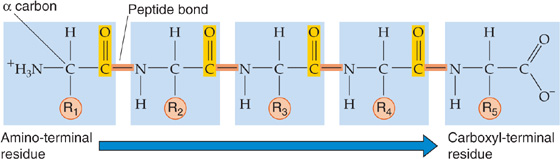
Figure 58-2 Structure of proteins. The chemistry of R determines the identity of the amino acid.
Table 58-2 Essential and Nonessential α-Amino Acids
Essential |
Nonessential |
Histidine |
Alanine |
Isoleucine |
Arginine |
Leucine |
Asparagine |
Lysine |
Aspartate |
Methionine |
Cysteine |
Phenylalanine |
Glutamate |
Threonine |
Glutamine |
Tryptophan |
Glycine |
Valine |
Proline |
|
Serine |
|
Tyrosine |
In the healthy human adult who is eating a weight-maintaining diet, amino acids derived from ingested protein replenish those proteins that have been oxidized in normal daily protein turnover. Once these protein requirements have been met, the body first oxidizes excess protein to CO2 and then converts the remainder to glycogen or triacylglycerols (TAGs).
Lipids are the most concentrated form of energy storage because they represent, on average, 9.4 kcal/g. Lipids are dietary substances that are soluble in organic solvents but not in water and typically occur in the form of TAGs (Fig. 58-3A). The gastrointestinal (GI) tract breaks down ingested TAGs (see Chapter 45) into FAs and 2-monoacylglycerols (Fig. 58-3B). FAs are composed of long carbon chains (14 to 24) with a carboxyl terminus, and they can be either saturated with hydrogen atoms or unsaturated (i.e., double bonds may connect one or more pairs of carbon atoms). When fully saturated, FAs have the general form CH3—(CH2)n—COOH (Fig. 58-3C).
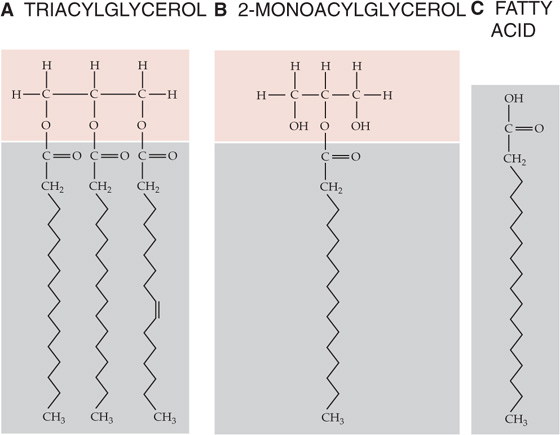
Figure 58-3 Structures of TAGs and FAs.
In contrast to glycogen and protein, fat is stored in a nonaqueous environment and therefore yields energy very close to its theoretical 9.4 kcal/g of TAGs. This greater efficiency of energy storage provided by fat is crucial for human existence in that it allows for greater mobility and promotes survival during famine. Therefore, although humans have two large storage depots of potential energy (protein and fat), fat serves as the major expendable fuel source. Most of the body’s fat depots exist in the subcutaneous adipose tissue layers, although fat also exists to a small extent in muscle and in visceral (deeper) depots in obese individuals. A typical 70-kg human with 20% fat (14 kg) thus carries 131,600 kcal of energy stored in adipose tissue (Table 58-1). Assuming an RMR of 2100 kcal/day and 100% efficiency of converting the fat to energy, mobilization and subsequent oxidation of this entire depot could theoretically sustain the body’s entire resting metabolic requirement for nearly 9 weeks.
The first law of thermodynamics states that energy can neither be created nor destroyed; in a closed system, total energy is constant. This concept is illustrated in Figure 58-4. Humans acquire all their energy from ingested food, store it in different forms, and expend it in different ways. In the steady state, energy intake must equal energy output.
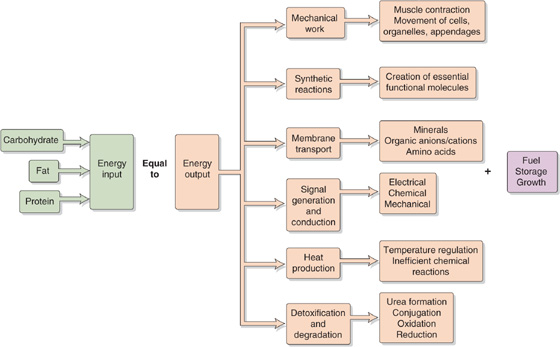
Figure 58-4 Energy balance.
The GI tract breaks down ingested carbohydrates, proteins, and fats into smaller components and then absorbs them into the bloodstream for transport to sites of metabolism (see Chapter 45). For example, the GI tract reduces ingested carbohydrates to simple sugars (e.g., glucose), which are then transported to muscle cells and are either oxidized to release energy or are converted to glycogen for storage. Oxidation of fuels generates not only free energy but also waste products and heat (thermal energy).
The body’s energy inputs must balance the sum of its energy outputs and the energy stored. When the body takes in more energy than it expends, the person is in positive energy balance and gains weight; in the case of adults, this gain is mostly in the form of fat. Healthy children are in positive energy balance during growth periods. Conversely, when energy intake is less than expenditure, this negative energy balance leads to weight loss, mostly from fat and, to a lesser extent, from protein in muscle.
A person can gain or lose weight by manipulating energy intake or output. An optimal strategy to encourage weight loss involves both increasing energy output and reducing energy intake. In most people, a substantial decrease in energy intake alone leads to inadequate nutrient intake, which can compromise bodily function.
Nitrogen balance—the algebraic sum of whole-body protein degradation and protein synthesis—is an indication of the change in whole-body protein stores. It is estimated from dietary protein intake and urinary nitrogen (i.e., urea) excretion. Children eating a balanced diet are in positive nitrogen balance because they store amino acids as protein in the process of growth. Patients who have suffered burns or trauma are usually in negative nitrogen balance because of the loss of lean (mostly muscle) body mass.
The second law of thermodynamics states that chemical transformations always result in a loss of the energy available to drive metabolic processes (Gibbs free energy, G). The total internal energy (E) of the human body is the sum of the disposable or free energy (G) plus the unavailable or wasted energy, which ends up as heat (i.e., the product of absolute temperature, T, and entropy, S):

For example, when you ingest glucose, the total internal energy increases by a small amount (ΔE). Some of this energy will be stored as glycogen (ΔG), and some will be wasted as heat (T · ΔS). According to Equation 58-1, as long as the temperature is constant, the change in total internal energy will have two components:
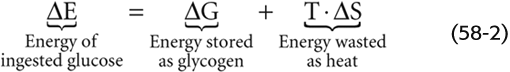
Thus, some of the increased total energy (ΔE) will be stored as glycogen (ΔG). However, because of the inefficiencies of the chemical reactions that convert glucose to glycogen, some of the ΔE is wasted as heat (T · ΔS). Another way of stating the second law is that T · ΔS can never be zero or negative, and chemical reactions can never be 100% efficient.
If we add no energy to the body (i.e., ΔE is zero), the body’s total free energy must decline (i.e., ΔG is negative). This decline in G matches the rise in T · S, reflecting inefficiencies inherent in chemical transformations. Consider, for example, what would happen if you took 1 mol of glucose (180 g), put it into a bomb calorimeter with O2, and completely burned the glucose to CO2 and H2O. This combustion would yield 686 kcal in the form of heat but would conserve no usable energy. Now consider what happens if your body burned this same 1 mol of glucose. In contrast to the bomb calorimeter, your mitochondria would not only oxidize glucose to CO2 and H2O but also conserve part of the free energy in the form of ATP. Each of the many chemical conversion steps from glucose to CO2 and H2O makes available a small amount of the total energy contained in glucose. Converting 1 mol of ADP and Pi to 1 mol of ATP under the conditions prevailing in a cell consumes ~11.5 kcal/mol. Therefore, if a particular step in glucose oxidation releases at least 11.5 kcal/mol, it can be coupled to ATP synthesis. The conversion of the lower-energy ADP to the higher-energy ATP traps energy in the system, thus conserving it for later use. The cellular oxidation of 1 mol of glucose conserves ~400 kcal of the potential 686 kcal/mol; the remaining 286 kcal/mol are liberated as heat.
ATP consists of a nitrogenous ring (adenine), a five-carbon sugar (ribose), and three phosphate groups (Fig. 58-5). The last two phosphates are connected to the rest of the molecule by high-energy bonds. The same is true for a related nucleotide, GTP. If we compare the free energies of phosphate bonds of various molecules, we see that the high-energy phosphate bonds of ATP lie toward the middle of the free-energy scale. Thus, in the presence of Pi, ADP can accept energy from compounds that are higher on the free-energy scale (e.g., phosphocreatine), whereas ATP can release energy in the formation of compounds that are lower on the free-energy scale (e.g., G6P). ATP can therefore store energy derived from energy-releasing reactions and release energy needed to drive other chemical reactions.
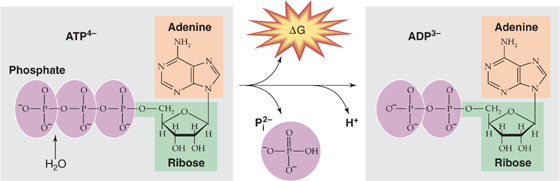
Figure 58-5 Hydrolysis of ATP to ADP, Pi, and H+.
Examples of the chemical reactions fueled by converting ATP to ADP and Pi include the bridge formation between actin and myosin during muscle contraction and the pumping of Ca2+ against its concentration gradient during muscle relaxation. (See Note: Hydrolysis of ATP)
Some metabolic reactions are neither uniquely anabolic nor catabolic, but they serve to interconvert the carbon skeletons of the building blocks of the three major energy forms—carbohydrates, proteins and lipids. In this major section, we focus on two major pathways of interconversion: glycolysis and gluconeogenesis.
The breakdown of glucose to pyruvate (Fig. 58-6A) can occur in the presence of O2 (aerobic glycolysis) or the absence of O2 (anaerobic glycolysis). This process yields 47 kcal of free energy per mole of glucose. Of this energy, the cell can trap enough to yield directly 2 mol ATP per mole of glucose (Table 58-3), even under the relatively inefficient anaerobic conditions. Under aerobic conditions, the mitochondria can generate an additional three or five ATP molecules per glucose from two reduced nicotinamide adenine dinucleotide (NADH) molecules. Cells that contain few mitochondria (e.g., fast-twitch muscle fibers; see Chapter 9) or no mitochondria (i.e., erythrocytes) rely exclusively on anaerobic glycolysis for energy. (See Note: Allosteric Regulation of Glycolytic Enzymes by Metabolic Products (“Pasteur Effect”))
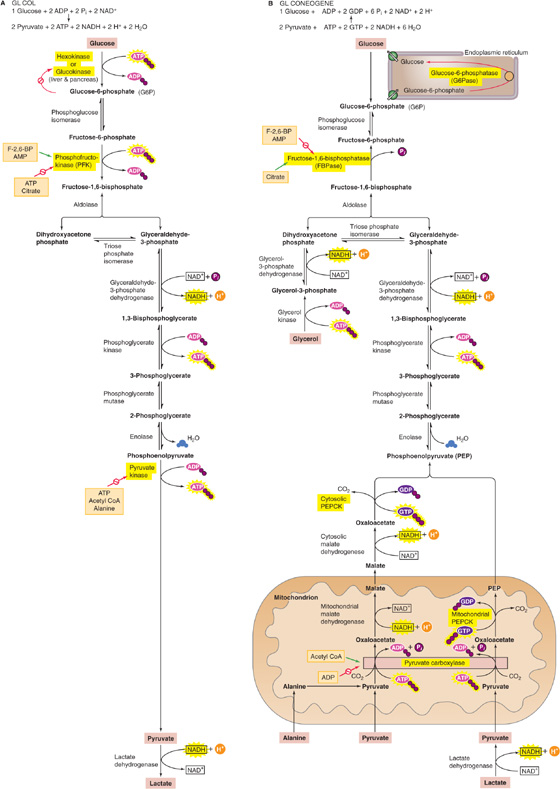
Figure 58-6 Glycolysis and gluconeogenesis. A, Highlighted are the three reactions in glycolysis that are essentially irreversible and the corresponding enzymes that are subject to allosteric regulation. B, Highlighted are the three gluconeogenic bypasses, which circumvent the three irreversible steps of glycolysis. The precursors for gluconeogenesis include amino acids (illustrated here for alanine), pyruvate, and lactate. The green arrow indicates stimulation.
Table 58-3 Generation of ATP from Glycolysis*
Reaction |
ATP Change Per Glucose |
Glucose → G6P |
−1 |
Fructose-6-phosphate → fructose 1, 6-bisphosphate |
−1 |
2× (1, 3-Bisphosphoglycerate) → 2× (3-phosphoglycerate) |
+2 |
2× Phosphoenolpyruvate → 2× pyruvate |
+2 |
|
Net +2 |
* Under anaerobic conditions, glycolysis—which takes place in the cytosol—yields two lactate molecules plus two ATP molecules per glucose molecule. Under aerobic conditions, the metabolism of glucose does not proceed to lactate and thus yields a net gain of two NADH molecules per glucose molecule. The oxidative phosphorylation of each NADH molecule will yield 1.5 or 2.5 ATP molecules, depending on which shuttle system the cell uses to transfer the reducing equivalents from the cytosol into the mitochondria. Therefore, under aerobic conditions, glycolysis of one glucose molecule generates two ATP molecules directly plus three or five ATP molecules through the oxidative phosphorylation of the two NADH molecules, for a total of five or seven ATP molecules per glucose molecule. This yield is summarized in the first two rows of Table 58-4. (See Note: Red Blood Cells)
About a century and a half ago, Pasteur recognized that glycolysis by yeast occurs faster in anaerobic conditions than in aerobic conditions. This Pasteur effect reflects the cell’s attempt to maintain a constant [ATP]i by controlling the rate at which glycolysis breaks down glucose to generate ATP. The key is the allosteric regulation of enzymes that catalyze the three reactions in the glycolytic pathway that are essentially irreversible: hexokinase (or glucokinase in liver and pancreas), phosphofructokinase (PFK), and pyruvate kinase (highlighted in Fig. 58-6A). In each case, either the direct reaction product (i.e., G6P in the case of hexokinase) or downstream metabolic products (e.g., ATP in the case of the other two) will inhibit the enzyme. If glycolysis should temporarily outstrip the cell’s need for ATP, the buildup of products will slow glycolysis. Thus, introducing O2 activates the citric acid cycle, which, as discussed later, raises [ATP]i, inhibits PFK and pyruvate kinase, and slows glycolysis. (See Note: Shuttle Systems for Moving Reducing Equivalents)
Under anaerobic conditions, cells convert pyruvate to lactate, accompanied by the accumulation of H+ (lactic acidosis). This acidosis, in turn, can impede muscle contraction by decreasing muscle cell pH, which can result in muscle cramps and inhibition of key glycolytic enzymes needed for ATP synthesis. Thus, sustained skeletal muscle activity depends on the aerobic metabolism of pyruvate as well as FAs.
Gluconeogenesis is essential for life because the brain and anaerobic tissues—formed elements of blood (erythrocytes, leukocytes), bone marrow, and the renal medulla—normally depend on glucose as the primary fuel source. The daily glucose requirement of the brain in an adult is ~120 g, which accounts for most of the required 180 g of glucose produced by the liver. The major site for gluconeogenesis is the liver; a much smaller amount of glucose is produced in the cortex of the kidney under most conditions. During prolonged fasting (2 to 3 months), the kidney can account for up to 40% of total glucose production.
Although glycolysis converts glucose to pyruvate (Fig. 58-6A) and gluconeogenesis converts pyruvate to glucose (Fig. 58-6B), gluconeogenesis is not simply glycolysis in reverse. The thermodynamic equilibrium of glycolysis lies strongly on the side of pyruvate formation (i.e., the ΔG is very negative). Thus, in contrast to glycolysis, gluconeogenesis requires energy, consuming four ATP, two GTP, and two NADH molecules for every glucose molecule formed. Most of the ΔG decrease in glycolysis occurs in the three essentially irreversible steps indicated by single arrows in Figure 58-6A. Gluconeogenesis bypasses these three irreversible, high-ΔG glycolytic reactions by using four enzymes: pyruvate carboxylase, phosphoenolpyruvate carboxykinase (PEPCK), fructose-1, 6-bisphosphatase (FBPase) and G6Pase (Fig. 58-6B). The enzymes of gluconeogenesis and glycolysis are present in separate cellular compartments to minimize futile cycling of substrates between glycolysis and gluconeogenesis with the glycolytic enzymes residing in the cytosolic compartment, whereas the gluconeogenic enzymes are present in the mitochondria (pyruvate carboxylase) or in the lumen of the endoplasmic reticulum (G6P).
The liver accomplishes gluconeogenesis by taking up, and converting to glucose, several nonhexose precursors (Fig. 58-6B). These include two breakdown products of glycolysis (lactate and pyruvate), all the intermediates of the citric acid cycle, 18 of the 20 amino acids, and glycerol. Regardless of the precursor—except for glycerol—all pathways go through oxaloacetate (OA). Thus, the liver can convert lactate to pyruvate and can then use pyruvate carboxylase to convert pyruvate to OA, thus consuming one ATP. Similarly, the citric acid cycle can convert all its intermediates to OA. Finally, the liver can deaminate all amino acids—except leucine and lysine—to form pyruvate, OA, or three other intermediates of the citric acid cycle (α-ketoglutarate, succinyl coenzyme A [CoA], or fumarate). The major gluconeogenic amino acids are alanine and glutamine. Leucine and lysine are not gluconeogenic because their deamination leads to acetyl CoA, which—as shown later—cannot generate net pyruvate or OA. Similarly FAs are not gluconeogenic because their breakdown products are almost exclusively acetyl CoA. In contrast, leucine and lysine are ketogenic because cells can convert acetyl CoA to FAs or ketone bodies. (See Note: Gluconeogenic and Ketogenic Amino Acids)
Once the liver has converted the precursor to OA, the next step is the conversion of OA to phosphoenolpyruvate (PEP) by PEPCK, thus consuming one GTP molecule (Fig. 58-6B). The liver can convert PEP to FBP by using the glycolytic enzymes in reverse. The gluconeogenic precursor glycerol enters the pathway at dihydroxyacetone phosphate. FBPase converts FBP to fructose-6-phosphate, and G6Pase completes gluconeogenesis by converting G6P to glucose. The major gluconeogenic precursors are as follows: (1) lactate, which is derived from glycolysis in muscle and anaerobic tissues; (2) alanine, which is mostly derived from glycolysis and transamination of pyruvate in skeletal muscle; and (3) glycerol, which is derived from lipolysis in adipocytes.
We already noted that key glycolytic and gluconeogenic enzymes are located in separate compartments. The liver also reciprocally and coordinately regulates these processes so that when one pathway is active, the other pathway is relatively inactive. This regulation is important because both glycolysis and gluconeogenesis are highly exergonic and therefore no thermodynamic barrier prevents futile cycling of substrates between these two pathways. Because glycolysis creates two ATP molecules and gluconeogenesis consumes four ATP and two GTP molecules, a full cycle from one glucose to two pyruvates and back again would have a net cost of two ATP and two GTP molecules. Acutely, the liver regulates flux through these pathways mostly by allosteric regulation of enzyme activity and, chronically, by transcriptional regulation of gene expression.
Allosteric Regulation PFK (glycolysis) is stimulated by AMP, whereas it is inhibited by citrate and ATP (Fig. 58-6A). FBPase (gluconeogenesis) is inhibited by AMP and is activated by citrate (Fig. 58-6B). Fructose-2, 6-bisphosphate, which is under the reciprocal control of glucagon and insulin, also reciprocally regulates these two enzymes, thus stimulating PFK and inhibiting FBPase. In the fed state, when glucagon is low and insulin is high (see Chapter 51), [fructose-2, 6-bisphosphate] is high; this situation promotes consumption of glucose. Conversely, in the fasted state, [fructose-2, 6-bisphosphate] is low, a condition promoting gluconeogenesis. (See Note: Fructose-2, 6-Bisphosphate)
Similarly, the liver reciprocally regulates pyruvate kinase (glycolysis) and pyruvate carboxylase/PEPCK (gluconeogenesis). High concentrations of ATP and alanine inhibit pyruvate kinase, whereas ADP inhibits pyruvate carboxylase. Furthermore, acetyl CoA inhibits pyruvate kinase but activates pyruvate carboxylase. In this way, high concentrations of biosynthetic precursors and ATP favor gluconeogenesis and suppress glycolysis. Conversely, high concentrations of AMP, reflecting a low energy charge of the liver, suppress gluconeogenesis and favor glycolysis.
Transcriptional Regulation More chronic regulation of gluconeogenesis and glycolysis occurs by hormonal regulation of gene expression. The major hormones involved in this process are insulin, glucagon, epinephrine, and cortisol. In contrast to allosteric regulation, which occurs in seconds to minutes, transcriptional regulation occurs over hours to days. Insulin, which increases following a meal (see Chapter 51), stimulates the expression of the glycolytic enzymes PFK and pyruvate kinase, as well as the enzyme that makes fructose-2, 6-bisphosphate. In addition, as noted in Figure 51-8, insulin suppresses the expression of the key gluconeogenic enzymes PEPCK, FBPase, and G6Pase. Insulin leads to the phosphorylation of the Foxo1 transcription factor, thus preventing Foxo1 from entering the nucleus and activating transcription of genes that encode these enzymes. (See Note: Fructose-2, 6-Bisphosphate)
Conversely, glucagon, the levels of which increase during starvation, inhibits the expression of the glycolytic enzymes PFK and pyruvate kinase, as well as the enzyme that makes fructose-2, 6-bisphosphate. Epinephrine and norepinephrine, released under conditions of stress, have actions similar to those of glucagon. At the same time, these hormones stimulate the expression of the gluconeogenic enzymes PEPCK and G6Pase through cAMP and protein kinase A (PKA). Phosphorylation of the transcriptional factor CREB then increases the production of the transcriptional cofactor PGC-1α (which then binds and activates the transcription factors HNF4 and Foxo1), which promotes the transcription of these key gluconeogenic enzymes.
The body—principally the liver—can convert glucose to FAs. As shown in Figure 58-6A, glycolysis converts glucose to pyruvate, which can enter the mitochondrion through the mitochondrial pyruvate carrier (MPC) (Fig. 58-7). When ATP demand is low, high levels of ATP, acetyl CoA, and NADH inside the mitochondria inhibit pyruvate dehydrogenase, which converts pyruvate to acetyl CoA—the normal entry point into the citric acid cycle. Conversely, high levels of ATP and acetyl CoA stimulate pyruvate carboxylase, which instead converts pyruvate to OA, the last element in the citric acid cycle. The mitochondrion then converts the OA and acetyl CoA to citrate, which it exports to the cytosol through the exchanger ClC (SLC25A1). A cytosolic enzyme called citrate lyase converts the citrate back to OA and CoA. The hepatocyte converts the cytosolic OA to malate or pyruvate, each of which can re-enter the mitochondrion. Thus, the net effect is to make acetyl CoA disappear from the mitochondrion and appear in the cytosol for FA synthesis.
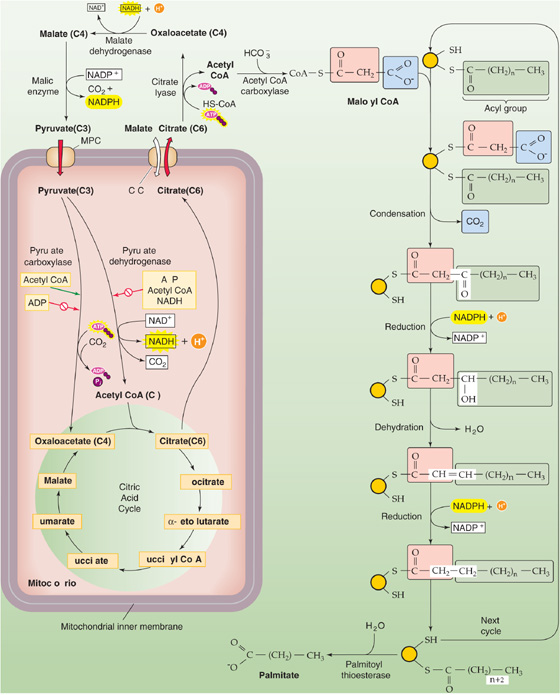
Figure 58-7 FA synthesis. The left side of the figure shows how the cell effectively transports acetyl CoA from the inside of the mitochondrion to the cytoplasm—exporting citrate and then taking up pyruvate. The key enzyme is citrate lyase. The right side of the figure shows how the cell generates FAs, two carbons at a time. Glucose can feed into the system through pyruvate. Amino acids can feed into the system through acetyl CoA (ketogenic amino acids), pyruvate, or intermediates of the citric acid cycle.
As noted earlier, the breakdown of ketogenic amino acids yields acetyl CoA. This acetyl CoA can also contribute to FA synthesis. In addition, the breakdown of other amino acids yields pyruvate or intermediates of the citric acid cycle, which again can contribute to FA synthesis. (See Note: Gluconeogenic and Ketogenic Amino Acids; Gluconeogenic and Ketogenic Amino Acids)
The synthesis of FAs from acetyl CoA takes place in the cytosol, whereas, as discussed later, the oxidation of FAs to acetyl CoA occurs in the mitochondrion. The first committed step—and the rate-limiting step—in FA synthesis is the ATP-dependent carboxylation of acetyl CoA (two carbons) to form malonyl CoA (three carbons), catalyzed by acetyl CoA carboxylase (ACC). The next step is the sequential addition of two-carbon units to a growing acyl chain, shown as –CO—(CH2)n—CH3 in Figure 58-7, to produce an FA. With each round of elongation, a malonyl CoA molecule reacts with FA synthase, which then decarboxylates the malonyl moiety and condenses the growing acyl chain to the remaining two-carbon malonyl fragment. The subsequent reduction, dehydration, and reduction steps—all catalyzed by the same multifunctional peptide—complete one round of elongation. Starting from a priming acetyl group (which comes from acetyl CoA), seven rounds of addition—in addition to a hydrolysis step to remove the acyl chain from the enzyme—are required to produce palmitate: (See Note: Acetyl CoA Carboxylase Isoforms)
The cell esterifies the FAs to glycerol to make TAGs. The liver can package TAGs as very-low-density lipoproteins (VLDLs) for export to the blood. (See Note: Digestion, Absorption, and Storage of Triacylglycerols)
The body has a hierarchy for energy interconversion. As discussed earlier, it can convert amino acids to glucose (gluconeogenesis) and fat. It can convert glucose to fat. In addition, the body can convert glucose to certain amino acids. However, the body cannot convert fat to either glucose or amino acids. Fats can only be stored or oxidized. The reason is that cells oxidize FAs two carbons at a time to acetyl CoA (a two-carbon molecule), which they cannot convert into pyruvate (a three-carbon molecule) or OA (a four-carbon molecule). The only exceptions are the uncommon FAs that have an odd number of carbon atoms, and even with these, only the terminal three-carbon unit escapes oxidation to acetyl CoA. Thus, almost all carbon atoms in FAs end up as acetyl CoA, which enters the citric acid cycle. There, isocitrate dehydrogenase and α-ketoglutarate dehydrogenase release the two carbon atoms of acetyl CoA as two CO2 molecules, thus yielding no net production of OA or pyruvate. In contrast, plants have two additional enzymes (the glyoxylate cycle) that allow them to convert two molecules of acetyl CoA to OA and glucose.
During feeding, when more energy is ingested than is being oxidized, the body stores excess calories as glycogen or fat. However, storing energy has a cost, although it is relatively inexpensive from a total energy standpoint. The process of digesting a mixed meal in the GI tract elevates the whole-body metabolic rate 20% to 25% higher than the RMR for ~90 minutes following a meal. In addition to this cost of digesting and absorbing, the energy cost of storing dietary carbohydrate as glycogen or dietary lipid as TAGs is 3% to 7% of the energy taken in. The cost of storing amino acids as protein is nearly 25% of the energy taken in. Moreover, storage after interconversions among dietary categories is particularly expensive. The cost of storing dietary carbohydrate as TAGs, or of storing amino acids as glycogen, is nearly 25% of the intake energy.
Three mechanisms maintain normoglycemia following carbohydrate ingestion: (1) suppression of hepatic glucose production; (2) stimulation of hepatic glucose uptake; and (3) stimulation of glucose uptake by peripheral tissues, predominantly muscle. Insulin is the primary signal, which orchestrates the storage and metabolism of glucose through the insulin receptor (see Fig. 51-6). Glucose is the dominant signal for insulin secretion. However, with meals, other signals converge on the β cells of the pancreatic islets to coordinate insulin secretion, as becomes apparent when comparing the insulin responses in identical amounts of glucose loads given intravenously versus orally (see Fig. 51-3). Viewed differently, for similar plasma glucose levels, oral glucose raises insulin concentrations several-fold higher than does intravenous glucose. This differential insulin response results from the secretion of multiple incretins (see Chapter 51)—especially glucagon-like peptide (GLP-1) and GI peptide (GIP)—as well as from parasympathetic innervation of the pancreatic β cells. The incretins and neural signals prime the β cells and thus magnify insulin release following meal-induced increases in blood glucose. This priming is absent when blood glucose increases as a result of increased hepatic glycogenolysis in response to stress, thereby avoiding potentially detrimental hyperinsulinemia under these conditions.
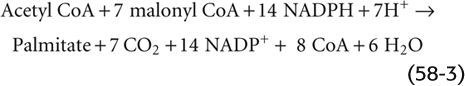
Liver Following a carbohydrate meal, levels of insulin and glucose rise in the portal vein (similar to Fig. 51-3A), whereas glucagon levels fall. These changes suppress hepatic glucose production and promote net hepatic glucose uptake. Thus, the liver buffers the entry of glucose from the portal vein into the systemic circulation, thereby minimizing fluctuations in plasma [glucose] while promoting glucose storage. Once plasma [glucose] returns to baseline, the liver resumes net glucose production to maintain normoglycemia. Depending on the size of the carbohydrate load, the liver may take up one fourth to one third of the ingested exogenous glucose load. Because the liver not only decreases its production of glucose, but also takes up a significant amount of glucose, the contribution of the liver to postprandial glucose homeostasis is substantial and approaches that of muscle.
Glucose taken up by the liver during the meal is predominantly stored as glycogen. The liver synthesizes glycogen by both a direct pathway from exogenous glucose and an indirect pathway from gluconeogenesis (Fig. 58-8A). When we ingest a meal following an overnight fast, these pathways contribute roughly equally to hepatic glycogen synthesis. However, the relative contribution of these pathways depends on the composition of diet, the level of glycemia achieved during the meal, and the relative concentrations of insulin and glucagon. A high-carbohydrate diet, hyperglycemia, and insulin promote the direct pathway, whereas reduced carbohydrate intake, lower glucose levels, and elevations in circulating glucagon stimulate the indirect pathway.
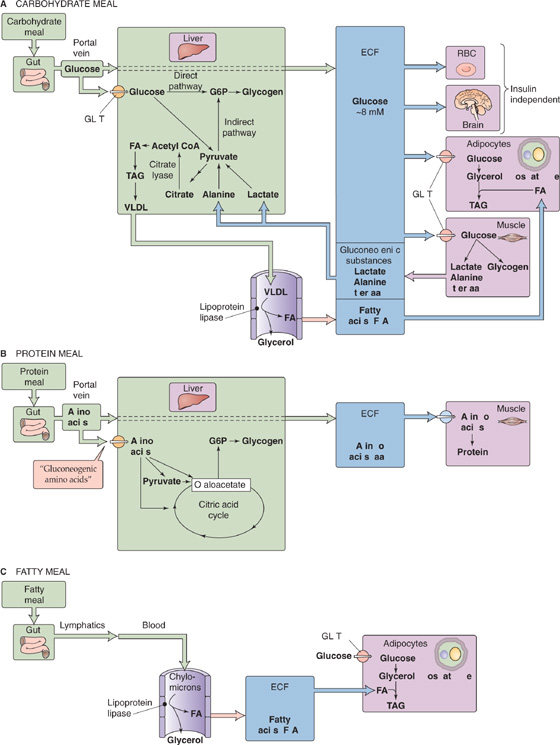
Figure 58-8 Energy storage following meals. In A, three major organs handle the glucose assimilated by the small intestine. Liver stores some glucose as glycogen and converts some to FA—packaged as VLDLs—for export to adipocytes. Muscle stores some glucose as glycogen and converts some to lactate and gluconeogenic amino acids for export to the liver. Adipocytes convert glucose to glycerol-3-phosphate, a precursor of TAGs. In B, two major organs handle the amino acids assimilated by the small intestine. Liver converts gluconeogenic amino acids to glycogen. Muscle converts amino acids to glycogen. In C, chylomicrons from the small intestine undergo hydrolysis in systemic blood vessels. Adipocytes re-esterify the resulting FAs (together with glycerol-3-phosphate generated from glucose) for storage as TAGs. aa, amino acids; ECF, extracellular fluid.
Hepatic glycogen stores peak 4 to 6 hours following a meal. Thus, when we ingest three meals per day at 4-to 6-hour intervals, hepatic glycogen stores increase throughout the day in a staircase fashion, whereas most of the glucose required for metabolism comes from exogenous glucose (see Fig. 58-8A). Glycogen stores reach their peak around midnight, after which hepatic glycogenolysis contributes ~50% to whole-body glucose production, and the other 50% derives from hepatic gluconeogenesis.
Because the liver has citrate lyase, it can also convert glucose that it takes up following a meal to FAs (Fig. 58-8A). This process is illustrated in Figure 58-7. The hepatocyte esterifies these FAs to glycerol to make TAGs, which it packages as VLDLs for export to the blood.
Muscle Glucose escaping the splanchnic (liver and gut) circulation is cleared predominantly by striated muscle, which stores most of this glucose as glycogen (Fig. 58-8A). Muscle metabolizes the remaining glucose through the glycolytic pathway and then either oxidizes the products or recycles them to the liver, mostly as lactate and alanine.
The uptake of glucose into muscle—as well as adipose tissue—is regulated predominantly by a rise in insulin concentration and, to a lesser extent, by the hyperglycemia per se. Insulin, through the phosphatidylinositol 3-kinase (PI3K) pathway (see Chapter 51), promotes translocation of the GLUT4 transporter to the plasma membrane and consequently stimulates glucose uptake by muscle and fat. In addition, insulin modulates the subsequent metabolism of glucose by increasing the activity of glycogen synthase, thereby promoting glucose storage, and by increasing the activity of pyruvate dehydrogenase, thereby increasing glucose oxidation as well.
Adipose Tissue Whereas adipose tissue typically represents a large component of the peripheral mass (10% to 15% of body weight in men, 25% to 30% in women), adipocytes metabolize only a minor fraction of ingested glucose (Fig. 58-8C). The reason is that, in contrast to the liver, human adipocytes have relatively little citrate lyase and can thus synthesize de novo relatively little FA from glucose. However, adipocytes use glucose as the starting material for generating glycerol-3-phosphate, which is required for TAG synthesis, by using FAs that come from the liver (Fig. 58-8A). As we saw earlier, in times of caloric and carbohydrate excess, the liver (which has an abundance of citrate lyase) synthesizes FAs de novo from glucose and esterifies the FAs to generate TAGs, which it then exports in the form of VLDL particles (see Fig. 46-15). Endothelial lipoprotein lipase (LPL) hydrolyzes the TAGs in VLDLs to FAs. Subsequently, the FAs enter adipocytes, which re-esterify them to form TAGs for storage. These adipocytes are mostly in the subcutaneous and visceral tissues and, to a much smaller extent, around muscle. (See Note: sn-Glycerol-3-Phosphate)
The larger the meal, the greater is the rate of glucose uptake by liver, muscle, and adipose tissue—because of higher levels of circulating insulin and glucose. In contrast, the brain uses glucose, its major oxidative fuel, at a constant rate, despite these fluctuations in plasma glucose during feeding. GLUT1 facilitates glucose uptake across the blood-brain barrier, and GLUT3 mediates glucose uptake into neurons, independent of insulin.
Following a protein meal, the amino acids absorbed by the GI tract (see Chapter 45) have two major fates: they can be either oxidized to yield energy or incorporated into protein. The liver removes a large fraction of amino acids that enter portal blood following a meal, particularly the gluconeogenic amino acids (Fig. 58-8B). In contrast, the liver less avidly removes the branched-chain amino acids (leucine, isoleucine, and valine), which muscle predominantly captures. Indeed, branched-chain amino acids are critical for the immediate repletion of muscle protein because they have a unique capacity to promote net protein accumulation, predominantly by inhibiting protein breakdown and to some extent by stimulating protein synthesis.
Insulin plays a major role in orchestrating protein anabolism, mostly by suppressing protein degradation. Therefore, the combination of the hyperinsulinemia and hyperaminoacidemia that follows a protein meal not only blocks proteolysis but also stimulates protein synthesis, thus resulting in net protein accumulation. Because some amino acids (e.g., arginine, leucine) are weak insulin secretagogues (see Chapter 51), a protein meal stimulates insulin release even when the meal lacks carbohydrate. Under such conditions, glucagon plays a critical role to prevent potential hypoglycemia by maintaining hepatic glucose production in the presence of hyperinsulinemia. In a mixed meal, the presence of carbohydrates augments insulin secretion beyond the effect of protein alone and further enhances protein anabolism.
Following a fat-containing meal (Fig. 58-8C), lipases in the duodenum hydrolyze the TAGs to FAs and glycerol, which enterocytes in the small intestine take up, re-esterified into TAGs, and secrete as chylomicrons. The chylomicrons enter the lymphatics and then the systemic circulation. (See Note: Digestion, Absorption, and Storage of Triacylglycerols)
Insulin, secreted in response to the carbohydrate or protein components of the meal, has three major effects on lipid metabolism (see Chapter 51). First, insulin stimulates LPL. LPL promotes hydrolysis of TAGs to FAs and glycerol. The breakdown products enter the adipocytes for re-esterification into TAGs. Insulin promotes storage in muscle and adipose tissue of both exogenous TAGs (derived from a meal and carried in chylomicrons) and endogenous TAGs (produced by the liver and carried in VLDLs).
Second, insulin stimulates glucose uptake into adipocytes by stimulating GLUT4. The adipocytes transform the glucose to glycerol-3-phosphate, which is the backbone required for the re-esterification of FAs into TAGs. Adipocytes lack glycerol kinase and therefore, unlike liver and kidney, are unable to phosphorylate glycerol directly.
Third, insulin inhibits hormone-sensitive lipase (HSL) within the fat cell. HSL—not to be confused with LPL—catalyzes the hydrolysis of stored TAGs in adipocytes. By suppressing lipolysis, insulin markedly decreases plasma FA concentrations and promotes net storage of absorbed fat into the adipocyte.
In a mixed meal—when glucose, amino acids, and FAs are all available—an increase in plasma [insulin] augments their net storage as glycogen, protein, and fat. This is accomplished by inhibiting glycogenolysis, proteolysis, and lipolysis as well as by promoting the opposite three processes. Because of the dose-response relationships, low levels of insulin preferentially inhibit the breakdown of energy stores, whereas high levels preferentially stimulate energy accumulation. Thus, small meals (associated with smaller insulin responses) mainly conserve depots by reducing breakdown, whereas larger meals (and concomitant greater insulin responses) increase depots by stimulating storage.
The general principle in energy catabolism is that the body first breaks down a complex storage polymer (e.g., glycogen or TAGs) to simpler compounds (e.g., glucose, FAs, lactate) that the cells can then metabolize to provide energy, mostly in the form of ATP, for cellular function.
Skeletal Muscle Glycogenolysis in skeletal muscle is catalyzed by glycogen phosphorylase (GP; Fig. 58-9A). Epinephrine triggers glycogenolysis by binding to a β-adrenergic receptor, thus promoting the formation of cAMP (see Chapter 3). The cAMP activates PKA, which, in turn, phosphorylates phosphorylase kinase (PK). The now active form of PK then converts the inactive GPb to the active GPa. In skeletal muscle, a second way of activating GPb is for it to bind AMP allosterically; [AMP]i increases during muscle activity owing to increased turnover of ATP. Conversely, ATP competes with AMP for this nucleotide-binding site and thus inhibits GPb. Yet a third way of activating GPb is for Ca2+ to activate PK allosterically. Thus, during intense activity of skeletal muscle, the accompanying increase in [Ca2+]i directly promotes muscle glycogenolysis. Skeletal muscle converts the glucose-1-phosphate (G1P) generated from glycogen breakdown to G6P, which, in turn, enters the glycolytic pathway within the muscle cell. (See Note: Glycogen Phosphorylase Kinase (PK))
Figure 58-9 Mobilization of energy stores by epinephrine and glucagon. A, In muscle, epinephrine promotes glycogenolysis and glycolysis, thereby producing ATP (for muscle contraction) and lactate. See Figure 3-7 for a discussion of how PKA inactivates phosphoprotein phosphatase 1 (PP1). B, In liver, primarily glucagon and also epinephrine trigger glucose production acutely through glycogenolysis and chronically through gluconeogenesis. Because they have G6Pase, hepatocytes can generate glucose and can export it to the blood. C, In adipocytes, epinephrine triggers production of FAs and glycerol, which leave the adipocytes and enter the blood. GLUT2 and GLUT4, glucose transporters; G6Pase, glucose-6-phosphatase; GPa, active form of glycogen phosphorylase; GPb, inactive form of glycogen phosphorylase; GS, glycogen synthase; HSL, hormone-sensitive lipase; PK, phosphorylase kinase; PKA, protein kinase A; PP1, phosphoprotein phosphatase. Yellow halos indicate the active forms of enzymes.
Liver As is the case in muscle, phosphorylase converts glycogen to G1P in hepatocytes. The mechanism for determining the ratio of GPa to GPb is the same as in muscle, except in the liver, glucagon (and, to a lesser extent, epinephrine), which is secreted by the α cells of the pancreas into the portal vein, triggers the increase in [cAMP]i (Fig. 58-9B). In the presence of glucagon, the liver converts glycogen to G1P and then converts G1P, as in muscle, to G6P. However, unlike muscle, liver contains the enzyme G6Pase, which cleaves the phosphate from G6P, to yield glucose, which is free to enter the bloodstream. Thus, whereas glycogenolysis in skeletal muscle serves to meet local energy demands by releasing G6P, glycogenolysis in the liver serves to meet whole-body energy demands—mainly those of the central nervous system (CNS)—by releasing glucose to the blood.
Adipocytes Adipocytes release stored TAGs by using HSL to hydrolyze TAGs to FAs and glycerol. Nearly all (95%) of the available energy of TAGs resides in the FA moieties. Two hormones can stimulate lipolysis: epinephrine, which the adrenal medulla secretes under conditions of low blood glucose or stress, and growth hormone (see Chapter 48). As in skeletal muscle and hepatocytes, epinephrine acts through cAMP (Fig. 58-9C). The result is activation of HSL, which hydrolyzes the ester linkages of TAG molecules, thus releasing FAs, which diffuse out of the adipocytes into the bloodstream. There, the poorly soluble FAs bind to circulating albumin, which releases them at the sites of energy demand.
In carbohydrate catabolism, after the breakdown of glycogen, the second step is glycolysis. In TAG metabolism, after the breakdown to FAs, the second step is the β oxidation of FAs in the mitochondrial matrix. (FA synthesis takes place in the cytoplasm). Before β oxidation, however, the hepatocyte uses an FA transport protein (FATP, member of SLC27 family) to transport the FA into the cytosol (Fig. 58-10), where acyl CoA synthase activates the FA to acyl CoA (i.e., the FA chain coupled to CoA). To deliver acyl CoA to the mitochondrial matrix, the cell uses carnitine acyl transferase I (CAT I) on the cytosolic side of the mitochondrial outer membrane to transfer the acyl group to carnitine. The resulting acyl carnitine moves through a porin in the mitochondrial outer membrane to enter the intermembrane space. The carnitine/acyl carnitine transporter (CAC, SLC25A20) on the mitochondrial inner membrane moves acyl carnitine into the mitochondrial matrix. There, CAT II transfers the acyl group back to CoA, to form acyl CoA and carnitine. The carnitine recycles to the cytosol through CAC and the porin, whereas acyl CoA undergoes β oxidation.
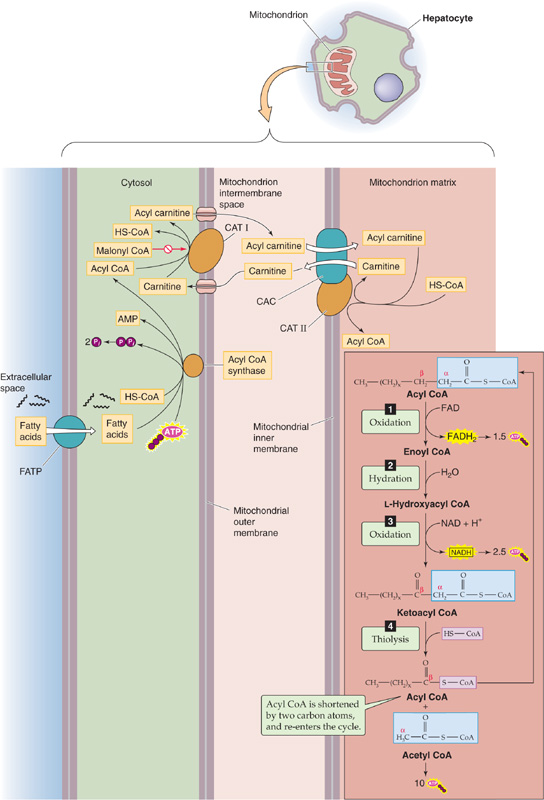
Figure 58-10 FA transport into mitochondrion and β oxidation.
β Oxidation is a multistep process that removes a two-carbon fragment from the end of an acyl CoA and releases the fragment as an acetyl CoA (Fig. 58-10). The process also releases one FADH2, one NADH, and the remainder of the acyl chain (beginning with the original β carbon), which serves as the starting point for the next cycle. β Oxidation continues until it consumes the entire FA chain. For an FA chain containing n carbons, the number of cycles is ([n/2]—1). The final cycle generates two acetyl CoA molecules. Unlike the breakdown of glucose, which can yield ATP even in the absence of O2 (through glycolysis), the catabolism of FAs to yield energy in the form of ATP can occur only in the presence of O2.
Malonyl CoA plays a central role in regulating the balance between FA synthesis and β oxidation. When energy levels are high, the enzyme ACC generates malonyl CoA from acetyl CoA, as shown in Figure 58-7. In turn, malonyl CoA provides the two-carbon building blocks for FA synthesis. In contrast, malonyl inhibits CAT I and thereby inhibits β oxidation (Fig. 58-10). Mice deficient in ACC2—even those fed a high-fat/high-carbohydrate diet—are thinner than their normal littermates on the same diet.
Under aerobic conditions, cells containing mitochondria typically convert most of the pyruvate they generate from carbohydrate metabolism to acetyl CoA, rather than to lactate. Pyruvate—a three-carbon piece of glucose’s carbon skeleton—moves from the cytoplasm into the mitochondrial matrix (Fig. 58-11). There, pyruvate is oxidatively decarboxylated to acetyl CoA, thus releasing CO2 as well as an NADH. Acetyl CoA also forms in the mitochondria as the end product of the β oxidation of FAs, as well as amino acid breakdown. The metabolism of the acetate moiety of acetyl CoA, as well as the oxidation of NADH and FADH2, is the final common pathway of aerobic catabolism, which releases CO2, H2O, ATP, and heat.
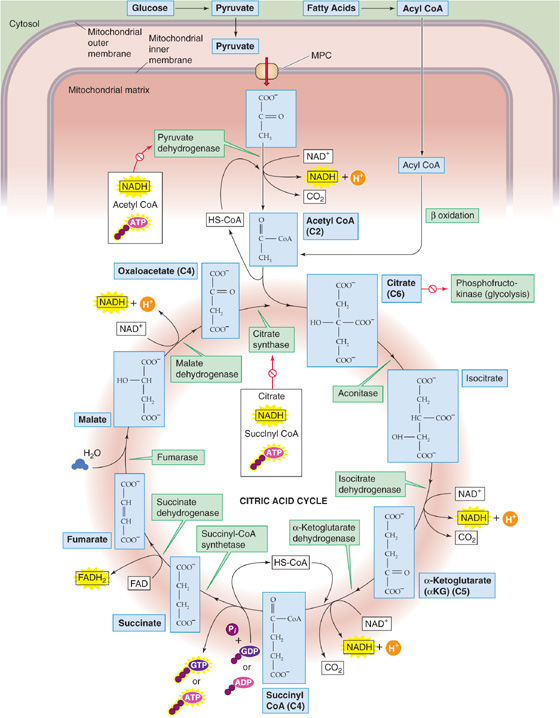
Figure 58-11 Citric acid cycle.
Citric Acid Cycle Acetyl CoA—representing a two-carbon fragment derived from glucose, FA, or amino acid metabolism—enters the citric acid cycle phase of catabolism, also called internal respiration (see Chapter 26) or oxidative decarboxylation because the two-carbon fragment ends up as two CO2 molecules (Fig. 58-11). The citric acid cycle conserves the liberated energy as GTP and the reduced electron carriers NADH and FADH2.
Cells tightly control the citric acid cycle by three mechanisms that limit substrate flux through the citric acid cycle: substrate availability, product accumulation, and feedback inhibition of key enzymes. Cells regulate the citric acid cycle at four sites. The two entry-point enzymes, pyruvate dehydrogenase and citrate synthase, are the most important. Pyruvate dehydrogenase is inhibited allosterically by two of its immediate products (NADH and acetyl CoA) and one downstream product (ATP). The second primary site of regulation in the citric acid cycle is citrate synthase, which is under feedback inhibition of several immediate and downstream products (citrate, NADH, succinyl CoA, ATP). The citrate produced in this reaction feeds back negatively on PFK, as discussed earlier, thus effectively coupling glycolysis and oxidative metabolism (Fig. 58-6). Two other enzymes, isocitrate dehydrogenase and α-ketoglutarate dehydrogenase, may also be rate limiting for the citric acid cycle under the right conditions. (See Note: Regulation of Pyruvate Dehydrogenase)
Oxidative Phosphorylation The process by which mitochondria retrieve energy from FADH2 and NADH is oxidative phosphorylation. These reduced nucleotides are products of glycolysis (Fig. 58-6), β oxidation (Fig. 58-10), conversion of pyruvate to acetyl CoA (Fig. 58-11), and the citric acid cycle. Oxidative phosphorylation involves the transfer of electrons along a chain of molecules, and it ultimately traps the releasing energy in the formation of 1.5 ATP molecules per FADH2 and 2.5 ATP molecules per NADH (see Fig. 5-9). (See Note: Shuttle Systems for Moving Reducing Equivalents)
Ketogenesis Conditions such as prolonged fasting, a low-carbohydrate diet, or untreated diabetes mellitus lead to the production of three water-soluble byproducts of incomplete FA oxidation, substances collectively known as ketone bodies: acetoacetate, β-hydroxybutyrate, and acetone. What the conditions have in common is the accelerated β oxidation of FAs that produces acetyl CoA faster than the citric acid cycle can consume them. In addition, accelerated gluconeogenesis steals the OA (Fig. 58-6B) that would be the entry point for acetyl CoA to enter the citric acid cycle (Fig. 58-11). As a result, excess acetyl CoA spills over into the production of the three ketone bodies, primarily by liver mitochondria. As summarized by the downward orange arrows in Figure 58-12, the first three reactions in ketogenesis have the net effect of condensing two molecules of acetyl CoA and one H2O to one molecule of acetoacetate, two molecules of HS-CoA, and one H+. Thus, ketogenesis causes net metabolic acidosis (see Chapter 28). The second and third reactions are essentially irreversible. Next, the liver can either reduce acetoacetate to D-β-hydroxybutyrate or decarboxylate the acetoacetate to acetone. The body rids itself of the volatile acetone and CO2 molecules in the expired air. The acetone gives the breath a fruity odor that can be useful in the physical diagnosis of diabetic ketoacidosis.
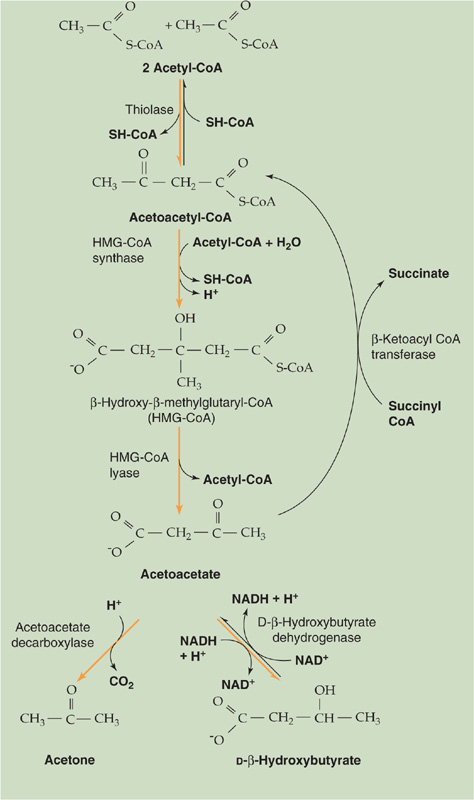
Figure 58-12 Ketogenesis and metabolism of ketone bodies.
Extrahepatic tissues—especially the CNS and skeletal or cardiac muscle—can consume either one D-β-hydroxybutyrate or one acetoacetate molecule, as shown by the upward purple arrows in Figure 58-12, to produce two acetyl CoA molecules that can then enter the citric acid cycle (Fig. 58-11). The key reaction—catalyzed by β-ketoacyl CoA transferase—bypasses the two irreversible ketogenic reactions by transferring a CoA from succinyl CoA to acetoacetate. This reaction is itself essentially irreversible. The reason that ketone bodies flow from the liver to extrahepatic tissues is that β-ketoacyl CoA transferase is not present in hepatocytes.
The source with the greatest energy density (kcal/g) is saturated FAs (Table 58-1), which have a high density of carbon and hydrogen that can be oxidized to CO2 and H2O. Accordingly, the complete combustion of 1 g of an energy-rich fuel (i.e., lipid) requires more O2. However, the energy yield per O2 is similar among fuels, because about the same amount of O2 is needed to oxidize each carbon and hydrogen. The energy yield per unit of O2 is only slightly greater for carbohydrate (5.0 kcal/L of O2) than for lipid (4.7 kcal/L O2). Carbohydrate, with its greater energy yield per O2, is the body’s preferred fuel for combustion during maximal exercise when O2 availability is limited. However, fat is the preferred fuel during prolonged activity, when O2 is available and fuel sources are abundant.
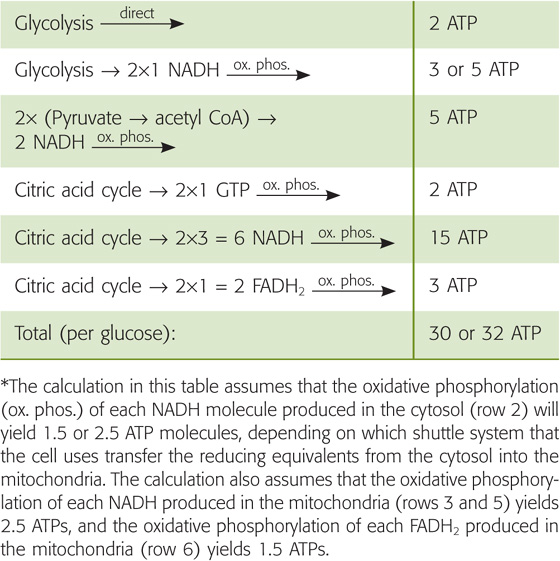
The metabolism of glucose by aerobic glycolysis and the citric acid cycle is far more efficient in providing energy in the form of ATP than anaerobic glycolysis in that complete oxidation of 1 molecule of glucose to CO2 and H2O through oxidative metabolism provides 30 to 32 molecules of ATP, whereas metabolism of 1 molecule of glucose to lactate by anaerobic glycolysis yields only ~2 molecules of ATP (Table 58-4). However, anaerobic glycolysis has the major advantage of being able to supply much more ATP per unit time compared with oxidative metabolism of glucose or fat. In this way, energy from glycogen supplies energy for muscle contraction during intense activities, such as sprinting. Responsible for this intense work are fast-twitch type 2 fibers, which have a much lower mitochondrial density than slow-twitch type 1 fibers. Unfortunately, muscle can support this type of activity only for several minutes before lactate accumulates and the muscle cramps, or the muscle exhausts its stored glycogen. In contrast, oxidative metabolism of FAs is the major mechanism for supporting exercising muscle during prolonged activity, such as running a marathon, which is mostly the work of the slow-twitch type 1 muscle fibers (see Chapter 60).
Table 58-4 Generation of ATP from the Complete Oxidation of Glucose*
In the case of FA metabolism (Fig. 58-10), each cycle of β oxidation yields a total of 14 ATP molecules (Table 58-5). The total number of ATP molecules generated from an FA depends on the number of carbon atoms in the FA chain. For example, palmitic acid, a 16-carbon FA, needs 7 β-oxidation cycles to form 8 acetyl CoA molecules. The 7 cycles generate 7 × 14 = 98 ATPs. The leftover acetyl CoA represents an additional 10 ATPs, for a total of 108 ATPs. Because the initial activation of the palmitate to palmitoyl CoA involves converting an ATP to AMP plus pyrophosphate—and regenerating ATP from AMP requires forming 2 high-energy phosphate bonds—the net ATP production is 108 − 2 = 106 ATPs per palmitate oxidized.
Table 58-5 Generation of ATP in One Cycle of β Oxidation of a Fatty Acid*

For each primary fuel source, Table 58-6 provides the respiratory quotient (RQ) or ratio of moles of CO2 produced per mole of O2 consumed at the tissue level. The RQ reflects the density of oxygen atoms in the fuel source. For example, with carbohydrates, the cell needs to supply only enough external O2 to oxidize the carbon atoms to CO2. The H2O is already built into the carbohydrate molecule, which has a ratio of H to O of 2 : 1.
Table 58-6 Respiratory Quotients of the Major Foodstuffs
|
Energy Density (kcal/g) |
Respiratory Quotient |
Carbohydrate |
4.1 |
1.00 |
Protein |
4.3 |
0.80-0.85 |
Lipid |
9.4 |
0.70 |
However, because lipids contain so many fewer oxygen atoms, lipid oxidation requires more external O2.
The RQ for protein oxidation is 0.80 to 0.85.
Protein oxidation constitutes a very minor fraction of the total fuel oxidation in any tissue. The brain and anaerobic tissues normally use carbohydrate nearly exclusively and have an RQ of 1.0. Most tissues oxidize both carbohydrate and fat, and the RQ reflects this mixture. The whole-body RQ following an overnight fast is ~0.8 for people eating a typical Western diet; individuals with less lipid intake have a higher RQ (i.e., approaching the value of 1 for carbohydrates).
The human body has two main priorities for energy liberation during fasting. The first priority is to maintain a stable supply of energy for CNS function. The brain has little stored energy in the form of glycogen or TAGs and therefore depends on the liver (and under some circumstances the kidney) for a constant supply of energy in the form of glucose or ketone bodies. In the fed state and early in the fasting state, the brain derives essentially all its energy from oxidation of glucose because ketone bodies are not present and the blood-brain barrier is mostly impermeable to FAs. Most other major organs of the body (liver, skeletal muscle, heart) fill their energy needs at this time by oxidizing FAs. Because a continuous supply of glucose is required to meet the energy demands of the CNS, humans have evolved elaborate, redundant mechanisms to maintain plasma [glucose] within a very narrow range, between 60 and 140 mg/dL (3.3 to 7.8 mM), between fasting and fed states. Lower [glucose] impairs brain function, whereas elevated plasma [glucose] exceeds the renal glucose threshold, results in polyuria, and leads to the multiple complications associated with poorly controlled diabetes mellitus (retinopathy, neuropathy, and nephropathy). In contrast, FAs and ketone bodies can vary in concentration by 10- and 100-fold, respectively, depending on the fed or fasted conditions. During prolonged fasting (>2 days), the liver metabolizes FAs to raise plasma levels of ketone bodies sufficiently to supply much of the brain’s oxidative fuel needs. The second priority for the body is to maintain its protein reserves (e.g., contractile proteins, enzymes, nervous tissue) in times of fasting.
The body also has two main priorities for energy repletion after fasting. First, following a meal, liver and muscle replenish their limited glycogen reserves. Once these stores are full, liver and muscle convert any excess energy in the form of carbohydrate and protein to fat. Muscle glycogen is the most readily available form of energy for muscle contraction, especially when intense bursts of physical activity are required. Therefore, maintaining an adequate supply of muscle glycogen at all times also has obvious survival benefits in times of fight or flight. The second priority during feeding is to replenish protein reserves. (See Note: Shuttle Systems for Moving Reducing Equivalents)
The period after an overnight fast serves as a useful reference point because it represents the period before the transition from the fasted to the fed state. At this time, the concentrations of insulin, glucagon, and metabolic substrates that were altered by meal ingestion during the preceding day have returned to some baseline. Moreover, the body is in a relative steady state in which the rate of release of endogenous fuels from storage depots closely matches fuel consumption.
Requirement for Glucose After an overnight fast, the decline in circulating insulin leads to a marked decrease in glucose uptake by insulin-sensitive tissues (e.g., muscle) and a shift toward the use by these tissues of FAs mobilized from fat stores. Nevertheless, the average adult continues to metabolize glucose at a rate of 7 to 10 g/hr. Total body stores of free glucose, which exists mostly in the extracellular space, amount to only 15 to 20 g or ~2 hours’ worth of glucose fuel. However, the useful glucose store is even less if we consider that the plasma [glucose]—normally ~90 mg/dL (5.0 mM) after an overnight fast—may not fall to less than ~55 mg/dL (3.0 mM) before brain function becomes abnormal. Thus, maintaining plasma [glucose] in the presence of this ongoing glucose use, particularly by the brain, requires that the body produce glucose at rates sufficient to match its ongoing consumption.
Gluconeogenesis Versus Glycogenolysis Four to 5 hours after a meal (perhaps longer for a very large meal), a fall in plasma [insulin] and a rise in [glucagon] cause the liver to begin breaking down its stores of glycogen and releasing it as glucose (see Chapter 51). Moreover, both the liver and, to a lesser extent, the kidney generate glucose by gluconeogenesis. The release of glucose by these two organs is possible because they are the only two with significant amounts of G6Pase, which catalyzes the conversion of G6P to glucose. Net hepatic glycogenolysis and gluconeogenesis each contribute ~50% whole-body glucose production during the first several hours of a fast.
Gluconeogenesis: The Cori Cycle In the first several hours of a fast, the brain consumes glucose at the rate of 4 to 5 g/hr, which is two thirds the rate of hepatic glucose production (~180 g/day). Obligate anaerobic tissues also metabolize glucose but convert it primarily to lactate and pyruvate. The liver takes up these products and uses gluconeogenesis to regenerate glucose at the expense of energy. The liver releases the glucose for uptake by the glucose-requiring tissues, thus completing the Cori cycle (Fig. 58-13).
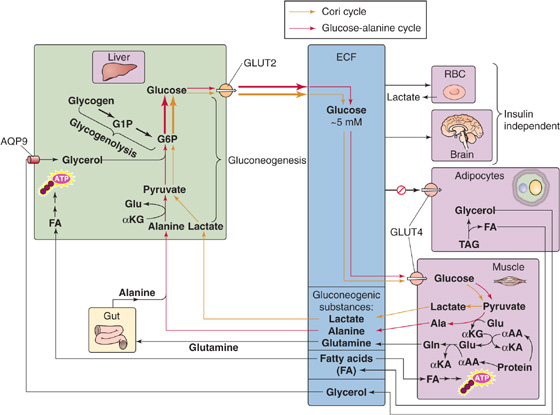
Figure 58-13 Overnight fast. αAA, α-amino acid; AQP9, aquaporin 9; ECF, extracellular fluid; αKA, α-keto acid; αKG, α-ketoglutarate.
Gluconeogenesis: The Glucose-Alanine Cycle After an overnight fast, the body as a whole is in negative nitrogen balance. Muscle and splanchnic tissues are the principal sites of protein degradation and release of amino acids into the blood. Alanine and glutamine, which are particularly important, represent ~50% of total amino acid released by muscle, even though these amino acids represent only 10% to 13% of total amino acids in muscle protein. The reason that alanine and glutamine are overrepresented is that muscle synthesizes them (Fig. 58-13). During fasting, breakdown of muscle protein yields amino acids, which subsequently transfer their amino groups to α-ketoglutarate (supplied by the citric acid cycle) to form glutamate. Glutamine synthase can then add a second amino group to glutamate, thus producing glutamine. Alternatively, alanine aminotransferase can transfer the amino group of glutamate to pyruvate (the product of glucose breakdown), thereby generating alanine and α-ketoglutarate. Both glutamine and alanine enter the blood. The intestine uses some of the glutamine as an oxidative fuel and releases the amino groups into portal blood as either alanine or ammonia.
The amino acids taken up by the liver provide carbon for gluconeogenesis. On a molar basis, alanine is the principal amino acid taken up by the liver. In the first several hours of fasting, the liver principally uses alanine for gluconeogenesis. Because the carbon backbone of alanine came from glucose metabolism in muscle, and the liver regenerates glucose from this alanine, the net effect is a glucose-alanine cycle between muscle and liver, analogous to the Cori cycle.
In addition to its role in gluconeogenesis, the glucose-alanine cycle is critical for nitrogen metabolism, thus providing a nontoxic alternative to ammonia for transferring amino groups—derived from muscle amino acid catabolism—to the liver (Fig. 58-13). The hepatocytes now detoxify the amino groups on alanine and other amino acids by generating urea, which the kidney then excretes (see Figs. 39-6 and 46-14). Another key amino acid in nitrogen metabolism is glutamine, which muscle releases into the blood for uptake by the gut and liver as well as the kidney. The kidney uses the carbon skeleton of glutamine for renal gluconeogenesis and converts the amino group to ammonia, which it excretes (see Chapter 39). This ammonia excretion is particularly important in maintaining body acid-base balance during fasting. Combined, alanine and glutamine account for more than 40% of the amino acid carbon used by liver and kidneys in gluconeogenesis.
Neither the Cori cycle nor the glucose-alanine cycle in muscle yields new carbon skeletons. Rather, both cycles transfer energy—and the glucose-alanine cycle also transfers nitrogen—between muscle and liver. The energy for hepatic glucose synthesis comes from oxidation of fat in the liver.
Lipolysis Finally, the fall in plasma [insulin] after an overnight fast permits the release of FAs and glycerol from fat stores (see Fig. 51-10). This response appears to be more pronounced in visceral than peripheral fat depots. The decline in [insulin] and the ensuing lipolysis are sufficient to supply FAs to extracerebral tissues (e.g., muscle, heart, liver) for fuel and glycerol to the liver for gluconeogenesis. However, these changes are not sufficient to stimulate the hepatic conversion of FA to ketone bodies.
The body never completely suppresses gluconeogenesis. When an individual ingests a meal, gluconeogenic flux provides glucose for hepatic glycogen stores (indirect pathway). During fasting, the liver redirects the gluconeogenic flux to provide glucose for delivery to the circulation.
We have just seen that, during an overnight fast, glycogenolysis and gluconeogenesis contribute about equally to maintain a fasting plasma glucose concentration of ~90 mg/dL (5.0 mM). What happens if we extend our fast for 1 or 2 days? Because the glucose utilization rate is 7 to 10 g/hr, if half of this were provided by glycolysis (as is true for an overnight fast), the hepatic glycogen stores of ~70 g that remain after an overnight fast would be sufficient to last only an additional day. However, in the early stages of starvation, the body compensates by accelerating gluconeogenesis.
Orchestrating the metabolic adaptations in the early stages of starvation—increased gluconeogenesis, but also increased proteolysis and lipolysis—are a decline in [insulin] to a level lower than that seen after an overnight fast and a modest increase in portal vein [glucagon]. Insulin deficiency promotes all aspects of the metabolic response, whereas the effect of glucagon is confined to the liver (see Chapter 51).
Enhanced Gluconeogenesis Adaptations in both liver and muscle are responsible for increasing gluconeogenesis (Fig. 58-13). In muscle, acceleration of proteolysis leads to the release of alanine and other glycogenic amino acids, whereas the liver accelerates its conversion of gluconeogenic amino acids into glucose. This enhanced gluconeogenesis, however, is not the result of increased availability of substrates, because plasma levels of alanine and other glycogenic amino acids decline. Instead, fasting upregulates key gluconeogenic enzymes (see Chapter 51) and thus makes gluconeogenesis more efficient.
The dependence of gluconeogenesis on proteolysis is reflected by an increase in urinary nitrogen excretion in the early phase of starvation. During the first 24 hours of a fast, the average 70-kg person excretes 7 to 12 g of elemental nitrogen in the urine, equivalent to 50 to 75 g of protein. Because tissue protein content does not exceed 20% by weight for any tissue, 50 to 75 g of protein translates to 250 to 375 g of lean body mass lost on the first day of a fast.
Enhanced Lipolysis The activation of HSL increases release of FAs and glycerol from TAG stores in adipose tissue and muscle (Fig. 58-13). The increased availability of glycerol provides the liver with an additional substrate for gluconeogenesis, as discussed earlier, that contributes to glucose homeostasis. Moreover, the increased availability of FAs to muscle and other peripheral tissues limits their use of glucose, preserves glucose for the CNS and other obligate glucose-using tissues, and thereby diminishes the demands for gluconeogenesis and proteolysis.
Elevated levels of FAs cause insulin resistance in skeletal muscle by directly interfering with the activation of GLUT4 (Fig. 58-13) by insulin. FAs activate a serine/threonine kinase cascade, leading to increased serine phosphorylation of insulin receptor substrate 1 (IRS-1; see Chapter 51), which, in turn, leads to decreased tyrosine phosphorylation of IRS-1 and thus a decrease in the PI3K that is necessary for the insertion of GLUT4 in muscle. This FA-induced decrease in glucose consumption and the parallel increased availability of FAs as a fuel for muscle spare glucose for other tissues under fasting conditions. However, this adaptation may play an important pathologic role in mediating the insulin resistance associated with obesity and type 2 diabetes.
In addition to their effects on muscle, FAs enter the liver, where they undergo β oxidation and generate energy. A fall in the insulin-glucagon ratio inhibits ACC (see Fig. 51-12), reduces levels of malonyl CoA, and promotes mitochondrial FA oxidation. Thus, the hormonal changes both increase the supply of FAs and activate the enzymes necessary for FA oxidation. This β oxidation furnishes the energy and reducing power required for gluconeogenesis. If the availability of FAs outstrips the ability of the citric acid cycle to oxidize the resulting acetyl CoA, the result may be the accumulation of ketone bodies, which can serve as a fuel for the CNS as well as for cardiac and skeletal muscle.
As the duration of fasting increases, the body shifts from using its limited protein stores for gluconeogenesis to using fat for ketogenesis (Fig. 58-14). Moreover, the brain shifts from oxidizing glucose to oxidizing two ketone bodies, β-hydroxybutyrate and acetoacetate, to meet most of its energy requirements.
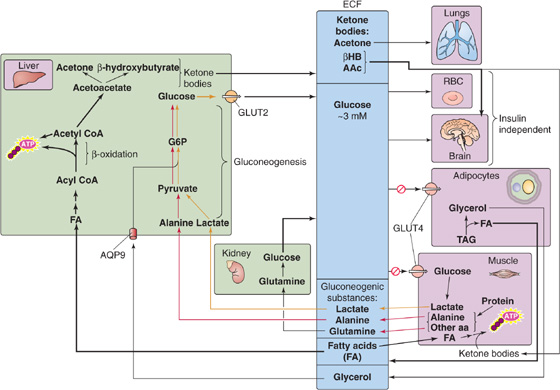
Figure 58-14 Prolonged starvation. AAc, acetoacetate; ECF, extracellular fluid; βHB, β-hydroxybutyrate.
Decreased Proteolysis A fasting human could survive for only ~10 days if totally dependent on protein utilization to meet whole-body energy requirements. Thus, prolonged survival during starvation requires a major reduction in proteolysis. Indeed, urea excretion decreases from 10 to 15 g/day during the initial days of a fast to less than 1 g/day after 6 weeks of fasting. Because urea is the major obligatory osmolyte in the urine (see Chapter 38), this reduced urea production lessens obligatory water excretion and therefore the daily water requirement. Ammonium excretion also decreases.
Decreased Hepatic Gluconeogenesis The transition from protein to lipid degradation permits humans to extend their survival time during a prolonged fast from weeks to months, as long as fat stores are available and water intake is adequate. During this transition, hepatic gluconeogenesis decreases (Fig. 58-14), mostly because of diminished substrate delivery. During the first few weeks of a fast, muscle releases less alanine, the principal substrate for hepatic gluconeogenesis, thus causing plasma [alanine] to fall markedly, to less than one third of the concentrations seen after the absorption of a meal. Indeed, during a prolonged fast, infusing a small amount of alanine causes plasma [glucose] to rise.
Increased Renal Gluconeogenesis While hepatic gluconeogenesis falls, renal gluconeogenesis rises (Fig. 58-14), to reach as much as 40% of whole-body glucose production. Renal gluconeogenesis, which consumes H+ (see Fig. 39-5A), most likely is an adaptation to the acidosis that accompanies ketogenesis. Indeed, acidosis stimulates renal ammoniagenesis in parallel with renal gluconeogenesis.
Increased Lipolysis and Ketogenesis During the first 3 to 7 days of fasting, hypoinsulinemia accelerates the mobilization of FAs from adipose tissue and causes plasma levels of FAs to double; FA levels remain stable thereafter. The combination of low insulin and high glucagon levels also increases hepatic oxidation of FAs and leads to a marked increase of hepatic ketogenesis (Fig. 58-14) or ketogenic capacity. The liver achieves peak rates of ketone body production (~100 g/day) by the third day and maintains them thereafter. Low insulin levels also progressively reduce the extraction of ketone bodies by peripheral tissues. Thus, despite relatively stable rates of ketone body production, circulating levels of ketone bodies continue to rise throughout the next few weeks. As a result, the CNS receives an increasing supply of these water-soluble substrates, which eventually account for more than one half of the brain’s energy requirements. In this way, ketone bodies ultimately supplant the brain’s dependency on glucose. Thus, by limiting the brain’s gluconeogenic demands, the body preserves protein stores. Besides the CNS, other body tissues, especially the heart and skeletal muscle, can use ketone bodies to cover a significant proportion of their energy demands.
As the fast progresses, and fat stores are depleted, levels of leptin decrease. This decrease in leptin levels is a protective signal that profoundly affects the hypothalamic-pituitary-gonadal axes and reduces the oscillations of luteinizing hormone and follicle-stimulating hormone that cause anovulation. In times of famine, this mechanism protects fertile women from the additional nutritional demands associated with pregnancy.
In summary, the body has evolved powerful adaptive mechanisms that ensure adequate substrate supply in the form of glucose and ketone bodies during a prolonged fast to maintain adequate CNS function. Even during a prolonged fast, humans do not lose consciousness because of decreased substrate supply to the brain. Instead, death under these conditions typically occurs when fat stores are depleted and severe protein wasting causes failure of respiratory muscles, which, in turn, leads to atelectasis and terminal pneumonia.
Books and Reviews
Hillgartner FB, Salati LM, Goodridge AG: Physiological and molecular mechanisms involved in nutritional regulation of fatty acid synthesis. Physiol Rev 1995; 75:47-76.
Jequier E, Tappy J: Regulation of body weight in humans. Physiol Rev 1999; 79:451-480.
Koretsky AP: Insights into cellular energy metabolism from transgenic mice. Physiol Rev 1995; 75:667-688.
Palmieri F: The mitochondrial transporter family (SLC25): Physiological and pathological implications. Pflugers Arch 2004; 447:689-709.
Shulman GI, Landau BR: Pathways of glycogen repletion. Physiol Rev 1992; 72:1019-1035.
Stahl A: A current review of fatty acid transport proteins (SLC27). Pflugers Arch 2004; 447:722-727.
Wilson JD, Foster DW, Kronenberg HM, Larsen PR (eds): Williams Textbook of Endocrinology, 9th ed. Philadelphia: WB Saunders; 1998.
Journal Article
Abu-Elheiga L, Wonkeun O, Parichher P, Wakil SJ: Acetyl-CoA carboxylase 2 mutant mice are protected against obesity and diabetes induced by high-fat/high-carbohydrate diets. Proc Natl Acad Sci U S A 2003; 100:10207-10212.