Chapter 40 Positron emission tomography (PET) scanning
Chapter contents
40.1 Aim
The aim of this chapter is to introduce the reader to the principle of positron emission tomography (PET) scanning as practised in diagnostic imaging. The assumption is made that the reader is familiar with the mechanisms of positron production from a radionuclide as described in Chapter 19 (Section 19.5.2.).
40.2 Revision of positron physics
As was discussed in Chapter 19, if a nucleus has too few neutrons for stability, it is possible for the nucleus to achieve a more stable configuration by the emission of a positron. Positrons are the antiparticles of electrons and the positron and the electron will interact (within a very short distance in tissue), annihilating each other and producing two photons of annihilation radiation. These photons each have an energy of 0.51 MeV (511 keV) and detection of these photons forms the basis of positron emission tomography. Each photon is produced at an angle close to 90° to the direction of travel of the positron (see Fig. 19.7).
40.3 Detection of positrons
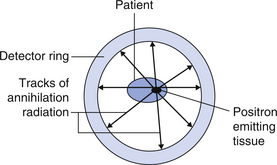
If a positron-emitting radionuclide is introduced into the patient, it can be labelled in such a way that it concentrates in specific structures. The number of positrons emitted by these structures can be related to the activity of the cells within the structure. If we surround the patient with a ring of positron detectors (see Fig. 40.1) then each annihilation radiation from the positron–electron interaction can be registered and the intersections of these points can be ‘back-projected’ to indicate the positron-emitting tissue in the patient.
40.3.1 Types of coincidence
For the annihilation radiation from the positron–electron interactions to give useful information, the two photons must travel in straight lines from the source of the radiation to the detectors. The photons in (A) of Figure 40.2 are of this type.
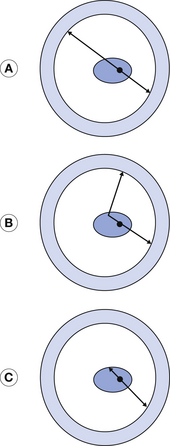
Figure 40.2 Types of coincidence. (A) is a true coincidence. In (B), one of the photons is scattered and in (C), one of the photons is absorbed. This makes (B) and (C) false coincidences.
Because the photons all travel with the velocity of electromagnetic radiation, they will each be detected by a detector almost at the same time – within <10×10−9 sec of each other. These photons are said to be coincident. It is possible for one of the photons to be scattered (see Fig. 40.2B). If the position of these two photons were back- projected, it would be an incorrect position for the origin of the annihilation radiation. Because the scattered photon travels along a slightly longer route, the two photons will not be detected within 10×10−9 sec of each other and so they are not said to be coincident and the imaging computer can be programmed to ignore them. Similarly, in Figure 40.2C, one of the photons has been absorbed. Because there is no matching coincident photon, the imaging computer will again ignore this event.
40.3.2 Detector materials
In the gamma camera (see Ch. 37), the radiation is detected using a sodium iodide crystal. The radiation from technetium-99m has an energy of 140 keV. The energy of the annihilation radiation from the positron–electron interaction is 511 keV. The greater energy of this radiation requires a material of higher density and/or higher atomic number. Bismuth germinate (BGO) is the material of choice for the detector crystals.
40.3.3 Detector mechanisms
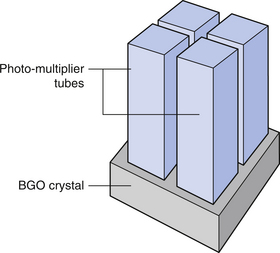
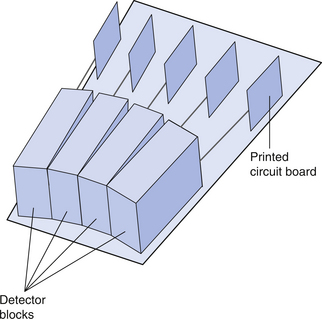
The basic components of the detector mechanism are BGO crystals over which photomultiplier tubes or photodiodes are positioned as shown in Figure 40.3. These arrangements are known as blocks. Each photomultiplier tube detects the light emission as the result of the radiation photons interacting with the crystal. Groups of blocks (see Fig. 40.4) arranged with shared electronics form detector cassettes and a number of these detector cassettes form a detector ring around the patient.
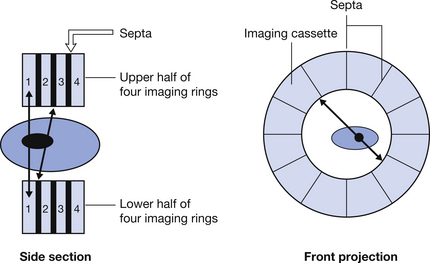
Normally there is more than one ring so that we can detect information from a number of slices simultaneously. To avoid oblique rays from one slice interfering with the image on another ring, the rings are separated by septa made of lead or tungsten (see Fig. 40.5).
40.4 Radionuclides used in pet scanning
Three of the common radionuclides used in PET imaging are the following:
40.5 Modern trends in pet scanning
There are two modern trends in PET scanning which will be discussed.
40.5.1 Time of flight (TOF) profiles
If we consider the method of producing images of the positron annihilation discussed so far, the radiation is detected by two detectors thus establishing the line in which the positron emission has taken place. The image of this event is then produced by ‘back projection’ of the information along the whole of this line. In TOF scanners, the precise time taken for each of the photons to reach its detector is measured. As can be seen in Figure 40.6 (see page 300), the distance D1 is greater than the distance D2 so this first photon will take slightly longer to reach the detector than the second photon. If we know the velocity of electromagnetic radiation (3×10⁸ m.s−1) then we can get a more accurate calculation of the distance travelled by each photon. Thus, in the back projection of the image, instead of simply saying the photons were emitted somewhere along this line, we can say more precisely the position of the emitted radiation on the line. This is illustrated in Figure 40.7 (see page 300).
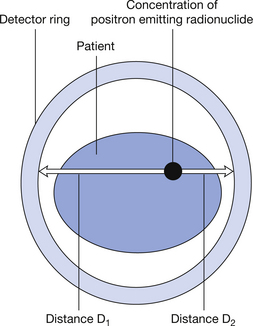
Figure 40.6 Line diagram to explain TOF technology. The distances D1 and D2 from the source of activity to the detectors is shown by the open arrows.
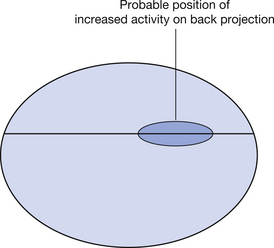
Figure 40.7 Back-projected image showing the probable position of the area of increased activity from the TOF calculations.
No timer is 100% accurate so there is always some degree of positional uncertainty. The fact that we are able to more accurately calculate the positions of the emitted radiation photons means that we get improved resolution in the image.
40.5.2 Hybrid scanners
PET scanning gives us information regarding the position of high physiological activity. It, however, gives little or no information about related normal anatomy. This makes the interpretation of the images and the management of the patient a more difficult task. For this reason, scanners have been constructed which give anatomical information (e.g. from a computed tomography or magnetic resonance imaging scan) and physiological information (e.g. from a PET or single photon emission computed tomography (SPECT) scan). The images from each modality may be superimposed to give a composite image of the anatomy and physiology of a region. These scanners are known as hybrid scanners and will form the topic for Chapter 41.
In this chapter, you should have learnt the following:
• A basic revision of positron physics (see Sect. 40.2).
• Methods of detecting positrons in PET scanning (see Sect. 40.3).
• Some of the more common radionuclides used for PET scanning (see Sect. 40.4).
• Some of the modern trends in PET scanning (see Sect. 40.5).
Further reading
Chapter 41 of this text will discuss hybrid scanners. Addition information on PET scanning may be found in:
Bailey D.L., Townsend D.W., Valk P.E. Positron Emission Tomography. London: Springer, 2005.
Wahl R.L., Buchan J.W. Principles and Practice of Positron Emission Tomography. Baltimore: Lippincott, Williams and Wilkins, 2002.