Chapter 5 Therapeutic Drug Monitoring
Therapeutic drug monitoring (TDM) is a tool for guiding the design of an effective and safe regimen for drug therapy in the individual patient. Monitoring can be used to confirm a plasma drug concentration (PDC) that is above or below the therapeutic range, thus minimizing the time that elapses before corrective measures can be implemented for the patient.1-3 Knowledge of the principles of drug disposition (see Chapter 1) and the factors that determine these principles in the individual patient (see Chapter 2) facilitate an understanding of the use of and need for TDM.
Fixed dosing regimens are designed to generate PDCs within a therapeutic range—that is, achieve the desired effect without producing toxicity. Dosing regimens are based on the patient’s clinical response to the drug. Therapeutic success is most likely to occur if doses are based on scientific studies performed in the target species intended to receive the drug for the intended reason. Marked interindividual variability has, however, been confirmed for many drugs4,5 owing to physiologic (e.g., species, breed, age,6 gender), pathologic (e.g., renal, hepatic, cardiac diseases)7-10 or pharmacologic (i.e., drug interaction)5,7,11,12 effects. Prudent clinicians modify dosing regimens when possible to compensate for the impact of some of these factors on drug disposition. However, the combined effects of these factors are often unpredictable. A trial-and-error approach to dose modification may be successful but is most appropriate when response to the drug can be easily measured. Examples include “to effect” drugs such as gas inhalants and ultrashort thiobarbiturate anesthetics, rapidly acting anticonvulsants such as diazepam, and lidocaine for the treatment of ventricular arrhythmias. The trial-and-error approach also might be reasonable for illnesses that are not serious or do not require immediate resolution and for drugs characterized by large therapeutic windows, that are generally safe at high doses, However, trial-and-error modification can be inefficient and potentially dangerous when the drug response cannot be easily measured, the drug is characterized by a narrow margin of safety, or the patient’s life is threatened.
Drugs and Indications
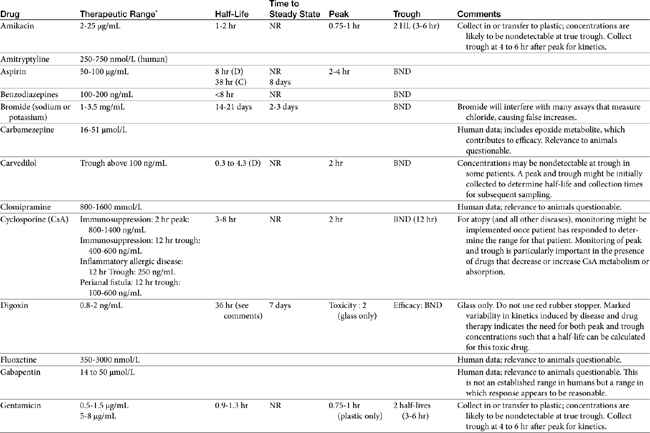
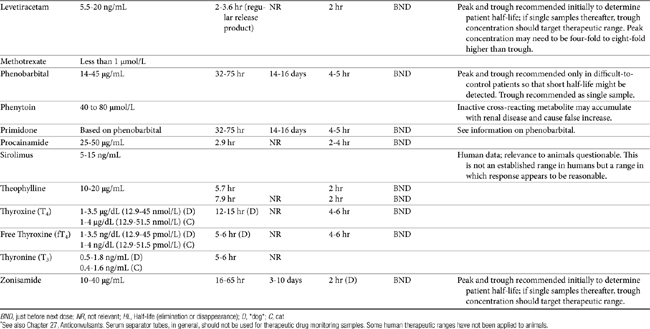
TDM is not indicated for all drugs; rather, it is indicated when patient health is at risk (Box 5-1). Not all drugs can be monitored by TDM; certain criteria must be met (Box 5-2). 13 Patient response to the drug must correlate with PDC. Drugs whose metabolites are active (e.g., diazepam) or for which one of two enantiomers compose a large proportion of the desired pharmacologic response generally cannot be monitored effectively by measuring the parent drug.14 Rather, all active metabolites, the parent drug, or both or the pharmacologically active enantiomer should be measured. The drug must be measurable at concentrations within the targeted therapeutic range in a relatively small sample size, and analytic methods must be available to detect the drug rapidly, precisely and accurately in the target species.15 Methods must be specific for the drug of interest and able to differentiate it from other compounds. Prior to choosing a laboratory for monitoring purposes, the laboratory also should be queried regarding quality-control procedures to ensure that they are followed and assays used in animals have been validated for that species. Ideally, the laboratory will participate in some type of external validation program. Attention should be given to how the sample collected from the patient is handled. The cost of the analytic method must be reasonable. Drugs that meet these criteria and for which TDM has proved useful in veterinary medicine include, but are not limited to, selected anticonvulsants (phenobarbital, bromide, selected benzodiazepines zonisamide and levetiracetum), antimicrobials (e.g., aminoglycosides-gentamicin, and amikacin); cardioactive drugs (digoxin, procainamide, lidocaine, and quinidine); theophylline, and cyclosporine (Table 5-1).
Box 5-1 Drugs for Which TDM Is Most Useful
Box 5-2 When to Implement Monitoring
Monitoring may be most effective if either or both minimum (Cmin) and maximum (Cmax) ranges have been established for the drug in the species and for the disease being treated.4 However, the importance of the therapeutic range should not be overestimated. Although not “normals,” therapeutic ranges of drugs also are population statistics, based on the PDC at which most patients (e.g., 95%) with the targeted disease might be expected to respond. However, although the therapeutic range offers a reasonable target for most animals, exactly where in the range the individual patient will respond is not known. It is this patient-specific concentration that is identified through monitoring—that is, monitoring establishes the therapeutic range for the individual patient. As such, it is indicated to establish the baseline response in a patient that has adequately responded to therapy. Note that some animals will respond at concentrations below or above an established therapeutic range. However, dosing regimens need not necessarily be increased or decreased, respectively, for those patients unless the patient is put at risk for subtherapeutic failure or toxicity, respectively.
Therapeutic ranges do offer a target for drug therapy and are ideally based on well-controlled clinical trials in the target species. However, most recommended therapeutic ranges in animals have been extrapolated from those determined in humans. Although these ranges have proven useful, none-the-less, studies confirming the applicability of these ranges to animals are warranted. Determination of these ranges can be facilitated if adequate patient information accompanies a patient sample submitted for monitoring (see Box 5-1). Procainamide is an example of a drug for which recommended therapeutic ranges might differ between dogs and humans because of pharmacokinetic differences. Dogs do not produce the acetylated active metabolite as efficiently as humans; therefore procainamide concentrations should be higher in dogs than in humans. Primidone (rarely used currently) is an example in cats: its efficacy in dogs depends on conversion to phenobarbital, which does not happen to a significant degree in cats. Bromide offers another example of pharmacodynamic differences: whereas concentrations above 1.5 mg/mL might be considered toxic in people, they are in the low- to mid-therapeutic range in epileptic dogs. The therapeutic range for a drug also varies with the therapeutic intent (e.g., cyclosporine and perianal fistulas versus immunosuppression).
As with clinical pathology reference ranges, the range for a specific laboratory also may vary with the methodology, and specifically whether or not metabolites are detected by the methods. As such, the laboratory should be specifically queried regarding its therapeutic range for a particular assay. Assays that are based on antibodies (e.g., enzyme-linked immunosorbent assay [ELISA], radioimmunoassay [RIA], polarized immunofluorescence [PIFA]) may detect both the parent compound and those metabolites most chemically similar to it. Monoclonal antibody–based immunoassays are less likely to detect metabolites than polyclonal antibody-based assays but nonetheless, may not be able to discriminate among very subtle changes in drug chemistry induced by metabolism. Therapeutic ranges for antibody-based assays generally are higher than those that detect only the parent compound. Which assay is preferred depends on the activity of the metabolites: if the metabolite is active, immunoassays may more accurately predict response compared with assays based on parent compound only. Cyclosporine, benzodiazepines, procainamide, behavior modifying drugs, and beta blockers are examples of drugs that might have active metabolites.
KEY POINT 5-1
A therapeutic range, is not a “normal,” but like a “normal” is a population statistic. Monitoring should be used to determine the patient’s therapeutic range, which may be below or above the population therapeutic range.
The cost of monitoring will vary among drugs, depending in part on the methods used. An advantage of high-performance liquid chromatography (HPLC) assays is their specificity for the target compound, and discrimination between parent compound and metabolites. However, assays based on HPLC tend to be more expensive because the methods are tedious, generally requiring very lengthy assay time, greater instrument and personnel dedication, and more sophisticated technology compared to that required for automated assays. Automated assays tend to more predictable, with quality assurance easier to achieve.
Implementation
Number and Timing of Samples: One Versus Two, Peak Versus Trough
Samples for monitoring generally are collected at peak (Cmax, highest PDC during a dosing interval), trough (Cmin, lowest, generally just before the next dose), or midway during the dosing interval. The type of sample and the number of samples collected depend on the goal of monitoring and the amount of drug that is eliminated during a dosing interval—that is, the elimination half-life of the drug.
For drugs with a long half-life compared to the dosing interval, because drug concentrations will not fluctuate significantly during the interval, variability in drug concentrations may reflect instrument variability, rather than drug disposition. For such drugs (e.g., bromide and, in most patients, phenobarbital or zonisamide), the timing of sample collection probably is not important and a single sample collected at any time is sufficient. However, a trough sample just before the next dose is almost always the lowest concentration that will occur with each dose, and as such is generally recommended if a minimum concentration must be maintained (e.g., anticonvulsants). In general, response to therapy and TDM should not be performed unless maintenance dosing has been sufficiently long for PDC to reach “steady state” (3 to 5 drug half-lives). An exception includes situations in which a loading dose has been administered (see below). If a loading dose is not given, the drug will accumulate (see Chapter 1) as steady state is reached (Figure 5-1). The time to steady state varies among drugs and for some drugs is quite variable among animals (see Table 5-1).
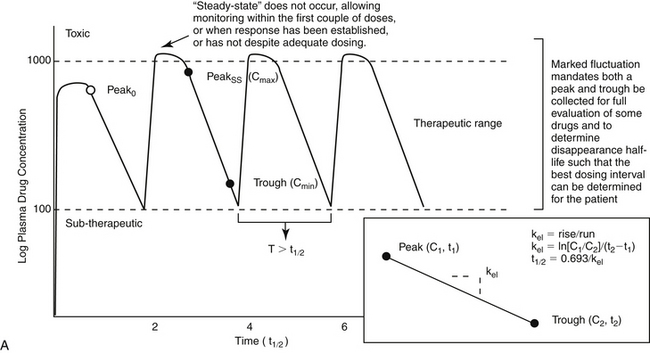
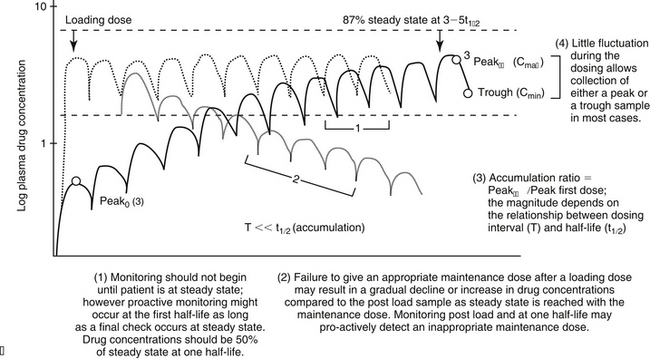
Figure 5-1 The timing of sample collection and the duration of therapy that should elapse before monitoring is implemented varies with the relationship between dosing interval and half-life of the drug. (A) Drug concentrations across time for a drug dosed at an interval that approximates its elimination half-life. For such drugs, concentrations fluctuate by 50% during a dosing interval, and drug concentrations at steady state will accumulate twofold compared to the first dose. Response to therapy and thus therapeutic monitoring are likely to occur within the first three to five doses. Both peak and trough samples should be collected to characterize the degree of fluctuation in drug concentrations during the dosing interval, thereby ensuring both that toxic concentrations do not occur as the drug peaks and that subtherapeutic concentrations do not occur just before the next dose. Peak and trough samples allow calculation of the elimination half-life (inset) and thus a more accurate determination of a proper dosing interval. (B) For drugs whose elimination half-life is much longer than the dosing interval, the drug will accumulate across time, with maximum accumulation occurring only at three to five drug elimination half-lives. Steady state will be achieved only at this time. The time to steady state starts over each time the dosing regimen is changed, including transitioning from a loading dose to a maintenance dose (coarse dotted lines). The maintenance dose is designed to maintain what the loading dose achieved (fine dotted line). However, if over or under dosed, drug concentrations will gradually change (decline demonstrated with fine dotted lines), until a new steady state is reached. Therapeutic failure may occur. C1, C2 = concentration of samples 1 and 2, respectively; kel = elimination rate constant; peak0 = peak following first dose; peakss = peak at steady state; T = interval; t1/2 = drug elimination half-life; t1, t2 = time samples 1 and 2 were collected, respectively.
For drugs with very-long half-lives, the clinician may want to proactively assess the likelihood that the dose will result in targeted drug concentrations at steady state. Concentrations achieved after one half-life of dosing can be doubled to predict steady state concentrations. If predicted deviates substantially from target, the dose can be modified at that time, with a confirmatory check at steady state.
In contrast to drugs with a long half-life compared to the dosing interval, if the drug elimination half-life is sufficiently smaller than the interval such that peak and trough concentrations fluctuate by 25% or more, both timing and number of samples should be based on the intent of monitoring. For example, if toxicity is a concern, a single concentration might be sufficient and a peak concentration (generally 2 hr post oral dosing) is preferred. In contrast, if efficacy throughout a dosing interval is the priority, a single sample might be sufficient, but a trough sample might be preferred. The least helpful sample is one collected mid-interval. However, caution is indicated with either a single peak or a trough because in both situations the information provided with a single sample does not reflect the state of drug concentrations for the duration of the dosing interval. For drugs with short half-lives, while each dose is likely to reach or exceed peak concentrations that approximate the maximum recommended range, each trough concentration that occurs just before the next dose is likely to reach or drop below the minimum therapeutic range. If trough concentrations for such a drug are determined to be nontherapeutic and a decision is made to increase the dose, while trough concentration may exceed the target minimum as intended, peak concentrations may also become toxic. If peak concentrations are toxic and a decision is made to lower the dose, although peak concentrations may drop below the toxic range as intended, trough concentrations may then become subtherapeutic. An added advantage to collection of both peak and trough concentrations is that the elimination half-life of the drug can then be determined, providing a basis for determining the most appropriate dosing interval.
One reason that either a peak or trough might be selected is the recommended therapeutic range is based on either a peak or a trough sample. However, such recommendations generally assume the recommended dosing interval also is being followed. This is exemplified by cyclosporine, for which the recommendations for efficacy for immune suppression (extrapolated from humans) are based on the assumption of a 12-hour dosing interval and a sample collected at either a 2-hour peak or a 12-hour trough.
For some drugs, the elimination half-life changes across time in the patient. The decision to collect both a peak and trough for such drugs may depend on the elimination half-life, which in turn, can be documented as short only by collecting both a peak and a trough sample. This is exemplified by phenobarbital, for which the elimination half-life may initially be longer than the dosing interval (i.e., more than 48 hours) but after induction (i.e., several months into therapy) may be much shorter (i.e., less than 12 hours) in the same patient (Case Study 5-1). Digoxin provides a good example of the risk associated with collecting only a single sample when assessing efficacy. Digoxin is characterized by a half-life that ranges from less than 12 hours, thus allowing concentrations to become subtherapeutic during a 12-hr dosing interval, to more than 36 hours (particularly in patients with renal disease), which is likely to lead to drug accumulation (Case Study 5-2). The half-life can change again if the patient responds to therapy for cardiac failure. If toxicity is suspected, a single sample collected at the time that clinical signs of toxicity appear can confirm toxicity. Neither toxicity nor efficacy can be confirmed throughout the dosing interval, however, unless two samples (peak and trough) are collected (Case Study 5-3).
If a kinetic profile of a patient is the reason for TDM, at least two samples must be collected to establish a PDC-versus-time relationship (Case Study 5-5). For such drugs, the samples preferably are collected at the peak and trough times. Regardless of the route of drug administration, with two data points, elimination (disappearance) half-life can be calculated. However, a more comprehensive kinetic profile can be built from the same two data points for a patient receiving an intravenous dose: volume of distribution (Vd) and clearance can then be estimated in addition to drug elimination half-life.
Loading doses warrant a special note. Loading is implemented with the goal of achieving steady state concentrations immediately. The advantage is to avoid the delay that otherwise will occur as steady state is gradually reached. The disadvantage is that the body will not have time to accommodate to side effects. As such, loading should be limited to situations in which failed response might be life-threatening. Although the design of the loading dose may be successful in achieving target steady state concentrations (see calculations below), the patient is not yet at steady state and will not be until the same dosing regimen has been implemented for 3 to 5 half-lives. Thus, as the patient transitions from the loading to the maintenance dose, the time to steady state begins again. If the maintenance dose fails to maintain what the loading dose achieved, then drug concentrations will gradually decline or increase until steady state is achieved (Figure 5-1, B). Because the majority of the change will occur in the first half-life of maintenance dosing, clinical signs of failure or toxicity may be more likely to occur during this initial half-life. Proactive monitoring after the loading dose has been absorbed and again at the first half-life will allow the clinician to assess the effectiveness of the maintenance dose. However, both samples must be collected for the assessment. Collecting a sample one half-life after the loading dose without a postload sample is minimally informative. For example, when using a loading dose for bromide, TDM should be performed three times. The first time to monitor is after oral absorption of the last of the loading doses to establish what the loading dose accomplished (i.e., day 6). The second time is at one drug half-life later (e.g., at 21 days for bromide) to ensure that the maintenance dose is able to maintain concentrations achieved by loading. Collection of this second sample at the one drug half-life point is recommended because most of the change in drug concentrations that will occur if the maintenance dose is not correct will occur during the first half-life. If the second sample (collected at one drug half-life) does not approximate the first (collected immediately after the loading doses), the maintenance dose can be modified at this time rather than wait for steady state, with the risk of therapeutic failure or toxicity. The third time to monitor bromide when using a loading dose is at steady state (e.g., 3 months) to establish a new baseline.
KEY POINT 5-2
The maintenance dose that follows the loading dose must maintain what has been achieved with the loading dose. Monitoring of drugs dosed as a load should occur shortly after the loading dose is given and then one half-life into the maintenance dose. If the two concentrations do not match, the maintenance dose should be modified.
The timing of sample collection also must take into account the pharmacodynamic response of some drugs. For example, many antimicrobials (e.g., aminoglycosides) are characterized by a half-life that is less than 2 hours (e.g., amikacin in dogs) but are given at much longer dosing intervals (e.g., 24 hours). The peak sample is important for determination of efficacy of this concentration-dependent drug. Because 12 half-lives will have elapsed before the next dose, less than 2% of the original dose will remain in the body at true trough concentrations, and concentrations are not likely to be detectable at true trough (i.e., 24 hrs after dosing). Although the absence of detectable drug may be sufficient information if safety is the reason for monitoring an aminoglycoside, kinetics (e.g., half-life) cannot be determined. Therefore collection of both a 2-hour peak and and a sample two to four elimination half-lives later will allow calculation of a half-life and extrapolation of concentrations at trough (Case Study 5-5). Cyclosporine is another example: if administered every 24 to 48 hours, because its half-life in normal dogs approximates 4 to 5 hours, little drug will be detected at 24 to 48 hours.
Specific timing of peak PDC collection is more difficult to determine accurately than that of trough concentrations. Peak PDC should be determined after drug absorption and distribution are complete (see Chapter 1). Route of drug administration can influence the time at which peak PDCs occur, which varies among drugs. For orally administered drugs, absorption is slower (1 to 2 hours), and distribution is often complete by the time peak PDCs have been achieved. The absorption rate can, however, vary widely due to factors such
CASE STUDY 5-1 THERAPEUTIC FAILURE DUE TO PHENOBARBITAL INDUCTION OF DRUG METABOLIZING ENZYMES
Pertinent History
A diagnosis of epilepsy was made 6 months before presentation. Patient was suffering from severe cluster seizures. There was an initial response to phenobarbital, but seizures occurred again 6 months into therapy.
Duration of Current Regimen
Six months. Phenobarbital concentrations at 3 months (baseline) were 35 μg/mL (peak) and 31 μg/mL (trough). Elimination half-life at that time was 40 hours.
Patient Response
Seizure control initially improved, and there was no evidence of grogginess. The patient suffered a series of cluster seizures this weekend. The referring veterinarian was interested in adding an alternative anticonvulsant (e.g., bromide).
Recommendation
Increase phenobarbital dose to 7.5 mg/kg every 12 hours (4.5 mg/kg × 30 μg/mL per 18 μg/mL), targeting a peak concentration of 30 μg/mL. Retest at new steady state (which will take only 3 to 5.5 days in this patient).
Comments
Phenobarbital concentrations decreased in this patient by nearly 50% without a decrease in dose. The elimination half-life decreased by 50%. The decrease most likely reflects induction of drug-metabolizing enzymes by phenobarbital, resulting in increased clearance and decreased drug concentrations. Induction occurs in most animals and should be anticipated by using a sufficiently high starting dose (2 mg/kg) for phenobarbital and measuring drug concentrations at steady state (approximately 2 weeks after therapy is begun) and then again at 3 months.
Follow-Up
The dose was increased to 6.5 mg/kg. Drug concentrations 1 month later were 33 mg/mL (peak) and 29 mg/mL (trough). The patient has been seizure-free for 6 months. The high phenobarbital dose and the short half-life indicate that induction, and thus metabolism, may be marked in this patient. It is possible that increased production of metabolites places this patient at risk for phenobarbital-associated hepatic disease. Accordingly, the addition of a second anticonvulsant that will allow a decrease in phenobarbital dose might be appropriate.
as product preparation, the effect of food, and patient variability. Obviously, a drug prepared as an elixir will be absorbed more rapidly than the same drug prepared as a capsule or tablet. Because food can slow the absorption of many drugs, fasting is generally indicated (if safe) before TDM. Generally, peak PDCs occur 1 to 2 hours after oral administration. Some drugs are simply absorbed more slowly than others (e.g., phenobarbital), and the time of peak PDC sample collection is longer (e.g., 2 to 5 hours for phenobarbital). For drugs administered intravenously, distribution, but not absorption is a concern. For delayed-release drugs, a sample at any time may be acceptable. For some intramuscular and subcutaneous administrations, absorption occurs rapidly (i.e., 30 to 60 minutes), but, again, drug distribution may take longer. Thus peak PDCs generally are measured 1 to 2 hours after parenteral drug administration (see Table 5-1).
Other Considerations
Sample requirements vary not only in the blood component (e.g., serum, plasma, whole blood, urine, etc) but also in the volume and sampling handling. Constituents in plasma differ substantially among species, and these constituents can interfere with the methodology of some assays. Removal of these constituents varies with the methodology, with the sample size generally being larger for assays that require more clean-up (e.g., HPLC vs. antibody-based assays). Laboratories chosen for monitoring should be queried before sample submission to ensure that the proper submission procedures are followed.
CASE STUDY 5-2 DIGOXIN-INDUCED TOXICITY; LONG ELIMINATION HALF-LIFE
Pertinent History
The patient has been receiving digoxin therapy for 6 months. Within the last 3 months, renal disease has become decompensated. The day before presentation, the patient vomited and became ataxic and disoriented. Patient blood urea nitrogen is 82 mg/dL, and creatinine is 1.57 mg/dL.
Recommendation
Concentrations are at the upper end of the therapeutic range and are not necessarily consistent with toxicity, but a decrease in dose by about 20%, targeting 2.0 ng/mL, would be prudent. Clinical signs of uremia cannot be distinguished from clinical signs of digoxin toxicity. Prolonging the interval to at least 24 hours also would be appropriate. Collecting a peak and 24-hour trough concentration would be indicated to determine the proper dosing interval.
Comments
The prolonged half-life for digoxin in this patient presumably reflects decompensated renal disease. Note that both a peak and a trough sample were helpful in establishing the prolonged drug elimination half-life. Without both samples, the duration of the half-life and the magnitude of decreased clearance could not have been appreciated (see Case Study 5-4). Should the patient respond to therapy for its renal disease and digoxin elimination improve, monitoring is again indicated to establish a new dosing regimen because drug half-life is likely to decrease.
CASE STUDY 5-3 DIGOXIN THERAPY; RESPONSE AND SHORT HALF-LIFE
Pertinent History
The patient has been receiving digoxin therapy for 8 days. Patient has responded to therapy and is showing no evidence of toxicity.
Recommendation
Concentrations are above the upper end of the therapeutic range, but with no evidence of toxicity, the dose should not necessarily be changed. With a 12-hour half-life, the dosing interval should not be prolonged (and could be reduced to an 8-hour dosing interval with the same total daily dose). Leave dosing regimen as is, or decrease dose by 10%.
Comments
Compare the drug half-life in this patient with the reported normal (24 hours) and with that in Case Study 5-2. Had a single sample been collected halfway through the dosing interval, concentrations would have been in the lower end of the therapeutic range, and the dose may have been inappropriately increased. The half-life in this patient indicates that the dosing interval should not be longer than 12 hours. Should a 24-hour dosing interval be used, trough drug concentrations would approximate 0.35 ng/mL.
CASE STUDY 5-4 THEOPHYLLINE–ENROFLOXACIN DRUG INTERACTION
Chief Complaint
Hyperactivity. Allergic rhinitis has been present for 2 months. There is radiographic evidence of lung lobe consolidation, and clinical signs are compatible with pneumonia that developed 1 week before presentation.
Pertinent History
Theophylline therapy begun 3 days before presentation. The patient began exhibiting signs of hyperactivity and restlessness 24 hours before presentation.
Other Drugs
Enrofloxacin 2.5 mg/kg every 12 hours orally (begun at the same time as theophylline); prednisolone 1 mg/kg every 48 hours
Recommendation
Decrease the dose by half, or decrease the dose by 25% and prolong the dosing interval by 12 to 24 hours. Retest at the new steady state (in 3 days) and at discontinuation of enrofloxacin.
Follow-Up
After monitoring, the dosing interval was prolonged to 24 hours, and the dose was decreased by 50% from 20 to 10 mg/kg. A recheck revealed a peak and trough concentration of 12.3 μg/mL and 10.3 μg/mL at 2 and 22 hours, respectively. Near subtherapeutic concentrations indicated that either the dose might be increased or the interval decreased to 12 hours.
Comments
The fluorinated quinolones can increase concentrations of theophylline when the two drugs are given simultaneously. The mechanism is presumed to be due to impaired drug metabolism by enrofloxacin with subsequent decreased theophylline clearance. This drug interaction is well established for ciprofloxacin in humans and also has been documented for enrofloxacin. The drug elimination half-life of theophylline in this patient while receiving enrofloxacin was 19 hours, which is twice that expected in dogs.
CASE STUDY 5-5 AMINOGLYCOSIDE AND INTENSIVE FLUID THERAPY
Pertinent History
Surgical correction of prostatic abscess; drug samples collected 24 hours postoperatively
Recommendation
A peak concentration of 10 μg/mL is sufficient for anticipated efficacy toward a microbe susceptible to gentamicin at 1 μg.mL or less. Double the dose to target 20 μg/mL (assuming a minimal inhibitory concentration of 1 to 2 μg/mL), and maintain current 24-hour dosing interval.
Follow-Up
The patient’s condition remained critical for 2 more postoperative days but then began to improve progressively. The patient was discharged 10 days postoperatively.
Comments
Actual peak gentamicin concentration was lower than expected (expected: 10 μg/mL), presumably because of intensive fluid therapy. The reported volume of distribution for gentamicin in dogs is 0.25 L/kg, but it was 0.45 L/kg in this patient. Gentamicin is distributed to extracellular fluid, which was probably increased in this patient by fluid therapy. A nearly doubled distribution volume resulted in a near halving of peak concentrations. The drug elimination half-life in this patient is 2.4 hours, which is normal. Doubling of the dose will add only one drug half-life to the time that target trough concentrations (<1 μg/mL) will be reached, which currently occurs by 9 hours in this patient. Even if the drug elimination half-life were to double (to 5 hours), sufficient time will elapse during a 24-hour dosing interval to allow drug concentrations to reach the targeted 1 μg/mL. Note that the trough sample was not collected in this patient just before the next dose (i.e., at 24 hours). The drug would not have been detectable at that time; hence trough concentrations were collected after two predicted drug half-lives had elapsed.
Some drugs may require refrigeration or freezing. Sample size may vary for each drug or even for the same drug depending on the method the laboratory uses. Drugs can interact with the containers in which they are collected or mailed. In general, serum separator tubes should not be used to collect or mail samples containing drug. Drugs can bind to the silicone gel, which decreases concentrations measured in blood. Aminoglycosides can bind to glass; samples should be collected and submitted in plastic tubes. The effects of hemolysis and hyperlipidemia on drug assays vary. In general, it is wise to avoid either in sample collection. Although sample handling is often the same for each drug, the laboratory to which the sample will be submitted should be contacted before the sample is sent for TDM analysis. Details regarding timing of sample, collection, storage apparatus (i.e., tubes and anticoagulants), mailing instructions (including conditions), and cost should be known before collection.
Interpretation
Information Needed for Therapeutic Drug Monitoring
For best results, a sample submitted for monitoring should be accompanied by all relevant information that the clinical pharmacologist needs to evaluate the relationship among dose, concentration, and response in the context of physiologic, pharmacologic, and pathologic factors that might alter this relationship (Box 5-3).
Box 5-3 Maximizing the Interpretation of Therapeutic Drug Monitoring
First and foremost, involve a clinical pharmacologist in the interpretation of problematic cases.
The minimum information necessary for interpretation of therapeutic drug monitoring (TDM) by a clinical pharmacologist includes the following:
Concentrations must be evaluated in the context of the clinical patient, the mechanism of drug action and the therapeutic intent of monitoring or drug administration. The history of the patient also may be important information. For example, a subtherapeutic range in a controlled seizure patient may not require manipulation if the seizure history of the patient is not severe, but higher concentrations might be prudent if historically, the patient suffers cluster seizures. The absence of seizures in a dog with subtherapeutic concentrations also is not justification for discontinuing the drug. At the other end of the range, some animals may respond only if concentrations are higher than the recommended maximum concentration. Drug concentrations need not necessarily be reduced if there is no concern regarding toxicity or unacceptable side effects, even if the maximum therapeutic range has been surpassed (e.g., bromide).
Dose Modification with Kinetic Calculations
Most dose modifications do not require kinetic calculations (discussed in more detail later). Target calculations include elimination half-life on which the proper dosing interval and time to steady state can be based, and, for a drug given intravenously, Vd or clearance. The minimum number of data points needed to develop a pharmacokinetic profile in a patient is two. Generally, for TDM these two samples consist of the peak and trough (see Figure 5-1, A) collected during a single dosing interval at steady state. Alternatively, for the sake of convenience, a trough sample can be collected just before a dose and the peak sample collected 2 to 5 hours (when appropriate for the drug) after dosing. This protocol assumes that the drug is handled the same way by the body during each dosing regimen and that the dose is the same. Although this may be true, conditions such as diurnal variation can alter drug disposition between dosing intervals. Oftentimes, the dose is not the same for both morning and evening.
Regardless of when the samples are collected (assuming that they are collected after absorption and distribution are complete), when the points are plotted on semilogarithmic paper, the slope between the two points reflects kel (or, if non-IV administration, kdisappearance) (see Figure 5-1, A), which is used to determine drug half-life in the patient (see Chapter 1). Half-life can be either calculated or estimated from the PDC-versus-time curve drawn on semilogarithmic paper. The two points are connected, and the resultant line is extrapolated to both the x and y axes. For estimation, the time that must elapse between any two concentrations on the line where one concentration is twice the second is the half-life (see Figure 5-1, A). The half-life also can be calculated from kel (the slope, or rise [C1-C2] over the run [2-t1]). Because concentration is logarithmic, the equation becomes half-life = ln [C1-/C2] / [t2-t1]). Thus, although it is not necessary to actually plot the line to determine elimination half-life, the time that each dose was given and each sample was drawn must be known for its calculation (see Figures 5-1 and 5-2). Half-life determines the maximum time that can elapse between doses in the patient before PDCs fall below the recommended minimum effective concentration during the dosing interval (Tmax) (see Figures 5-1, A and 5-2).
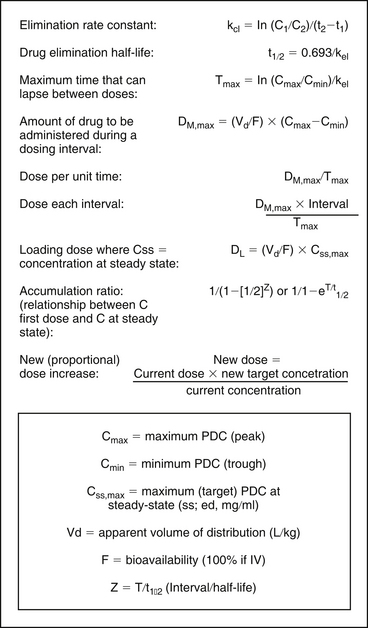
Figure 5-2 The data necessary for calculating dosing regimens can be obtained from therapeutic drug monitoring and, if necessary, from values reported in the literature, as modified (e.g., Vd) for the patient. C1, C2 = concentration of samples 1 and 2, respectively; Cmax = maximum PDC (peak); Cmin = minimum PDC (trough); Css, max = maximum (target) PDC at steady state (mg/mL); F = bioavailability (100% if intravenous); In = interval; Kel = elimination rate constant; PDC = plasma drug concentration; t1, t2 = time samples 1 and 2 were collected, respectively; Vd = volume of distribution (L/kg); Z = T/t1/2 (interval [T]/half-life [t1/2]). For patient calculation of Vd and Cl, the drug must be given IV.
The Vd of drugs administered intravenously can be calculated from the peak PDC and dose (see Figure 5-2 and Case Study 5-5). If the drug is 100% bioavailable after oral, subcutaneous, or intramuscular administration, Vd can also be estimated from these data, assuming the drug also would be 100% bioavailable in the patient. For orally administered drugs for which the bioavailability is not known, a population bioavailability and Vd measured in normal animals must be used if new dosing regimens are to be calculated rather than proportionately adjusted. Like bioavailability, however, individual patient Vd may not be accurately estimated by population Vd. Changes in patient Vd compared with those in normal animals can be somewhat accommodated if information regarding patient factors that influence Vd, such as obesity, edema, ascites, dehydration, and serum protein concentrations, are known (see Chapters 1 and 2).
The Vd is used to calculate the amount of drug that must be administered to achieve Cmax, the target (generally maximum) effective drug concentration (loading dose [DL]), and the amount of drug necessary to replace drug eliminated during the dosing interval (maintenance dose, DM) (see Figure 5-2). Once DM and Tmax have been established, dosing regimens can be appropriately altered to ensure that PDCs fall within a recommended therapeutic range (see Figure 5-2). For drugs with short half-lives, both a peak and a trough drug sample should be collected post dose modification to ensure that a minimum effective concentration (Cmin) is achieved and concentrations above the maximum (Cmax) are avoided during the designed dosing interval.
Dose Modification Without Kinetics (Proportional Adjustment)
Not all modifications in dosing regimens require pharmacokinetic calculations. If a patient has drug concentrations outside the therapeutic range, the dose should be modified to change the drug concentrations into the therapeutic range by a proportional adjustment. Generally, a dose can be proportionately modified using one of the following equations:
In general, targeting a 25% to 50% change is reasonable, if time allows a gradual adjustment. Because TDM identifies the therapeutic range specific for the patient, some patients will respond at the low end of the population range, some will not respond until the maximum is reached, and a smaller percentage of the population will respond at concentrations outside the recommended range.
If a patient has not responded, even for patients within the therapeutic range, drug concentrations can be gradually increased (in a stair-step fashion) until either the patient responds or the maximum end of the range is reached and the risk of adverse effects becomes too great. The direction can be reversed if drug concentrations are too high to establish a minimum effective dose. The decision as to whether to change the dose or the interval depends on the drug itself, its therapeutic index, and the need to maintain PDCs within the therapeutic range throughout a dosing interval. However, for drugs with a short half life, shortening the interval may be less expensive than increasing the dose.
Even TDM is used to ensure that the PDC stays within a targeted concentration (that is, the patient’s therapeutic range) during a dosing interval, a patient may react adversely (including the failure to respond therapeutically). Disease, age, and other factors may play a role in the minimum or maximum effective concentration appropriate for each patient (see Case Studies 5-2, 5-3, and 5-5). Therefore it is imperative that PDCs be interpreted in conjunction with the desired therapeutic end point (i.e., complete eradication of seizures versus a decrease in the severity and frequency) as well as the clinical status of the patient. This is particularly important for tests for which there is great overlap between normal and abnormal ranges (e.g., digoxin, thyroid hormones).
Phenobarbital
Generally, a single trough sample should be sufficient for TDM. However, if induction of drug-metabolizing enzymes has occurred, the elimination half-life may be sufficiently short to allow excessive fluctuation in PDC during the dosing interval. This short half-life can be detected only if both peak and trough samples are measured. In a phenobarbital-naïve dog, or when phenobarbital doses are changed, baseline samples should be determined at steady state, 9 to 14 days after beginning therapy. A recheck trough sample 1 to 3 months later would be prudent to detect induction. Many of our patients respond to phenobarbital at concentrations below the minimum therapeutic range of 15 μg/mL, which suggests that a lower therapeutic range may be indicated in dogs.
Bromide
Because the elimination half-life of bromide is so long, manipulating the dose before steady state is reached may be necessary for some patients. Collection of a sample at one half-life after the start of therapy (i.e., 2-4 weeks) can be performed to proactively assess the dose; doubling the 3 weeks concentration should approximate the steady state concentration. Baseline should be established at 2.5 to 3 months. If the patient is loaded, a sample should be collected the day after loading is complete, and then at one half-life. The former sample is indicated to determine what the loading dose achieved and the latter to ensure that the maintenance dose is maintaining what the loading dose has achieved; the two samples should be within 15% of each other. If not, the maintenance dose can be adjusted proportionately. Note that a 3-week sample in a patient that received a loading dose is minimally useful without the postload monitoring sample for comparison: concentrations may increase or decrease, depending on the accuracy of the maintenance dose. In all patients, regardless of the method of dosing, a final sample should be collected at steady state to establish baseline. Finally, bromide should also be checked before and after any change in diet or medication that impacts chloride excretion has occurred.
Zonisamide
The half-life of zonisamide is generally longer than 24 hours; therefore, concentrations should not fluctuate sufficiently during a 12-hour dosing interval to routinely justify a peak and trough sample. Because toxicity is not likely to be as great a concern as therapeutic failure, a trough sample is recommended for routine monitoring. In problematic patients a peak and a trough may be justified to rule out a short half-life as a contributing cause of difficult control. Currently, zonisamide is among the drugs for which the maximum therapeutic range, which has been established in humans, can be exceeded with minimal adverse effects in dogs.
Levetiracetam
The half-life of levetiracetam (standard release) can be as short as 1 to 2 hours. However, the half-life also can be longer than 8 to 10 hours; longer half-lives should be anticipated if the slow release preparation is used. Because the duration of the half-life is not known, peak and trough samples are recommended at the beginning of therapy to determine the half-life in patients. Control is much more likely to be accomplished with an 8-hour dosing interval in a patient with a longer half-life. Once the half-life is established, a trough sample is recommended if only single samples are to be collected. A midsample concentration has little to offer, particularly given that drug concentrations may drop 50% or more from mid-interval concentrations. Thus it is prudent to identify the lowest concentration possible during the interval. The recommended therapeutic range should be targeted by trough, rather than peak, concentration. Note that in a drug with a very short half-life (e.g., 2 hours), peak concentrations in a patient may be as much as 8 times as high as trough concentrations. Levetiracetam is sufficiently safe that a high peak concentration is likely to be tolerated. Because drug concentrations do not accumulate with drugs administered at an interval substantially longer than the half-life, steady state does not occur. Therefore levetiracetam (or another drug with a short half-life) might be monitored in the first 3 to 5 days of therapy. Waiting one seizure interval to ensure that seizures are adequately controlled is reasonable. The approach for monitoring levetiracetam can be followed with other anticonvulsants associated with a short half-life compared to the dosing interval (e.g., gabapentin), unless the drug is potentially toxic. In such situations, monitoring peak and trough concentrations routinely may be prudent.
Digoxin
Although a mid-interval sample traditionally has been recommended for digoxin, unless the half-life is known to be long, a mid-interval sample provides incomplete information regarding either toxicity or efficacy. For patients in which the half-life is less than 24 hours, both a peak (2-3 hour) and trough (before next dose) sample should be collected for this drug, particularly if a 24-hour dosing interval is used. The elimination half-life is often short, particularly in animals responding to afterload reduction, and the narrow therapeutic window (which differs approximately twofold) mandates the need to know the behavior of this drug throughout the dosing interval. For example, if the half-life is 12 hr, it is likely that concentrations will be either above or below the therapeutic range (1-2 ng/mL). A single peak sample can be collected if only toxicity is the concern; a single trough sample is indicated if the question to be answered by monitoring is whether concentrations are above the minimum therapeutic range throughout the dosing interval.
Theophylline
Single trough samples may be sufficient for slow-release products such as theophylline in cats if efficacy is the concern; a peak sample would be indicated if toxicity is the concern. Both peak and trough samples should be collected in dogs receiving
CASE STUDY 5-6 PHENOBARBITAL–CHLORAMPHENICOL DRUG INTERACTION
Pertinent History
A diagnosis of epilepsy was made 1 year before presentation. The patient was suffering from severe cluster seizures. The response to phenobarbital was initially acceptable, but seizures worsened and potassium bromide was added 6 months into therapy (see monitoring below). The dose was re-adjusted 3 months later (3 months before presentation). Although the patient has stopped seizuring, the patient was treated for a cough 1 week before presentation. Lower respiratory infection was diagnosed and antimicrobial therapy begun. Phenobarbital but not bromide was measured at that time (32 μg/mL). Three days later, the patient presented for the chief complaint. Physical examination reveals the patient to be moribund, but vital signs are otherwise normal. Clinical laboratory tests are normal. The referring veterinarian is concerned that the bromide dose is responsible for clinical signs.
Other Drugs
Phenobarbital 4 mg/kg every 12 hours, administered orally (at current dose for 2 weeks; last phenobarbital collected was at steady state with the current dosing regimen); chloramphenicol 25 mg/kg every 8 hours for 3 days
Dosing Regimen
A 450 mg/kg loading dose measured 6 months before presentation was 0.9 mg/mL. The maintenance dose was 10 mg/kg every 12 hours. Although concentrations were not measured, this maintenance dose would predictably result in steady state concentrations of 0.75 mg/mL. Two months after the loading dose, a dose increase to 25 mg/kg every 12 hours was implemented. Concentrations were not subsequently measured at steady state.
Duration of Current Regimen
Bromide, 6 months; phenobarbital 1 year; chloramphenicol, 50 mg/kg tid, 4 days
Recommendation
Although bromide concentrations are in midtherapeutic range, they are not sufficiently increased to cause the profound nature of the clinical signs. The concentrations are comparable to the dose. Phenobarbital concentrations were measured: peak concentration was 50 μg/mL; trough concentration was 46 μg/mL. Phenobarbital elimination half-life was 58 hours. This increase occurred in a week time period.
Comments
This patient was presented for presumed bromide toxicity. The bromide concentrations were not, however, consistent with the profound depression the patient was exhibiting. Phenobarbital concentrations were checked to identify a possible contribution to lethargy in a sample of blood collected just before the onset of chloramphenicol therapy. Phenobarbital concentrations had increased in this patient by 40% to 50%, despite no dose change; it is likely that concentrations would continue to increase as a new steady state was reached. The increase was presumed to be due to chloramphenicol therapy. Chloramphenicol is a potent inhibitor of drug-metabolizing enzymes, resulting in decreased phenobarbital clearance. Drug elimination half-life had not been previously determined for phenobarbital in this patient, so a change in half-life could not be documented.
slow-release preparations. For regular preparations, both samples should be collected.
Cyclosporine
Monitoring cyclosporine is complex and is addressed in depth in Chapter 31. The elimination half-life of cyclosporine in normal dogs or cats is 4 to 8 hours, and, as such, both a peak and trough might be indicated. Recommendations may also depend on therapeutic intent (i.e., immunosuppression, treatment of chronic allergic diseases such as atopy, perianal fistulas or asthma, etc). Recommendations as drawn from humans are based on either a peak or trough concentration, although a peak concentration correlates more closely to area under the curve during a dosing interval when targeting graft-versus-host rejection. Certainly, peak target concentrations are easier to achieve than trough target concentrations in patients with a short half-life. Monitoring also is complicated by the presence of drugs which might prolong the elimination half-life due to inhibition of drug metabolizing enzymes or enhance absorption through competition with P-glycoprotein; ketaconazole and azithromycin are examples of drugs that appear to do both. For such patients, both peak (2 hours) and trough (before next dose) samples are indicated to calculate half-life. This is particularly important to determine the time to steady state, a state which will occur only in those situations where the half-life of cyclosporine is markedly prolonged. For such situations the time to steady state may be very long, and final monitoring should not take place until steady state is reached. The time to steady state can be determined only by collection of a peak and a trough sample.
Antimicrobials
Because both the aminoglycosides and fluorinated quinolones are concentration-dependent drugs, peak concentrations are of critical interest. However, determination of true peak concentration requires that two samples be collected: a peak and a second sample approximately two half-lives later. The peak sample should be collected after drug distribution has occurred, or approximately 45 to 60 minutes after dosing. A true trough sample (i.e., just before the next dose) should not be collected because it is likely that concentrations will be undetectable for both fluorinated quinolones and aminoglyclosides (given once daily with half-lives less than 3 hours). An exception might exist for determining aminoglycosides’ toxicity: documentation of trough concentrations below the minimum requires a sample just before the next dose.
Summary
TDM can aid clinicians in the titration of drug doses to the individual patient, thus helping prevent adverse reactions that are a direct consequence of patient variability in drug disposition. In addition, TDM ensures that optimal drug concentrations are established promptly and that therapeutic drug concentrations are maintained, which spares patients a protracted period of ineffective drug therapy.
1. Wilson R.C. Therapeutic drug monitoring. Auburn Vet. 1987;42(3):20-22.
2. Neff-Davis C.A. Therapeutic drug monitoring in veterinary medicine. Vet Clin North Am Small Anim Pract. 1988;18(6):1287-1307.
3. Pippenger C.F., Massoud N. Therapeutic drug monitoring. In: Benet L.Z., et al, editors. Pharmacokinetic basis for drug therapy. New York: Raven Press; 1984:367-393.
4. Arnsdorf M.F. Cardiac excitability and antiarrhythmic drugs: a different perspective. J Clin Pharmacol. 1989;29:395-404.
5. Ravis W.R., Nachreimer R.F., Pedersoli W.M., et al. Pharmacokinetics of phenobarbital in dogs after multiple oral administration. Am J Vet Res. 1984;45:1283-1286.
6. Cowan R.H., Jukkola A.F., Arant B.S. Pathophysiologic evidence of gentamicin nephrotoxicity in neonatal puppies. Pediatr Res. 1980;14(11):1204-1211.
7. Atkins C.E., Snyder P.S., Keene B.W., et al. Effects of compensated heart failure on digoxin pharmacokinetics in cats. J Am Vet Med Assoc. 1989;195(7):945-950.
8. Frazier D.L., Riviere J.E. Gentamicin dosing strategies for dogs with subclinical renal dysfunction. Antimicrob Agents Chemother. 1987;31(12):1929-1934.
9. Frazier D.L., Aucoin D.P., Riviere J.E. Gentamicin pharmacokinetics and nephrotoxicity in naturally acquired and experimentally induced disease in dogs. J Am Vet Med Assoc. 1988;192(1):57-63.
10. Dunbar M., Pyle R.L., Boring J.G., et al. Treatment of canine blastomycosis with ketoconazole. J Am Vet Med Assoc. 1983;182(2):156-157.
11. Ravis W.R., Pedersoli W.M., Turco J.D. Pharmacokinetics and interactions of digoxin with phenobarbital in dogs. Am J Vet Res. 1987;48(8):1244-1249.
12. DeRick A., Balpaire F. Digoxin–quinidine interaction in the dog. J Vet Pharmacol Ther. 1981;4:215-218.
13. Abbott Laboratories: Therapeutic drug monitoring, clinical guide, diagnostic division, Dallas, 1984.
14. Drayer D.E. Review problems in therapeutic drug monitoring: the dilemma of enantiomeric drugs in man. Ther Drug Monit. 1988;10:1-7.
15. Price C.P. Analytical techniques for therapeutic drug monitoring. Clin Biochem. 1984;17:52-56.
16. Gal P. Therapeutic drug monitoring in neonates: problems and issues. Drug Intell Clin Pharm. 1988;22:317-323.