Digital Radiographic Technique
At the completion of this chapter, the student should be able to do the following:
1 Distinguish between spatial resolution and contrast resolution.
2 Identify the use and units of spatial frequency.
3 Interpret a modulation transfer function curve.
4 Discuss how postprocessing allows the visualization of a wide dynamic range.
5 Describe the features of a contrast-detail curve.
6 Discuss the characteristics of digital imaging that should result in lower patient radiation doses.
CONVENTIONAL RADIOGRAPHIC imaging systems have worked well for over a century, providing increasingly better diagnostic images. However, conventional radiology has limitations.
Screen-film radiographic images require processing time that can delay the completion of the examination. After an image is obtained, very little can be done to enhance the information content. When the examination is complete, images are available in the form of hard copy film that must be catalogued, transported, and stored for future review. Furthermore, such images can be viewed only in a single geographic location at a time.
Another and perhaps more severe limitation is the noise inherent in these images. Radiography uses a large area beam of x-rays. The Compton-scattered portion of the image-forming x-ray beam increases with increasing field size. This increases the noise of the radiographic image and severely degrades contrast resolution.
Digital radiographic technique, especially selection of kVp and mAs, is similar to screen-film radiography except that kVp as a control of image contrast is not so important. Proper digital radiographic technique should result in reduced patient radiation dose.
Medical images are obtained to help in the diagnosis of diseases or defects in anatomy. Each medical image has two principal characteristics: spatial resolution and contrast resolution. Additional image properties such as noise, artifacts, and archival quality are noted, but spatial resolution and contrast resolution are most important.
Spatial Resolution
Spatial resolution (resolution in space) is the ability of an imaging system to resolve and render on the image a small high-contrast object. Figure 17-1 shows black dots of diminishing size on a tan background.
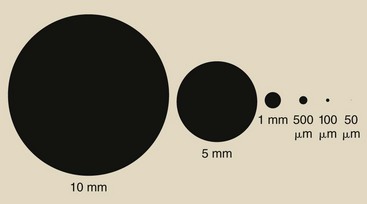
The black on light tan is high contrast. If the dots were shades of gray, they would not exhibit high contrast but rather low contrast.
The dots range in size scaled from 10 mm down to 50 µm. Most people can see objects as small as 200 µm; therefore, the spatial resolution of the eye is described as 200 µm. If the dots were not high contrast, the spatial resolution of the eye would require larger dots.
In medical imaging, spatial resolution is described by the quantity “spatial frequency.” Spatial frequency is introduced in Chapter 15 and is discussed further here because it is an important characteristic that is used to describe medical images and medical imaging systems.
Spatial Frequency
The fundamental concept of spatial frequency does not refer to size but to the line pair. A line pair is a black line on a light background, as is shown in Figure 17-2. One line pair consists of the line and an interspace of the same width as the line. Six line-pair patterns are shown, with each line and each interspace representing the size of the dots in Figure 17-1.
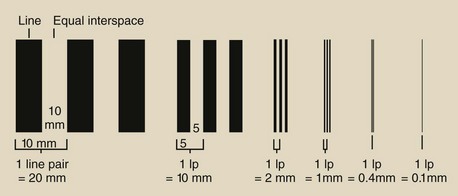
FIGURE 17-2 A line pair (lp) is a high-contrast line that is separated by an interspace of equal width.
Spatial frequency relates the number of line pairs in a given length, expressed as centimeters or millimeters. The unit of spatial frequency as used in medical imaging describes line pair per millimeter (lp/mm). Figure 17-3 shows the spatial frequency of the six sets of line pairs.
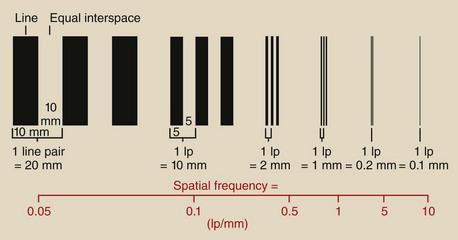
FIGURE 17-3 The spatial frequency of each of the line pairs of Figure 17-2.
| Question: | A digital radiographic imaging system has a spatial resolution of 3.5 lp/mm. How small an object can it resolve? |
| Answer: | 3.5 lp/mm = 7 objects in 1 mm, or 7/mm Therefore, the reciprocal is the answer, or 1/7 mm = 0.143 mm = 143 µm |
Clearly, as the spatial frequency becomes larger, the objects become smaller. Higher spatial frequency indicates better spatial resolution.
| Question: | A screen-film mammography imaging system operating in the magnification mode can image high-contrast microcalcifications as small as 50 µm. What spatial frequency does this represent? |
| Answer: | It takes two 50-µm objects to form a single line pair. Therefore, 1 lp = 100 µm, or 1 lp/100 µm = 1 lp/0.1 mm = 10 lp/mm. |
The concept of spatial frequency is demonstrated in Figure 17-4 by the dress of three entrepreneurs. The undertaker’s plain black suit has a spatial frequency of zero. No change is seen from one part of the suit to another.

FIGURE 17-4 Three entrepreneurs and their working attire demonstrate the concept of spatial frequency.
The banker’s pinstripe suit has zero vertical spatial frequency but high horizontal spatial frequency. The used car salesman’s coat has high spatial frequency in all directions.
Anatomy also can be described as having spatial frequency. Large soft tissues such as the liver, kidneys, and brain have low spatial frequency and therefore are easy to image. Bone trabeculae, breast microcalcifications, and contrast-filled vessels are high-frequency objects; therefore, they are more difficult to image.
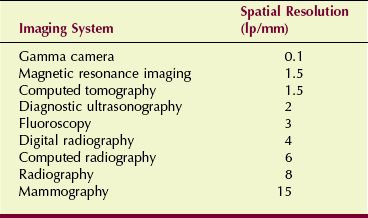
Table 17-1 presents the approximate spatial resolution for various medical imaging systems. Sometimes the spatial resolution for nuclear medicine, computed tomography (CT), and magnetic resonance imaging (MRI) is stated in terms of lp/cm instead of lp/mm.
| Question: | The image from a nuclear medicine gamma camera can resolve just 1/4 inch. What spatial frequency does this represent? |
| Answer: | 1/4 in × 25.4 mm/in = 6.35 mm It takes two 6.35-mm objects to form a line pair, hence 12.7 mm/lp. The reciprocal is 1 lp/12.7 mm = 0.08 lp/mm = 0.8 lp/cm |
The spatial resolution of projection radiography is determined by the geometry of the system, especially focal-spot size. Mammography is best because of its small focal spot—0.1 mm—for magnification.
| Question: | What is the spatial resolution of a 512 × 512 CT image that has a field of view of 30 cm? What spatial frequency does that represent? |
| Answer: | 512 pixels/30 cm = 512 pixels/300 mm 300 mm/512 pixels = 0.59 mm/pixel Two pixels are required to form a line pair; therefore: 2 × 0.59 mm = 1.2 mm/lp 1 lp/1.2 mm = 0.83 lp/mm = 8.3 lp/cm |
Spatial resolution in all of the digital imaging modalities is limited by the size of the pixel. No digital imaging system can image an object smaller than 1 pixel. This CT imaging system is limited to a spatial resolution of 0.59 mm or 8.3 lp/cm.
Modulation Transfer Function
Modulation transfer function (MTF) is a term borrowed from radio electronics that has been applied to the description of the ability of an imaging system to render objects of different sizes onto an image. Objects with high spatial frequency are more difficult to image than those with low spatial frequency. This is just another way of saying that small objects are harder to image.
Regardless of the size of the object, the object is considered to be high contrast, black on white, for the purpose of MTF evaluation. The ideal imaging system is one that produces an image that appears exactly as the object. Such a system would have an MTF equal to 1.
 Modulation transfer function can be viewed as the ratio of image to object as a function of spatial frequency.
An ideal imaging system does not exist. The line pairs of Figure 17-3 become more blurred with increasing spatial frequency. The higher frequency that occurs in a set distance results in more blur. The amount of blurring can be represented by the reduced amplitude of the representative frequency, as is shown in Figure 17-5.
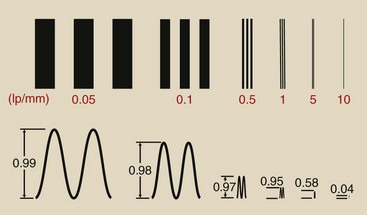
FIGURE 17-5 When a line pair pattern is imaged, the higher spatial frequencies become blurred, resulting in reduced modulation.
Quality control test objects and tools have been designed to measure the amount of blurring as a function of spatial frequency. Figure 17-6 shows two bar pattern test tools with spatial frequencies up to 20 lp/mm. Such tools used with a microdensitometer can measure the modulation of each spatial frequency pattern and can use those data to construct an MTF curve.
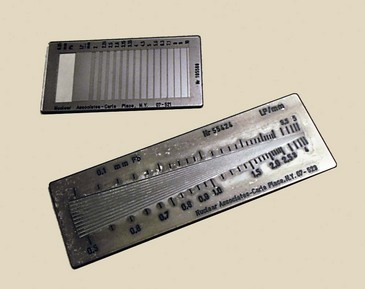
FIGURE 17-6 These plastic-encased lead bar patterns are imaged to construct a modulation transfer function (MTF). (Courtesy Fluke Biomedical.)
When the modulation of the bar pattern is plotted against spatial frequency, as is done in Figure 17-7, an MTF curve results. When an imaging system is evaluated through this method, the 10% MTF often is identified as the system spatial resolution.
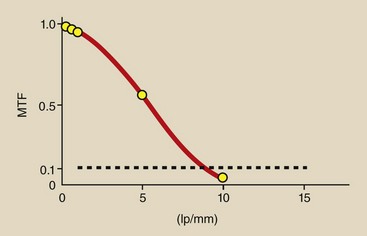
FIGURE 17-7 A plot of the modulation data from Figure 17-5 results in a modulation transfer function (MTF) curve.
The MTF curve in Figure 17-7 is representative of screen-film radiography. At low spatial frequencies (large objects), good reproduction is noted on the image. However, as the spatial frequency of the object increases (the objects get smaller), the faithful reproduction of the object on the image gets worse. This MTF curve shows a limiting spatial resolution of approximately 8 lp/mm.
At low spatial frequencies, the contrast of the object is preserved, but at high spatial frequencies, contrast is lost; this limits the spatial resolution of the imaging system. Inspect Figure 17-8, in which a radiographic screen-film imaging system is compared with a mammographic screen-film system.
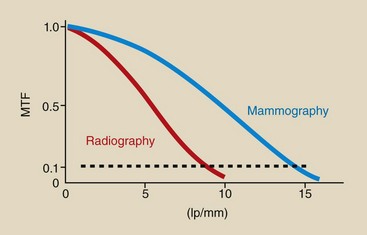
FIGURE 17-8 Screen-film mammography has a higher modulation transfer function (MTF) at low spatial frequencies and higher spatial frequencies than screen-film radiography.
At low spatial frequencies, the MTF for radiography should be higher than that for mammography because two screens are used. The use of two screens amplifies the contrast of large objects with little blur. However, this is not the case because of the low kilovolt peak (kVp) and tissue compression used for mammography.
With increasing spatial frequency, image blur worsens in radiography. Image blur worsens in mammography also but not as quickly as in radiography. The use of a single screen in mammography allows better visualization of smaller objects.
As Figure 17-8 shows, radiography has a limiting spatial resolution of approximately 8 lp/mm, but that for mammography is approximately 15 lp/mm. The single screen and smaller focal spot result in better spatial resolution with mammography.
Figure 17-9 shows two photographic representations of the MTF curves of Figure 17-8 to give a better sense of how a change in MTF affects image rendition. Whereas Figure 17-9, A, represents radiography Figure 17-9, B, represents mammography with better spatial resolution and better contrast resolution.
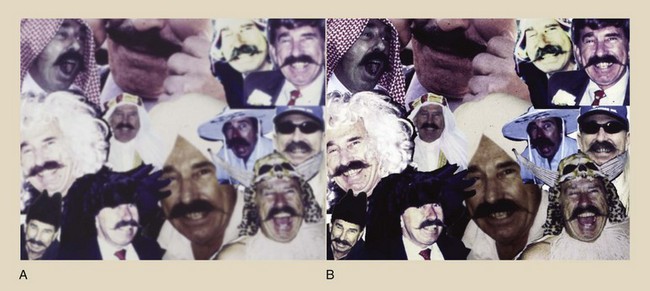
FIGURE 17-9 These photographs illustrate differences in image appearance associated with the modulation transfer function (MTF) curves of (A) radiography and (B) mammography.
The MTF curve that represents digital radiography (DR) (Figure 17-10) has the distinctive feature of a cutoff spatial frequency. No DR imaging system can resolve an object smaller than the pixel size.
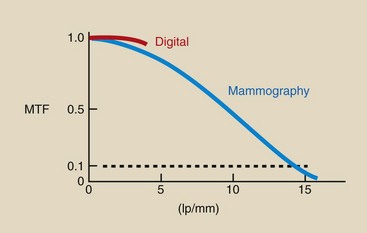
FIGURE 17-10 The modulation transfer function (MTF) curve for any digital radiographic imaging system is characterized by a cutoff frequency determined by pixel size. In this illustration, the cutoff frequency is 4 lp/mm, which corresponds to a 125-µm pixel size.
| Question: | Figure 17-10 indicates a cutoff spatial frequency of 4 lp/mm for DR. What is the pixel size? |
| Answer: | 4 lp/mm = 8 objects/mm = 8 pixels/mm Therefore, pixel size is 1/8 mm = 0.125 mm = 125 µm |
Note also that DR has higher MTF at low spatial frequencies. This is principally because of the expanded dynamic range of DR and its higher detective quantum efficiency (DQE).
Contrast Resolution
One hundred percent contrast is black and white. The lettering on this page shows very high contrast. Contrast resolution is the ability to distinguish many shades of gray from black to white. All digital imaging systems have better contrast resolution than screen-film imaging. The principal descriptor for contrast resolution is grayscale, also called dynamic range.
Dynamic Range
The dynamic range of a screen-film radiograph is essentially three orders of magnitude, from an optical density (OD) of near 0 to 3.0 (Figure 17-11). This represents a dynamic range of 1000, but the viewer can visualize only about 30 shades of gray.
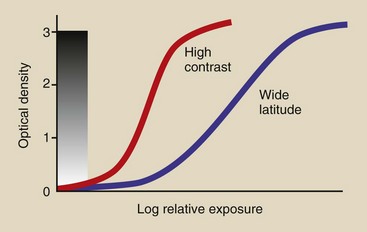
FIGURE 17-11 The contrast of a radiographic image can be somewhat controlled, but the visual range remains at approximately 30 shades of gray.
The grayscale can be made more visible with the use of specific radiographic techniques designed to increase image latitude; however, still no more than 30 shades of gray will be viewed because of the limitations of the human visual system.
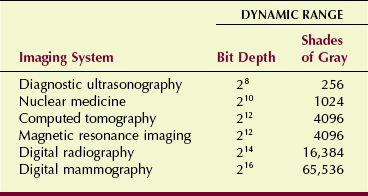
The dynamic range of digital imaging systems is identified by the bit capacity of each pixel. CT and MRI systems generally have a 12-bit dynamic range (212 = 4096 shades of gray). DR may have a 14-bit dynamic range (214 = 16,384 shades of gray). Because contrast resolution is so important in mammography, such digital mammography (DM) systems have a 16-bit dynamic range (216 = 65,536 shades of gray). Table 17-2 summarizes the dynamic range of various imaging systems.
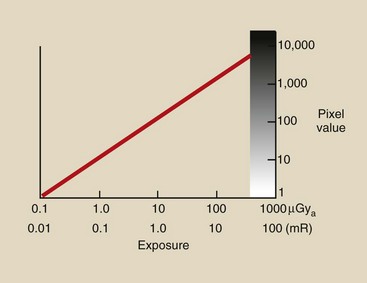
Over the range of exposures used for screen-film imaging, the response of a digital imaging system is four to five orders of magnitude (Figure 17-12). Still, the human visual system is not able to visualize such a grayscale. With the postprocessing exercise of window and level, each grayscale can be visualized—not just 30 or so.
Postprocessing
A principal advantage of digital imaging is the ability to preprocess and postprocess the image for the purpose of extracting even more information. With screen-film radiographic images, what you see is what you get. One cannot extract more information than is visible on the image.
Several image-processing activities associated with digital imaging are discussed in Chapter 22. One postprocessing activity—window and level—is discussed here because it makes possible visualization of the entire dynamic range of the grayscale.
Consider the grayscale presented in Figure 17-13, which represents a 14-bit dynamic range. The 16,384 distinct values for the grayscale are far more than we can visualize.
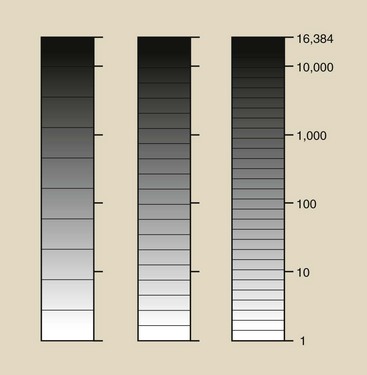
FIGURE 17-13 Although a 14-bit dynamic range contains 16,384 shades of gray, we can see only about 30 of them.
The range from white to black has been arbitrarily divided into 10 gray levels. Place a pencil over one of the dividers and see if you can distinguish the adjacent gray levels from one another. For most people, approximately 30 gray levels is about the limit of contrast resolution.
With use of the window and level postprocessing tool, any region of this 16,384 grayscale can be expanded into a white-to-black grayscale, as is shown in Figure 17-14. This postprocessing tool is especially helpful when soft tissue images are evaluated.
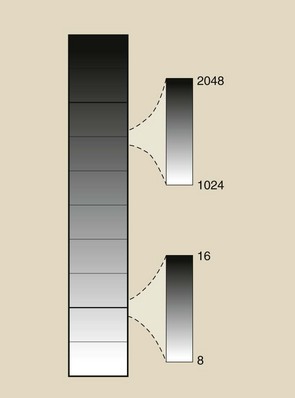
FIGURE 17-14 With the window and level postprocessing tool, any region and range of the 16,384 can be rendered as 30 shades of gray.
The breast consists of essentially soft tissue and therefore is difficult to image. The subject contrast is poor; this requires that low kVp must be used to accentuate photoelectric interaction.
Figure 17-15, A, shows a screen-film mammogram of good quality. Figure 17-15, B, is a digital mammogram of the same breast that shows somewhat better contrast. Figure 17-15, C and D, are digital mammograms of the same breast that show even better contrast because of window and level postprocessing.
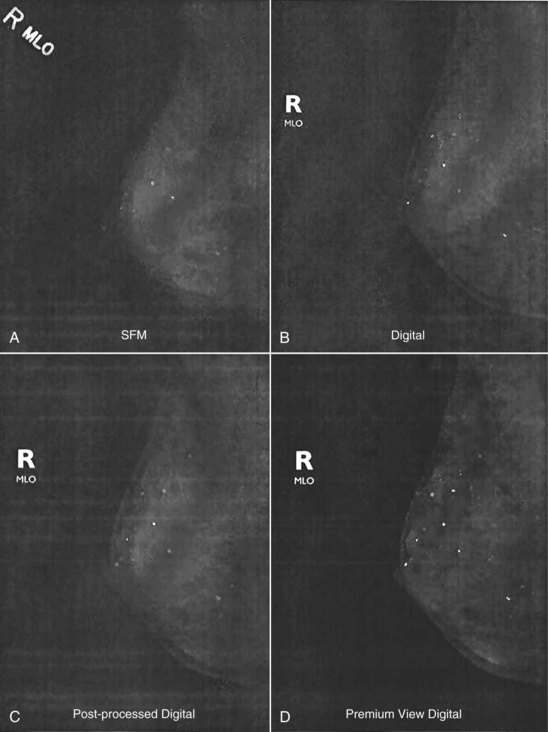
FIGURE 17-15 A, With screen-film mammography what you see is what you get. B, With digital mammography, contrast is enhanced. C and D, By postprocessing the digital image, contrast can be further enhanced. (Courtesy Ed Hendrick, Northwestern University.)
In 2006, results of the Digital Mammography Imaging Screening Trial (DMIST) were reported. This study was commissioned by the American College of Radiology Imaging Network and the National Institutes of Health. A total of 50,000 women were imaged with screen-film mammography and DM, and results show that for the younger, denser breasts, DM was better.
For older, less dense breasts, DM was equal to screen-film mammography. This suggests that contrast resolution is more important than spatial resolution when soft tissue is imaged.
Signal-to-Noise Ratio
The signal in a radiographic image is that portion of the image-forming x-rays that represents anatomy. In all radiographic imaging, the number of such x-rays is huge. The signal represents the difference between those x-rays transmitted to the image receptor and those absorbed photoelectrically, as is seen in Figure 17-16.
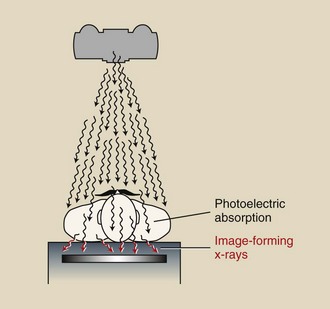
FIGURE 17-16 Image-forming x-rays are those that are transmitted through the patient unattenuated (signal) and those that are Compton scattered (noise).
Other sources of noise in addition to scatter radiation may be associated with the image receptor, regardless of whether it is the screen-film or digital type. The signal-to-noise ratio (SNR) is important to any medical image. Noise limits contrast resolution; therefore, radiographers strive for high SNR by selecting appropriate digital radiographic techniques, in keeping with ALARA (as low as reasonably achievable).
With current digital radiographic imaging systems, the radiographic technique is computer selected. Still, the radiographer must be prepared to alter techniques as required.
In general, as the milliampere seconds (mAs) is increased, the SNR also is increased, although at the expense of increased patient radiation dose. This is a dilemma that is faced in digital imaging.
Another way to increase SNR is seen in digital subtraction angiography (DSA). Suppose a single DSA image has an SNR of 1 : 1; this represents a signal value of 1 and a noise value of 1. If two sequential DSA images are integrated, that is, added to each other, the signal is doubled, but the noise is increased only by the square root of two, or 1.414. Therefore, the SNR is 2/1.414 = 1.414.
Signal increases in proportion to the number of images integrated; noise increases in proportion to the square root of the number of images.
When four DSA frames are integrated, the signal is increased four times. The noise is increased by the square root of four or two. Therefore, SNR = 4/2 = 2 after four-image integration.
Contrast-Detail Curve
Another method for evaluating the spatial resolution and contrast resolution of an imaging system is the contrast-detail curve. This method involves information similar to an MTF curve, but most find it easier to interpret.
Quality control test tools such as that shown in Figure 17-17 simplify the construction of a contrast-detail curve for any imaging system. Such tools have rows of holes of varying sizes that are fashioned into a plastic or aluminum sheet. Each row is associated with a column of holes of the same size that are drilled to a different depth. A similar test tool is shown in Figure 17-18, A. Its image is shown in Figure 17-18, B, where the result is a pattern on the image of holes of varying size and contrast (arrow).
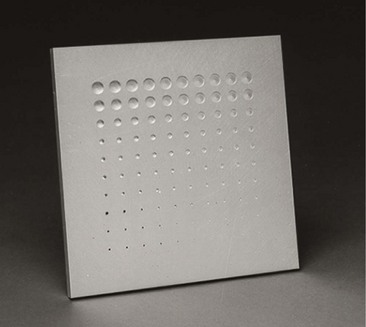
FIGURE 17-17 A contrast-detail test tool for constructing a contrast-detail curve. (Courtesy Fluke Biomedical.)
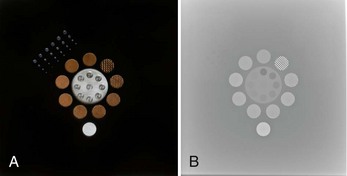
FIGURE 17-18 A contrast-detail tool (A) and its image (B) allows construction of a contrast-detail curve. (A courtesy American College of Radiology; B Courtesy David Albers, Rice University.)
Upon close inspection of Figure 17-18, B, one can carve out a curve of those holes that are visible. The result is a curve that appears as in Figure 17-19. This contrast-detail curve is a plot of the just perceptible visualization of size as a function of object contrast.
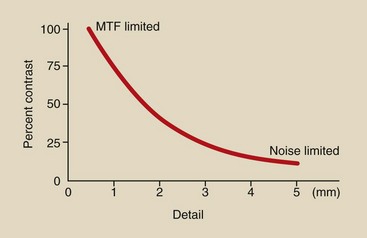
The contrast-detail curve shows that when object contrast is high, small objects can be imaged. When object contrast is low, large objects are required for visualization on an image.
The left side of the contrast-detail curve, that related to high-contrast objects, is said to be limited by the MTF of the imaging system. Spatial resolution is determined by the MTF of the imaging system.
The right side of the curve, which relates to low-contrast objects, is said to be noise limited. Noise reduces contrast resolution.
An example of the use of a contrast-detail curve is shown in Figure 17-20, which compares two digital radiographic imaging systems that have different pixel sizes. The system with the smaller pixel size will have better spatial resolution, but the contrast resolution of both will be the same if the same imaging technique is used.
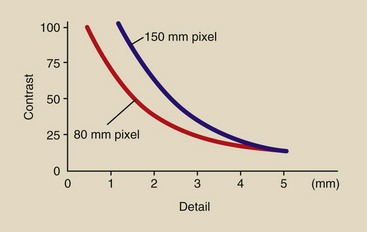
FIGURE 17-20 Contrast-detail curves for two different digital imaging systems with different pixel sizes.
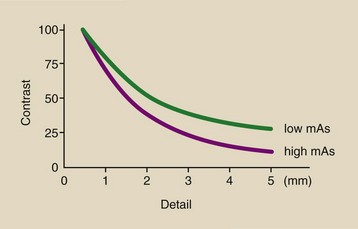
If the mAs is increased during DR, spatial resolution remains the same, but contrast resolution is improved at the higher mAs. This is shown in Figure 17-21; it may seem strange that the higher mAs image results in a lower curve. The lower curve represents better contrast resolution because tissue with lower subject contrast can be imaged.
The object of the contrast-detail curve is to better understand that which influences spatial resolution—MTF—and that which influences contrast resolution—SNR—for various imaging systems. It is an instructive method of understanding how digital radiographic technique factors and imaging system factors influence spatial resolution and contrast resolution.
Figure 17-22 shows the relative contrast-detail curves for various medical imaging systems. Note that mammography has the best spatial resolution, principally because of x-ray tube focal-spot size.
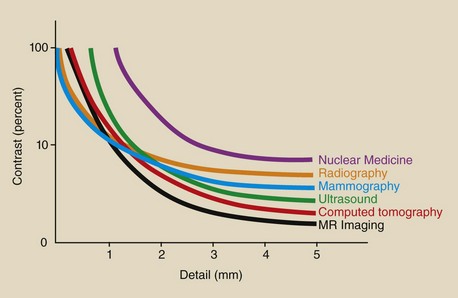
Magnetic resonance imaging has the best contrast resolution because of the range of the tissue values of proton density, T1 relaxation time, and T2 relaxation time. CT, however, has the best contrast resolution of all x-ray imaging systems because of x-ray beam collimation and the resultant reduction in scatter radiation.
Patient Radiation Dose Considerations
With acceleration to all-digital imaging, we have the opportunity to reduce patient doses by 20% to 50%, depending on the examination. However, quite the opposite often has occurred—something that many call “dose creep.”
Because digital imaging can always yield a good image, it is possible for the radiologic technologist to be unwittingly lured into not adjusting exposures as frequently as with screen-film, for example, by not changing factors between a lateral view and an anteroposterior view when these are taken consecutively. As a result, it is possible for the overall patient dose to increase.
Patient radiation dose reduction should be possible because of the manner in which the digital image receptor responds to x-rays and because of a property of the digital image receptor known as DQE.
Image Receptor Response
Consider again the responses of a screen-film image receptor and a digital image receptor, as shown in Figure 17-23. These curves relate to the contrast resolution of the respective imaging system; they do not represent spatial resolution. Recall that spatial resolution in screen-film radiography is determined principally by focal-spot size, but spatial resolution in digital imaging is determined by pixel size.
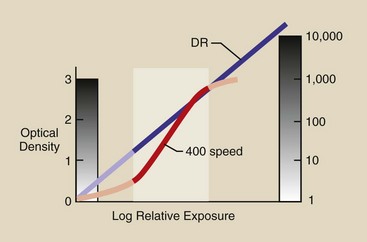
FIGURE 17-23 Response of a screen-film and a digital image receptor. The emphasized range is that normally chosen for screen-film exposure. The digital radiography image receptor can receive essentially any radiation exposure.
Because digital image receptor response is linearly related to radiation dose, image contrast does not change with dose. One cannot overexpose or underexpose a digital image receptor. However, poor technical factor selection may result in overexposure of the patient.
Therefore, a digital image should never require repeating because of exposure factors. The exposure factor–related repeat rate for screen-film radiography ranges to approximately 5%, and this translates directly to a dose reduction for digital imaging patients.
Figure 17-23 shows the range for a properly exposed 400 speed screen-film radiograph. When overexposed or underexposed, image contrast is reduced. Such is not the case for digital imaging, and this affords a considerable opportunity for patient radiation dose reduction.
The screen-film radiographs of a foot phantom shown in Figure 17-24 are labeled with the technique used for each. Screen-film radiographs are overexposed or underexposed easily; however, this is not the case with digital images.
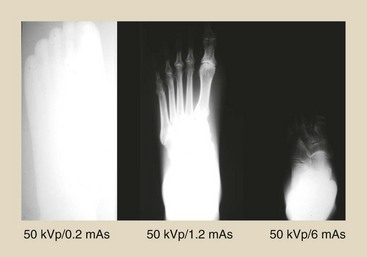
FIGURE 17-24 Screen-film radiographs of a foot phantom showing overexposure and underexposure because of wide-ranging technique. (Courtesy Anthony Siebert, University of California, Davis, California.)
Figure 17-25 shows the same foot phantom imaged digitally at the same techniques of Figure 17-24. The respective radiation exposure values are shown to emphasize the possible patient radiation dose reduction with digital imaging.
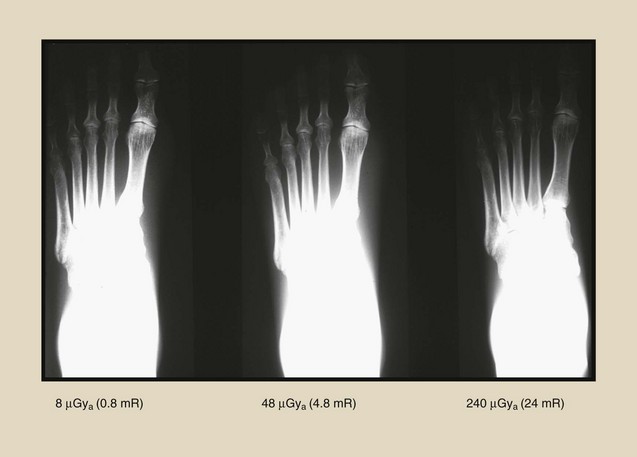
FIGURE 17-25 Digital images of a foot phantom using the same radiographic techniques as in Figure 28-24 show the maintenance of contrast over a wide range of patient radiation doses. (Courtesy Anthony Siebert, University of California, Davis, California.)
Radiographic technique for screen-film imaging requires (1) that an appropriate kVp be selected on the basis of the anatomy that is being imaged and (2) that the proper mAs be selected to produce proper optical density (OD) on the finished image. For screen-film imaging, kVp controls contrast, and mAs controls OD.
Digital imaging techniques must be approached differently. Instead of “dose creep,” “technique creep” should be used with each of the various digital imaging systems. The result will be patient radiation dose reduction.
Because digital image contrast is unrelated to dose, kVp becomes less important. When digital examination of specific anatomy is conducted, the kVp should start to be increased, and an accompanying reduction in mAs should be noted with successive examinations. The result will be adequate contrast resolution, constant spatial resolution, and reduced patient radiation dose.
The patient radiation dose reduction that is possible is limited. Figure 17-26 is an additional rendering of the image receptor response curves of Figure 17-23, except here, the region for digital image receptor exposure is highlighted.
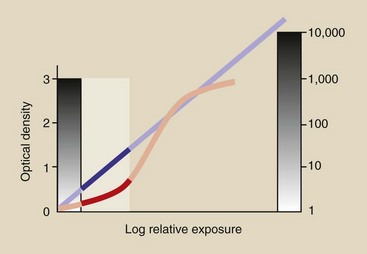
FIGURE 17-26 At very low exposure of a digital image receptor, spatial resolution and contrast are maintained, but image noise may be troublesome.
The problem with very low technique for digital imaging is low SNR. Noise can predominate and compromise the interpretation of soft tissue anatomy.
Detective Quantum Efficiency
The probability that an x-ray will interact with an image receptor is determined by the thickness of the capture layer and its atomic composition. The descriptor used for medical imaging is DQE. DQE is related to the absorption coefficient and to the spatial frequency of the image-forming x-ray beam.
For present purposes, DQE can be regarded as the absorption coefficient; it is highly x-ray energy dependent. Table 17-3 presents the atomic number for various elements used in digital and screen-film image receptors and the K-shell absorption edge for the most responsive element.
Table 17-3
Atomic Number and K-Shell Binding Energy for Various Image Receptors
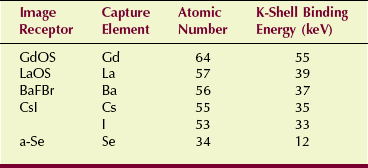
a-Se, amorphous selenium; BaFBr, barium fluorobromide; CsI, cesium iodide; GdOS, gadolinium oxysulfite; LaOS, lanthanum oxysulfide.
Lanthanum oxysulfide (LaOS) and gadolinium oxysulfide (GdOS) are the two principal image capture elements used in radiographic screens. Barium fluorobromide (BaFBr), cesium iodide (CsI), and amorphous selenium (a-Se) are used with digital image receptors. The value of DQE for each of these capture elements is strongly dependent on x-ray energy, as is shown in Figure 17-27.
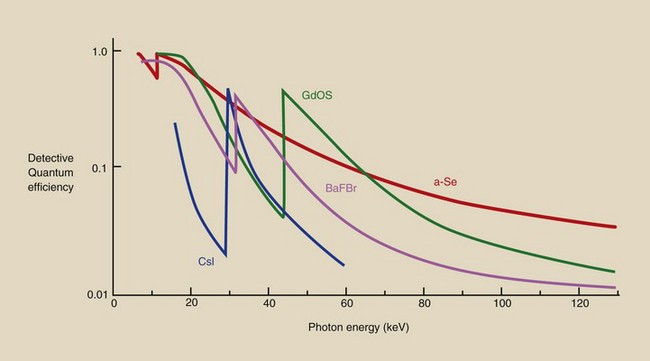
FIGURE 17-27 Detective quantum efficiency as a function of x-ray energy for various image receptor capture elements.
Figure 17-28, a simplification of Figure 17-27, combines the various DQE values for screen-film, computed radiography (CR), and DR image receptors with a 90-kVp x-ray emission spectrum. Note that the DQE for DR is higher than that for CR or screen-film. CR has a slightly higher DQE than screen film.
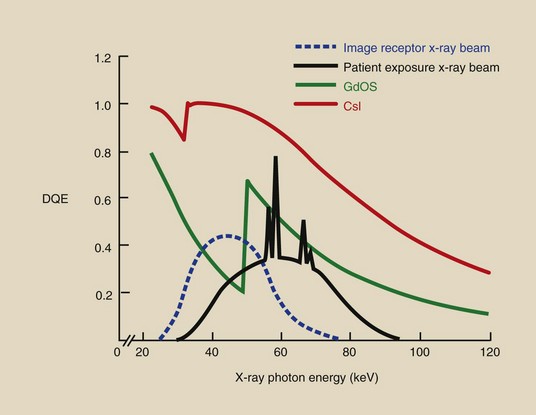
FIGURE 17-28 The x-ray beam incident on the image receptor is lower in energy than the beam incident on the patient and better matches the x-ray absorption of capture elements.
The relative value of DQE for various image receptors means that fewer x-rays are required by the higher DQE receptors to produce an image; this translates into lower patient radiation dose. The additional feature shown in Figure 17-28 is that most x-rays have energy that matches the K-shell binding energy; this relates to greater x-ray absorption at that energy.
One final feature of this analysis of DQE and patient radiation dose relates to the x-ray beam incident on the image receptor. When the 90-kVp x-ray beam interacts with the patient, most of the x-rays are scattered and are reduced in energy as shown in Figure 17-28. This results in even greater absorption of image-forming x-rays.
This analysis of image receptor response and DQE shows that both characteristics of digital image receptors suggest that patient radiation dose should be less with digital imaging than with screen-film imaging. Coupled with a new approach to digital radiographic technique that is based on increased kVp and reduced mAs, digital imaging will result in reduced patient radiation dose.
Summary
The DR image is limited by one deficiency when compared with screen-film radiography—spatial resolution. Spatial resolution, the ability to image small high-contrast objects, is limited by pixel size in DR.
However, DR has several important advantages over screen-film radiography. Digital images are obtained faster than screen-film images because wet chemistry processing is unnecessary. Digital images can be viewed simultaneously by multiple observers in multiple locations. Digital images can be transferred and archived electronically, thereby saving image retrieval time and film file storage space.
It is even more important to note that digital images have a wider dynamic range, resulting in better contrast resolution. With postprocessing, thousands of gray levels can be visualized, allowing extraction of more information from each image. The MTF curve and the contrast-detail curve represent the favorable characteristics of a digital image.
Perhaps the principal favorable characteristic of digital imaging is the opportunity for patient radiation dose reduction. This occurs because of the linear manner in which the image receptor responds to x-rays and because of the greater DQE of the digital image receptor.
1. Define or otherwise identify the following:
2. What is the spatial frequency of a 100-µm high-contrast object?
3. The best a magnetic resonance imaging system can do is approximately 2 lp/cm. What is this limit in lp/mm?
4. The limiting spatial resolution for computed radiography is approximately 6 lp/mm. What size object does this represent?
5. What tissues would be considered low spatial frequency structures?
6. What tissues would be considered high spatial frequency structures?
7. What medical imaging system has the best spatial resolution? Why?
8. What medical imaging system has the best contrast resolution? Why?
9. What units are found along the vertical and horizontal axes of an MTF curve?
10. What units are found along the vertical and horizontal axes of a contrast-detail curve?
11. How is image blur related to object spatial frequency?
12. What value of MTF is generally considered the limiting spatial resolution of an imaging system?
13. Why does a digital imaging system have a cutoff spatial frequency?
14. Compare the dynamic range of the human visual system with those of screen-film radiography and digital imaging.
15. A 12-bit dynamic range has how many shades of gray?
16. What were the principal findings of the DMIST, and what are their implications for medical imaging?
17. How does image integration in DSA improve signal-to-noise in the image?
18. Describe the quality control test tool designed to produce a contrast-detail curve.
19. Which—spatial resolution or contrast resolution—is more influenced by image noise?
The answers to the Challenge Questions can be found by logging on to our website at http://evolve.elsevier.com.