3 Automaticity
Natural Excitation of the Heart
The Heart Generates its Own Pacemaking Activity
The nervous system controls various aspects of cardiac function, including the frequency at which the heart beats and the vigor of each contraction. However, cardiac function certainly does not require intact nervous pathways. Indeed, a patient with a completely denervated heart (a cardiac transplant recipient) can adapt well to stressful situations.
Automaticity (the ability of the heart to initiate its own beat) and rhythmicity (the regularity of pacemaking activity) are properties intrinsic to cardiac tissue. The heart continues to beat even when it is completely removed from the body; the vertebrate heartbeat is myogenic. If the coronary vasculature is artificially perfused, rhythmic cardiac contraction persists for many hours. Apparently, at least some cells in the walls of all four cardiac chambers are capable of initiating beats; such cells reside mainly in the nodal tissues or specialized conducting fibers of the heart.
All cardiac myocytes in the embryonic heart have pacemaker properties. Some myocytes synthesize large amounts of contractile proteins to become “working” myocardium. Others retain pacemaking ability and generate impulses spontaneously; the mammalian heart region that ordinarily generates impulses at the greatest frequency is the sinoatrial (SA) node; it is the natural pacemaker of the heart.
Detailed mapping of the electrical potentials on the surface of the right atrium has revealed that two or three sites of automaticity, located 1 or 2 cm from the SA node itself, serve along with the SA node as an atrial pacemaker complex. At times, all of these loci initiate impulses simultaneously. At other times, the site of earliest excitation shifts from locus to locus, depending on conditions such as the level of autonomic neural activity.
Ectopic pacemakers may serve as safety mechanisms when the normal pacemaking centers cease functioning. However, if an ectopic center fires while the normal pacemaking center still functions, the ectopic activity may induce either sporadic rhythm disturbances, such as premature depolarizations, or continuous rhythm disturbances, such as paroxysmal tachycardias. These dysrhythmias are discussed later in this chapter.
When the SA node and the other components of the atrial pacemaker complex are excised or destroyed, pacemaker cells in the atrioventricular (AV) node usually become the pacemaker for the entire heart.
Purkinje fibers that constitute the specialized conduction system of the ventricles also possess automaticity. Characteristically, they fire at a very slow rate. When the AV junction is unable to conduct the impulse from the atria to the ventricles, idioventricular pacemakers in the Purkinje fiber network initiate ventricular excitation and contractions. Such contractions occur at a frequency of only 30 to 40 beats per minute (beats/min). These low frequencies are usually not sufficient to allow the heart to pump an adequate cardiac output.
Regions of the heart other than the SA node may initiate beats under special circumstances; such sites are called ectopic foci, or ectopic pacemakers. Ectopic foci may become pacemakers when (1) their own rhythmicity becomes enhanced; (2) the rhythmicity of the higher-order pacemakers becomes depressed; or (3) all conduction pathways are blocked between the ectopic focus and those regions with greater rhythmicity.
Sinoatrial Node
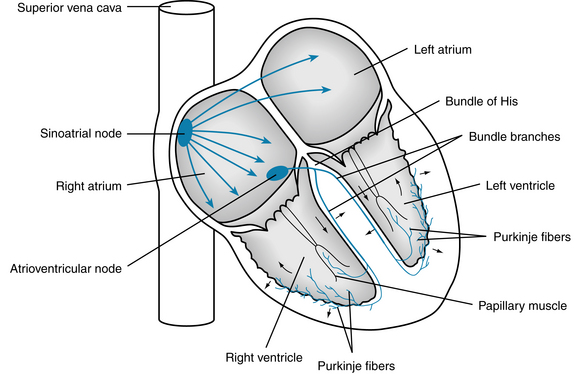
The SA node is the phylogenetic remnant of the sinus venosus of lower vertebrate hearts. In humans it is about 8 mm long and 2 mm thick. It lies in the groove where the superior vena cava joins the right atrium (Figure 3-1). The sinus node artery runs lengthwise through the center of the node.
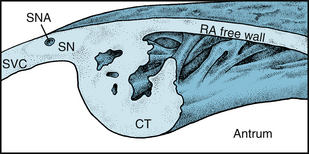
FIGURE 3-1 The location of the SA node (SN) near the junction between the superior vena cava (SVC) and right atrium (RA). CT, crista terminalis; SNA, Sinoatrial artery.
(Redrawn from James TN: The sinus node. Am J Cardiol 40:965, 1977.)
The SA node contains two principal cell types of: (1) small, round cells, that have few organelles and myofibrils and (2) slender, spindle-shaped cells that are intermediate in appearance between the round cells and the ordinary atrial myocardial cells. The round cells are probably the pacemaker cells, whereas the transitional cells serve a subsidiary pacemaker role and conduct the impulses within the node and to the nodal margins.
A typical transmembrane action potential recorded from a cell in the SA node is depicted in Figure 2-16B. Compared with the transmembrane potential recorded from a ventricular myocardial cell (Figure 2-16A), the maximum diastolic potential of the SA node cell is usually less, the upstroke of the action potential (phase 0) is less steep, a plateau is not sustained, and repolarization (phase 3) is more gradual. These are all characteristic of the slow response described in Chapter 2.
The transmembrane potential (Vm) during phase 4 is much less negative in SA (and AV) nodal automatic cells than in atrial or ventricular myocytes because nodal cells lack the iKI (inward-rectifying) type of K+ channel. Therefore the ratio of conductances of K+ (gK) and Na+ (gNa), or gK/gNa, during phase 4 is much less in the nodal cells than in the myocytes. During phase 4, therefore, Vm deviates much more from the K+ equilibrium potential (EK) in nodal cells than it does in myocytes.
Although primary SA node pacemaker cells have fast Na+ channels, their function is suppressed because they are inactivated at the maximum diastolic potential of these cells. Thus, tetrodotoxin has no influence on the action potential (Figure 3-2A) at the primary SA nodal pacemaker site. This fact indicates that the action potential upstroke is not produced by an inward current of Na+ through the fast channels. However, blockade of Ca++ channels by nifedipine suppresses action potential generation in primary SA node cells (Figure 3-2B). Subsidiary or latent pacemaker cells within the SA node have a more negative maximum diastolic potential that allows some Na+ channels to recover from inactivation. Tetrodotoxin or local anesthetic drugs can block such channels and impede conduction from primary pacemaker cells to the atrium.
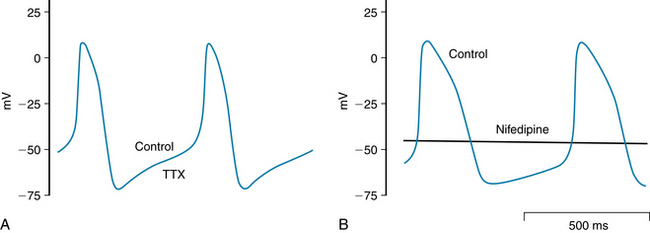
FIGURE 3-2 At the leading pacemaker site in the sinoatrial node, tetrodotoxin (TTX; 20 µM) does not change SA node action potential or frequency (A), whereas nifedipine (2 µM) suppresses spontaneous action potentials completely (B).
(Redrawn from Boyett MR, Honjo H, Kodama I: The sinoatrial node, a heterogeneous pacemaker structure. Cardiovasc Res 47:658-687, 2000, with permission from Oxford University Press.)
The principal feature that distinguishes a pacemaker fiber from other cardiac fibers resides in phase 4. In nonautomatic cells the potential remains constant during this phase, whereas in a pacemaker fiber there is a slow depolarization, called the pacemaker potential, throughout phase 4. Depolarization proceeds at a steady rate until a threshold is attained, and then an action potential is triggered.
The discharge frequency of pacemaker cells may be varied by a change in either the rate of depolarization during phase 4 or the maximal diastolic potential (Figure 3-3). A change of the threshold potential, the voltage at which the action potential is initiated, is another variable that affects pacemaker cell frequency.
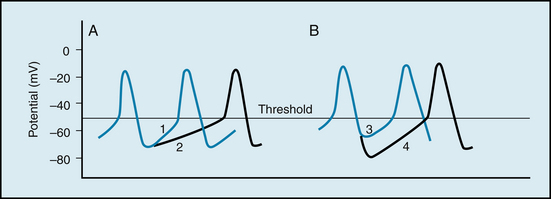
FIGURE 3-3 Mechanisms involved in changes of frequency of pacemaker firing. A, A reduction in the slope of the pacemaker potential from 1 to 2 diminishes the frequency. B, An increase in the maximum negativity at the end of repolarization (from 3 to 4) also diminishes the frequency.
Changes in autonomic neural activity often also induce a pacemaker shift, in which the site of initiation of the cardiac impulse may shift to a different locus within the SA node or to a different component of the atrial pacemaker complex.
Ordinarily, the frequency of pacemaker firing is controlled by the activity of both divisions of the autonomic nervous system. Increased sympathetic nervous activity, through the release of norepinephrine, raises the heart rate principally by increasing the slope of the pacemaker potential (slope 1 in Figure 3-3A). This mechanism of increasing heart rate operates during physical exertion, anxiety, and certain illnesses, such as febrile infectious diseases. Increased vagal activity, through the release of acetylcholine, diminishes the heart rate by hyperpolarizing the pacemaker cell membrane (slope 4 in Figure 3-3B) and by reducing the slope of the pacemaker potential (slope 2 in Figure 3-3A).
Ionic Basis of Automaticity
Several ionic currents contribute to the slow depolarization that occurs during phase 4 in automatic cells in the heart. In SA node pacemaker cells , the diastolic depolarization is affected by the interaction of at least three ionic currents: (1) an inward current, If, induced by hyperpolarization; (2) a calcium current, ICa; and (3) an outward K+ current, IK (Figure 3-4).
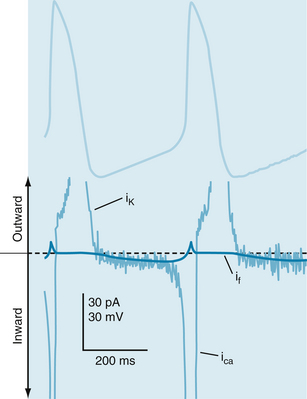
FIGURE 3-4 Transmembrane potential changes (top half) that occur in sinoatrial node cells and their relation to three ionic currents (bottom half): (1) the current, ICa; (2) a hyperpolarization-induced inward current, If; and (3) an outward K+ current, IK. The thin noisy trace shows net membrane current and the approximate time course of repolarizing outward K+ current, IK, hyperpolarization-induced inward current, If, and the L-type Ca++ current, ICa. The thick bold line in the current trace indicates the magnitude and direction of estimated If.
(Redrawn from van Ginneken AC, Giles W: Voltage clamp measurements of the hyperpolarization-activated inward current I(f) in single cells from rabbit sino-atrial node. J Physiol 434:57, 1991.)
The hyperpolarization-induced inward current, If, is carried mainly by Na+ through specific channels that differ from the fast Na+ channels. The If current becomes activated during repolarization of the membrane, as the membrane potential becomes more negative than about −60 mV. The more negative the membrane potential becomes at the end of repolarization, the greater the activation of the If current.
The second current responsible for diastolic depolarization is the L-type calcium current, ICa. This current becomes activated toward the end of phase 4, as the transmembrane potential reaches a value of about −55 mV (see Figure 3-4). Once the Ca++ channels become activated, the influx of Ca++ into the cell increases. The influx of Ca++ accelerates the rate of diastolic depolarization, which then leads to the upstroke of the action potential. A decrease in the external Ca++ concentration or the addition of a calcium channel antagonist (see Figure 3-2B) reduces the amplitude of the action potential and the slope of the pacemaker potential in SA node cells.
The progressive diastolic depolarization mediated by the two inward currents, If and ICa, is opposed by a third current, an outward K+ current, IK. This K+ efflux tends to repolarize the cell after the upstroke of the action potential. The outward K+ current continues well beyond the time of maximal repolarization, but it diminishes throughout phase 4 (see Figure 3-4). Hence the opposition of IK to the depolarizing effects of the two inward currents ICa and If, gradually decreases.
The role of If in SA node pacemaking was challenged when agents that block If slowed SA node frequency only slightly. On the other hand, drugs that block IK or ICa in primary pacemaker cells (Figure 3-2B) suppressed automaticity. However, If exerts a greater role in pacemaking in subsidiary pacemaker cells in the SA node. In addition, other ionic currents via T-type Ca channels, the Na+-Ca++ exchanger and a sustained inward Na+ current were detected in SA node cells. In later studies a timing mechanism composed of ionic channels in the plasma membrane and the sarcoplasmic reticulum (SR) membrane has been proposed. Thus, Ca++ entering the cell through L-type channels not only produces ICa but also releases Ca++ from the SR. The released Ca++ leaves the cell via the Na+/Ca++ antiporter, generating an inward current during diastolic depolarization. Released Ca++ from the SR may participate in diastolic depolarization not only via the Na+/Ca++ antiporter but also by virtue of the depletion of SR Ca++. Store-operated Ca++ channels (SOCCs) are activated by Ca++ depletion from the SR; entry of Ca++ through transient receptor potential (TRP) channels can also assist diastolic depolarization and the regulation of SA node frequency. Several TRP channel isoforms have been detected in the SA node as well as in other cardiac tissues. Overall, the structural complexity of the node, together with the many ionic currents that contribute to pacemaking, allow the SA node to sustain this vital function under a variety of physiological and pathological conditions.
The ionic basis for automaticity in the AV node pacemaker cells appears similar to that in the SA node cells. In cardiac Purkinje fibers, automaticity can be detected at two voltage ranges, from −60 to −100 mV and from −50 to 0 mV. The slow diastolic depolarization in the voltage range from −60 to −100 mV is attributed to a voltage- and time-dependent K+ current. The action potential arises from the fast Na+ current. Whether the hyperpolarization-induced inward current, If, functions physiologically in this voltage range remains to be clarified. Automaticity at −50 to 0 mV depends on IK and ICa, but the precise mechanism is not known.
Autonomic neurotransmitters affect automaticity by altering the ionic currents across the cell membranes. The β-adrenergic transmitters increase all three currents involved in SA nodal automaticity. The adrenergically mediated increase in the slope of diastolic depolarization indicates that the augmentations of If and ICa must exceed the enhancement of IK. Adrenergic transmitters also increase automaticity in Purkinje fibers; this is evident at both voltage ranges.
The hyperpolarization (Figure 3-5) induced by acetylcholine released at the vagus endings in the heart is achieved by an increased conductance mediated through activation of specific K+ channels that are controlled by the cholinergic receptors (IK,ACh). Acetylcholine also depresses the If and ICa currents.
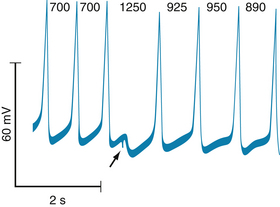
FIGURE 3-5 Effect of a brief vagal stimulus (arrow) on the transmembrane potential recorded from a sinoatrial node pacemaker cell in an isolated cat atrium preparation. The cardiac cycle lengths, in milliseconds, are denoted by the numbers at the top of the figure.
(Modified from Jalife J, Moe GK: Phasic effects of vagal stimulation on pacemaker activity of the isolated sinus node of the young cat. Circ Res 45:595, 1979.)
Overdrive Suppression
A period of excitation at a high frequency depresses automaticity of pacemaker cells. This phenomenon is known as overdrive suppression. The firing of the SA node tends to suppress the automaticity in the other loci because the SA node has a greater intrinsic rhythmicity than the other latent pacemaking sites in the heart.
The mechanism responsible for overdrive suppression appears to be based on the activity of the membrane pump (Na+,K+-ATPase) that actively extrudes three Na+ from the cell, in exchange for two K+. During each depolarization, a certain quantity of Na+ enters the cell; therefore the more frequently it is depolarized, the greater the amount of Na+ that enters the cell per minute. At high excitation frequencies the Na+ pump becomes more active in extruding this larger quantity of Na+ from the cell interior. This enhanced pump activity hyperpolarizes the cell through the net loss of cations from the cell interior. Because of the hyperpolarization, the slow diastolic depolarization requires more time to reach the threshold, as shown in Figure 3-3B. Furthermore, when the overdrive suddenly ceases, the Na+ pump does not decelerate instantaneously but continues to operate at an accelerated rate for some time. This excessive extrusion of Na+ opposes the gradual depolarization of the pacemaker cell during phase 4 and thereby suppresses its intrinsic automaticity temporarily.
CLINICAL BOX
If an atrial ectopic focus suddenly begins to fire at a high rate (e.g., 150 impulses per minute) in an individual with a normal heart rate of 70 beats per minute, the ectopic center would become the pacemaker for the entire heart. When that rapid ectopic focus suddenly stops firing, the SA node might remain quiescent briefly because of overdrive suppression. The interval from the end of the period of overdrive until the SA node resumes firing is called the sinus node recovery time. In patients with the so-called sick sinus syndrome, the sinus node recovery time may be markedly prolonged. The resultant period of asystole (cardiac standstill) can cause loss of consciousness.
Atrial Conduction
From the SA node, the cardiac impulse spreads radially throughout the right atrium (Figure 3-6) along ordinary atrial myocardial fibers, at a conduction velocity of approximately 1 m/s. A special pathway, the anterior interatrial myocardial band (or Bachmann’s bundle), conducts the impulse from the SA node directly to the left atrium. Three tracts, the anterior, middle, and posterior internodal pathways, have been described. These tracts consist of a mixture of ordinary myocardial cells and specialized conducting fibers. Some investigators assert that these pathways constitute the principal routes for conduction of the cardiac impulse from the SA node to the AV node.
The configuration of the atrial action potential is depicted in Figure 2-16C. Compared with the potential recorded from a typical ventricular fiber (see Figure 2-16A), the plateau (phase 2) is not as well developed, repolarization (phase 3) occurs as a slower rate, and the action potential duration is briefer.
Atrioventricular Conduction
The cardiac action potential proceeds along the internodal pathways in the atrium and ultimately reaches the AV node (see Figure 3-6). This node is approximately 22 mm long, 10 mm wide, and 3 mm thick in adult humans. The node is situated posteriorly on the right side of the interatrial septum and is circumscribed by the ostium of the coronary sins, the tendon of Todaro, and the tricuspid valve. The AV node contains the same two cell types as the SA node, but the round cells are more sparse and the spindle-shaped cells preponderate. Conduction of the impulse from the atrium to the AV node has been described as consisting of fast and slow pathways. There is some anatomical evidence for this well-known observation. The existence of fast and slow conduction paths allows a substrate for reentrant circuits within the AV node. Cells in the inferior portion of the AV node serve as a subsidiary pacemaker.
The AV node is divided into three functional regions: (1) the AN region, the transitional zone between the atrium and the remainder of the node; (2) the N region, the midportion of the AV node; and (3) the NH region, the zone in which nodal fibers gradually merge with the bundle of His, which is the upper portion of the specialized ventricular conducting system. Normally, the AV node and bundle of His constitute the only pathways for conduction from atria to ventricles.
Several features of AV conduction are of physiological and clinical significance. The principal delay in the passage of the impulse from the atria to the ventricles occurs in the AN and N regions of the AV node. The conduction velocity is actually less in the N region than in the AN region. However, the path length is substantially greater in the AN region than in the N region. The conduction times through the AN and N regions largely account for the delay between the onsets of the P wave (the electrical manifestation of the spread of atrial excitation) and the QRS complex (spread of ventricular excitation) in the electrocardiogram (Figure 3-7). Functionally, this delay between atrial excitation and ventricular excitation permits optimal ventricular filling during atrial contraction.
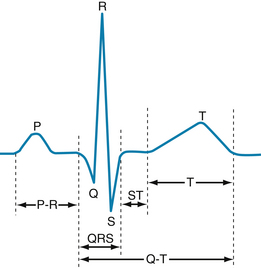
FIGURE 3-7 Configuration of a typical scalar electrocardiogram, illustrating the important deflections and intervals.
In the N region, slow-response action potentials prevail. The resting potential is about −60 mV, the upstroke velocity is very low (about 5 V/s), and the conduction velocity is about 0.05 m/s. Tetrodotoxin, which blocks the fast Na+ channels, does not affect the action potentials in this region. Conversely, the Ca++ channel antagonists decrease the amplitude and duration of the action potentials (Figure 3-8) and slow AV conduction. The shapes of the action potentials in the AN region are intermediate between those in the N region and the atria. Similarly, the action potentials in the NH region are transitional between those in the N region and the bundle of His. The relative refractory period of the cells in the N region extends well beyond the period of complete repolarization; that is, these cells display postrepolarization refractoriness (see Figure 2-19).
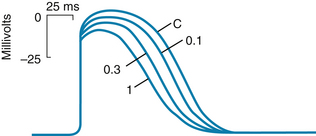
FIGURE 3-8 Transmembrane potentials recorded from a rabbit atrioventricular node cell under control conditions (C) and in the presence of the calcium channel–blocking drug diltiazem in concentrations of 0.1, 0.3, and 1.0 µmol/L.
(Redrawn from Hirth C, Borchard U, Hafner D: Effects of the calcium antagonist diltiazem on action potentials, slow response and force of contraction in different cardiac tissues. J Mol Cell Cardiol 15:799, 1983.)
As the repetition rate of atrial depolarizations is increased, conduction through the AV junctions slows. An abnormal prolongation of AV conduction time is called first-degree AV block (Figure 3-9A). Most of the prolongation of AV conduction caused by an increase in repetition rate takes place in the N region.
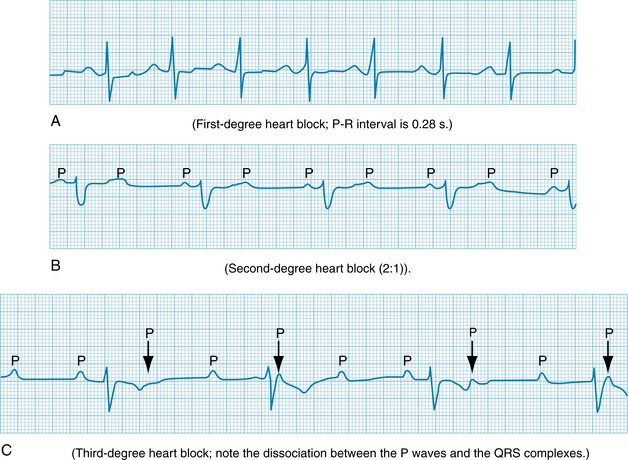
FIGURE 3-9 Atrioventricular (AV) blocks. A, First-degree heart block; P-R interval is 0.28 s. B, Second-degree heart block (2:1). C, Third-degree heart block; note the dissociation between the P waves and the QRS complexes.
Impulses tend to be blocked in the AV node at stimulus frequencies that are easily conducted in other regions of the heart. If the atria are depolarized at a high frequency, only a fraction (e.g., one half) of the atrial impulses might be conducted through the AV junction to the ventricles. The conduction pattern in which only a fraction of the atrial impulses are conducted to the ventricles is called second-degree AV block (see Figure 3-9B). This type of block may protect the ventricles from excessive contraction frequencies, wherein the filling time between successive ventricular contractions might be inadequate and therefore the ventricles would be unable to deliver an adequate cardiac output.
Retrograde conduction can occur through the AV node. However, the propagation time is significantly longer, and the impulse tends to be blocked at lower repetition rates during retrograde conduction than during antegrade conduction . Finally, the AV node is a common site for reentry, a phenomenon explained later in this chapter.
The autonomic nervous system regulates AV conduction. Weak vagal activity may simply prolong the AV conduction time. Stronger vagal activity may cause some or all of the impulses arriving from the atria to be blocked in the node. The conduction pattern in which none of the atrial impulses reach the ventricles over a substantial number of atrial depolarizations is called third-degree, or complete, AV block (see Figure 3-9C). The delayed conduction or block induced by vagal stimulation occurs largely in the N region of the node.
CLINICAL BOX
First- and second-degree AV blocks are most frequently caused by inflammatory processes (acute rheumatic fever), drugs (calcium channel antagonists), or rapid atrial rates (supraventricular tachycardias). Third-degree AV block is most often caused by a degenerative process of unknown cause or by severe myocardial ischemia (inadequate coronary blood supply).
Acetylcholine released by vagus nerve fibers hyperpolarizes the conducting fibers in the N region (Figure 3-10). The greater the hyperpolarization at the time of arrival of the atrial impulse, the more impaired the AV conduction will be. In the experiment shown in Figure 3-10, vagus nerve fibers were stimulated intensely (at St) shortly before the second atrial depolarization (A2). This atrial impulse arrived at the AV node cell when its cell membrane was maximally hyperpolarized. The absence of a corresponding depolarization of the bundle of His (H) shows that the second atrial impulse was not conducted through the AV node. Only a small, nonpropagated response to the second atrial impulse is evident in the recording from the conducting fiber.
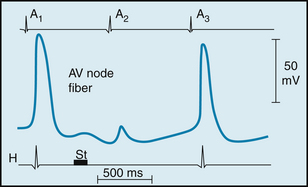
FIGURE 3-10 Effects of a brief vagal stimulus (St) on the transmembrane potential recorded from an atrioventricular (AV) nodal fiber from a rabbit. Note that shortly after vagal stimulation, the membrane of the fiber was hyperpolarized. The atrial excitation (A2) that arrived at the AV node when the cell was hyperpolarized failed to be conducted, as denoted by the absence of a depolarization in the His electrogram (H). The atrial excitations that preceded (A1) and followed (A3), excitation A2, were conducted to the His bundle region.
(Redrawn from Mazgalev T, Dreifus LS, Michelson EL, et al: Vagally induced hyperpolarization in atrioventricular node. Am J Physiol 251:H631, 1986.)
Cardiac sympathetic nerves, on the other hand, facilitate AV conduction. They decrease AV conduction time and enhance the rhythmicity of the latent pacemakers in the AV junction. The norepinephrine released at the sympathetic nerve terminals increases the amplitude and slope of the upstroke of the AV nodal action potentials, principally in the AN and N regions of the node.
CLINICAL BOX
Third-degree AV block is often referred to as complete heart block because the impulse is unable to traverse the AV conduction pathway from atria to ventricles. His bundle electrograms reveal that the most common sites of complete block are distal to the bundle of His. Because of the slow ventricular rhythm (32 beats per minute in the example in Figure 3-9C), circulation of blood is often inadequate, especially during muscular activity. Third-degree block is often associated with syncope (so-called Stokes-Adams attacks) caused principally by insufficient cerebral blood flow. Third-degree block is one of the most common conditions requiring treatment by artificial pacemakers.
Ventricular Conduction
The bundle of His passes subendocardially down the right side of the interventricular septum for about 1 cm and then divides into the right and left bundle branches (Figures 3-6 and 3-11). The right bundle branch is a direct continuation of the bundle of His and proceeds down the right side of the interventricular septum. The left bundle branch, which is considerably thicker than the right, arises almost perpendicularly from the bundle of His and perforates the interventricular septum. On the subendocardial surface of the left side of the interventricular septum, the main left bundle branch splits into a thin anterior division and a thick posterior division.
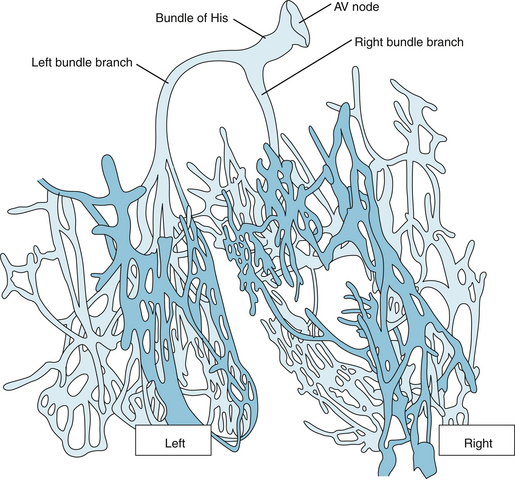
FIGURE 3-11 Atrioventricular (AV) and ventricular conduction system of the calf heart. The dark blue arrows indicate conduction from the sinoatrial node to the atria and the atrioventricular node and then to the bundle branches and terminal Purkinje fibers. The small black arrows show conduction within the interventricular septum and the ventricular myocardium.
(Redrawn from DeWitt LM: Observations on the sino-ventricular connecting system of the mammalian heart. Anat Rec 3:475, 1909.)
The right bundle branch and the two divisions of the left bundle branch ultimately subdivide into a complex network of conducting fibers called Purkinje fibers, which ramify over the subendocardial surfaces of both ventricles. In certain mammalian species, such as cattle, the Purkinje fiber network is arranged in discrete, encapsulated bundles (see Figure 3-11).
CLINICAL BOX
Impulse conduction in the right bundle branch, the main left bundle branch, or either division of the left bundle branch may be impaired as a consequence of a degenerative process or of coronary artery disease. Conduction blocks in one or more of these pathways give rise to characteristic electrocardiographic patterns. Block of either of the main bundle branches is known as right or left bundle branch block. Block of either division of the left bundle branch is called left anterior hemiblock or left posterior hemiblock.
Purkinje fibers are the broadest cells in the heart, 70 to 80 µm in diameter, compared with 10 to 15 µm for ventricular myocytes. The large diameter accounts in part for the greater conduction velocity in Purkinje than in myocardial fibers. Conduction of the action potential over the Purkinje fiber system is faster than in any other tissue within the heart; estimates of conduction velocity vary from 1 to 4 m/s. This permits a rapid activation of the entire endocardial surface of the ventricles. Purkinje cells have abundant, linearly arranged sarcomeres, just like myocardial cells. However, the T-tubular system is absent in the Purkinje cells of many species but is well developed in the myocardial cells (see Chapter 4).
The action potentials recorded from Purkinje fibers resemble those of ordinary ventricular myocardial fibers (see Figure 2-16A). In general, phase 1 is more prominent in Purkinje fiber action potentials (see Figure 2-3) than in action potentials recorded from ventricular fibers (especially endocardial fibers), and the duration of the plateau (phase 2) is longer.
Many premature activations of the atria that are conducted through the AV junction are blocked by the long refractory period of the Purkinje fibers. Therefore they fail to evoke a premature contraction of the ventricles. This function of protecting the ventricles against the effects of premature atrial depolarizations is especially pronounced at slow heart rates, because the action potential duration, and hence the effective refractory period of the Purkinje fibers, varies inversely with the heart rate (see Figure 2-20). At slow heart rates, the effective refractory period of the Purkinje fibers is especially prolonged; as the heart rate increases, the refractory period diminishes. Similar rate-dependent changes in the refractory period also occur in most of the other cells in the heart. However, in the AV node, the effective refractory period does not change appreciably over the normal range of heart rates, and it actually increases at very rapid heart rates. Therefore at high heart rates, it is the AV node that protects the ventricles when atrial impulses arrive at excessive repetition rates.
The first portions of the ventricles to be excited are the interventricular septum (except its basal portion) and the papillary muscles. The wave of activation spreads into the septum from both its left and its right endocardial surfaces. Early contraction of the septum tends to make it more rigid and allows it to serve as an anchor point for the contraction of the remaining ventricular myocardium. Also, early contraction of the papillary muscles prevents eversion of the AV valves during ventricular systole.
The endocardial surfaces of both ventricles are activated rapidly, but the wave of excitation spreads from endocardium to epicardium at a slower velocity (about 0.3 to 0.4 m/s). Because the right ventricular wall is appreciably thinner than the left, the epicardial surface of the right ventricle is activated earlier than the epicardial surface of the left ventricle. Also, apical and central epicardial regions of both ventricles are activated somewhat earlier than are their respective basal regions. The last portions of the ventricles to be excited are the posterior basal epicardial regions and a small zone in the basal portion of the interventricular septum.
An Impulse can Travel Around a Reentry Loop
Under certain conditions, a cardiac impulse may reexcite some region through which it had passed previously. This phenomenon, known as reentry, underlies many clinical disturbances of cardiac rhythm. Reentry may be ordered or random. In the ordered variety, the impulse traverses a fixed anatomical path, whereas in the random type, the path continues to change. The principal example of random reentry is fibrillation.
The conditions necessary for reentry are illustrated in Figure 3-12. In each of the four panels, a single bundle (S) of cardiac fibers splits into a left (L) and a right (R) branch with a connecting bundle (C) between the two branches. Normally, the impulse coming down bundle S is conducted along the L and R branches (panel A). As the impulse reaches connecting link C, it enters link C from both sides and becomes extinguished at the point of collision. The impulse from the left side cannot proceed further because the tissue beyond has just been depolarized from the other direction, and therefore it is absolutely refractory. The impulse cannot pass through bundle C from the right either, for the same reason.
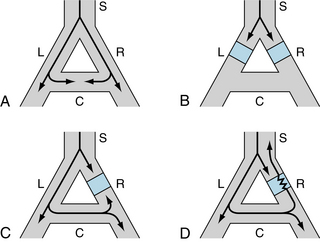
FIGURE 3-12 The role of unidirectional block in reentry. A, An excitation wave traveling down a single bundle (S) of fibers continues down the left (L) and right (R) branches. The depolarization wave enters the connecting branch (C) from both ends and is extinguished at the zone of collision. B, The wave is blocked (blue squares) in the L and R branches C, Bidirectional block exists in branch R. D, Unidirectional block exists in branch R. The antegrade impulse is blocked (blue square), but the retrograde impulse is conducted through (jagged line) and reenters bundle S.
Panel B of Figure 3-12 shows that the impulse cannot make a complete circuit if antegrade block exists in the two branches (L and R) of the fiber bundle. Furthermore, if bidirectional block exists at any point in the loop (e.g., branch R in panel C), the impulse will not be able to reenter.
A necessary condition for reentry is that at some point in the loop the impulse can pass in one direction but not in the other. This phenomenon is called unidirectional block. As shown in panel D, the impulse may travel down branch L normally and may be blocked in the antegrade direction in branch R. The impulse that was conducted down branch L and through the connecting branch C may be able to penetrate the depressed region in branch R from the retrograde direction, even though the antegrade impulse was blocked previously at this same site. The antegrade impulse arrives at the depressed region in branch R earlier than the impulse that traverses a longer path and enters branch R from the opposite direction. The antegrade impulse may be blocked simply because it arrives at the depressed region during its effective refractory period. If the retrograde impulse is delayed sufficiently, the refractory period may have ended, and the impulse is conducted back into bundle S.
Unidirectional block is a necessary condition for reentry, but not a sufficient one. The effective refractory period of the reentered region must also be less than the propagation time around the loop. In panel D, if the retrograde impulse is conducted through the depressed zone in branch R and if the tissue just beyond is still refractory from the antegrade depolarization, branch S is not reexcited. Therefore the conditions that promote reentry are those that prolong conduction time or shorten the effective refractory period.
The functional components of reentry loops responsible for specific dysrhythmias in intact hearts are diverse. Some loops are very large and involve entire specialized conduction bundles; other loops are microscopic. The loop may include myocardial fibers, specialized conducting fibers, nodal cells, and junctional tissues, in almost any conceivable arrangement. Also, the cardiac cells in the loop may be normal or deranged.
CLINICAL BOX
Accessory AV pathways are present in some people. Such pathways often serve as a part of a reentry loop (see Figure 3-12), which could lead to serious cardiac rhythm disturbances in these patients. The Wolff-Parkinson-White syndrome, a congenital disturbance, is the most common clinical disorder in which a bypass tract of myocardial fibers serves as an accessory pathway between atria and ventricles. Ordinarily, the syndrome causes no functional abnormality. It is easily detected in the electrocardiographic reading, because a portion of the ventricular myocardium is preexcited via the bypass tract. Slightly later, the normal excitation of the remainder of the ventricular myocardium via the AV node and His-Purkinje system imparts a bizarre configuration to the ventricular (QRS) complex of the electrocardiogram. Occasionally, however, a reentry loop develops in which the atrial impulse travels to the ventricle via one of the two AV pathways (AV node or bypass tract), and then the impulse travels back to the atria through the other of the two pathways. Continuous circling around the loop leads to a very rapid rhythm (supraventricular tachycardia), which may be incapacitating because the rapid rate may not allow sufficient time for ventricular filling.
Afterdepolarizations Lead to Triggered Activity
Triggered activity is so named because it is always coupled to a preceding action potential. Consequently, dysrhythmias induced by triggered activity are difficult to distinguish from those induced by reentry, which is also always coupled to a previous action potential. Triggered activity is caused by afterdepolarizations. Two types of afterdepolarizations are recognized: early afterdepolarizations (EADs) and delayed afterdepolarizations (DADs). EADs occur at the end of the plateau (phase 2) of an action potential or about midway through repolarization (phase 3), whereas DADs occur near the very end of repolarization or just after full repolarization (phase 4).
Early Afterdepolarizations
EADs are more likely to occur when the prevailing heart rate is slow; rapid pacing suppresses EADs. In the experiment shown in Figure 3-13, EADs were induced by cesium in an isolated Purkinje fiber preparation. No afterdepolarizations were evident when the preparation was driven at a cycle length of 2 seconds (s). When the cycle length was increased to 4 s, EADs appeared; their incidence increased as cycle length increased to 6 and 10 s. Some EADs were subthreshold but eventually others reached threshold to trigger an action potential.
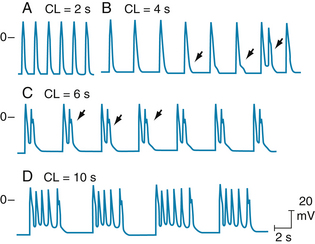
FIGURE 3-13 Effect of pacing at different cycle lengths (CLs) on cesium-induced early afterdepolarizations (EADs) in a canine Purkinje fiber. A, EADs not evident. B, EADs first appear (arrows). The third EAD reaches threshold and triggers an action potential (third arrow). C, EADs that appear after each driven depolarization trigger an action potential. D, Triggered action potentials occur in salvos.
(Modified from Damiano BP, Rosen M: Effects of pacing on triggered activity induced by early afterdepolarizations. Circulation 69:1013, 1984.)
EADs may be produced experimentally by interventions that prolong the action potential. Because EADs may be initiated at either of two distinct levels of transmembrane potential, namely, at the end of the plateau and about midway through repolarization, two different mechanisms may be involved in generating them.
Considerable information has been obtained about the mechanism responsible for those EADs that appear at the end of the plateau. The more prolonged the action potential, the more likely are EADs to occur. For those action potentials that trigger EADs, the plateau appears to be prolonged enough so that those Ca++ channels that were activated at the beginning of the plateau and then inactivated would have sufficient time to be reactivated again before the plateau had expired. This secondary activation, which seems to depend on the activity of calcium/calmodulin-dependent protein kinase type II (CaMKII), can trigger an afterdepolarization. Less information is available about the cellular mechanisms responsible for those EADs that appear midway through repolarization.
CLINICAL BOX
The pathologic significance of EADs was recognized in connection with the congenital and drug-induced long QT syndrome (LQTS). As the action potential lengthens, EADs occur and caused triggered automaticity. In the electrocardiogram, this problem is manifested as polymorphic ventricular tachycardia, also called torsades de pointes. Episodes of torsades de pointes can be self-limited but may proceed to ventricular fibrillation and sudden death. Clinically, hypokalemia and bradycardia (see Figure 3-13) are hallmarks of its presentation. Restoring extracellular K+ to normal levels and increasing heart rate are two approaches used to overcome the propensity for development of torsades de pointes.
Delayed Afterdepolarizations
In contrast to EADs, DADs tend to appear when the heart rate is high. The salient characteristics of DADs are shown in Figure 3-14. Transmembrane potentials were recorded from Purkinje fibers that were exposed to a high concentration of acetylstrophanthidin, a digitalis-like substance. In the absence of pacing stimuli, these fibers were quiescent. In each panel, a sequence of six driven action potentials was induced at various basic cycle lengths.
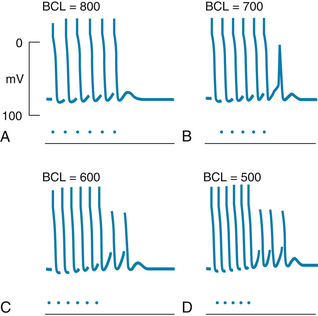
FIGURE 3-14 Transmembrane action potentials recorded from isolated canine Purkinje fibers. Acetylstrophanthidin was added to the bath, and sequences of six driven beats (denoted by the dots) were produced at basic cycle lengths (BCL) of 800, 700, 600, and 500 ms. Note that delayed afterpotentials occurred after the driven beats and that these afterpotentials reached threshold after the last driven beat in panels B to D but not in panel A.
(From Ferrier GR, Saunders JH, Mendez C: A cellular mechanism for the generation of ventricular arrhythmias by acetylstrophanthidin. Circ Res 32:600, 1973.)
When the cycle length was 800 milliseconds (ms) (panel A), the last driven action potential was followed by a brief subthreshold DAD that did not reach threshold and, after the DAD had subsided, the transmembrane potential remained constant. When the basic cycle length was diminished to 700 ms (panel B), the DAD that followed the last paced beat reached threshold, and a triggered depolarization (or extrasystole) ensued. This extrasystole was itself followed by a subthreshold afterpotential. Diminution of the basic cycle length to 600 ms (panel C) evoked two extrasystoles after the last driven action potential. A sequence of three extrasystoles followed the six driven depolarizations that were separated by intervals of 500 ms (panel D). Slightly shorter basic cycle lengths or slightly greater concentrations of acetylstrophanthidin evoked a continuous sequence of nondriven beats, resembling a paroxysmal tachycardia (described later in this chapter).
DADs are associated with elevated intracellular Ca++ concentrations. The amplitudes of the DADs are increased by interventions that raise intracellular Ca++ concentrations, such as elevated extracellular Ca++ concentrations and toxic levels of digitalis glycosides. Elevations of intracellular Ca++ provoke the oscillatory release of Ca++ from the SR. Hence in myocardial cells, the DADs are accompanied by small changes in developed force. The high intracellular Ca++ concentrations also activate certain membrane channels that permit the passage of Na+ and K+. The net flux of these cations constitutes a transient inward current, Iti, that is at least partly responsible for the afterdepolarization of the cell membrane.
Electrocardiography Displays the Spread of Cardiac Excitation
The electrocardiograph enables the physician to infer the rate, rhythm, and course of the cardiac impulse simply by recording the variations in electrical potential at various loci on the body surface. By analyzing the details of these potential fluctuations, the physician gains valuable insight concerning (1) the anatomical orientation of the heart; (2) the relative sizes of its chambers; (3) a variety of disturbances of rhythm and conduction; (4) the extent, location, and progress of ischemic damage to the myocardium; (5) the effects of altered electrolyte concentrations; and (6) the influence of certain drugs (notably digitalis derivatives and antidysrhythmic agents). The science of electrocardiography is extensive and complex; only its elementary basis is considered here.
Scalar Electrocardiography
The systems of leads used to record routine electrocardiograms are oriented in certain planes of the body. The diverse electromotive forces that exist in the heart at any moment can be represented by a three-dimensional vector. A system of recording leads oriented in a given plane detects the projection of the three-dimensional vector on that plane. Furthermore, the potential difference between two recording electrodes represents the projection of the vector on the line between the two leads. Components of vectors projected on such lines are not vectors but scalar quantities (having magnitude but not direction). Hence, a recording of the changes with time of the differences of potential between two points on the surface of the skin is called a scalar electrocardiogram.
Configuration of the Scalar Electrocardiogram
The scalar electrocardiogram detects the changes with time of the electrical potential between some point on the skin surface and an indifferent electrode or between pairs of points on the skin surface. The cardiac impulse progresses through the heart in a complex three-dimensional pattern. Hence, the configuration of the electrocardiogram varies from individual to individual, and in any given individual the pattern varies with the anatomical location of the leads.
In general, the pattern consists of P, QRS, and T waves (see Figure 3-7). The P-R interval (or more precisely, the P-Q interval) is a measure of the time from the onset of atrial activation to the onset of ventricular activation; it normally ranges from 0.12 to 0.20 s. A considerable fraction of this time involves passage of the impulse through the AV conduction system. Pathological prolongations of this interval are associated with disturbances of AV conduction produced by inflammatory, circulatory, pharmacological, or nervous mechanisms.
The configuration and amplitude of the QRS complex vary considerably among individuals. The duration is usually between 0.06 and 0.10 s. Abnormal prolongation may indicate a block in the normal conduction pathways through the ventricles (such as a block of the left or right bundle branch). During the ST interval the entire ventricular myocardium is depolarized and there is negligible potential difference in the ventricle. Therefore the ST segment lies on the isoelectric line, under normal conditions. Any appreciable deviation from the isoelectric line is noteworthy and may indicate ischemic damage of the myocardium. The Q-T interval is sometimes referred to as the period of “electrical systole” of the ventricles. Its duration is about 0.4 s, but it varies inversely with the heart rate, mainly because the myocardial cell action potential duration varies inversely with the heart rate (see Figure 2-20).
In most leads the T wave is deflected in the same direction from the isoelectric line as the major component of the QRS complex, although biphasic or oppositely directed T waves are perfectly normal in certain leads. Deviation of the T wave and QRS complex in the same direction from the isoelectric line indicates that the repolarization process proceeds in a direction counter to the depolarization process. T waves that are abnormal in either direction or amplitude may indicate myocardial damage, electrolyte disturbances, or cardiac hypertrophy.
Standard Limb Leads
Einthoven devised the original electrocardiographic lead system. In his lead system the resultant cardiac vector (the vector sum of all electrical activity occurring in the heart at any given moment) was considered to lie in the center of a triangle (assumed to be equilateral) formed by the left and right shoulders and the pubic region (Figure 3-15). This so-called Einthoven triangle is oriented in the frontal plane of the body. Hence only the projection of the resultant cardiac vector on the frontal plane is detected by this system of leads. For convenience, the electrodes are connected to the right and left forearms rather than to the corresponding shoulders, because the arms represent simple extensions of the leads from the shoulders. Similarly, the leg is taken as an extension of the lead system from the pubis, and the third electrode is connected to the left leg (by convention).
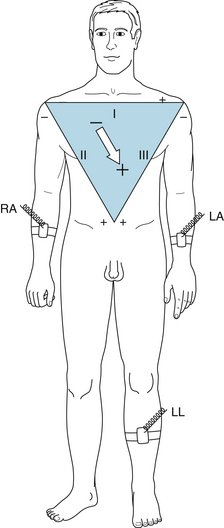
FIGURE 3-15 Einthoven triangle, illustrating the galvanometer connections for standard limb leads I, II, and III. LA, left arm connection; LL, left leg connection; RA, right arm connection. The arrow shows the sum of electrical forces as the cardiac vector obtained from the limb leads.
Certain conventions dictate the manner in which these standard limb leads are connected to the galvanometer. Lead I records the potential difference between the left arm (LA) and right arm (RA). The galvanometer connections are such that when the potential at LA (VLA) exceeds the potential at RA (VRA), the galvanometer is deflected upward from the isoelectric line. In Figures 3-15 and 3-16 this arrangement of the galvanometer connections for lead I is designated by a + at LA and by a − at RA. Lead II records the potential difference between RA and LL (left leg) and yields an upward deflection when the potential at LL (VLL) exceeds VRA. Finally, lead III registers the potential difference between LA and LL and yields an upward deflection when VLL exceeds VLA. These galvanometer connections were arbitrarily chosen so that the QRS complexes will be upright in all three standard limb leads in most normal individuals.
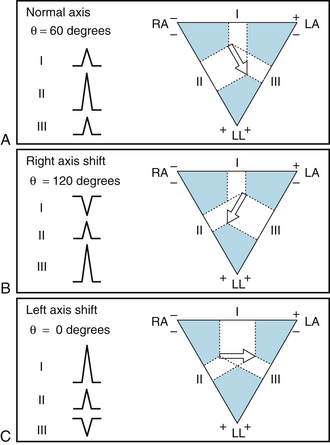
FIGURE 3-16 Magnitude and direction of the QRS complexes in limb leads I, II, and III, when the mean electrical axis (θ) is 60 degrees (A), 120 degrees (B), and 0 degrees (C). LA, left arm connection; LL, left leg connection; RA, right arm connection. The white areas indicate the projection on the frontal plane of QRS waves in each limb lead, and the large white arrow shows the resultant electrical axis of the cardiac vector.
Let the frontal projection of the resultant cardiac vector at some moment be represented by an arrow (tail negative, head positive), as in Figure 3-15. Then, the potential difference, VLA − VRA, recorded in lead I will be represented by the component of the vector projected along the horizontal line between LA and RA, as shown in Figure 3-16. If the cardiac vector makes an angle, θ, of 60 degrees with the horizontal (as in panel A of Figure 3-16), the magnitude of the potential recorded be lead I will equal the vector magnitude times cosine 60 degrees. The deflection recorded in lead I will be upward, because the positive arrowhead lies closer to LA than to RA. The deflection in lead II will also be upright, because the arrowhead lies closer to LL than to RA. The magnitude of the lead II deflection will be greater than that in lead I because in this example the direction of the vector parallels that of lead II; therefore the magnitude of the projection on lead II exceeds that on lead I. Similarly, in lead III the deflection will be upright, and in this example, where θ = 60 degrees, its magnitude will equal that in lead I.
If the vector in panel A of Figure 3-16 is the result of the electrical events occurring during the peak of the QRS complex, the orientation of this vector is said to represent the mean electrical axis of the heart in the frontal plane. The positive direction of this axis is taken in the clockwise direction from the horizontal plane (contrary to the usual mathematical convention). For normal individuals, the average mean electrical axis is approximately +60 degrees (as in panel A of Figure 3-16). Therefore the QRS complexes are usually upright in all three leads and largest in lead II.
With appreciable shift of the mean electrical axis to the right (panel B of Figure 3-16, in which θ = 120 degrees), the displacements of the QRS complexes in the standard leads change considerably. In this case the largest upright deflection is in lead III and the deflection in lead I is inverted, because the arrowhead is closer to RA than to LA. With left axis shift (panel C of Figure 3-16, where θ = 0 degrees), the largest upright deflection is in lead I, and the QRS complex in lead III is inverted.
As is evident from this discussion, the standard limb leads I, II, and III are oriented in the frontal plane at 0, 60, and 120 degrees, respectively, from the horizontal plane. Other limb leads, which are also oriented in the frontal plane, are usually recorded in addition to the standard leads. These “unipolar limb leads” lie along axes at angles of +90, −30, and −150 degrees from the horizontal plane. Such augmented lead systems are described in textbooks on electrocardiography and are not considered further here.
To obtain information concerning the projections of the cardiac vector on the sagittal and transverse planes of the body in scalar electrocardiography, the precordial leads are usually recorded. Most commonly, each of six selected points on the anterior and lateral surfaces of the chest in the vicinity of the heart is connected in turn to the galvanometer. The other galvanometer terminal is usually connected to a central terminal, which is composed of a junction of three leads from LA, RA, and LL, each in series with a 5000-ohm resistor. The voltage of this central terminal remains at a theoretical zero potential throughout the cardiac cycle.
Changes in the mean electrical axis may occur with alterations in the anatomical position of the heart or with changes in the relative preponderance of the right and left ventricles. For example, the axis tends to shift toward the left (more horizontal) in short, stocky individuals and toward the right (more vertical) in tall, thin persons. Also, with left or right ventricular hypertrophy (increased myocardial mass), the axis shifts toward the hypertrophied side.
Dysrhythmias Occur Frequently and Constitute Important Clinical Problems
Cardiac dysrhythmias reflect disturbances of either impulse propagation or impulse initiation. The principal disturbances of impulse propagation are conduction blocks and reentrant rhythms. Disturbances of impulse initiation include those that arise from the SA node and those that originate from various ectopic foci.
Altered Sinoatrial Rhythms
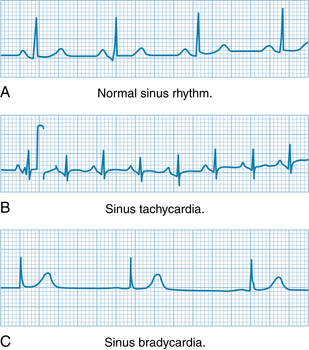
The frequency of pacemaker discharge varies by the mechanisms described earlier in this chapter (see Figure 3-3). Changes in SA nodal discharge frequency are usually produced by cardiac autonomic nerves. Examples of electrocardiograms of sinus tachycardia and sinus bradycardia are shown in Figure 3-17. The P, QRS, and T deflections are all normal, but the duration of the cardiac cycle (the P-P interval) is altered. Characteristically, when sinus bradycardia or tachycardia develops, the cardiac frequency changes gradually and requires several beats to attain its new steady-state value. Electrocardiographic evidence of respiratory cardiac dysrhythmia is common and is manifested as a rhythmic variation in the P-P interval at the respiratory frequency (see Figure 5-13).
Atrioventricular Transmission Blocks
Various physiological, pharmacological, and pathological processes can impede impulse transmission through the AV conduction tissue. The site of block can be localized more precisely by recording the His bundle electrogram (Figure 3-18). To obtain such tracings, an electrode catheter is introduced into a peripheral vein and threaded centrally until the tip containing the electrodes lies in the AV junctional region between the right atrium and ventricle. When the electrodes are properly positioned, a distinct deflection (Figure 3-18,H) is registered that represents the passage of the cardiac impulse down the bundle of His. The time intervals required for propagation from the atrium to the bundle of His (A-H interval) and from the bundle of His to the ventricles (H-V interval) may be measured accurately. Abnormal prolongation of the former or latter interval indicates block above or below the bundle of His, respectively.
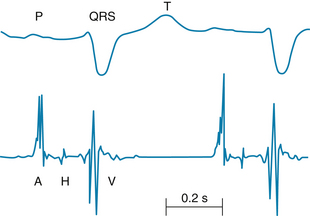
FIGURE 3-18 His bundle electrogram (lower tracing, retouched) and lead II of the scalar electrocardiogram (upper tracing). The deflection, H, which represents the impulse conduction over the bundle of His, is clearly visible between the atrial, A, and ventricular, V, deflections. The conduction time from the atria to the bundle of His is denoted by the A-H interval; that from the bundle of His to the ventricles, by the H-V interval.
Premature Depolarizations
Premature depolarizations occur at times in most normal individuals but are more common under certain abnormal conditions. They may originate in the atria, AV junction, or ventricles. One type of premature depolarization is coupled to a normally conducted depolarization by a constant coupling interval. If the normal depolarization is suppressed temporarily (e.g., by vagal stimulation), the premature depolarization is also suppressed. Such premature depolarizations are called coupled extrasystoles, or simply extrasystoles, and they probably reflect a reentry phenomenon (see Figure 3-12). A second type of premature depolarization occurs as the result of enhanced automaticity in some ectopic focus. This ectopic center may fire regularly and may be protected from depolarization by the normal cardiac impulse. If this premature depolarization occurs at a regular interval or at a simple multiple of that interval, the disturbance is called parasystole.
A premature atrial depolarization is shown in the electrocardiogram in Figure 3-19A. The normal interval between beats was 0.89 s (heart rate, 68 beats/min). The premature atrial depolarization (second P wave in the figure) followed the preceding P wave by only 0.56 s. The configuration of the premature P wave differs from the configuration of the other, normal P waves because the path of atrial excitation, originating at some ectopic focus in the atrium, is different from the normal spread of excitation that originates in the SA node. The QRS complex of the premature depolarization is usually normal in configuration because the spread of ventricular excitation occurs over the usual pathways.
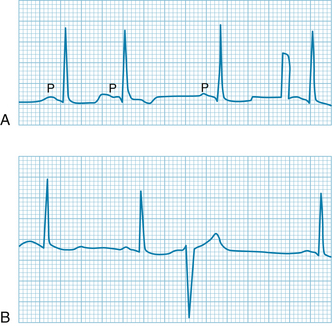
FIGURE 3-19 A premature atrial depolarization (A) and a premature ventricular depolarization (B). Atrial depolarization indicated by P; the premature atrial depolarization (second beat in the top tracing) is followed by normal QRS and T waves. The interval after the premature depolarization is not much longer than the usual interval between beats. The brief rectangular deflection just before the last depolarization is a standardization signal. The premature ventricular depolarization (B) is characterized by bizarre QRS and T waves and is followed by a compensatory pause.
A premature ventricular depolarization appears in Figure 13-19B. Because the premature excitation originated at some ectopic focus in the ventricles, the impulse spread was aberrant, and the configurations of the QRS and T waves are entirely different from the normal deflections. The premature QRS complex followed the preceding normal QRS complex by only 0.47 s. The interval after the premature excitation is 1.28 s, considerably longer than the normal interval between beats (0.89 s). The interval (1.75 s), from the QRS complex just before the premature excitation to the QRS complex just after it, is virtually equal to the duration of two normal cardiac cycles (1.78 s).
The prolonged interval that usually follows a premature ventricular depolarization is called a compensatory pause. The reason for the compensatory pause after a premature ventricular depolarization is that the ectopic ventricular impulse does not disturb the natural rhythm of the SA node. Either the ectopic ventricular impulse is not conducted retrogradely through the AV conduction system or, if it is, the time required is such that the SA node has already fired at its natural interval before the ectopic impulse could have reached it. Likewise, the SA nodal impulse that was generated between the second and third QRS complexes in Figure 3-19B did not affect the ventricle because the AV junction and perhaps also the ventricles were still refractory from the premature excitation. In Figure 3-19B, the P wave that originated in the SA node at the time of the premature depolarization occurred at the same time as the T wave of the premature cycle and therefore cannot easily be identified in the tracing.
Ectopic Tachycardias
When a tachycardia originates from some ectopic site in the heart, the onset and termination are typically abrupt, in contrast to the more gradual changes in heart rate in sinus tachycardia. Such ectopic tachycardias are usually called paroxysmal tachycardias because of their sudden appearance and abrupt cessation. Such tachycardias may cause light-headedness or even transient loss of consciousness (syncope), because the very rapid contraction frequency does not permit adequate time for ventricular filling between heartbeats.
Paroxysmal tachycardias that originate in the atria or in the AV junctional tissues (Figure 3-20A) are usually indistinguishable, and therefore both are included in the term paroxysmal supraventricular tachycardia. The tachycardia often results from an impulse repetitively circling a reentry loop that includes atrial tissue, the AV junction, or both. The QRS complexes are often normal because ventricular activation proceeds over the normal pathways.
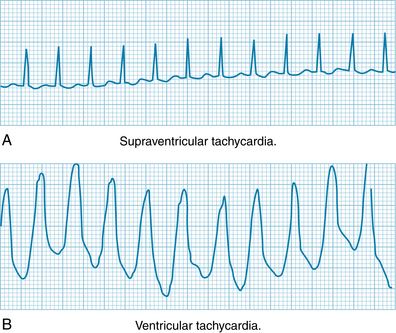
Paroxysmal ventricular tachycardia originates from an ectopic focus in the ventricles. The electrocardiogram is characterized by repeated, bizarre QRS complexes that reflect the aberrant intraventricular impulse conduction (Figure 3-20B). Paroxysmal ventricular tachycardia is much more ominous than supraventricular tachycardia because it is frequently a precursor of ventricular fibrillation, a lethal dysrhythmia described in the next section.
Episodes of ectopic tachycardia may persist for only a few beats or for many hours or days, and the episodes often recur. Paroxysmal tachycardias may occur as the result of (1) the rapid firing of an ectopic pacemaker; (2) triggered activity secondary to afterpotentials that reach threshold; or (3) an impulse circling a reentry loop repetitively.
Fibrillation
Under certain conditions, cardiac muscle undergoes an irregular type of contraction that is entirely ineffectual in propelling blood. Such a dysrhythmia is termed fibrillation and may involve either the atria or the ventricles. Fibrillation probably represents a reentry phenomenon in which the reentry loop fragments into multiple, irregular circuits.
The tracing in Figure 3-21A illustrates the electrocardiographic changes in atrial fibrillation as seen in various types of chronic heart disease. The atria do not contract and relax sequentially during each cardiac cycle and hence do not contribute to ventricular filling. Instead, the atria undergo a continuous, uncoordinated, rippling type of activity. In the electrocardiogram there are no P waves; they are replaced by continuous irregular fluctuations of potential, called f waves.
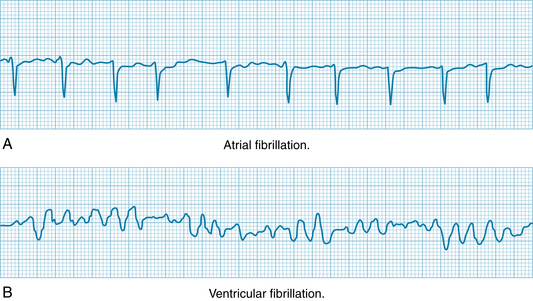
FIGURE 3-21 Atrial and ventricular fibrillation. A, Atrial fibrillation. B, Ventricular fibrillation.
Although atrial fibrillation and flutter are compatible with life and even with full physical activity, the onset of ventricular fibrillation leads to loss of consciousness within a few seconds. The irregular, continuous, uncoordinated twitchings of the ventricular muscle fibers pump no blood. In the electrocardiogram in Figure 3-21B, irregular fluctuations of potential are manifest.
In atrial fibrillation, the AV node is activated at intervals that may vary considerably from cycle to cycle. Hence there is no constant interval between QRS complexes and therefore between ventricular contractions. Because the strength of ventricular contraction depends on the interval between beats (see Figure 5-24), the volume and rhythm of the pulse are very irregular. In many patients the atrial reentry loop and the pattern of AV conduction are more regular. The rhythm is then referred to as atrial flutter.
Fibrillation is often initiated when a premature impulse arrives during the vulnerable period. In the ventricles, this period coincides with the downslope of the T wave. During this period, the excitability of the cardiac cells varies. Some fibers are still in their effective refractory periods, others have almost fully recovered their excitability, and still others are able to conduct impulses, but only at very slow conduction velocities. As a consequence, the action potentials are propagated over the chambers in multiple wavelets that travel along circuitous paths and at various conduction velocities. As a region of cardiac cells becomes excitable again, it will ultimately be reentered by one of the wave fronts traveling about the chamber. The process is self-sustaining.
Electric shock is sometimes used to treat ventricular fibrillation, and sometimes also atrial fibrillation, especially when the disturbance does not respond optimally to drugs. The timing of the shock is coordinated with the absolute refractory period of the ventricles (i.e., during or shortly after the QRS deflection of the electrocardiogram), so that the shock does not affect ventricular excitation. However, the shock will render all the atrial myocytes temporarily refractory, and thereby interrupt the prevailing reentry circuits.
Summary
 Automaticity is characteristic of certain cells in the heart, notably those in the SA and AV nodes and in the specialized conducting system. Automaticity is achieved by a slow spontaneous depolarization of the membrane during phase 4.
The SA node initiates the impulse that induces cardiac contraction. This impulse is propagated from the SA node to the atria, and the wave of excitation ultimately reaches the AV node.
The AV node cells are slow-response fibers, and the impulse travels very slowly through the AV node. The consequent delay between atrial and ventricular depolarizations provides adequate time for atrial contraction to help fill the ventricles.
Impulses may be initiated abnormally (1) by slow diastolic depolarization of automatic cells in ectopic sites or (2) by afterdepolarizations that reach threshold:
Ectopic foci: Automatic cells in the atrium, AV node, or His-Purkinje system may initiate propagated cardiac impulses either because the ordinarily more rhythmic, normal pacemaker cells are suppressed or because the rhythmicity of the ectopic foci is abnormally enhanced. Afterdepolarizations: Under abnormal conditions, afterdepolarizations may appear early in phase 3 of a normally initiated beat, or they may be delayed until near the end of phase 3 or the beginning of phase 4. Such afterdepolarizations may themselves trigger propagated impulses. Disturbances of impulse conduction consist mainly of simple conduction block and reentry:
Simple conduction block: Failure of propagation in a cardiac fiber as the result of a disease process (e.g., ischemia, inflammation) or a drug. Reentry: A cardiac impulse may traverse a loop of cardiac fibers and reenter previously excited tissue when the impulse is conducted slowly around the loop and the impulse is blocked unidirectionally in some section of the loop. The electrocardiogram is recorded from the surface of the body and traces the conduction of the cardiac impulse through the heart. The component waves of the electrocardiogram are:
Anderson R.H., Ho S.Y. The morphology of the cardiac conduction system. Novartis Found Symp. 2003;250:6.
Antzelevitch C., Shimuzu W., Yan G.X., et al. The M cell. Its contribution to the ECG and to normal and abnormal electrical function of the heart. J Cardiovasc Electrophysiol. 1999;10:1124.
Boyett M.R., Honjo H., Kodama I. The sinoatrial node, a heterogeneous pacemaker structure. Cardiovasc Res. 2000;47:658.
Gima K., Rudy Y. Ionic current basis of electrocardiographic waveforms. Circ Res. 2003;90:889.
Kleber A.G., Rudy Y. Basic mechanisms of cardiac impulse propagation and associated arrhythmias. Physiol Rev. 2004;84:431.
Lakatta E.G., DiFrancesco D. What keeps us ticking: a funny current, a calcium clock, or both? J Mol Cell Cardiol. 2009;47:157.
Li J., Greener I.D., Inada S., et al. Computer three-dimensional reconstruction of the atrioventricular node. Circ Res. 2008;102:975.
Noble D., Noble P.J., Fink M. Competing oscillators in cardiac pacemaking: Historical background. Circ Res. 2010;106:1791.
Rohr S. Role of gap junctions in the propagation of the cardiac action potential. Cardiovasc Res. 2004;62:309.
Vassalle M., Yu H., Cohen I.S. The pacemaker current in cardiac Purkinje myocytes. J Gen Physiol. 1995;106:559.
CASE 3-3
History
An 18-year-old high school student has seen a cardiologist regularly since it was discovered that she had symptoms of the long QT (LQT) syndrome 3 years ago. At that time, she experienced several episodes of light-headedness during a soccer game. Her family physician performed an analysis of systems, which found everything normal except for some electrocardiographic abnormalities. She was referred to the cardiologist whose examination included an ECG. The cardiologist reported a patient in normal sinus rhythm with a heart rate of 71 beats/min. Other ECG data were a PR interval of 0.14 s, QRS duration of 0.10 s, and a QT interval of 475 ms. The QT interval, even when corrected for heart rate, is abnormally long. Analysis of DNA revealed that the patient had a mutation in a gene linked to a cardiac potassium channel. The mutation (loss of function) results in less outward repolarizing current and therefore, a longer ventricular action potential. The phenotype of her syndrome is designated LQT1. The cardiologist had the patient walk around the office for light exercise. Immediately after exercising, her heart rate was increased and her QT interval had decreased, as expected. The cardiologist advised her not to participate in competitive athletics and prescribed a β-adrenergic antagonist (atenolol) to be taken daily. She has followed this regimen and has remained symptom-free since first diagnosed.
Questions
1. The PR interval of 0.14 s indicates that:
2. The QT interval measures the average:
3. When the patient exercised, heart rate increased, and this can be measured in:
4. The long QT syndrome is associated with early afterdepolarizations (EADs) and can eventually produce torsades de pointes (a form of ventricular fibrillation). During exercise, the patient’s QT interval: