Questions about diagnosis
examples of appraisals from different health professions
Chris Del Mar, Sally Bennett, Mal Boyle, Jeff Coombes, Mark R Elkins, Angela Morgan, Lisa Nissen, Claire Rickard, Sharon Sanders, Michal Schneider-Kolsky and Jemma Skeat
This chapter accompanies the previous chapter (Chapter 6) where the steps involved in answering a clinical question about diagnosis or assessment were explained. In order to further help you learn how to appraise the evidence for this type of question, this chapter contains a number of worked examples of questions about diagnosis from a range of health professions. These worked examples follow the same format as those in Chapter 5. As with the worked examples that are in Chapter 5, the authors of the worked examples in this chapter were also asked not to choose a systematic review, but to instead find and use the next best available level of evidence to answer the clinical question that is in the worked example. This is because it is easier to learn how to appraise a systematic review of test accuracy studies if you have first learnt how to appraise a study about test accuracy. Chapter 12 will help you to learn how to appraise a systematic review.
Occupational therapy example
Clinical scenario
You are a paediatric occupational therapist who works in private practice. You often work in local schools with children who have a range of developmental disorders. You frequently use the Bruininks–Oseretsky Test of Motor Proficiency to identify children who may have developmental coordination disorder. The busy nature of your practice, and the time it takes to administer the Bruininks–Oseretsky (often 45–60 minutes), means you would like to know more about a test that you have recently heard about called the Motor Performance Checklist because it is only a 12-item measure and was designed for identifying children with motor performance difficulties such as developmental coordination disorder.
Among children with motor performance problems, is the Motor Performance Checklist as accurate as the Bruininks–Oseretsky Test of Motor Proficiency for identifying developmental coordination disorder?
Search terms and databases used to find the evidence
Database: PubMed—Clinical Queries (with ‘diagnosis category’ and ‘narrow scope’ selected).
Search terms: (The Motor Performance Checklist)
The PubMed Clinical Queries diagnosis ‘narrow scope’ filter automatically combines this phrase with the term ‘specificity’ in the title or abstract. An alternative search approach would have been to enter this phrase in the CINAHL database and combine it with the term ‘specificity’.
This search retrieves four titles. The second title is obviously relevant, so you obtain the full text of the article.
Gwynne K, Blick B. Motor performance checklist for 5-year-olds: a tool for identifying children at risk of developmental co-ordination disorder. J Paediatr Child Health 2004;40:369–73.
Structured abstract (adapted from the above)
Study design: This study used a cross-sectional design to compare a new measure of motor performance with a ‘gold standard’ test for identifying children with developmental coordination disorder.
Setting: The study was conducted in schools in Sydney, Australia.
Participants: All 5-year-old children in a random sample of seven schools from 59 primary schools in the northern beaches sector of Sydney were invited to participate. Of the total population of children in the participating schools, 141 (60%) participated in the study (mean age 5 years and 5 months; 54% male). The prevalence of developmental coordination disorder in the study population was 4.2%.
Description of test: The Motor Performance Checklist is a 12-item instrument for identifying children at risk of developmental coordination disorder.
Diagnostic standard: The Bruininks–Oseretsky Test of Motor Proficiency Long Form. A composite standard score of 40 (1 standard deviation below the mean) was used as the Bruininks–Oseretsky Test of Motor Proficiency Long Form cut-off/failure point to direct children to occupational therapy.
Main results: The Motor Performance Checklist was found to have a sensitivity of 83% and a specificity of 98%. The post-test probability of a positive test was 72% and of a negative test 1% at the cut-off score of 4.
Conclusion: The Motor Performance Checklist has the potential to aid in identifying children who are in need of referral to community occupational therapy services.
Is the evidence likely to be biased?
• Did all participants get the diagnostic test and the reference standard?
Yes. The study report states that all children were tested using both measures. The reference standard used for this study was the Bruininks–Oseretsky Test of Motor Proficiency Long Form. It is a well-validated and frequently used measure for assessing motor performance difficulties in children.
• Could the results of the test of interest have been influenced by the results of the reference standard, or vice versa?
No. A nurse was trained to administer the Motor Performance Checklist, and an occupational therapist blinded to the Motor Performance Checklist results administered the Bruininks–Oseretsky Test of Motor Proficiency.
• Is the disease status of the tested population clearly described?
Yes. The study included children from a random sample of seven out of 59 primary schools in a district of Sydney, Australia. The article states that the population from which the sample was drawn was fairly homogenous with 11% from non-English-speaking backgrounds. Twenty per cent of this population had a tertiary education. There was an approximately even distribution between male (54%) and female (46%) children who participated in the study.
• Were the methods for performing the test described in sufficient detail?
No. Nurses who administered the Motor Performance Checklist were trained in its use for the purpose of this study and a reference to an article that describes the test procedure in detail is provided. However, the actual testing conditions were not clearly described. As the Bruininks–Oseretsky Test of Motor Proficiency is a standardised test, it would have to have been carried out as per the standardised instructions.
In this study, 6 (4.2%) children were identified by the Bruininks–Oseretsky Test of Motor Proficiency as having developmental coordination disorder. This study presents the sensitivity, specificity, post-test probabilities and likelihood ratios for identifying developmental coordination disorder using the Motor Performance Checklist (see Table 7.1) and compares this with the Bruininks–Oseretsky Test of Motor Proficiency Long Form using a cut-off score of 40 points.
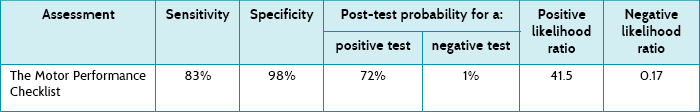
The Motor Performance Checklist has high specificity (98%), which means that there would be very few false positives. The sensitivity of 83% is also reasonably high, meaning that not many children who had developmental coordination disorder would be missed (few false negatives).
The post-test probability of a positive test looks at the data in a different way. A post-test probability of 72% means that the chance of a child actually having developmental coordination disorder if they have a positive Motor Performance Checklist result (using the cut-off score of 4) is 72%. Similarly, using the post-test probability of a negative test, the chance of a child having the disorder with a negative test is 1%.
As you saw in Chapter 6, two things contribute to the post-test probabilities: the quality of the test (how well it performs as described by the sensitivity and specificity) and the prevalence of the disorder. In this example, only about 4% of children had the condition. This means that we can only generalise the post-test probabilities to other populations that have a similar prevalence.
Another way to deal with this is to look at likelihood ratios, which use a clever algebraic approach enabling us to not have to rely on prevalence to describe the usefulness of a test, yet also employ both sensitivity and specificity. The positive likelihood ratio is the likelihood of a positive test result in a child with the condition compared with the same likelihood in one without the condition. In this study, the positive likelihood ratio is 41.5 [calculated as sensitivity ÷ (100 – specificity)]. Using the approximate guide values that were presented in Chapter 6, a positive likelihood ratio over 10 indicates that the test is extremely good for ruling in the presence of developmental coordination disorder if it is present. The negative likelihood ratio was 0.17 [calculated as (100 – sensitivity) ÷ specificity] which, again using the values presented in Chapter 6, indicates that it is a test that can also help rule out the presence of developmental coordination disorder.
How might we use this evidence to inform practice?
Although this study may be prone to some types of bias that are common in cross-sectional studies, it was otherwise well-designed and you are reasonably confident about the results. There are three factors about this study to think about, though. First, the ability of the Motor Performance Checklist to identify children with developmental coordination disorder was restricted in this study to children who were 5 years old. Testing this measure with children from 4 to 10 years is needed, as this is the age range that this assessment was designed to be used with. Second, the study reports a low prevalence of developmental coordination disorder, and the authors state that this is lower than reported in the literature. This means that, in populations with a higher prevalence of developmental coordination disorder, the post-test probability of a positive test (the chance of the test being correct) will be greater than reported in this study. Finally, the brevity of this measure is appealing and the article also reports on the concurrent validity and reliability of this measure, which are other psychometric test properties that must be considered when considering using an assessment with patients.
You think back to your original dilemma. Can you use the Motor Performance Checklist for identifying children with developmental coordination disorder? The study was limited to children aged 5 years, so you are just a little uncertain whether the study can be applied to those older and younger, although this is likely.
Physiotherapy example
Clinical scenario
A 25-year-old male cricketer presents to your physiotherapy outpatient clinic with right shoulder pain. The pain began without any acute injury and is aggravated by repetitive throwing and catching. The location of the pain and your standard physical examination make you suspect, among other possible diagnoses, that he may have a lesion of the posteroinferior portion of the labrum of his shoulder. You are only aware of manual tests to diagnose superior labral lesions, and wonder if there is a formal test for posteroinferior lesions. Also, you have recently read a systematic review that examined a range of widely used manual tests for shoulder pathology.1 The review indicated that several of the tests have limited diagnostic accuracy compared with the ‘gold standard’ of seeing the pathology during surgery. You decide to search for a study of the diagnostic accuracy of any test for posteroinferior labral lesions.
In athletes with shoulder pain, is there a manual test for diagnosing posteroinferior lesions of the labrum, and what is its diagnostic utility?
Search terms and databases used to find the evidence
Database: PubMed—Clinical Queries (with ‘diagnosis category’ and ‘narrow scope’ selected).
Search terms: posteroinferior (labral OR labrum)
The search returns five records. One of these articles seems very promising: a comparison of the ability of two manual tests to diagnose posteroinferior labral tears, with surgical observation as the gold standard. It looks highly relevant, but you are concerned that your search is too narrow. You repeat the search, selecting the ‘broad, sensitive search’ option. This returns 20 records, but none of these is as relevant as the original article you found.
Kim S, Park J, Jeong W, et al. The Kim test: a novel test for posteroinferior labral lesion of the shoulder—a comparison to the jerk test. Am J Sports Med 2005;33:1188–92.
Structured abstract (adapted from the above)
Study design: Cohort study.
Setting: Department of Orthopaedic Surgery at a hospital in Korea.
Participants: 172 adults awaiting arthroscopic examination for undiagnosed shoulder pain. Exclusion criteria were septic arthritis, fracture of the greater tuberosity, arthroscopic capsular release due to frozen shoulder, frozen shoulder, and previous surgery.
Description of tests: For the Kim test, the patient sits with the trunk against a backrest and the arm abducted to 90°. The examiner applies axial force along the humerus at the elbow to compress the glenohumeral joint and elevates the arm by 45°. With the other hand, the examiner applies downward and backward force to the upper arm. Sudden onset of pain indicates a positive test. For the jerk test, the patient sits with the arm abducted to 90° and internally rotated 90°. The examiner stands behind and supports the scapula with one hand. With the other hand, axial force is applied at the elbow and maintained while the arm is horizontally adducted. Sharp pain indicates a positive test. Each test was performed by two independent examiners.
Diagnostic standard: Arthroscopic examination of the glenohumeral joint and subacromial space.
Main results: Thirty (17%) of the 172 participants had a posteroinferior labral lesion. The Kim test had sensitivity of 80% and specificity of 94%. The positive predictive value of the Kim test was 0.73 and the negative predictive value was 0.96. The jerk test had sensitivity of 73% and specificity of 98%. The positive predictive value of the jerk test was 0.88 and the negative predictive value was 0.95. The sensitivity in detecting a posteroinferior lesion increased to 97% when the two tests were combined.
Conclusion: The two tests, particularly in combination, have worthwhile clinical utility in the diagnosis of posteroinferior labral lesions.
Is the evidence likely to be biased?
• Did all participants get the diagnostic test and the reference standard?
Yes. All participants received the diagnostic tests of interest and the reference standard.
• Could the results of the test of interest have been influenced by the results of the reference standard, or vice versa?
No. The manual tests were performed before the arthroscopy (so the arthroscopic examination could not have influenced them). And the results of the arthroscopy could not have been influenced by the results of the manual tests because the surgeon was blinded.
• Is the disease status of the tested population clearly described?
Yes. The description of the study population is reassuring: eligible patients were recruited consecutively from an orthopaedic surgical clinic. All participants entered the study with preliminary clinical diagnoses that were potentially consistent but not definitive of the diagnosis of interest.
• Were the methods for performing the test described in sufficient detail?
Yes. The diagnostic tests of interest are described in sufficient detail for you to replicate them in your clinical practice.
Thirty (17%) of the 172 participants had a posteroinferior labral lesion. The article presents the sensitivity, specificity, positive predictive value and negative predictive value of the two tests. You also use these results to calculate the positive and negative likelihood ratios (see Table 7.2).
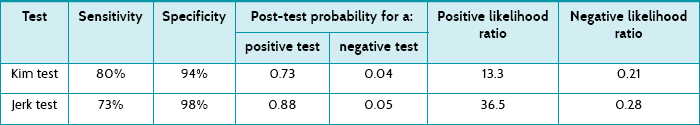
The post-test probability of the Kim test indicates that, on average, 73% of people with a positive test result actually have a posteroinferior labral lesion. The post-test probability of the jerk test indicates that, on average, 88% of people with a positive result actually have a posteroinferior labral lesion. Using the approximate guide values that were presented in Chapter 6, as both of the positive likelihood ratios are over 10 this indicates that these tests are very helpful for ruling in a posteroinferior labral lesion if it is present. Also, as the negative likelihood ratios are <0.5, this suggests that these tests are moderately helpful in ruling out a posteroinferior labral lesion.
How might we use this evidence to inform practice?
You are satisfied that the study is valid and the results are clinically useful. The study population was reasonably similar to the patient to whom you are considering applying the tests; although in your practice not all patients are severe enough to be scheduled for arthroscopy, so the prevalence of posteroinferior labral lesions is likely to be lower. The tests can be performed quickly and without requiring specialised equipment. However, before applying these tests, you should consider other diagnoses. The patient's description of the location of the pain suggests that the posteroinferior labrum is involved. Furthermore, the following tests are negative: the apprehension test (for detecting anterior shoulder instability), the impingement test (for detecting rotator cuff inflammation or impingement), the horizontal adduction test (for assessing acromioclavicular joint impingement) and tests for superior labral lesions as mentioned in the clinical scenario. In doing this, you confirm that a posteroinferior labral lesion is the diagnosis that you primarily suspect. You decide to apply the Kim test and the jerk test to your patient and use the results of these tests to guide the diagnosis and subsequent management of your patient.
Podiatry example
Clinical scenario
You are a podiatrist working in a community health centre, and you have just seen a 28-year-old male plumber with a diffuse scaling rash which covers most of his instep area, extending towards the digits of his right foot. It has been present for about 8 weeks, is itchy and there are some vesicles in the instep area. Several weeks ago he tried a topical steroid cream bought from the pharmacy. According to the patient, the rash did not really improve and he stopped applying the cream after a few days. You suspect a fungal infection, suggest an antifungal cream that is available over the counter and discuss foot hygiene with him. You wonder how accurate the diagnosis of tinea pedis (a fungal foot infection) is, based on clinical presentation.
In a person with suspected tinea pedis, how accurate is clinical examination compared with a ‘gold standard’ of microbiological confirmation in making a diagnosis?
Search terms and databases used to find the evidence
Database: PubMed—Clinical Queries (with ‘diagnosis category’ and ‘narrow scope’ selected).
Search terms: tinea OR (athletes foot)
This search retrieves 34 titles. Several studies look promising but, on reading through their abstracts, they are either comparing different laboratory methods for diagnosing mycoses or are case-control studies. You know that case-control studies can overestimate the accuracy of diagnostic tests, so you reject these. There is only one study that, on the basis of the abstract, appears to compare the clinical diagnosis of tinea pedis with laboratory methods, although the operating characteristics of the tests are not reported. This study investigated the diagnostic value of signs and symptoms compared with culture for diagnosing dermatomycosis in general practice. You consider whether this study, which appears to have looked at the diagnosis of fungal infection on any hairless part of the body, could be relevant to your clinical situation. As there do not appear to be any studies that have looked specifically at the clinical diagnosis of tinea pedis, you obtain the full text of this study.
Lousbergh D, Buntinx F, Piérard G. Diagnosing dermatomycosis in general practice. Fam Pract 1999;16:611–15.
Structured abstract (adapted from the above)
Design: This study compared clinical examination, microscopy of a potassium hydroxide preparation and cyanoacrylate surface skin scraping (CSSS) for detecting fungal infection of the skin, with culture as the reference standard.
Setting: General practices in Belgium.
Participants: 148 consecutive general practice patients with red scaly lesions of the glabrous (smooth, hairless) skin. Participants whose lesions had already been treated with antifungal therapy were excluded.
Description of tests: Scales were collected from the border of the lesion for microscopic testing using a potassium hydroxide preparation (KOH test) and culture. A strip biopsy (CSSS) was also made from the same site. Each participant's general practitioner also noted their diagnosis, based on each participant's characteristics, and local signs and symptoms.
Diagnostic standard: Culture of scales collected from the border of the lesion.
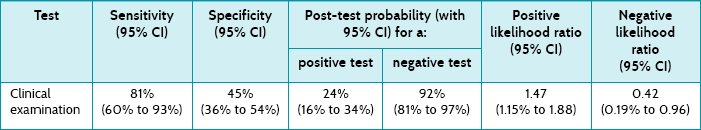
Main results: 18% of participants had a positive fungal culture. The sensitivity of the clinical diagnosis was 81% (95% confidence interval [CI] 60% to 93%) and the specificity was 45% (95% CI 36% to 54%). The likelihood ratio of clinical examination was 1.47 (95% CI 1.15 to 1.88) for a positive test result and 0.43 (95% CI 0.19 to 0.96) for a negative test result. The most accurate diagnostic method was CSSS, which had a likelihood ratio of 5.17 for a positive test result and 0.43 for a negative test result.
Conclusion: In people with red scaly (erythrosquamous skin) lesions, clinical diagnosis has low diagnostic accuracy for detecting dermatomycosis.
Is this evidence likely to be biased?
• Did all participants get the diagnostic test and the reference standard?
Yes. It appears that all participants received the index tests and the reference standard test. Culture of skin scrapings is the reference test used in this study.
• Could the results of the test of interest have been influenced by the results of the reference standard, or vice versa?
Cannot tell. The article does not clearly state that the index test results were interpreted blind to the results of the reference standard test. You think it is likely, however, that direct microscopy of the scales collected using the traditional method and the strip biopsy would have been performed before the results of the reference standard became available (cultures were examined after 4 weeks incubation) and that interpretation of the results of the KOH and CSSS tests would be without knowledge of the results of the culture. It also appears that signs and symptoms and general practitioner diagnosis were obtained before the results of the culture would have been available from the laboratory. You are also not sure whether the results of the culture were interpreted without knowledge of the results of the index tests.
• Is the disease status of the tested population clearly described?
No. There is no information that you can use to judge whether the spectrum of participants included in this study is similar to those you see in your practice. There is no information about the severity or the duration of the lesions or their location. Demographic and clinical features of the participants in this study are also not reported.
• Were the methods for performing the test described in sufficient detail?
Yes. The microscopy and culture of the samples was done by a laboratory which would need to adhere to testing standards. There is a reasonable description of how the CSSS was performed, but you think that more information about how the skin samples for the KOH test and culture were collected would be helpful. For example, what was used to collect the sample, how was it stored and was the lesion cleaned with alcohol before collection?
In this study, 26 cultures (18%) were considered positive. Table 7.3 presents the sensitivity, specificity, post-test probabilities and likelihood ratios for the clinical diagnosis of dermatomycosis. Table 7.3 shows that clinical examination has moderate sensitivity and low specificity for diagnosing dermatomycosis in general practice. The positive likelihood ratio of 1.47 is of little diagnostic value, suggesting only a minimal increase in the likelihood of dermatomycosis with a positive clinical diagnosis. The likelihood ratio for a negative test (0.42) suggests that it is of some value in ruling out fungal infection, representing a small decrease in the likelihood of disease when a negative clinical diagnosis is made.
How might we use this evidence to inform practice?
This study suggests that a positive clinical diagnosis of fungal infection is of little help in determining that a person has dermatomycosis. You have some doubts about the validity of the study, as the methods of the study were not reported in sufficient detail for you to accurately judge the level of bias that may be present. Your general reading in the area has also led you to question the validity of the gold-standard test (culture of skin scrapings) used in this study. For numerous reasons, including sampling error and errors in the culture process, fungal culture may not be the best method for establishing the presence or absence of dermatophyte infection. Use of an ‘imperfect’ reference standard may lead to the over- or underestimation of the diagnostic accuracy of clinical judgment.
You also have some concerns about how generalisable the study is to your situation, but you have been unable to find any other studies which answer your question. As this study was carried out in general practices, you think that the population is more likely to be similar to yours than if the study had recruited people from dermatology specialist clinics; however, with the limited information that is provided in the article, it is difficult to be sure about this. You reflect on your management of your patient and wonder if you should have referred him for further testing. Further testing would mean extra costs for the patient. The study that you just reviewed found that the KOH test and the CSSS test provide additional diagnostic value if a positive clinical diagnosis (from clinical examination) is made. You think that the probability that your patient has tinea is quite high and that suggesting antifungal treatment without further testing was a reasonable approach. The antifungal treatments that are available are reasonably cheap, easy to obtain and use and generally well tolerated. You advise your patient to see his general practitioner for further testing if the rash does not clear.
Medicine example
Clinical scenario
You are a general practitioner working with a primary care team. One of the issues for the team is dealing with the standard way of screening for renal disease (albuminuria) in diabetes of pregnancy, which is becoming a more frequent problem. The standard method is a 24-hour collection of urine from which the lab estimates the albumin excreted. However, this method is a problem because it is very inconvenient for women, who dislike having to collect it (especially a problem if they have to urinate while out of the home) and bring a large, bulky container to the clinic. Yet the information is important, as the presence of microalbuminuria predicts the rate of pre-eclampsia well in women with diabetes of pregnancy. The nurses in the practice consider that adherence to the 24-hour urine collections is not good, with missing urines leading to underestimates of albuminuria. At a staff meeting, one of the nurses asks ‘Isn’t the usual screening, which is just measuring the urine albumin-to-creatinine ratio, as we do for pregnant women without diabetes, just as good?’
In women with diabetes of pregnancy, how accurate is the urine albumin-to-creatinine ratio compared with the ‘gold standard’ of 24-hour excretion of albumin when screening for albuminuria?
Search terms and databases used to find the evidence
Database: PubMed—Clinical Queries (with ‘diagnosis category’ and ‘broad scope’ selected).
Search terms: albuminuria diabetes pregnancy
This search retrieved 40 titles. The 14th article listed was the most relevant to the question. The full text is available at: http://care.diabetesjournals.org/cgi/reprint/29/4/924
Justesen T, Petersen J, Ekbom P, et al. Albumin-to-creatinine ratio in random urine samples might replace 24-h urine collections in screening for micro- and macroalbuminuria in pregnant woman with type 1 diabetes. Diabetes Care 2006; 29:924–5.
Structured abstract (adapted from the above)
Study design and participants: All women with diabetes in pregnancy who were admitted to the hospital's obstetrics department before 14 weeks of gestation were invited to participate, and 119 were enrolled in the study. The urine samples were collected between gestational weeks 7 and 22.
Setting: A university hospital in Denmark.
Description of test: Two random samples of urine collected at different times were used to estimate the albumin-to-creatinine ratio. The cut-off point was >2.5 mg albumin/mmol of creatinine.
Diagnostic ‘gold standard’: 24-hour urine collections were tested for albumin. The cut-off point was >30 mg albumin/24 hours.
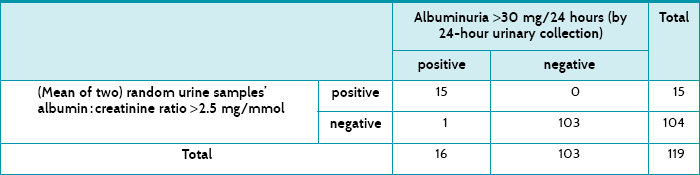
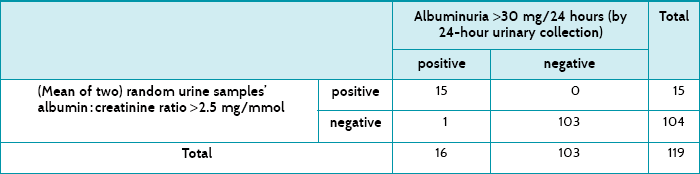
Main results: The albumin-to-creatinine ratio had a sensitivity of 94% and a specificity of 100%. Its post-test probability for a positive test was 100% and the post-test probability for a negative test was 1%.
Conclusion: The simpler and more convenient test (two samples of urine rather than the 24-hour collection) performs well.
Is the evidence likely to be biased?
• Did all participants get the diagnostic test and the reference standard?
Yes. The article describes that all eligible women used both tests.
• Could the results of the test of interest have been influenced by the results of the reference standard, or vice versa?
No. The tests were analysed by the laboratory and were presumably automated, so that one result could not have influenced the other.
• Is the disease status of the tested population clearly described?
Yes. The women were clearly defined. Their mean age was 30 (±4) years; they had had diabetes for a mean of 16 (±7) years; and their HbA1c (glycated haemoglobin level) was 7.6% (±1%).
• Were the methods for performing the test described in sufficient detail?
Yes. The cut-off points are described. Details of the biochemical tests are described in detail and this will enable people to replicate them.
Table 7.4 shows how the 119 women tested for both tests, and Table 7.5 shows a summary of the test accuracy for the test that used two random urine samples. These results show that testing for albuminuria had a high specificity, which means that there would be very few false positives. There were none in this sample, but the numbers were small enough to lend some uncertainty, which is expressed by the 95% confidence interval's lower value being less than 100%, that is, 94%. The sensitivity was also high at 94%, suggesting that few women with albuminuria would be missed—that is, few false negatives. In this study, there was only one. The post-test probability of the positive test refers to the chance of a woman having albuminuria after having two random samples of urine test positive, and is 100%. Similarly, the post-test probability of a negative urine test means the chance of a woman having albuminuria after a negative test is 1%.
The positive likelihood ratio is the ratio of the probability of the test being positive among women with albuminuria divided by that of those who do not have albuminuria. The negative likelihood ratio is the ratio of the probability of the test being negative among women who do not have albuminuria divided by that of those who do. In this study, the positive likelihood ratio is ∞, because dividing the sensitivity of 94% by [100 – specificity (100%)] would give an infinitely large number. In other words, the test is extremely good for ruling in the presence of albuminuria if it is present. Using the values presented in Chapter 6, the negative likelihood ratio of 0.06 indicates that it is a test that is extremely good for ruling out the presence of albuminuria.
How might we use this evidence to inform practice?
The simpler test seems to perform so well that your team decides to use it at the practice instead of the slightly more accurate one, judging that the extra convenience of the two random urine samples is much more likely to be adhered to than the cumbersome, embarrassing and inconvenient 24-hour urine collection gold standard.
Nursing example
Clinical scenario
You are a nurse who works in a medical ward in a large tertiary hospital. Many of the patients you care for are elderly people with a variety of health conditions. You regularly conduct assessments using the STRATIFY falls screening tool to gauge your patients' risk of falling. It is a five-item checklist, assessing previous falls, agitation, visual impairment, toileting frequency and transfer/mobility problems. Each item is scored 1 for ‘yes’ or 0 for ‘no’. A score of 2 or greater determines a high risk of falling. You wonder whether the STRATIFY falls scoring tool accurately predicts which patients are at risk of falling.
Among elderly hospitalised patients, is the STRATIFY falls screening tool an accurate predictor of falls risk?
Search terms and databases used to find the evidence
Database: PubMed—Clinical Queries (with ‘diagnosis category’ and ‘narrow scope’ selected).
Search terms: (STRATIFY tool) AND fall* AND hospital*
This search yields 14 hits. A number of the articles involve the STRATIFY tool and you choose the article that most closely matches your clinical question.
Webster J, Courtney M, Marsh N, et al. The STRATIFY tool and clinical judgment were poor predictors of falling in an acute hospital setting. J Clin Epidemiol 2010;63:109–13.
Structured abstract (adapted from the above)
Design: Prospective cohort study.
Setting: Large tertiary teaching hospital in Australia.
Participants: 788 patients over 65 years of age who were admitted to any hospital unit.
Description of test: The STRATIFY tool was used by researcher officers on all patients within 48 hours of admission.
Diagnostic ‘gold standard’: Information about occurrence of falls was extracted from weekly reports from the Patient Incident Reports database and/or a review of participants' medical chart on discharge.
Main results: 788 patients were screened, and the STRATIFY tool classified 335 (43%) as at risk of falling. Of these, 59 (18%) patients fell (sensitivity = 0.82, specificity = 0.61, positive predictive value = 0.18, negative predictive value = 0.96).
Conclusion: The STRATIFY tool is not useful for fall screening in acute hospital settings.
Is this evidence likely to be biased?
• Did all participants get the diagnostic test and the reference standard?
Yes. All patients who were recruited (consecutively) were assessed for falls risk using STRATIFY, and it was checked (by medical chart review at discharge and examination of weekly reports from the hospital's incidence database) whether a fall occurred for each participant.
• Could the results of the test of interest have been influenced by the results of the reference standard, or vice versa?
Cannot tell. It is possible that health professionals who recorded the falls may have known the results of the STRATIFY screening and this may have influenced their reporting of a fall. Although it is possible this might have happened in some cases, the presence or absence of a fall was probably usually unequivocal.
• Is the disease status of the tested population clearly described?
Yes. Participants are described by treating specialty, age group, length of stay and the ward they were in—surgical (41.5%), medical (41.2%), oncology (7%), extended-stay or geriatric assessment and rehabilitation unit (5.6%) and mental health unit (4.7%).
• Were the methods for performing the test described in sufficient detail?
Yes. The 5 items of the STRATIFY tool and the scoring of these are listed. Information was gathered from either patient notes or the nurse caring for the participant. The study reports that research officers were trained in the use of the tool, but no details about this training are provided.
Table 7.6 shows the actual numbers of participants who fell, and the number who were ‘at risk’ of falling (a score of ≥2) and those who were not according to the STRATIFY tool. The authors provide the sensitivity of the tool as 0.82. Using the data in Table 7.6, you can see how this was calculated using the formula: true positives/(true positives + false negatives) = 59/(59 + 13) = 0.82. The article provides a specificity of 0.61. This can be calculated as: true negatives/(true negatives + false positives) = 440/(440 + 276) = 0.61.
TABLE 7.6:
Number of patients who scored at risk of falling according to the stratify tool, and whether patients actually fell
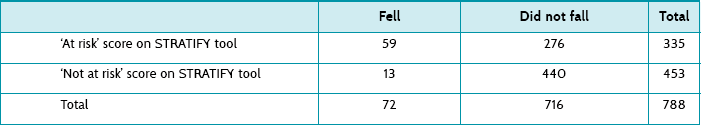
The sensitivity (0.82) is greater than the specificity (0.61). This means that a negative (or ‘not at risk of falling’) STRATIFY score (a score <2) will be reasonable at ruling out a fall (see the SnNOUT mnemonic, ‘if a test has a high sensitivity and the result is negative, it rules the disease out’, Chapter 6). Unfortunately, because of the low specificity, an ‘at risk’ STRATIFY score (that is, ≥2) will be poor at predicting a fall (see the SpPIN mnemonic–‘if a test has a high specificity and the result is positive, it rules the disease in’).
The post-test probability of a positive (‘at risk’) score predicting a fall was 0.18. This can be calculated as: true positives/(true positives + false positives) = 59/335 = 0.18 (or 18%). This means that for every 100 patients who were classified as ‘at risk’ of falling on the STRATIFY tool, only 18 actually did fall. The post-test probability for a negative (‘not at risk’) score was 0.03. This can be calculated as: false negatives/(true negatives + false negatives) = 13/453 = 0.03 (or 3%). This means that 3% of participants who were correctly classified as ‘not at risk’—that is, 3 out of every 100 who scored as not at risk on the STRATIFY tool—actually fell.
How might we use this evidence to inform practice?
A high falls risk score on a tool such as the STRATIFY is designed to prompt staff to utilise additional resources to prevent patient falls. Unfortunately, it is the post-test probability that is central to the decision to employ extra staff and resources to look after patients who might fall (we rarely wonder whether to reduce them because a patient is unlikely to fall!). It is difficult to see how we can use the STRATIFY tool usefully in acute hospital settings to accurately predict falls. Perhaps being aware of which patients have known modifiable falls risk factors such as poor mobility, certain medications (such as sedatives), continence problems and confusion and designing an intervention plan that is tailored for each patient is a more appropriate option than just calculating a score on screening tool. You decide to present the results of this appraisal at the next ward journal club so that your ward's approach to falls prevention can be discussed.
Medical imaging example
Clinical scenario
As the newly appointed chief radiographer of a metropolitan public hospital which has a large gastroenterology unit, you are relieved to learn that the department has recently upgraded much of its medical imaging equipment and now offers a full digital imaging service including a 64-slice computed tomography (CT) scanner. As you review the range of CT examinations that have been performed since its installation, you are surprised at the small number of referrals for CT colonography. This was in contrast to what occurred in your previous hospital, where some selected symptomatic and screening patients were offered CT colonography instead of colonoscopy. Your Director of Medical Imaging is sympathetic with your interest in ensuring that referring clinicians are made aware of the full diagnostic capabilities of the imaging modalities available to them. However, first he asks you to tell him what research evidence supports the broader use of CT colonography in preference to colonoscopy.
What are the sensitivity and specificity of CT colonography, compared with colonoscopy, in the detection of small polyps and lesions in symptomatic people?
Search terms and databases used to find the evidence
Database: PubMed—Clinical Queries (with ‘diagnosis category’ and ‘narrow scope’ selected).
Search terms: (computed tomography colonography) AND (polyps OR lesions) AND symptomatic
The search yields 13 articles. Based on the abstracts, three articles appear to be potentially relevant and one of these used a similar patient population to the one in your clinic, so you retrieve the full text of this article.
Roberts-Thomson IC, Tucker GR, Hewett PJ, et al. Single-center study comparing computed tomography colonography with conventional colonoscopy. World J Gastroenterol 2008;14:469–73. The article is available at: www.wjgnet.com/1007-9327/14/469.asp
Structured abstract (adapted from the above)
Design: A cohort study comparing sensitivity and specificity of CT colonography with colonoscopy.
Setting: A metropolitan teaching hospital in Australia.
Participants: 227 patients (mean age 60 years; 51% male) presenting with appropriate indications for colonoscopy. Exclusion criteria included inflammatory bowel disease and major coexisting medical disorders.
Description of tests: CT colonography was performed with a multi-slice helical CT scanner with 2 mm collimation that was reconstructed into intervals of 1.0–1.5 mm. Colonic distension was achieved by insufflation of carbon dioxide and the use of intravenous Buscopan (butylscopolamine). Participants were scanned in both supine and prone positions during a single breath-hold. Images were read in two-dimensional format with the use of a targeted three-dimensional format when necessary.
Diagnostic standard: Colonoscopy.
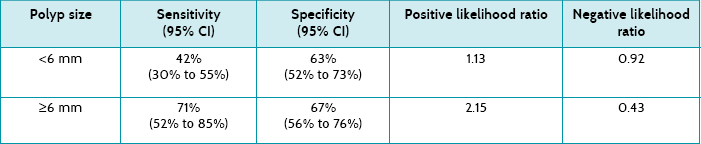
Main results: The sensitivity of CT colonography was 71% (95% CI 52% to 85%) for polyps ≥6 mm in size. Specificity was 67% (95% CI 56% to 76%) for polyps ≥6 mm in size.
Conclusion: CT colonography is well accepted by patients and carries a low risk of adverse effects. However, it is not sensitive enough for widespread application in symptomatic patients.
Is this evidence likely to be biased?
• Did all participants get the diagnostic test and the reference standard?
Yes. All participants received the CT colonography and the colonoscopy. Both tests were performed on the same day. Of the 227 patients recruited, 202 were successfully evaluated with both procedures. Twenty-five (11%) of participants were excluded from analysis participation due to incomplete colonoscopy or poor bowel preparation, both of which are factors that cannot be predicted.
• Could the results of the test of interest have been influenced by the results of the reference standard, or vice versa?
No. Colonoscopists were blinded to the CT colonography results prior to the colonoscopy but were segmentally unblinded during the procedure (that is, CT colonography results of the right colon were made available after the colonoscopy of the right colon had been done, and then the same occurred for the left colon). This ensured that all findings reported by CT colonography could be verified during the colonoscopy in real time and any discrepancies clarified by the colonoscopy while the participant was sedated.
• Is the disease status of the tested population clearly described?
Yes. The article states that participants were symptomatic patients with appropriate indications for colonoscopy such as rectal bleeding, abdominal pain and/or change in bowel habits. Some participants also had a family history of colorectal cancer, previous colonic polyps or recent positive faecal occult blood test.
• Were the methods for performing the test described in sufficient detail?
Partially. The procedure for each of the tests was described in reasonable detail. The type of bowel preparation for the CT colonography was not standardised and was determined by the colonoscopist, with little detail provided about this.
Table 7.7 shows the sensitivity, specificity and positive and negative likelihood ratios of CT colonography when analysed according to polyp size. These results show that CT colonography had low to moderate sensitivity and specificity, although this improved when the polyps were larger (≥6 mm). According to the positive likelihood ratio, only when polyps are ≥6 mm is CT colonography likely to be of some diagnostic value, suggesting a minimal increase in the likelihood of ruling in the presence of polyps if positive. Similarly, the negative likelihood ratios indicate that only when polyps are ≥6 mm is CT colonography likely to be able to help rule out polyps when negative.
How might we use this evidence to inform practice?
The study participants were selected from patients who were referred for a colonoscopy on the basis of symptoms suggestive of colonic pathology, and are well matched with the types of patients that you encounter in your clinic in terms of age and indications for colonoscopy. Patients in which CT colonography might be indicated include elderly people who are contraindicated for colonoscopy and those with known bowel obstruction, which it would overcome. However, the results are dependent on polyp size, which limits the usefulness of CT colonography as a screening tool for patients with small (<6 mm) lesions. Given that the sensitivity and specificity of CT colonography are not yet sufficient to implement it on a routine basis, you propose to recommend its use only among suitable patients who could benefit from this procedure. Relative costs and complications of the procedures must also be considered.
Paramedicine example
Clinical scenario
You are a paramedic at a planning meeting of your Emergency Medical Service. There is a recurring issue on the agenda: do we have to immobilise the cervical spines of all patients—even those who do not have neck pain, are reasonably conscious, do not have distracting injuries and are not intoxicated—with severe trauma where there is a possible mechanism for spinal injury? Your impression is that large numbers of patients are immobilised although very few ever have a fractured cervical spine, which potentially delays the patient getting to a hospital emergency department. Computed tomography (CT) scans have replaced plain X-rays for detecting cervical spine fractures, as they have better sensitivity. You know that some pre-hospital Emergency Medical Services use a decision-rule based on the National Emergency X-Radiography Utilisation Study (NEXUS) criteria to decide whether trauma patients should be spinally immobilised prior to transport.
Can patients with blunt trauma meeting trauma team activation criteria have cervical spine fracture excluded by using NEXUS criteria, against CT scan as a gold standard?
Search terms and databases used to find the evidence
Database: PubMed—Clinical Queries (with ‘diagnosis category’ and ‘narrow scope’ selected).
Search terms: (cervical spine rule) AND ((computed tomography) OR CT) AND (blunt trauma)
The search identified 34 articles. Following a review of the titles and abstracts, one was considered most relevant to the clinical question and chosen for appraisal.
Duane T, Mayglothling J, Wilson S, et al. National Emergency X-Radiography Utilization Study criteria is inadequate to rule out fracture after significant blunt trauma compared with computed tomography. J Trauma 2011;70(4):829–31.
Structured abstract (adapted from the above)
Study design: Prospective cohort study.
Setting: Trauma patients transported to a single Level 1 trauma centre in Richmond, Virginia, USA.
Participants: Patients (>16 years of age) who suffered blunt trauma.
Description of test: The NEXUS criteria assessment of the patient is: (1) conscious and alert (Glasgow Coma Scale [GCS] of 15); (2) no evidence of intoxication; (3) no clinically distracting injury (that is, pain from another injury site); (4) no mid-line cervical spine tenderness or pain; and (5) no neurological deficits.
Diagnostic standard: Routine CT scan (2-mm-thick axial cuts at 2 mm increments with sagittal multi-planar reformatted images, from the base of the skull to the level of the third thoracic vertebra).
Main results: Out of 1361 eligible patients, 64 had a cervical spine fracture on CT scanning. Patients in the fracture group were more likely to be older, white, involved in a motor vehicle accident and initially have a lower GCS and blood pressure. For patients who had a GCS of 15, no other distracting injury and were not intoxicated, the NEXUS criteria had a sensitivity of 59%, specificity 80%, positive predictive value of 13% and negative predictive value of 97.5%. (The article presents results for other subsets of patients, but these subsets are not relevant to your scenario.)
Conclusion: The NEXUS criteria are inaccurate at diagnosing cervical spine fractures in patients who meet trauma team activation criteria, and CT scans are necessary.
Is this evidence likely to be biased?
• Did all participants get the diagnostic test and the reference standard?
Yes. All participants received the diagnostic test (NEXUS) and the reference standard (CT scan).
• Could the results of the test of interest have been influenced by the results of the reference standard, or vice versa?
No. First, the NEXUS test (diagnostic test) was conducted prior to the reference standard (CT scan); and second, it seems unlikely that the CT imaging and interpretation would have been influenced by the NEXUS result.
• Is the disease status of the tested population clearly described?
Yes. Patients who had sustained blunt trauma and met the trauma team activation criteria were assessed on arrival at the emergency department of one Level 1 trauma centre. The number who had a fractured cervical vertebra is also reported.
• Were the methods for performing the test described in sufficient detail?
Yes. The NEXUS criteria were stated clearly. However, there is an assumption that we know how to establish a patient's conscious state (using the Glasgow Coma Scale) and assess whether the patient has any neurological deficit, although this is reasonable.
The study reported the sensitivity, specificity and negative and positive predictive values (see above in structured abstract) for the subset of patients who match the ones that triggered your clinical question. Table 7.8 shows the number of patients who met the NEXUS criteria and their results following a CT scan. It shows that 26 patients (out of 64) with cervical fractures were missed by NEXUS criteria screening. Of these, most (19; 73%) required intervention.
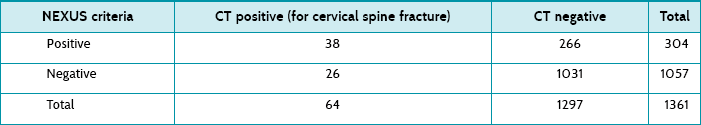
The post-test probability of a positive test (that is, a cervical spine fracture if there is a positive clinical examination based on the NEXUS criteria) was 0.125 (or 0.13 if rounded). This can be calculated as: true positives/(true positives + false positives) = 38/(38 + 266) = 0.13 (or 13%). This means that for every 100 patients who met the NEXUS criteria, 13 actually had a cervical spine fracture. The post-test probability for a negative test (that is, not meeting the NEXUS criteria to have only clinical examination) was 0.02. This can be calculated as: false negatives/(true negatives + false negatives) = 26/1057 = 0.02 (or 2%). This means that 2 out of every 100 patients who did not meet the NEXUS criteria had a cervical spine fracture.
How might we use this evidence to inform practice?
This study suggests that the NEXUS test is not sensitive enough to rule out cervical spine factures, and therefore cannot be used in this setting to avoid immobilising cervical spines. At your Emergency Service meeting, you decide that you must continue the current procedure of immobilising the cervical spine of patients who have sustained blunt trauma which might have resulted in a fracture, even if the patient has no pain in the neck, is alert, is not intoxicated and does not have a distracting injury.