Evidence about diagnosis
After reading this chapter, you should be able to:
• Generate a structured clinical question about diagnosis for a clinical scenario
• Appraise the validity of diagnostic evidence
• Understand how to interpret the results from diagnostic studies and calculate additional results (such as positive and negative predictive values and likelihood ratios) where possible
• Describe how diagnostic evidence can be used to inform practice
Let us consider a clinical scenario that will be useful for illustrating the concepts of evidence about diagnosis that are the focus of this chapter.
Diagnosis is essential in all areas of clinical practice and includes the history, physical examination, assessment tools, pathology and imaging tests that may be performed. Health professionals need to understand how each of these elements contributes to the final diagnosis, whether that be the diagnostic label that we use for patients or the various categories and stratifications within the diagnostic label that we use to assist with decisions about management. This chapter will address the process of using diagnostic evidence to assess the clinical examination of the knee. We will start by defining the components of a structured clinical question about diagnosis. Then we will see how to appraise the evidence to determine its likely validity. Subsequent sections of the chapter will review how to understand the results of a diagnostic study and how to use the evidence to inform practice.
Physical signs are a form of diagnostic test. They help health professionals to decide whether a client has a disease or not. Like all diagnostic tests, they can be measured against a ‘gold-standard’ test (a test that is known to be highly accurate for the disease being considered) to measure how well they rule in or rule out a diagnosis. Various measures may be used to estimate the accuracy of the test, such as the sensitivity and specificity or the positive and negative likelihood ratios. We will explain these measures later in the chapter.
Study designs that can be used for answering questions about diagnosis
Studies of diagnostic tests generally measure how accurately a test can detect the presence or absence of a disease by comparing the test with a reference test or ‘gold standard’. As we saw in Chapter 2, the best type of study to estimate diagnostic accuracy is a ‘consecutive cohort study’. This is a study that compares the test of interest with a gold-standard test in every client who presents with a similar type of clinical problem in a particular setting over a particular time period. As we saw in Chapter 2, systematic reviews are even better than an individual study or trying to read all the studies that are available. Systematic reviews will be discussed further in Chapter 12.
Other study designs are also possible, such as a cross-sectional study of a convenience sample of patients who have had both the test of interest and the reference test, or studies that compare the test results of the index test and the reference test in patients who are known to have the disease of interest (cases) versus the test results in patients who are known not to have the disease of interest (controls). As these studies do not enrol patients with the whole spectrum of disease that may be seen in clinical practice (for example, they may only include patients who have a ‘mild’ form of the disease of interest), these study types can lead to biased estimates of diagnostic accuracy. Case-control studies, because they enrol patients who clearly have or do not have the disease, are known to overestimate the diagnostic accuracy of a test.1
Diagnostic accuracy studies are often more difficult to find than studies assessing the effectiveness of interventions. As yet, there is no publication type that specifically indexes this type of study in Medline or the other major databases, as there is for randomised controlled trials. A possible approach to searching for diagnostic studies is:
1. In PubMed Clinical Queries, choose the ‘diagnosis’ and ‘narrow scope’ options.
2. Type in the name of the test. If the test is used for more than one condition, you may also need to use the name of the target disorder in your search.
3. If you do not find a relevant study, try a sensitive search.
4. If you find too many studies, use the name of the target disorder or the ‘gold-standard’ test in your search.
Clinical scenario (continued)
Structuring the clinical question
As with clinical questions about the effectiveness of interventions, we can define the clinical question for diagnostic questions using the PICO format that was outlined in Chapter 2. There are often several possible questions than can be asked, so it is worth spending a few minutes to consider the question you wish to ask more carefully.
In the case of the 24-year-old footballer described at the beginning of this chapter, you may be considering a meniscal injury, an injury to the anterior cruciate ligament or a soft-tissue injury. You may want to define the population in the question broadly, such as in ‘all people’, or more narrowly, such as in ‘adults with a knee injury’. How narrowly you define the question may depend on whether you think that the test may perform differently in different sub-groups of patients.
The disorders of meniscal injuries and anterior cruciate ligament injuries are the possible outcomes for the diagnostic test, and in this example we will focus on the physical examination for determining the presence of an anterior cruciate ligament injury. For anterior cruciate injuries, tests include the anterior drawer test, Lachman's test and the pivot shift test2 (see Figure 6.1). Each of these parts of the physical examination of the knee can be the index tests.
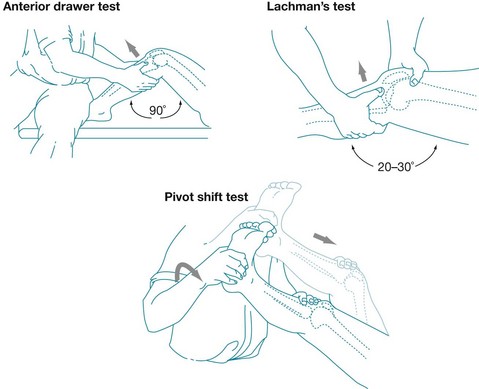
Figure 6.1 Description and illustration of the anterior drawer test, Lachman's test and the pivot shift test.
Anterior drawer test: Place patient supine, flex the hip to 45° and the knee to 90°. Sit on the dorsum of the foot, wrap your hands around the hamstrings (ensuring that these muscles are relaxed), then pull and push the proximal part of the leg, testing the movement of the tibia on the femur. Do these manoeuvres in three positions of tibial rotation: neutral, 30° externally and 30° internally rotated. A normal test result is no more than 6–8 mm of laxity.
Lachman's test: Place the patient supine on examining table, leg at the examiner's side, slightly externally rotated and flexed (20–30°). Stabilise the femur with one hand and apply pressure to the back of the knee with the other hand, with the thumb of the hand exerting pressure placed on the joint line. A positive test result is movement of the knee with a soft or mushy endpoint.
Pivot shift test: Fully extend the knee and rotate the foot internally. Apply a valgus stress while progressively flexing the knee, watching and feeling for translation of the tibia on the femur. Adapted with permission from Jackson J et al, Evaluation of acute knee pain in primary care, Annals of Internal Medicine, 2003.2
The comparator test should be the most accurate method of diagnosing these conditions. In general, the most accurate test for diagnosing intra-articular damage to the knee is arthroscopy. However, magnetic resonance imaging (MRI) is also a highly accurate test for meniscal and ligament injuries of the knee and may be used in some studies because it is less invasive than surgery. Unless patients have a reasonably high probability of the disease or are considering surgery, it is difficult to justify performing surgery in patients to verify the results of physical examination, so many studies will not have used the results of arthroscopy or will only have included patients who are being scheduled for surgery. For this clinical question, both forms of investigation can be considered as the gold-standard test.
Is this evidence likely to be biased?
As we saw in Chapter 4, for studies about the effectiveness of interventions it is important to critically appraise the diagnostic test studies that you find to determine whether the study is adequate to inform your clinical practice. As with the other types of study designs, the main elements to consider are: (1) internal validity (in particular, the risk of bias); (2) the results (the estimates of diagnostic accuracy); and (3) whether or how the evidence might be applicable to your client or clinical practice.
We will use the Critical Appraisal Skills Program (CASP) checklist for appraising a diagnostic test study to explain how to assess the likelihood of bias in this type of study. The key questions to ask when appraising the validity of a diagnostic study are summarised in Box 6.1. The checklist begins with two simple screening criteria that, if not met, indicate that the article is unlikely to be helpful and that further assessment of potential bias is probably unwarranted. Also, you learnt in Chapter 4 that there is a standard for the reporting of randomised controlled trials (the CONSORT statement). There is also one for diagnostic accuracy studies. It is known as the STARD (STAndards for the Reporting of Diagnostic accuracy studies) statement. Further details are available at: www.STARD-statement.org.
Was there a clear question for the study to address?
The first criterion on the checklist is whether there was a clear question for the study to address. For diagnostic evidence, the study should clearly define the population, the index and comparator tests, the setting and the outcomes considered.
Is the comparison with an appropriate reference standard?
The second criterion is whether there was a comparison with an appropriate reference standard. The reference standard should, in general, be the most accurate method available to diagnose the target disorder(s). If the reference test used in the study is not 100% accurate, the diagnostic accuracy of the index test may be either over- or underestimated.
Sometimes, the reference standard will be a combination of a number of tests. For example, a test for diagnosing heart failure may be tested against the combined results of clinical examination and echocardiography. If the index test is included in the reference standard (this is called incorporation bias), the diagnostic accuracy of the test is likely to be overestimated.
Did all participants get the diagnostic test and the reference standard?
As we explained earlier in this chapter, the best type of study to estimate diagnostic accuracy is a ‘consecutive cohort’ of patients. That is, every client who presents with a similar type of clinical problem in a particular setting over a particular time period receives both tests and the results are compared. In some studies, not all those who receive the test that is being evaluated receive the reference test, or only those who receive both tests are included in the study. This is particularly common when the reference test is harmful or invasive. It results in a biased spectrum of patients. Receiving the gold-standard test generally overestimates the sensitivity and underestimates the specificity of the test. This type of bias is known as verification bias. Sensitivity and specificity will be explained in the results section of this chapter.
Sometimes verification bias is unavoidable. For example, in the clinical question we are considering (the diagnosis of anterior cruciate ligament tears), the gold-standard test is arthroscopy. However, as we explained earlier, it would be unethical to perform arthroscopy in patients where no abnormality is suspected after clinical examination (the index test). Therefore, it is not possible to perform the gold-standard test in all patients. In these cases, it may be necessary to use two gold standards, such as arthroscopy for patients with an abnormality on clinical testing and clinical follow-up for patients who initially show no abnormality on clinical testing.
A common form of verification bias occurs when the authors of a study use client records to select patients to include in the study who have had both the index test and the reference test. For example, in this study it appears that patients were included in the study if they attended an orthopaedic clinic and had both a physical examination and an MRI scan. Patients who had both a suspected anterior cruciate ligament injury and an MRI scan are likely to be a different spectrum of patients to all patients who present to an orthopaedic clinic with a suspected anterior cruciate ligament injury. When client records are used to select patients for a study, the study participants are likely to be different from the type of patients who present to a clinic with a particular clinical problem, and are therefore likely to give a biased estimate of the accuracy of the diagnostic test.
Could the results of the test of interest have been influenced by the results of the reference standard, or vice versa?
The results of the index test and the reference test should each be decided without knowledge of the results of the other test. That is, the person who interprets the test should be blinded to the results of the other test. Knowledge of one test result may bias the reading of the other, particularly where the reading is subjective, such as physical examination or the interpretation of imaging results.
Was there a clear description of the disease status of the tested population?
The test should be investigated in a clinical setting that is as close as possible to the clinical setting in which it will be used. The spectrum of patients included in the study can affect the sensitivity or specificity or both, and therefore may affect the observed accuracy of the test. For example, if the study is conducted in a tertiary referral centre (as compared with a general practitioner's office, for example), patients may have more-severe symptoms and this may affect the sensitivity and/or the specificity of the physical examination.
Was there sufficient description of the methods for performing the test?
Both the index test and the reference standard test should be described in sufficient detail so that it is possible to: (1) reproduce the test; and (2) determine whether the test was performed adequately and is similar to the test being conducted in your own clinical setting.
If you have got to this point and determined that the article about diagnosis that you have been appraising is valid, you then proceed to looking at the importance and applicability of the results.
What are the results?
Sensitivity and specificity
There are a number of ways in which the results of diagnostic accuracy studies may be reported. Diagnostic studies often report sensitivity and specificity results. The most useful results for you as a health professional are the post-test probabilities of a positive and negative test, which we will explain in the next section. However, as many articles report sensitivity and specificity results it can be useful to have an understanding of them.
• The sensitivity of a test measures how well a test performs in detecting a disease in people who have the disease. It is the probability that a test is positive in people who have a disease (true positives ÷ [true positives + false negatives]). Using data from our clinical scenario article,4 this is represented graphically in Figure 6.2.
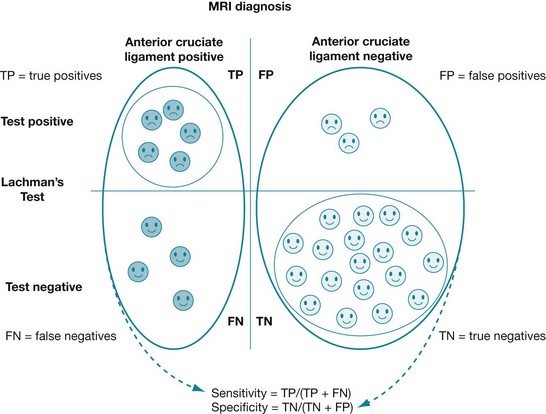
• The specificity of a test measures how well a test performs in determining that disease is not present in people who do not have the disease. It is the probability that a test is negative in people who do not have the disease (true negatives ÷ [true negatives + false positives]). Using data from our clinical scenario article,4 this is represented graphically in Figure 6.2.
Box 6.2 shows how to calculate sensitivity and specificity. It is difficult to convert sensitivity and specificity to the probability that the client does or does not have the disease. It is therefore difficult to apply these values clinically, which is why it is important to understand the concepts of positive and negative predictive values. These are explained in the following section.
Box 6.2 Measuring diagnostic accuracy
sensitivity and specificity
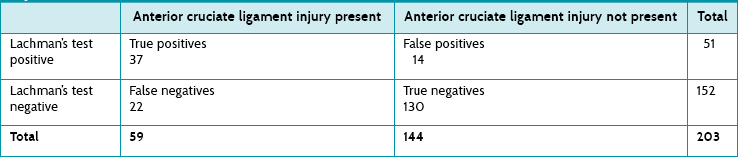
This box uses data (see Table 6.1) about the diagnostic accuracy of Lachman's test for detecting anterior cruciate ligament injuries of the knee from our clinical scenario article4 as an example.
TABLE 6.1:
The sensitivity and specificity of lachman's test for detecting anterior cruciate ligament injury as reported by boeree and ackroyd4
Post-test probabilities of a positive and a negative test
These are the most useful way of interpreting results for you as a health professional:
• The post-test probability of a positive test (also known as positive predictive value) tells you the probability that a patient has disease if he or she has a positive test result. The closer that this number is to 100%, the better the test is at ruling in disease. Its calculation (true positives ÷ [true positives + false positives]) is represented graphically in Figure 6.3, using data from our clinical scenario article.4
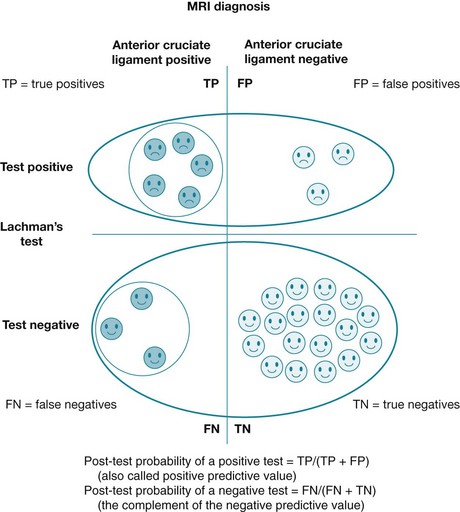
• Conversely, the post-test probability of a negative test (which is the complement of the negative predictive value) tells you the probability that a client has the disease if he or she has a negative test result. The closer that this number is to 0%, the better the test is at ruling out disease. Its calculation (false negatives ÷ [false negatives + true negatives]) is represented graphically in Figure 6.3, using data from our clinical scenario article.4 The closer that a negative predictive value approaches 100%, the better the test is at ruling out disease. Its calculation is true negatives ÷ (false negatives + true negatives).
The difficulty with post-test probabilities (positive and negative predictive values) is that you need to know the pre-test probability of disease (that is, the likelihood of having the disease before having the test) in order to be able to calculate them. This is different to sensitivity and specificity results, which do not change with the pre-test probability (prevalence) of disease. When the percentage of people in the sample who have the disease increases, the post-test probability of both positive and negative tests will increase.6 So, if you use post-test probabilities to guide your decision about whether to use a diagnostic test or not, this means it is particularly important that you check the spectrum of patients that were included in the diagnostic accuracy study to ensure that they match the sort of patients that you see in your practice. Box 6.3 explains how to calculate post-test probabilities of positive and negative test results, as well as the pre-test probability of disease.
Box 6.3 Measuring diagnostic accuracy
post-test probabilities of a positive and a negative test result
As a health professional, what you want to know is that if you receive a positive or a negative test result for a client, what is the probability that he or she has the disease? These values are the post-test probabilities of a positive and a negative test. However, most diagnostic accuracy studies report the sensitivity and the specificity of a diagnostic test. The probability of a disease after a positive or a negative test result requires further calculation, and also needs us to consider the prevalence (also called the pre-test probability) of the disease.
Using some of the data from our clinical scenario article4 as an example:
Lachman's test had a sensitivity of 63% and a specificity of 90%. The study reports that 59 of the 203 participants included in the study had an anterior cruciate ligament injury. The prevalence or pre-test probability in this study is theref ore 59 ÷ 203 = 29%.


To help people remember whether tests rule in or rule out disease, the following mnemonics may be helpful:
• SpPIn (Specificity-Positive-In) = if a test has a high specificity and the result is positive, it rules the disease in.
• SnNOut (Sensitivity-Negative-Out) = if a test has a high sensitivity and the result is negative, it rules the disease out.
Note that this is a generalisation, and that the post-test probability depends on both sensitivity and specificity and on the prevalence of the disease.7 Even though Lachman's test has a relatively high specificity, it is not a good example of a SpPIn. A positive test result is only a moderate predictor of the disease being present.
Note: When the pre-test probability is low, for example in screening programs, even tests with high sensitivity and specificity will have a low positive predictive value; that is, most positive test results will be false positives.
Positive and negative likelihood ratios
Another pair of values that can be used to report results is the positive/negative likelihood ratios. Box 6.4 shows how likelihood ratios can be calculated. These results have the advantage of being relatively stable across different clinical settings, but also give an indication of how well the test rules in or rules out disease (refer to Box 6.4).
Box 6.4 Measuring diagnostic accuracy
positive and negative likelihood ratios
The positive likelihood ratio is the probability that a test is positive in people with the disease divided by the probability that the test is positive in people without the disease.
The negative likelihood ratio is the probability that a test is negative in people with the disease divided by the probability that the test is negative in people without the disease.
Using some of the data from our chosen article4 as an example:


If the article only reports the sensitivity and specificity of the tests, another way to calculate likelihood ratios is:


When interpreting likelihood ratios, as a rough guide:
• A positive likelihood ratio > 2 indicates a test that helps rule in disease.
• A positive likelihood ratio > 10 is an extremely good test for ruling in disease.
• A negative likelihood ratio of < 0.5 indicates a test that helps rule out disease.
• A negative likelihood ratio of < 0.1 is an extremely good test for ruling out disease.
Clinical scenario (continued)
What are the results?
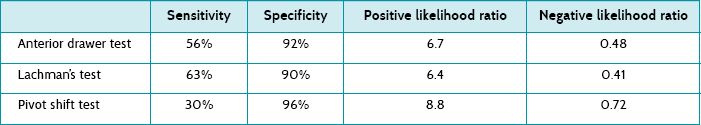
A summary of the pooled results for each of the physical examination tests in our chosen article is presented in Table 6.2 (see Box 6.4 for how to interpret these results). Using the positive likelihood ratios, we can see that all three of the physical examination tests for anterior cruciate ligament injury are moderately good at detecting an injury if present. Looking at the negative likelihood ratios, we can see that if Lachman's test or the anterior drawer sign is negative, it is moderately helpful for ruling an anterior cruciate ligament injury out, but a negative pivot shift test does not rule out this injury.
TABLE 6.2:
Estimates of the diagnostic accuracy of the anterior drawer test, lachman's test and pivot shift test for the diagnosis of anterior cruciate ligament injuries4
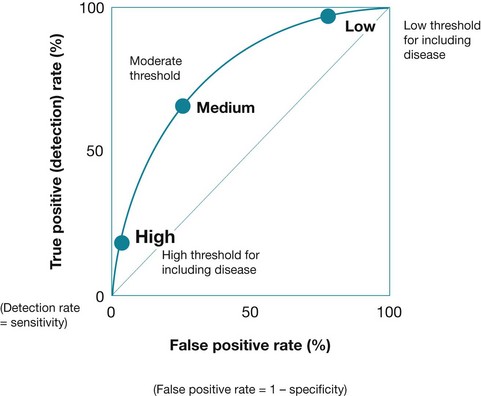
How changes in the cut-off affect test performance
For many diseases, there is no clear threshold between the presence and absence of a disease. For example, blood pressure and blood glucose levels exist on a spectrum, and the cut-offs that have been chosen to define hypertension or diabetes are, to some extent, arbitrary. In cases where the cut-off for normal/abnormal levels can be raised or lowered, this will affect the test characteristics, and the choice of cut-off will involve a trade-off between the sensitivity and the specificity of the test. If higher values indicate more-abnormal test results, as the cut-off is raised then the sensitivity will increase and the specificity will decrease. A receiver operating characteristic (ROC) curve (see Figure 6.4) plots this trade-off between sensitivity and specificity with changes in the cut-off. The curve demonstrates the trade-off between sensitivity and specificity of a test as the cut-off point changes.
How can we use this evidence to inform practice?
As part of our judgment about whether to use the results of this study in our own practice, we need to think about how likely it is that the test performs in a similar way in our own clinical setting to the diagnostic accuracy in this study.8 We need to consider:
1. Is the spectrum of patients in the diagnostic study similar to the spectrum of patients in the clinical setting in which you are working?
2. Is the prevalence of disease in the diagnostic study similar to the prevalence in the clinical setting in which you are working?
3. Is the method for using the index test similar in the diagnostic study and the clinical setting in which you are working? This includes both the method for performing the index test and the person performing the test. In the clinical scenario chosen, the physical examination was performed by orthopaedic consultants and registrars. Will this alter the diagnostic accuracy of the physical examination?
4. Is the method for using the reference test similar in the diagnostic study and the clinical setting in which you are working?
5. Is the study defining the target disorder in the same way as in your own clinical setting?
Other types of test studies
So far, we have considered diagnostic test accuracy. These results measure how valid a test is. Not all test studies measure diagnostic accuracy. Some studies measure the reliability of a test; that is, whether you get the same test result when the test is done by different health professionals or by the same health professional at different times. The first are usually called studies of inter-observer reliability and the latter studies of intra-observer reliability.9 The agreement between different operators of the test (or different groups of operators) can be assessed using measures of agreement such as Cohen's kappa scores. These scores measure the agreement that is seen beyond that expected by chance.
Other clinical tests are used for assessing or monitoring patients. For example, assessments of ability to perform self-care skills, assessments of pain, or haemoglobin A1c (HbA1c) for monitoring glycaemic control in patients with diabetes. These types of tests can be used for many reasons, such as assessing a patient's progress, predicting the likelihood of needing further treatment and/or monitoring a patient's response to intervention and whether adjustments to intervention are needed.
Tests that are used for monitoring need to be reliable, and they are evaluated using measures of reliability such as those described above or the coefficient of variation. Sometimes in clinical practice we use the average of several measures in order to improve the reliability of a test. For example, by taking an average of several blood pressure measurements, we reduce the random error that would be seen in a single measurement. When tests are used to monitor a patient, the most appropriate study design is a randomised controlled trial. In these clinical settings, the test is being used as part of a strategy to intervene in the patient's clinical course. Therefore, these tests should be evaluated in the same way as other interventions (see Chapter 4), and preferably by considering studies that used outcomes that are clinically relevant to the patient.10
References
1. Rutjes, A, Reitsma, J, Di Nisio, M, et al. Evidence of bias and variation in diagnostic accuracy studies. CMAJ. 2006; 1744:469–476.
2. Jackson, J, O'Malley, P, Kroenke, K. Evaluation of acute knee pain in primary care. Ann Intern Med. 2003; 139:575–588.
3. Scholten, R, Opstelten, W, van der Plas, C, et al. Accuracy of physical diagnostic tests for assessing ruptures of the anterior cruciate ligament: a meta-analysis. J Fam Pract. 2003; 52:689–694.
4. Boeree, N, Ackroyd, C. Assessment of the menisci and cruciate ligaments: an audit of clinical practice. Injury. 1991; 22:291–294.
5. Boeree, N, Watkinson, A, Ackroyd, C, et al. Magnetic resonance imaging of meniscal and cruciate injuries of the knee. J Bone Joint Surg Br. 1991; 73:452–457.
6. Peat, J, Barton, B, Elliott, E. Statistics workbook for evidence-based healthcare. Chichester: Wiley-Blackwell; 2008.
7. Pewsner, D, Battaglia, M, Minder, C, et al. Ruling a diagnosis in or out with ‘SpPIn’ and ‘SnNOut’: a note of caution. BMJ. 2004; 329:209–213.
8. Deeks, J. Using evaluations of diagnostic tests: understanding their limitations and making the most of available evidence. Ann Oncol. 1999; 10:761–768.
9. Byrt, T, Bishop, J, Carlin, J. Bias, prevalence and kappa. J Clin Epidemiol. 1993; 46:423–429.
10. Glasziou, P, Irwig, L, Mant, D. Monitoring in chronic disease: a rational approach. BMJ. 2005; 330(7492):644–648.