Chapter 15 Emergency Department Applications of Musculoskeletal Magnetic Resonance Imaging: An Evidence-Based Assessment
Magnetic resonance imaging (MRI) is a relatively rarely used modality in the emergency department, most often applied to acute neurologic conditions such as stroke and spinal cord injury.1 MRI offers outstanding soft-tissue contrast and can be used to evaluate acute musculoskeletal complaints when other imaging modalities do not provide the diagnosis. Most musculoskeletal MRI can be deferred to the outpatient setting, but certain high-risk musculoskeletal complaints may warrant emergent imaging. In this chapter, we review basic principles and technical features of MRI relevant to its emergency department use, exploring its potential benefits and limitations. We discuss the cost and time required for MRI, which are significant barriers to its emergency department use. We examine the scientific evidence for the diagnostic accuracy of MRI, comparing the performance of MRI to other imaging modalities, including computed tomography (CT) and nuclear medicine. We review the role of MRI in the diagnosis of occult hip and scaphoid fractures and spinal epidural abscess, which remain clinically challenging. Because of the expense and limited availability of MRI, we review alternative imaging strategies when MRI cannot be readily performed. Finally, we discuss the role of gadolinium contrast agents and the risks associated with their use, and we consider contraindications to MRI.
Emergency Department Utilization of Magnetic Resonance Imaging
MRI availability in emergency departments is limited, with poor night and weekend access even in large academic medical centers. Rankey et al.1 described routine availability of MRI at a single academic center as 7 AM to 11 PM Monday through Friday and 7 AM to 3 PM Saturdays, with no routine MRI availability on Sundays or holidays. In their study, only 15.5% of emergency department MRIs were performed “after hours,” a disproportionately small number given that the after-hours period represented more than 47% of the hours in a week. A survey of radiologists found that MRI scanners are physically present in only 3% of U.S. emergency departments, though they may be available in other areas of the hospital.2 National data on emergency department MRI utilization rates is lacking, but a retrospective review of emergency department utilization at a single tertiary care academic center from 2000 to 2005 showed a 390% increase. Most of this increase was the result of MRI and magnetic resonance angiography (MRA) examinations of the head and spine, which constituted 98% of all MRI examinations. For lumbar spine MRI, suspected osteomyelitis or discitis was one of the top five indications, accounting for 6.4% of lumbar spine examinations. Lower extremity MRI was performed only 23 times during the study period, constituting 1% of total examinations.1 Dominguez et al. found that 11% of patients with suspected hip fracture and negative x-rays of the hip underwent hip MRI as part of their emergency department evaluation at the Mayo Clinic (Phoenix, Arizona).3
Costs of Musculoskeletal Magnetic Resonance Imaging
The cost of emergency MRI varies considerably, depending on the hospital charge, radiologist fee, and negotiated fees through insurance carriers. MRI contrast materials are also expensive; additional fees of between $150 and $300 are often levied for contrast, depending the contrast agent and dose, which is based on patient weight. Table 15-1 lists approximate charges for MRI of the hip, wrist, and spine, based on 2007 coding information from the insurance industry.4
Table 15-1 Costs of Musculoskeletal Magnetic Resonance Imaging Procedures
| Procedure Description | Procedure Charge or Technical Fee |
|---|---|
| Hip MRI, without contrast | $800 |
| Wrist MRI, without contrast and again with contrast | $1800* |
| Spine MRI, without contrast | $800-$900 |
| Spine MRI, without contrast and again with contrast | $1800 |
* Not including fee for contrast material.
Adapted from MAG Mutual Healthcare Solutions: Fees, billing tips, and relative values. Copyright 2006MAG Mutual Healthcare Solutions, Inc.; American Medical Association: CPT codes and descriptions only. Copyright 2006, American Medical Association.
Duration of Magnetic Resonance Imaging EXAMINATIONS
The duration of an MRI study depends on the number and types of pulse sequences performed. An MRI of the wrist, hip, or single region of the spine requires approximately 45 minutes. More limited sequences may be adequate for some diagnoses and are more rapid to perform. For example, a single T1 coronal sequence of the hip can be acquired in 5 minutes,5 though the sensitivity for fracture has not been validated in large studies.
Patients often find the MR examination challenging and may require sedation because of the claustrophobic environment of closed MRI units, which are typically cold, loud, and require the patient to be fully surrounded by the MRI tubular gantry. The patient must remain stationary for the duration of the examination to avoid motion artifact. Sometimes, sequences must be repeated because of patient motion, adding to examination duration. Good analgesia is critical to allow the patient to remain comfortably motionless for this period. Image reconstruction is rapid with today’s fast computer processing, but the tremendous number of images generated with multiple pulse sequences can result in long interpretation times.
Basic Principles of Magnetic Resonance Imaging
Emergency physicians need not understand the complex physics underlying MRI, but a basic understanding of MRI principles can clarify why some pathologic processes may be better seen with MRI than with other imaging modalities. At the same time, an understanding of basic MRI principles may reveal why MR image abnormalities require interpretation and may not always represent acute pathology.
MRI is not simply a “radiation-free CT scan.” MRI does not use ionizing radiation, unlike CT and x-ray. Instead, in MRI, an applied magnetic field and an applied radio signal induce changes in the magnetic moment of protons (hydrogen ions) within the field. As the protons return to their original state, energy is released, producing the signal used to generate magnetic resonance (MR) images (Figure 15-1). Complex computer algorithms construct images based on properties of the emitted signal.
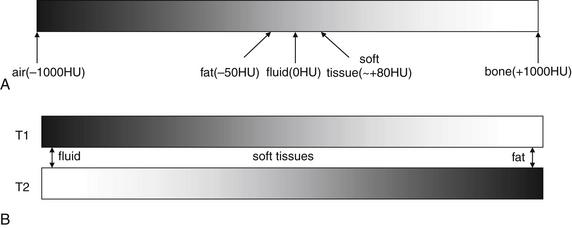
Figure 15-1 Color scheme and tissue characteristics in computed tomography (CT) and magnetic resonance imaging (MRI)
A, In CT, a fixed relationship exists between tissue appearances. The less dense the material, the less it attenuates the CT x-ray beam, and the darker the color assigned to it. Although the gray scale can be shifted to accentuate various tissues, a process called windowing, the relative colors of various tissues remain the same. Air is always the least dense tissue and appears blackest, whereas bone is always the densest native tissue and appears whitest. The window shown in this diagram is a generic one which distributes the gray scale evenly from -1000HU to +1000HU.B, In MRI, the relative color of various tissues is not fixed because the color depends on the signal strength of the tissue and that strength depends on proton density, the resonance of protons within that tissue, and the characteristics of the applied magnetic field. For example, on T1-weighted images, fluid appears dark, whereas on T2-weighted images, fluid appears bright. A mnemonic for remembering the bright appearance of fluid on T2-weighted images is “two on two”: water (H2O) on T2-weighted images. Because many pathologic processes result in increased fluid within a tissue (edema or hemorrhage), pathologic processes are often bright on T2-weighted images. (T1 = T1 weighted. T2 = T2 weighted.)
(From Broder J: Musculoskeletal MRI in the emergency department: Using the evidence to maximize resource utilization Emerg Med Pract11(3):5, 2009.)
Because the images created by CT and MRI depend on different physical properties of body tissues, they convey different clinical information. Let’s consider the features that create strong signal in CT and MR and the effect on the information in the resulting images.
Computed Tomography Signal and Images
When a CT scan is performed, ionizing radiation passes through the patient’s body, and a receptor records the strength of the x-ray emerging from the body. The attenuation of the x-ray beam varies, depending on the body tissues through which the beam passes. The degree of attenuation is essentially proportional to the physical density of the tissue (see Figure 15-1). Physically dense tissues such as bone attenuate x-ray to a greater degree than do less dense tissues. The relative density of tissues on CT can be remembered by considering the analogy of a glass of water into which different materials are placed. Air is least dense and remains above the water. Oil (fat) poured into the glass floats on the surface of the water because fat is less dense than water. Soft tissues such as a piece of meat sink to the bottom of the glass because they are slightly denser than water (remember that soft tissues consist of cells, which are composed predominantly of water). Bone is densest and falls to the bottom of the glass. On CT, a standardized density scale is applied, called the Hounsfield scale, measured in Hounsfield units. On this scale, air has a density of −1000 Hounsfield units, fat has a density of around −50 to −100 Hounsfield units, water has a density of 0 Hounsfield units, soft tissues have a density of around +50 to +100 Hounsfield units, and bone has a density of several hundred to +1000 Hounsfield units. A gray scale is assigned by density. The densest tissues are whitest, and the least dense are blackest, with intermediate densities assigned corresponding intermediate gray shades. Although the gray shade on CT can be adjusted to accentuate the appearance of certain tissues, a process called windowing, the relative brightness or darkness of tissues remains fixed because it depends on their fixed relative densities. Air is always blacker than bone. Pathologic processes can often be recognized on CT scan by changes in the density of tissues. For example, soft-tissue inflammation or edema results in an increase in the water content of adjacent fat, increasing its density. This results in an increase in the brightness of fat, called stranding. Abnormal fluid collections within soft tissues are usually visible on CT because they are lower in density than the normal soft tissue and appear darker. Air within soft-tissue infectious collections is black and is readily seen. Fractures in bone may be seen as discontinuities in the bright white cortex of bone.
Magnetic Resonance Signal and Appearance of Tissues in Resulting Images
A full description of the physics of MRI is beyond the scope of this text, as we focus on features important to emergency diagnosis. When MRI is performed, a magnetic field and radio frequency signal are applied, resulting in an emitted signal from tissue protons flipping their magnetic moment. The brightness of a tissue is therefore not proportional to physical density but rather proportional to proton richness and the characteristics of the applied magnetic field and radio signal, which can be varied to achieve different diagnostic effects (see Figure 15-1). Proton-rich tissues such as water can generate a strong signal; proton-poor tissues cannot generate a strong signal. Tissues devoid of protons, such as cortical bone and air, generate no signal.
A strong MR signal is assigned a bright (white) color on all MRI sequences. A weak signal is assigned black, with intermediate signal strengths receiving intermediate gray shades. The brightness of tissues on MR images therefore depends on the strength of the emitted signal from protons in response to a given pulse sequence (magnetic field and radio frequency manipulation). For example, air and calcified bone have a paucity of protons, emit no signal regardless of the magnetic field manipulation, and appear black on all MRI pulse sequences. Note this difference from CT, in which air and bone occupy opposite ends of the gray scale because of their widely different physical densities and x-ray attenuations.
Excluding air and cortical bone, other tissues have variable appearances on MRI depending on the character of the applied magnetic field and radio frequency signal, which can be manipulated in many ways. A given manipulation is called an MRI pulse sequence. Protons in tissues of various types respond differently to variations in the applied magnetic field and radio signal, depending on the other properties of the tissue. In response to some pulse sequences, water-rich tissues emit a strong signal and appear white. In response to other pulse sequences, they emit a weaker signal and appear black. Hematopoietic bone marrow is hyperintense to (brighter than) skeletal muscle on all pulse sequences. Fat in marrow may be bright (T1) or dark: T2, fast T2 with fat saturation, or short T1 inversion recovery (STIR)—see the later descriptions of these pulse sequences (Figure 15-2). Table 15-2 lists the appearance of various tissue types on MRI sequences.
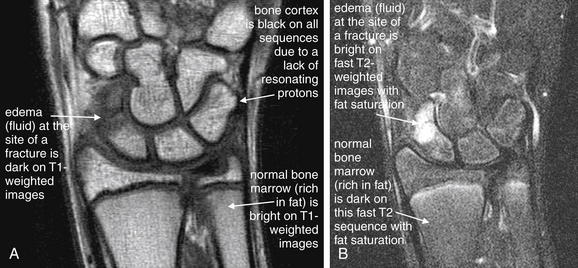
Figure 15-2 Common magnetic resonance imaging (MRI) pulse sequences with examples of T1- and fast T2-weighted images with fat saturation.
The figure shows a scaphoid fracture on T1- and fast T2-weighted images with fat saturation.A, T1-weighted images highlight fat including bone marrow as a bright signal, leaving fluid dark.B, Fast T2-weighted images with fat saturation show fluid as a bright signal while fat is dark.On all sequences, bone appears black because of its paucity of resonating protons, making MRI poor for detection of cortical breaks. T1- and T2-weighted sequences can show marrow edema associated with fractures. Additional sequences are sometimes used to highlight pathology. Fast spin–echo T2 (also known as fast T2) shows both fat and fluid as bright, but when fat saturation is added, fat becomes dark on these images. Proton density images have less tissue contrast (all tissues appear a shade of gray) but offer excellent anatomic detail. Gradient–echo images allow true three-dimensional volume imaging but have susceptibility artifact (see the main text), which makes them poor for patients with metal prosthetic devices.
(From Broder J: Musculoskeletal MRI in the emergency department: Using the evidence to maximize resource utilization. Emerg Med Pract 11(3):5, 2009.)
Table 15-2 Tissue Appearances on Magnetic Resonance Imaging Sequences
We discuss the clinical applications of common pulse sequences later in this chapter.
Signal Strength and Image Resolution in Magnetic Resonance Imaging
An ideal MR image would have good signal-to-noise ratio and high spatial resolution. Unfortunately, these characteristics are inversely related because of the way that MR images are created (Figure 15-3). MR images are generated from the signals emitted from three-dimensional tissue volumes. The total signal from a given tissue volume is displayed as a single pixel, also called a volume element or “voxel” because of its three-dimensional source. The number of protons in a voxel is proportional to the volume of the voxel. The resolution of the image is inversely proportional to the voxel size. Using many small tissue volumes results in a high-resolution image composed of many small voxels. However, because the number of protons in each of these small volumes is also small, the signal from each voxel is weak compared with the background noise. The signal-to-noise ratio can be improved by increasing the size of the voxels, but this necessarily reduces the resolution of the image. The signal-to-noise ratio can be improved by moving the MRI coil (the source of the magnetic field) closer to the imaged body part, allowing high-resolution extremity images to be acquired while maintaining good signal strength by using dedicated extremity coils.6-7
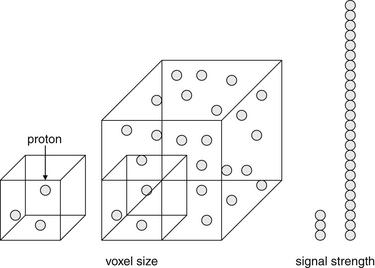
Figure 15-3 Factors influencing magnetic resonance imaging (MRI) resolution and signal strength.
In MRI, the signal strength from each voxel (a three-dimensional pixel volume) is proportional to the number of protons resonating within the tissue volume. Increasing the volume of each voxel reduces resolution but increases signal strength. Doubling the side length of the voxel increases the number of protons (signal strength) by 23, or eightfold.
(From Broder J: Musculoskeletal MRI in the emergency department: Using the evidence to maximize resource utilization. Emerg Med Pract 11(3):4, 2009.)
Two- and Three-Dimensional Imaging With Computed Tomography and Magnetic Resonance
Both CT and MRI use complex computer algorithms to generate images, which can be displayed as two-dimensional “slices” through the body in any plane or as three-dimensional reconstructed images.
Older single-slice CT scanners acquired single image slices through the body in an axial plane, usually with gaps between adjacent slices (for a more detailed description, see Chapter 8). Modern multislice CT scanners acquire three-dimensional volumes of data through helical acquisition. These volumes can be thought of as stacks of thin two-dimensional axial slices, with the thickness of each slice determined by the way that the CT scanner is programmed. Most CT scanners can acquire slices as thin as 0.625 mm, although these thin slices generally result in longer duration of scanning. For faster CT acquisition, some scanners are routinely programmed to acquire thicker slices (e.g., 3 to 5 mm), at the expense of some image resolution. The stack of CT images can be “resliced” for display in multiple planes. The quality of the reconstructed multiplanar CT images depends on the thickness of the original slices. A CT dataset acquired at 5-mm slice thickness results in significant stair-step artifact when the stack of thick slices is resliced to create a sagittal or coronal image. If the original slices are acquired at 0.625-mm thickness, the stack of thin slices can be resliced to yield multiplanar images with minimal artifact.
As with CT, some MRI pulse sequences acquire data as two-dimensional slices that can be “stacked” to create a three-dimensional volume. Gradient–echo MRI pulse sequences (described later) allow acquisition of a true three-dimensional volume of data, which can be resliced for display in any plane (Figure 15-4) without artifact.
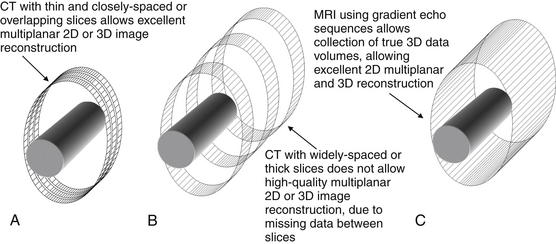
Figure 15-4 Comparison of CT and MRI two-dimensional (2D) multiplanar and three-dimensional (3D) capabilities.
CT involves acquisition of multiple 2D slices of variable “thickness” through the body part (solid cylinder). If the slices are thin and closely spaced or overlapping (A), the resulting 3D volume of data can be reconstructed in any plane with little artifact. Thicker or widely-spaced slices (B) do not produce good multiplanar reconstructions. When reconstructed in coronal or sagittal planes, resulting images have a pixelated or stair-step artifact.
MRI can acquire a series of 2D images, like CT, or a true 3D volume (using gradient–echo sequences (C), which allows multiplanar reconstructions with no artifact.
(From Broder J: Musculoskeletal MRI in the emergency department: Using the evidence to maximize resource utilization. Emerg Med Pract 11(3):4, 2009.)
Technical Features of Computed Tomography and Magnetic Resonance Affecting Ability to Diagnose Fracture
CT and MR diagnoses of fracture rely on different imaging findings.
Modern CT scanners demonstrate the cortex of bone at very high spatial resolution. The cortex of bone is readily visible on CT because it consists of dense calcium, which attenuates the x-ray beam to a great extent, as described earlier. A fracture plane is a discontinuity in the cortex, usually filled with low-density hemorrhage, which attenuates the x-ray beam to a significantly lesser extent. A brief comparison with earlier CT scan technology highlights the mechanism for improved diagnostic accuracy of CT over time. Early CT scanners performed a series of single axial slices, with gaps between adjacent slices. A narrow fracture in the axial plane might fall between two adjacent slices and be missed. In addition, the thickness of the axial slices was as great as 5 mm with early scanners. Consequently, each displayed planar axial image represented the pooled data from several millimeters of anatomy in the z-axis. The low density of a fractured cortex might be obscured when it was “volume averaged” with data from the intact cortex in the adjacent several millimeters of anatomy. In comparison, modern multislice CT scanners perform helical acquisition of slices as thin as 0.625 mm, with no gaps between image slices (Figure 15-5). These form a three-dimensional volume of image data that can be displayed in axial, coronal, or sagittal planes. The probability of missing even a narrow fracture plane is thus greatly reduced.8
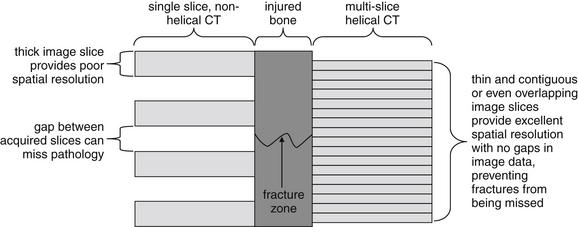
Figure 15-5 Differences in spatial resolution of modern multislice, helical CT and older single-slice, nonhelical CT.
At the center is a schematic of a bone with a narrow fracture zone. At the left, older-generation CT scanners acquired single slices of image data, with the patient table moving in steps through the CT gantry between acquisition of image slices. A narrow fracture zone might fall between two adjacent slices and fail to be detected. At the right, modern multislice helical scanners can acquire much thinner and contiguous or overlapping slices, resulting in no missing image data. Even a thin fracture zone is unlikely to be missed using this technique, accounting for improving sensitivity of CT for fracture with newer scanners.
(From Broder J: Musculoskeletal MRI in the emergency department: Using the evidence to maximize resource utilization. Emerg Med Pract 11(3):7, 2009.)
MRI demonstrates fractures through a different mechanism. The calcified bony cortex and trabecular bone are devoid of resonating protons, which are found predominantly in tissues containing fat or water. Consequently, the cortex and trabeculae produce essentially no signal and appear as black signal voids on all MRI pulse sequences. However, bone marrow contains fat, which produces high signal on some pulse sequences. In addition, in the presence of fracture, hemorrhage and edema in the marrow space provide resonating protons that produce a strong signal; this pathologic signal can be differentiated from normal marrow fat. Thus MRI provides an indirect diagnostic finding of fracture, rather than directly visualizing cortical fracture.
Magnetic Resonance Imaging Pulse Sequences
As we described in preceding basic outline, the MRI appearance of a tissue depends on the proton density of the tissue (protons per unit volume) and on the tissue type. The signal emitted by a proton is determined by its resonance (hence the term magnetic resonance). The tissue type affects the resonance of protons within that tissue in response to a given applied magnetic field and radio signal, called a pulse sequence. Protons within fat resonate with different properties from protons in body fluids. Adjusting the pulse sequence is called “weighting” the image, and it results in the various image types available from MRI. MR pulse sequences are distinct magnetic field and radio frequency conditions applied as the image data is acquired; they differ from CT “windows,” which are variations in the manner in which the previously acquired image data is displayed.
Common pulse sequences with their clinical applications are listed in Table 15-3. The tissue appearances using these pulse sequences were described in Table 15-2.
Table 15-3 Common Musculoskeletal Magnetic Resonance Imaging Sequences
| Sequence | Strength | Weakness |
|---|---|---|
| Spin–Echo | ||
| Proton density | ||
| T1 | ||
| T2 | ||
| Fast Spin–Echo | ||
| Proton density | ||
| T2 | ||
| Gradient–Echo | ||
| T2* | ||
| STIR | ||
Many pulse sequences have been developed, each with strengths and weaknesses for evaluating a given type of pathology. The pulse sequence should be selected based on its ability to depict the anticipated pathology, so the input of the emergency physician is essential. The emergency physician need not select the sequence but should inform the radiologist of the differential diagnosis or indication for the study to allow the radiologist and MRI technician to select appropriate sequences and imaging planes to maximize diagnostic accuracy. All available pulse sequences cannot be performed in a single patient, because each sequence takes time to perform, and the duration of an MRI examination with many pulse sequences would become prohibitive.7
Frequently used musculoskeletal MRI pulse sequences include three spin–echo sequences: proton density images (which provide excellent anatomic detail but do not highlight soft-tissue contrast for pathologic processes), T1-weighted images (used to visualize fat-containing tissues), and T2-weighted images (used to highlight fluid, which is common resulting from edema in many pathologic processes). Fast spin–echo techniques have largely replaced standard spin–echo T2, allowing faster image acquisition with reduced patient movement, reduced motion artifact, additional time for more pulse sequences when necessary, and faster throughput. One important limitation of fast spin–echo T2 is blurring at tissue margins, which can hide pathology such as meniscal tears in an injured knee.
Fat saturation is an additional technique valuable in musculoskeletal applications. An administered magnetic pulse suppresses the signal from fat, rendering fat dark in appearance. This is necessary to discriminate fat from fluid on fast T2-weighted images, in which both tissue types appear bright without fat suppression. A clinical example of the use of this technique is MRI for occult fracture. Because cortical bone is devoid of protons and is invisible (black) on all MRI sequences, fractures are revealed not by cortical abnormalities but by the presence of bone marrow hemorrhage or edema at the site of fracture. Bone marrow is normally rich in fat and devoid of fluid, and it appears bright on fast T2-weighted images. However, pathologic fluid also appears bright on this pulse sequence. By suppressing fat signal with fat saturation, pathologic fluid within bone marrow is revealed. STIR (sometimes called inversion recovery) also causes suppression of signal from fat and can be used for similar clinical applications as those benefiting from fast T2 with fat saturation.
Gradient–echo pulse sequences are distinct from spin–echo techniques and have advantages in musculoskeletal imaging. Gradient–echo T2 images (sometimes called T2∗, pronounced “T2 star”) highlight fluid, are rapidly acquired and depict cartilage, ligaments, and fibrocartilaginous structures in detail, clear benefits for musculoskeletal evaluation. The evaluation of other soft-tissue contrast is limited with this technique. True three-dimensional “volume” imaging is possible with gradient–echo but requires longer periods for image acquisition.
Susceptibility effects are artifacts created by some pulse sequences at the interface between two tissue types with widely different magnetic properties. They result in loss of signal, with a black appearance on MR images. Susceptibility effects can sometimes be used strategically for diagnostic advantage but must be avoided in other cases because of impaired diagnostic ability. For example, gradient–echo T2 pulse sequences depict the increased susceptibility effects from hemoglobin breakdown products and are sensitive for detection of hemorrhage. However, susceptibility effects around metal hardware obscure adjacent soft tissues on this pulse sequence. Fast spin–echo T2 sequences have minimal susceptibility effects and are therefore ideal for imaging patients with metal hardware.7
Magnetic Resonance Imaging and Gadolinium Contrast Agents
A variety of gadolinium-based medical contrast agents are available in the United States. These contrast agents complex the rare-earth metal gadolinium to larger structures, altering the tissue distribution in diagnostically useful ways. Gadolium contrast agents increase signal on T1-weighted images, causing soft-tissue enhancement nearly proportional to blood flow. Properties of the chelating molecule (linear or cyclic and ionic or nonionic) determine the tissue affinity and half-life. Most agents are renally excreted, with some agents also excreted partially in bile. Agents can be given intravenously or intraarticularly to produce an arthrogram, although this second route of administration is rarely used in the emergency department.7
For most trauma-related emergency musculoskeletal MRI, including acute traumatic spinal cord injury, gadolinium contrast is not needed. Gadolinium contrast agents are most valuable for angiography, and identification of infectious or neoplastic processes. In the case of suspected soft-tissue infection, gadolinium can differentiate a discrete abscess from soft-tissue edema and phlegmon. Bone marrow enhancement after gadolinium is not specific for osteomyelitis, because reactive hyperemia has a similar appearance. Gadolinium is useful in evaluation of nontraumatic spine lesions, including tumor, demyelinating disease (multiple sclerosis), and intradural or extramedullary lesions such as metastatic disease. Following spinal surgery, gadolinium is useful for differentiation of enhancing scar tissue from nonenhancing disc material.
Magnetic Resonance Imaging Safety and Contraindications
Nephrogenic Systemic Fibrosis and Gadolinium Contrast
Although the risk for contrast nephropathy from iodinated contrast used in CT is familiar to emergency physicians, gadolinium-associated nephrogenic systemic fibrosis may be less recognized. Nephrogenic systemic fibrosis (NSF) is a potentially fatal condition first linked to gadolinium contrast exposure in 2006.9 The condition results in tissue fibrosis clinically similar to scleroderma—sometimes localized, but in other cases involving multiple internal organs and progressing to death.
Contrast nephropathy from iodinated contrast agents leads to worsened renal insufficiency in patients with baseline renal impairment but has no important consequences in patients already receiving hemodialysis for chronic renal failure.10 In stark comparison, gadolinium-associated nephrogenic systemic fibrosis appears to pose the greatest risk to patients with acute and chronic renal insufficiency, including patients receiving chronic hemodialysis.11 Because gadolinium contrast agents are largely renally excreted, with a half-life of approximately 90 minutes in patients with normal renal function, patients with low glomerular filtration rates (GFRs) are exposed to circulating gadolinium for longer periods.12 For one common agent, gadodiamide, the half-life in patients with end-stage renal disease but not yet receiving dialysis is more than 34 hours and in peritoneal dialysis patients is more than 52 hours. Gadolinium agents are removed by hemodialysis, with approximately 65% to 78% cleared during a first hemodialysis session, 96% following a second session, and 99% following a third session. Peritoneal dialysis is poor at removing these agents; after 22 days of continuous peritoneal dialysis, only 69% of gadolinium contrast is excreted.12
Gadolinium-associated NSF is a grave but rare risk. Prince et al. retrospectively reviewed 74,124 patients receiving gadolinium-enhanced MRI over 10 years at two large medical centers and found no cases of biopsy-proven NSF after a standard gadolinium dose, 0.1 mmol/kg. Among patients receiving a high dose of gadolinium (between 0.2 and 0.4 mmol/kg), 15 of 8997 (0.17%) developed NSF, and all had an estimated GFR of less than 30 mL per minute. Of these patients, 11 had acute or acute-on-chronic renal insufficiency. Patients receiving chronic hemodialysis for end-stage renal disease and receiving high-dose gadolinium developed NSF at a rate of 0.4%. The highest incidence of NSF was observed in patients receiving high-dose gadolinium under two circumstances: 8.8% (10 of 114) in patients with a very low GFR (<15 mL/min) but not yet receiving hemodialysis and 19% (11 of 58) in those with acute renal failure and a creatinine increase of 0.5 mg/dL or greater in a 24-hour period. Hyperphosphatemia was also associated with increased NSF risk. No patient developed NSF if hemodialysis was performed within 24 hours of gadolinium exposure, and hemodialysis within 48 hours was associated with decreased risk. The risk of NSF appeared greatest in patients receiving Gadodiamide (GE Healthcare), while other gadolinium-based contrast agents were rarely associated with NSF.11
For the emergency physician, several key points bear repeating. The risk for NSF is extremely low in patients receiving standard doses of gadolinium, regardless of renal function. The risk remains very small in those receiving high-dose gadolinium, except in patients with acute renal failure with an estimated GFR of less than 30 mL per minute. The risk is particularly high in patients with acute and worsening renal failure, and gadolinium should be avoided in this group whenever possible. Creatinine clearance, not measured serum creatinine, should be used to categorize renal function, and is calculated by a simple formula (Box 15-1) incorporating serum creatinine, patient age, gender, and body mass. Creatinine clearance calculators are readily available online, and some clinical laboratories now report creatinine clearance in addition to measured creatinine. An example illustrates the importance of using calculated creatinine clearance rather than measured serum creatinine. A measured creatinine of 1.0 mg/dL is within normal limits for most clinical laboratories. In a 70-kg, 35-year-old male, this corresponds to a (normal) calculated creatinine clearance of 90 mL per minute. However, in a 50-kg, 85-year-old female, this corresponds to a calculated creatinine clearance of 32 mL per minute, representing significant renal dysfunction.
Box 15-1 Estimated Creatinine Clearance Using the Cockcroft-Gault Formula
Creatinine clearance (eCcr) is a more accurate measure of renal dysfunction and risk for gadolinium-related nephrogenic systemic fibrosis than is measured serum creatinine.
When standard-dose gadolinium is administered, the risk for gadolinium-induced NSF is lower than the risk for death from iodinated contrast agents used in CT. Nonetheless, the American College of Radiology (ACR) now recommends informed consent before administration of gadolinium contrast for patients with moderate to end-stage renal disease.13 Patients receiving chronic hemodialysis should receive the lowest feasible gadolinium dose and should undergo dialysis as soon after contrast administration as possible. The ACR recommends hemodialysis within 2 hours after administration of gadolinium contrast for patients with renal failure,13 though this practice is not well supported by research evidence. As described earlier, peritoneal dialysis is ineffective at eliminating gadolinium, and these patients may be at particularly high risk from gadolinium; they should avoid exposure or undergo rapid hemodialysis following gadolinium adminstration.13 These are important considerations because dialysis patients may be at risk for conditions such as spinal epidural abscess, best diagnosed by MRI, resulting from hematogenous infection from dialysis catheters.14
Gadolinium Safety in Pregnancy
The effects of gadolinium on the developing human fetus are unknown. Gadolinium crosses the placenta from the maternal circulation to the fetal circulation, is filtered by the fetal kidney, and is then excreted into the amniotic fluid, where it may remain for a prolonged period. The ACR recommends against the routine use of gadolinium-based contrast agents in pregnancy. Instead, the ACR recommends that the decision to use gadolinium should be based on overwhelming potential benefit to the patient or fetus, and a discussion of risks and benefits with patient consent should be documented in the medical record.13
Allergies to Gadolinium Contrast Agents
Allergic reactions to gadolinium-based contrast are relatively rare (around 3%) but can occur, with an increased risk in patients with prior gadolinium reactions. Prior reactions to iodinated contrast are associated with increased risk for gadolinium reaction, around 6.3%. Asthma and allergies to other allergens are risk factors for gadolinium contrast reaction, with a two- to fourfold increase in risk.13
Magnetic Resonance Imaging in Patients With Pacemakers and Automatic Implantable Cardioverter–Defibrillators
Until recently MRI had long been considered contraindicated in patients with ferromagnetic foreign bodies, including pacemakers, automatic implantable cardioverter–defibrillators (AICDs), and other electronic devices. The magnetic field from MRI can cause programming changes to the devices, inhibition of pacing, rapid pacing, induction of ventricular fibrillation, heating of the device or leads, battery depletion, and device damage requiring replacement. However, accidental exposures without adverse events, and more than 230 published prospective cases of patients with pacemakers safely having undergone low-field MRI, suggest that with proper planning some patients with these devices may be able to undergo MRI if clinically necessary.15 In vitro studies of pacemakers and AICDs subjected to 1.5- to 3.0-tesla MRI found that no significant temperature change or permanent device damage resulted.14-17 The ACR designates pacemakers and defibrillators as relative contraindications to MRI and states that MRI of patients with these devices should not be routine but may be considered case by case.13 Despite this, emergency physicians may find obtaining MRI in patients with these devices difficult because of fear of harm shared by the radiologist and the patient.
Magnetic Resonance Imaging in Patients With Intracranial Aneurysm Clips
Great care should be taken in subjecting patients with intracranial aneurysm clips to MRI, even musculoskeletal MRI of remote body regions. Titanium clips are safe for MRI. Other intracranial aneurysm clips can deflect when subjected to a magnetic field, resulting in serious injury or death. Nontitanium clips manufactured in 1995 or later are considered safe when the product labeling indicates MRI compatibility. Older clips may require proof of testing for ferromagnetic properties. Never assume that a patient with an aneurysm clip who has undergone prior MRI safely can do so again—variations in magnetic field characteristics and clip orientation in the field may create different effects on the clip. Significant injuries have been reported, including blindness.13
Other Magnetic Resonance Imaging Safety Considerations
MRI has several other potential injurious effects. First, MRI examinations result in high acoustic volume—more than 100 dB in some clinically used machines and up to 130 dB for experimental 4.7-tesla systems18-19—loud enough to damage human hearing. The ACR recommends hearing protection be used by patients undergoing MRI.13
Second, MRI can induce current in conducting circuits, even when these loops are not connected to a device or power supply. Induced currents can lead to rapid heating, sometimes resulting in severe tissue injury. Thus wires such as external electrocardiogram monitor leads and even the foil backing material used in some cutaneous drug-delivery systems should be removed from the patient before MRI—it is not sufficient to disconnect wiring from a power source. If wiring cannot be removed, insulation or a heat sink such as an ice pack should be placed between the wire and the patient’s skin. Permanent neurologic injury from heating of implanted neurostimulator leads has been reported to the U.S. Food and Drug Administration. Patients themselves can form electrical circuits and should be instructed to avoid crossing arms and legs during MRI to lessen this risk. Nonferromagnetic skin staples can become heated in the magnetic field and can cause cutaneous burns; this can be avoided by applying an ice pack to the staple line to act as a heat sink. Magnetic heating of tattoos can lead to burning sensations and first-degree burns, again preventable by application of an ice pack before MRI.13 These injuries are rare and generally not serious but might interfere with completion of the MRI examination.17,20-22 Patients should be warned of thermal effects of MRI and cautioned to report any heat sensation immediately. The MRI field strength influences thermal heating. MRI-compatible medical devices should not be imaged using MRI of a field strength different from that approved by the manufacturer because of risk for field-induced heating. In vitro studies of intrauterine devices including copper intrauterine devices suggest them to be safe, with no deflection, torque, heating, or image artifact.23
Evidence-Based Medicine: Magnetic Resonance Imaging in Emergency Medicine Practice
We’ve reviewed many clinically important technical features of MRI and turn our attention next to the performance of MRI in three diagnostically challenging scenarios: epidural spinal abscess, occult hip fracture, and occult scaphoid fracture. Before examining the evidence for MRI in these conditions, let’s first review some common methodologic errors and biases encountered in the medical literature. Armed with knowledge of these biases, we can more critically evaluate clinical studies of MRI.
Common Biases in Studies of Diagnostic Tests
Table 15-4 reviews common forms of limitation or bias occurring in studies evaluating diagnostic tests.24
Table 15-4 Biases and Limitations in Studies of Diagnostic Tests
| Limitation or Bias | Description or Example | Result |
|---|---|---|
| Lack of gold standard (see verification or workup bias) | No gold standard is available for the condition under consideration. | Without a valid diagnostic standard, true and false positive and negative results cannot be determined. Results and conclusions of the study cannot be rigorously evaluated for validity. |
| Incorporation bias | The test under evaluation is used as the gold standard, or the final diagnosis partly relies on this test result. | Results of the study are biased in favor of the apparent accuracy of the diagnostic test. |
| Lack of blinding | Results of other testing or patient characteristics are available to the researchers, potentially affecting their interpretation of the diagnostic test under consideration. | Results are biased by the physicians’ or researchers’ preconceptions about the accuracy of the diagnostic test. |
| Verification or workup bias | Not all subjects receive consistent confirmatory testing against a gold standard. | If negative tests are not confirmed against a gold standard, false-negative tests will not be recognized. If positive tests are not confirmed against a gold standard, false-positive tests will not be recognized. This may result in incorrect sensitivity and specificity calculations. |
| Spectrum bias | Patients with extremes of severity of injury or illness are enrolled, rather than patients with a representative range of severity. | A nonrepresentative sample may skew results, impairing external validity. It can affect sensitivity and specificity, because a test may readily diagnosis severe disease but not subtle disease. |
| Selection bias | A nonconsecutive sample of patients undergoes testing. | A nonrepresentative sample makes extrapolation of the result to other populations unreliable. |
| Manufacturer-specific variations in MRI protocols and sequences | Manufacturers may differ in the technical features of the equipment, which can be manipulated to obtain images. | Results cannot be readily reproduced outside of the research environment or using different equipment. |
Biases associated with the application of a reliable and uniform diagnostic standard are one of the most common and serious problems in studies of diagnostic imaging. At its heart, any valid study of a new diagnostic test must compare the test result to some measure of “truth,” representing the actual presence or absence of disease in each patient. Without such a comparison, we have no reliable way to determine whether the new test under scrutiny has provided true-positive, false-positive, true-negative, or false-negative results. In a perfect scenario, an unequivocal diagnostic standard known as the gold standard (sometimes called the criterion or reference standard) exists and is applied in every case. For example, in a study of CT scan for appendicitis, if all patients (regardless of CT scan result) were to undergo appendectomy and surgical pathology were used to define the gold standard, a strong comparison could be made between CT interpretation and pathology. Even pathologists make mistakes, so gold standards are not themselves perfect, but this approximates “truth” as closely as we can reasonably expect in clinical medical research. Often in medicine, it is unreasonable or unethical for each research subject to undergo the gold standard test. For example, patients with normal CT scans might not be reasonably expected to undergo appendectomy. In these cases, a mixed diagnostic standard is often used, consisting of pathology reports (for patients with abnormal CT undergoing surgery) and clinical follow-up (in those with normal CT who are spared immediate appendectomy).
Several deviations from this ideal can occur, leading to bias. First, in some cases, it is unclear what the appropriate diagnostic standard should be. This is particularly a problem in diseases that rely on diagnostic imaging for diagnosis, with no confirmation possible by laboratory, microbiologic, pathologic, or surgical means. Consider a study of nondisplaced fractures, which are usually diagnosed by x-ray. If a new diagnostic test is compared with x-ray, what gold standard should be applied? Pathology is not performed to diagnose such fractures. Clinical follow-up could be applied as a diagnostic standard to determine which injuries heal without intervention and which require immobilization, but this may not accurately reflect the presence or absence of fracture. Some nondisplaced fractures might heal uneventfully without any specific treatment and might be miscategorized through follow-up as “nonfractures.” Other nonfracture injuries might be immobilized unnecessarily by practitioners because of continued patient symptoms and might be miscategorized as “fractures.” Still, clinical follow-up is sometimes the only pragmatic diagnostic standard and is arguably a more important outcome than the actual presence or absence of disease or injury. That said, researchers should be cautious in reporting their results in such cases as sensitivity and specificity, since these suggest a confirmed diagnosis. Instead, reporting of clinical outcomes in each diagnostic group (e.g., the percentage of patients healing uneventfully without immobilization in the MRI-negative group) is a more accurate description of the variables measured by such a study.
Often, researchers solve this problem of the lack of an independent diagnostic standard in a biased manner: they assume either the historical imaging test or the new imaging test to be correct in all cases. Whether the new or the old test is assumed to be correct, errors in interpretation are likely to occur. For example, if the new test is (in truth) superior to the historical test, it may discover disease when the historical test was negative or show no disease when the historical test was positive. If the historical test is considered the diagnostic standard, the new test results may be incorrectly categorized as false-positive and false-negative test results. As a result, the calculated sensitivity and specificity for the new test will be lower than is truly the case.
Often, researchers presume the new imaging test to be correct and assume discrepancies between results of the new test and the older test to reflect errors of the older test. By this definition, the new test cannot yield false-positive or false-negative results, and the sensitivity and specificity are by definition 100%. This flawed use of a new diagnostic test as its own gold standard is called incorporation bias. More subtly, incorporation bias may occur when the final clinical diagnosis is considered the diagnostic standard but the results of the imaging tests are available to the clinicians and thus influence the final clinical diagnosis. Blinding of clinicians to the results of the imaging tests under comparison can prevent this but is often not performed.25 For example, imagine a study comparing CT and MRI for the diagnosis of hip fracture. If CT and MRI are compared with the final clinical diagnosis, it would appear that they are being appropriately subjected to an independent diagnostic standard. However, if the orthopedist rendering the final clinical diagnosis is aware of the imaging results and believes MRI to be more accurate, the clinical diagnosis will not be an independent standard but rather will reflect the MRI result. Many studies of MRI that we discuss later suffer from some degree of incorporation bias.
Another common error is verification bias (also called workup bias), which occurs when only some subjects undergo definitive confirmation with a diagnostic reference test. For example, patients with abnormal imaging results may undergo definitive testing with biopsy and pathologic analysis, whereas patients with normal imaging results may not. In effect, normal imaging results are assumed to be correct, whereas abnormal test results are subjected to further scrutiny against the gold standard. The results of such analyses are often incorrect. If some normal imaging results are actually falsely negative but are not discovered by definitive testing, the sensitivity of the imaging test may be overestimated. In the case of studies of MRI, this is a strong possibility because normal MRI is rarely followed by surgical intervention. Nishikawa et al.26 estimated the role of verification bias in a study of MRI for meniscal tears of the knee. Using only patients undergoing arthroscopy following abnormal MRI, they calculated a sensitivity and specificity of 85% and 31%, respectively. After accounting for the possibility of undetected meniscal tears in patients with normal MRI, the estimates of sensitivity and specificity ranged from 29% to 95% and from 3% to 92%, respectively—demonstrating the potential importance of verification bias in misestimating test accuracy.26
Incorporation and verification biases have particular importance in evaluation of studies of MRI, because the technologic sophistication and exquisitely detailed images of MRI may lead to the seductive conclusion that MRI is always correct or that “seeing is believing.” However, evidence suggests that many findings on MRI do not represent real or clinically important pathology. For proof of this, we turn to an area of MRI application where pathologic confirmation of MRI findings is possible, MR mammography for breast cancer screening. Based on pathology results, MRI has excellent sensitivity but poor specificity—with one false-positive test for every two true positives, according to a meta-analysis of 19 studies.27 In the realm of musculoskeletal MRI, the poor specificity of MRI is demonstrated by studies of asymptomatic volunteers. Among subjects without back pain or neurologic symptoms, 25% to 50% have abnormal lumbar spine MRI.28-29 Asymptomatic subjects undergoing wrist MRI have “abnormal” signal, simulating pathology.30-32 Sugimoto et al.31 found that 50% of wrists in asymptomatic subjects had abnormal signal of the triangular fibrocartilage, making this MRI finding useless diagnostically.
Spectrum bias may influence the results of a study of diagnostic tests. Spectrum bias occurs when the population studied is skewed toward patients with either mild or severe disease or injury, rather than representing the full or typical range of clinical presentations. Although the results may be valid for similarly skewed populations, they may not reflect the performance of the test in a different population with a different distribution of disease severity. Many studies of MRI suffer from this bias because they examine populations of patients referred to specialty orthopedic clinics or undergoing operative interventions. These populations may be enriched in patients with disease or injury, compared with the typical population seen in an emergency department. The effect of spectrum bias on the apparent performance of a test can vary. For example, imagine a study of patients with massive pulmonary embolism and hemodynamic instability admitted to a medical intensive care unit. CT scan in such a population might appear to be 100% sensitive for detection of pulmonary embolism—which might well be true for large central pulmonary emboli in critically ill patients but might not be true for small, subsegmental pulmonary emboli in stable emergency department patients complaining only of chest pain or dyspnea. When evaluating a study of diagnostic tests, it is therefore essential to review the study setting and enrollment criteria, which may reveal spectrum bias.
A related phenomenon is selection bias, which can create a nonrepresentative subject sample at the point of study enrollment. Consecutive enrollment of all patients with a given complaint prevents selection bias, whereas a nonconsecutive sample is highly subject to this bias. Consider the example of a study of MRI in patients with negative hip x-ray after a fall. If all patients with negative hip x-ray are enrolled, selection bias is avoided. If, however, only those patients whom the investigator chooses to enroll become study subjects, the population may differ markedly from the larger population of all patients with falls and hip pain. Selection bias often results in spectrum bias and verification biases (described earlier)—the enrolled subjects may be sicker or more injured than the average patient, and performance of diagnostic tests may differ in this group.
Selection, spectrum, and verification biases can overlap and strongly affect the results of studies of disease or injury incidence and prevalence. Accurate studies of this type should be population-based, with consecutive enrollment of all patients meeting inclusion criteria. If, instead, only selected patients are enrolled and studied, the results will likely reflect the investigators’ biases. For example, if only those patients with a high clinical suspicion of injury are studied with definitive imaging after normal x-ray, the population of patients will likely be enriched with patients with injuries. The rate of detection of injuries with definitive imaging in this group will likely be higher than in the original pool of all patients, and the performance of x-ray will appear particularly poor because many injuries may be detected that were missed by x-ray. If patients with a lower pretest probability of disease had been studied, most negative x-rays would likely have been true negative, and the apparent performance of x-ray would be better. A study of this type may simply reflect the investigators’ desire to prove that x-ray is a poor test for fracture.
MRI is subject to additional problems of validation because of the proliferation of proprietary pulse sequences developed by different manufacturers. It can be difficult to reproduce the precise combination of magnetic field and radio frequency variations on another manufacturer’s equipment.7 In addition, when a study fails to demonstrate good diagnostic qualities for MRI, it may simply reflect a failure to select the best pulse sequence or imaging planes to demonstrate the pathology, rather than an across-the-board inability of MRI to make an accurate diagnosis of the condition.
Magnetic Resonance Imaging Diagnostic Accuracy for Epidural Abscess
Perhaps the most important musculoskeletal application of MRI in the emergency department is in the evaluation of potential spinal cord lesions (Figures 15-6 and 15-7; see also Chapter 3). Spine MRI constituted 29% of emergency department MRI in a study by Rankey et al.1 Although trauma is likely the single leading indication, MRI is frequently performed for evaluation of cord compression or other abnormalities from metastatic disease, infectious processes, inflammatory disease (e.g., transverse myelitis), or demyelinating disease (e.g., multiple sclerosis). With some technical caveats related to diagnostic confirmation, as described earlier in our discussion of evidence-based medicine, MRI is generally considered the diagnostic standard for these conditions. MRI provides outstanding soft-tissue contrast, allowing extrinsic spinal cord compression, inflammatory lesions within the cord itself, and adjacent soft-tissue masses to be recognized. In its evidence-based appropriateness guidelines, the ACR gives MRI its highest appropriateness rating for investigation of myelopathy except in the case of trauma, where CT is rated as the initial test of choice because of its better depiction of bone.33 Here, we consider some evidence for emergency department MRI for suspected spinal epidural abscess, comparing it with alternative imaging strategies.
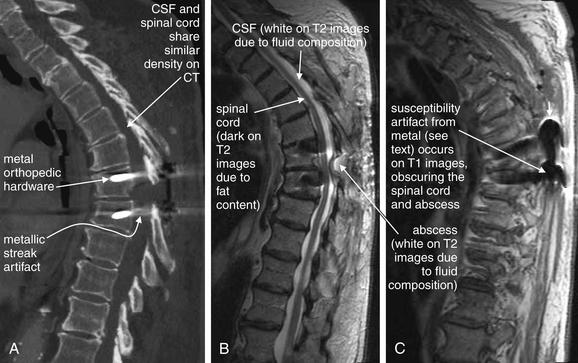
Figure 15-6 CT and MRI of thoracic spine in a patient with spinal epidural abscess.
This patient presented with back pain, fever, and leukocytosis 3 weeks after thoracic spine surgery.
A, Thoracic CT performed before MRI was nondiagnostic. The spinal cord, cerebrospinal fluid (CSF), and abscess fluid have similar density and are not well discriminated on CT. Adjusting the window level can allow some visualization, but metallic streak artifact from orthopedic hardware also limits the CT image. MRI was performed with gadolinium contrast, which is valuable for detecting suspected infectious or inflammatory conditions. B, A T2-weighted sagittal image shows soft-tissue mass (abscess) obliterating the CSF space at the T7-T8 level. C, A T1-weighted image is nondiagnostic because of susceptibility artifact from spinal hardware. This artifact is less prominent on T2-weighted images.
(From Broder J. Musculoskeletal MRI in the emergency department: Using the evidence to maximize resource utilization. Emerg Med Pract 11(3):10, 2009.)
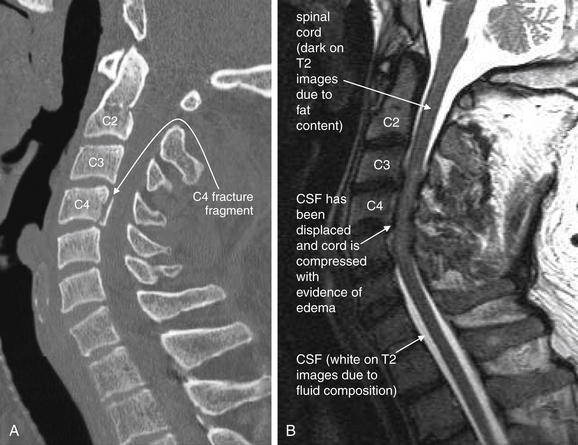
Figure 15-7 MRI of the cervical spine in a patient with quadriplegia and a C4 fracture demonstrated on CT after a motor vehicle collision.
A, CT better demonstrates the spinal fracture.
B, A T2-weighted MRI sagittal image clearly demonstrates spinal canal narrowing with cord compression from C3 to C5. On T2-weighted images, fluid appears white and fat appears dark. The normal CSF (white) surrounding the cord has been displaced. The cord itself shows signs of edema at this level, indicated by a brighter signal from edema fluid. The normal spinal cord appears dark gray because of fat content from myelin. This MRI was performed without contrast, which is not needed for evaluation of acute spinal cord trauma.
(From Broder J. Musculoskeletal MRI in the emergency department: Using the evidence to maximize resource utilization. Emerg Med Pract 11(3):10, 2009.)
Delay in diagnosis of spinal epidural abscess is associated with devastating neurologic outcome, suggesting that early diagnosis and treatment are particularly important. The diagnosis is not readily evident in many emergency department patients, mandating advanced imaging in patients with almost any level of clinical suspicion. Davis et al.34 performed a case-control study of 63 emergency department patients with an ultimate diagnosis of spinal epidural abscess and found diagnostic delay (defined as multiple emergency department visits or admission without a diagnosis and greater than 24 hours from presentation until definitive imaging) in 75% of cases. Only 13% of patients presented with the classic triad of fever, spine pain, and neurologic abnormalities, demonstrating that imaging must be performed with less clinically overt presentations to avoid misdiagnosis. Outcomes were worse in patients with delayed diagnosis, with 45% having persistent motor weakness, compared with 13% of those with more rapid diagnosis (odds ratio = 5.65, 95% CI 1.15 to 27.71). Darouiche35 reviewed the medical literature and concluded that the most important predictor of neurologic outcome in spinal epidural abscess is neurologic status beforesurgery—suggesting that diagnostic imaging before progression of neurologic signs and symptoms is essential to the improvement of outcomes. Because of the rarity of the condition, which occurs in only about 1 in 10,000 hospital admissions, validated clinical risk stratification guidelines do not exist; emergency physicians must rely on a high index of suspicion and low threshold for imaging whenever the diagnosis is suspected.
Methodologically rigorous trials of diagnostic imaging tests for spinal epidural abscess do not exist. Most published studies are retrospective case series, without the possibility of a control group or direct comparison of two diagnostic studies in the same patient. Because most studies rely on retrospective record review based on final diagnosis, the possibility of undiagnosed disease limits the validity of results. Patients with negative imaging tests are not generally included in these studies, and negative spine imaging studies are not verified against an independent diagnostic standard, such as clinical follow-up or surgical findings and cultures.
Despite the limited evidence, guidelines for spinal imaging have been promulgated by professional societies. The ACR (Table 15-5) ranks MRI of the spine without and with contrast as best (nine on a nine-point scale) in the infectious disease patient and seven of nine in the patient with painful myelopathy. CT earns a lower rating in the ACR criteria, between three and seven depending on the clinical scenario.36 Unfortunately, these guidelines suggest imaging for the patient with an existing myelopathy (neurologic deficit localizing to the spinal cord). As described earlier, the presence of neurologic deficits is associated with poor outcomes, so emergency physicians should consider imaging for suspected spinal epidural abscess in the absence of neurologic abnormalities. For example, fever and back pain may be sufficient indication to perform neurologic imaging when an alternative diagnosis has not been identified.
Table 15-5 American College of Radiology Appropriateness Criteria: Infectious Disease Patient with Myelopathy
| Procedure | ACR Rating | Comments |
|---|---|---|
| MRI spine without and with contrast | 9 | |
| MRI spine without contrast | 8 | |
| CT spine without contrast | 6 | If MRI unavailable or contraindicated |
| X-ray myelography | 5 | If MRI not feasible. Usually performed in conjunction with CT |
| CT spine with contrast | 5 | |
| Myelography and postmyelography CT spine | 5 | Problem solving or if MRI unavailable or contraindicated |
| Nuclear medicine In-111 white blood cell scan of the spine | 4 | May be combined with bone scan to diagnose osteomyelitis |
| X-ray spine | 3 | To assess stability |
From American College of Radiology: ACR Appropriateness Criteria.® Myelopathy. 2008. (Accessed at http://www.acr.org/SecondaryMainMenuCategories/quality_safety/app_criteria/pdf/ExpertPanelonNeurologicImaging/MyelopathyDoc8.aspx.) Reprinted with permission of the American College of Radiology, Reston, VA. No other representation of this material is authorized without expressed, written permission from the American College of Radiology. Refer to the ACR website at www.acr.org/ac for the most current and complete version of the ACR Appropriateness Criteria®.”Rating Scale: 1,2,3 Usually not appropriate; 4,5,6 May be appropriate; 7,8,9 Usually appropriate.Variant 6, Infectious disease patient. The full ACR criteria include other clinical variants with other imaging recommendations. Only the primary imaging recommendations (i.e., procedures rated as usually appropriate) and alternatives (i.e., procedure rated as may be appropriate) are included in this truncated list.
Computed Tomography for Detection of Epidural Spinal Abscess
Evidence for CT of the spine for detection of epidural abscess is extremely limited and provides no direct comparison with MRI. Brant-Zawadzki et al.37 reviewed 20 patients with a diagnosis of spinal infection who underwent evaluation with CT. They concluded that CT detected bony destruction in all patients with bony involvement and reported that CT found 12 of 15 cases of epidural and intradural abscess. However,9 of 20 patients (45%) had contrast CT myelography, in which a contrast agent is injected into the subarachnoid space, outlining the spinal cord and nerve roots. This technique improves the soft-tissue contrast of CT by clearly delineating the CSF space, allowing recognition of collections that protrude into it and better discrimination of the spinal cord from surrounding CSF. However, the technique is invasive and not routinely used. This study provides little information about the sensitivity of CT without directly injected cerebrospinal fluid (CSF) contrast.
Burke and Brant-Zawadzki38 retrospectively reviewed 19 patients with spinal infection and noted CT abnormalities of bone, paraspinal, and epidural tissues not seen on x-ray or nuclear medicine studies. Because this study lacks any analysis of patients with normal CT studies, or comparison with a diagnostic standard, no estimate of sensitivity or specificity can be derived. Both of these studies predate the wide clinical use of MRI, and neither study included MRI findings for comparison. Moreover, both predate the use of multidetector helical CT with multiplanar reformations. These technologic advances would likely improve the detection of small epidural spinal fluid collections, though rigorous studies with modern CT do not exist.
Magnetic Resonance Imaging for Detection of Spinal Epidural Abscess
No large and rigorous studies of MRI for suspected epidural abscess exist. Tung et al.39 performed a retrospective review of 18 patients with spinal epidural abscess undergoing MRI and reported that initial MRI findings of abscess length greater than 3 cm, peripheral enhancement with gadolinium, and narrowing of the spinal canal greater than 50% were associated with persistent pain, motor weakness, and incomplete functional recovery. Abnormal cord signal on MRI (p = 0.05) did not reach statistical significance (threshold < 0.05), but this is probably because of the poor statistical power of such a small study. More recent studies examining follow-up MRI imaging in patients with known epidural abscess show little correlation of imaging findings with clinical response to treatment. Kowalski et al.40 retrospectively compared follow-up MRI examinations at 4 to 8 weeks and clinical outcomes in 33 patients with spinal epidural abscess. Soft-tissue findings such as paraspinal inflammation and epidural enhancement were generally improved though not resolved on follow-up imaging, whereas bony abnormalities such as vertebral body enhancement and edema were often worsened. The authors were unable to demonstrate an association between follow-up MRI findings and clinical response to treatment, though again, the small study size may obscure a true association. Post et al.41 retrospectively studied 24 patients with spinal infections including epidural abscess. It is unclear from the study methods how the study subjects were identified—raising the strong possibility of bias, as described earlier. Well-defined abscess collections were noted to have high signal intensity on T2-weighted images. However, in 3 of the 24 patients (12.5%) in whom simultaneous meningitis was diagnosed, poorly defined heterogeneous T2 signal was noted, preventing diagnosis of epidural abscess with MRI; the diagnosis was made with CT myelography. The authors recommended MRI as the test of choice, with CT myelography performed in selected patients with MRI findings of inflammatory change without obvious abscess. However, because CT myelography was not performed in all patients, it is uncertain whether CT myelography might result in false-positive findings leading to unnecessary invasive procedures.
Karnaze et al.42 directly compared MRI and CT myelography in a retrospective review of 38 patients with a variety of suspected cervical and thoracic spine lesions. Reviewers rated the diagnostic findings of CT and MRI but were not blinded to the diagnosis and were able to review both CT and MRI for all cases, leading to the possibility of bias. Although the reviewers rated MRI as superior for a variety of findings, lack of blinding and technical changes in both modalities since that time render the information meaningless.
Modic et al.43 compared MRI with nuclear medicine imaging techniques in 37 patients with suspected vertebral osteomyelitis, though the method for selecting the patients is unclear. The authors concluded that MRI was 96% sensitivity and 92% specific, whereas nuclear medicine techniques were rated as 90% sensitive and 100% specific. However, the diagnostic standard against which the imaging studies were compared was not uniform, including final clinical, microbiologic, or histologic diagnoses. Use of a final clinical diagnosis raises the possibility of incorporation bias as described earlier because the clinical diagnosis may have been strongly influenced by MRI or nuclear medicine examination findings.
Dagirmanjian et al.44 retrospectively examined MRI findings in 37 patients with vertebral osteomyelitis or epidural abscess, proven by surgical culture or suspected based on positive blood cultures with no extraspinal source of bacteremia. They reported that 95% of involved spinal levels showed decreased T1-weighted vertebral body signal, 95% had loss of endplate definition, and 95% had increased disc T2-weighted signal. Contrast enhancement of the vertebral body and disc was seen in 94% of patients. Ring enhancement was also seen in patients with epidural abscess. Unfortunately, this study has numerous methodologic flaws that limit its validity. Because the level of spinal involvement was determined largely by MRI findings, all reports of the frequency of MRI abnormalities are compromised by incorporation bias. Moreover, the diagnostic standard for spinal infection in this study is poor, with 13 of 37 (35%) having no actual proof of spinal infection, only positive blood cultures. Moreover, the frequency of MRI abnormalities in patients without spinal infection was not reviewed. The sensitivity and specificity of MRI findings for spinal infection cannot be determined from such a study.
Ledermann et al.45 retrospectively reviewed the MRI of 46 consecutive patients with surgically and microbiologically proven spinal infection. The authors reported some MRI findings to be extremely sensitive for infection (Table 15-6), whereas other published findings of infection were insufficiently sensitive to be diagnostically useful to rule out infection. However, this study is severely limited in its methodology. The readers of the MRI were not blinded to the clinical information, including the level of pathology discovered at surgery. Knowing that a surgical lesion was found at a given spinal level, the radiologists were possibly more sensitive to MRI abnormalities at that level, causing them to falsely inflate the apparent sensitivity of MRI. In addition, because all patients in this study underwent surgical biopsy, they may represent an atypical spectrum of patients (sicker than average), who would be expected to have more advanced disease seen on imaging. This too would falsely elevate the apparent sensitivity of MRI. Because the study did not include patients without spinal infection, the specificity of MRI cannot be determined. It is possible that the studied MRI abnormalities are sensitive but too nonspecific to be of use if they occur frequently in patients without disease.
Table 15-6 Magnetic Resonance Imaging Findings Predictive of Spinal Epidural Abscess
| MRI Finding | Sensitivity (n) |
|---|---|
| Presence of paraspinal or epidural inflammation | 97.7% (43) |
| Disc enhancement | 95.4% (42) |
| Hyperintensity or fluid-equivalent disc signal intensity on T2-weighted MR images | 93.2% (41) |
| Erosion or destruction of at least one vertebral endplate | 84.1% (37) |
| Effacement of the nuclear cleft | 83.3% (15) |
| Decreased height of the intervertebral space | 52.3% (23) |
| Disc hypointensity on T1-weighted MR images | 29.5% (13) |
Adapted from Ledermann HP, Schweitzer ME, Morrison WB, Carrino JA. MR imaging findings in spinal infections: Rules or myths? Radiology 228:506-514, 2003.
A large multicenter study of MRI and CT in the setting of suspected epidural abscess would be required to establish the sensitivity and specificity of these modalities. A high-quality study would enroll consecutive emergency department patients with suspected spinal infection, would perform both imaging studies in all patients, and would apply a reliable and consistent diagnostic standard in all subjects, with microbiologic and surgical findings in patients with positive imaging results and follow-up of patients with negative imaging results. This is unlikely to occur given the rarity of the condition and the cost of such a study. Instead, emergency physicians will likely need to rely on limited case series, expert opinion from the ACR, and pragmatism. MRI is likely the best test; CT or CT myelography is an alternative in patients with contraindications to MR (described earlier). Nuclear medicine studies are a third option for localizing spinal and paraspinal inflammation.
Magnetic Resonance Imaging for Occult Hip Fracture
Hip fractures, including fractures of the femoral head and neck, intertrochanteric region, and subtrochanteric region, can be radiographically occult when nondisplaced, particularly in elderly patients with significant osteopenia. If not recognized and treated with surgery or non-weight-bearing status, nondisplaced fractures can become displaced, increasing morbidity.46-47 Rogers et al.48 found an association between early surgical fixation of fractures (before 72 hours) and improved survival, decreased infectious complications, decreased length of stay, and decreased costs. However, although the authors attempted to control for differences between patients receiving early or later fixation, the study’s retrospective methods likely obscure a baseline difference in the underlying health of the subjects, which in turn likely influenced decisions about timing of interventions and may have strongly influenced outcomes. A Cochrane meta-analysis of randomized trials did not show a survival benefit of surgery compared with nonsurgical treatment, though the five included studies totaled only 428 patients.47
Multiple imaging techniques can be applied when x-rays do not reveal a hip fracture but clinical suspicion remains high. Representative x-ray, MR, and CT images of radiographically occult hip fractures are shown in Figures 15-8 to 15-12.
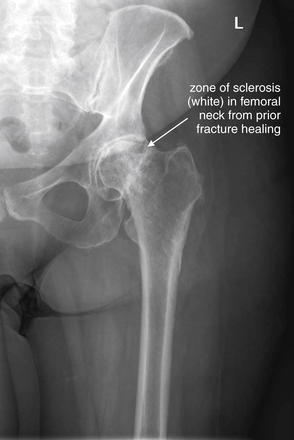
Figure 15-8 Possible hip fracture: Nondiagnostic plain films.
This patient had an extensive history of prior hip arthritis and injury, including percutaneous pinning of a prior fracture with subsequent removal of hardware. When she presented acutely with new hip pain, x-rays appeared little changed from prior examinations. The radiologist’s interpretation was post-traumatic and postsurgical deformities of the left femoral neck, with deformity of the left femoral head with increased sclerosis and irregularity, concerning for changes from avascular necrosis. No acute fracture was noted on plain x-ray, and magnetic resonance imaging was recommended (Figure 15-9).
(From Broder J: Musculoskeletal MRI in the emergency department: Using the evidence to maximize resource utilization. Emerg Med Pract 11(3):13, 2009.)
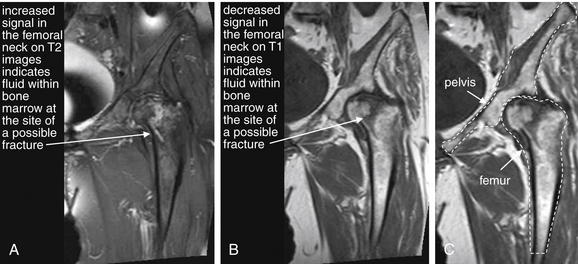
Figure 15-9 False-positive magnetic resonance imaging (MRI) of the hip?
Same patient as Figure 15-8, who had a history of previous hip fracture and presented with new hip pain and a nondiagnostic x-ray. A possible hip fracture was diagnosed by MRI. Bone cortex appears black on all MRI pulse sequences because of lack of resonating protons.A, T2-weighted coronal image of the hip. On T2-weighted images, normal fat in bone marrow appears dark, whereas fluid such as hemorrhage or edema at a fracture site appears bright. B, T1-weighted coronal image of the hip. Decreased signal on T1 images also marks the possible fracture site. C, T1 image with the pelvis and femur outlined for orientation.Intraoperatively, the patient had evidence of advanced degenerative joint disease affecting the hip on both the acetabular and the femoral side. There was significant evidence of femoral head collapse and avascular necrosis but no evidence of fracture. Ultimately, the patient underwent total hip arthroplasty—which may have been clinically required regardless of MRI findings, given the patient’s nonambulatory status.
(From Broder J: Musculoskeletal MRI in the emergency department: Using the evidence to maximize resource utilization. Emerg Med Pract 11(3):13, 2009.)
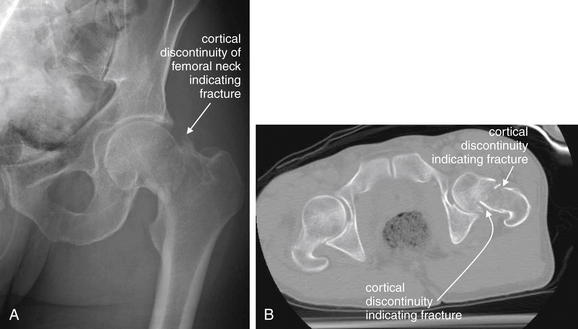
Figure 15-10 Hip fracture visible on x-ray and further characterized with CT.
A, X-ray of the left hip, with a cortical discontinuity of the femoral neck, indicating a fracture.B, Axial CT image of the pelvis without contrast, viewed on bone windows. Subtle cortical defects that may be difficult to recognize on x-ray may be found on CT. Despite wide use of CT for high-energy trauma, in the context of more isolated hip pain from falls, CT is currently recommended as “least appropriate” by the American College of Radiology (ACR), whereas magnetic resonance imaging is “most appropriate” by ACR criteria. The scant evidence for this recommendation is reviewed in the text.
(From Broder J: Musculoskeletal MRI in the emergency department: Using the evidence to maximize resource utilization. Emerg Med Pract 11(3):13, 2009.)
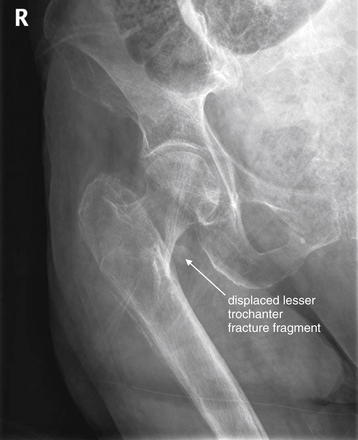
Figure 15-11 Intertrochanteric femur fracture, suspected on plain x-ray.
The radiologist noted a displaced fracture of the lesser trochanter and deformity of the proximal femur concerning for an intertrochanteric fracture. However, the patient is markedly osteopenic, and the intertrochanteric fracture line was not seen on x-ray. MRI was recommended by the radiologist (Figure 15-12).
(From Broder J: Musculoskeletal MRI in the emergency department: Using the evidence to maximize resource utilization. Emerg Med Pract 11(3):13, 2009.)

Figure 15-12 Intertrochanteric femur fracture, confirmed on magnetic resonance imaging (MRI).
Same patient as Figure 15-11. Here, an intertrochanteric signal abnormality consistent with fracture is clearly evident.Bone cortex appears black on all MRI pulse sequence because of lack of resonating protons, so cortical fractures are not actually seen. Fractures are suspected when fluid (edema or hemorrhage) is seen in the bone marrow at the site of an injury.A, A T1-weighted coronal image shows a relative lack of signal (black) from fluid in the fracture zone, whereas surrounding normal marrow fat has a high signal (white).B, A T2-weighted coronal image shows a bright signal from fluid in the fracture zone, whereas normal marrow fat appears dark.
The patient was ultimately managed nonoperatively because of dementia and significant cardiac comorbidities. Whether MRI influenced management in this case is unclear.
(From Broder J: Musculoskeletal MRI in the emergency department: Using the evidence to maximize resource utilization. Emerg Med Pract 11(3):13, 2009.)
The evidence comparing various imaging approaches is limited. The ACR recommends limited field-of-view MRI, Tc-99m bone scan with single photon emission computed tomography (SPECT), or repeat x-ray in 10-14 days as the most appropriate tests in a patient with normal x-ray but suspected insufficiency fracture because of osteoporosis or chronic steroid use, with a rating of nine of nine (most appropriate). Unfortunately, the ACR recommendation does not address the more common emergency department scenario of suspected acute traumatic fracture in the elderly patient with osteoporosis. The ACR grades CT scan as having an appropriateness of one—this disparity in “appropriateness” between MRI and CT does not appear justified by the quality of evidence, as we explain later. Delayed repeat x-rays are also of little use to the emergency physician attempting to determine patient disposition.
The ACR’s strong recommendation for MRI and against CT when hip fracture is suspected appears at odds with other imaging practices and evidence. In patients with severe multisystem trauma, CT scan is routinely used to evaluate for fracture of the cervical spine and pelvis and is believed to have excellent sensitivity. CT for these indications is reviewed in Chapters 3 and 13. MRI is not routinely performed to assess for fracture in that setting following normal CT. The multiplanar capability of CT and high spatial resolution (discussed earlier) are routinely accepted as sufficient to evaluate for cortical fracture. It seems counterintuitive that high-energy trauma should be cleared by CT while CT should be considered inadequate with ground-level, low-energy falls in the elderly, the common scenario for suspected hip fracture.
The clinical dilemma faced by the emergency physician caring for a patient with hip pain and no definite fracture by x-ray is common and real: admit the patient for further workup (difficult in a time of limited hospital beds and cost containment), hold the patient in the emergency department until MRI is available (potentially worsening the significant problem of emergency department crowding), perform alternative imaging in the emergency department, or discharge the patient with non-weight-bearing status until additional imaging is completed.
Let’s examine the evidence for MRI and other imaging strategies. High-quality studies directly comparing CT and MRI are limited: a PubMed search using the terms “MR CT hip fracture” with the limits “randomized controlled trial,” “clinical trial,” and “meta-analysis” finds one match. “MR hip fracture” with the same limits identifies three studies, two of which are not relevant to our clinical question.51 Our clinical question is really divided into several parts:
What Is the Sensitivity of X-ray for Hip Fracture?
X-ray is likely highly sensitive for hip fracture, between 90% and 99%. Parker retrospectively reviewed 825 consecutive admissions for hip fracture; 822 of the patients underwent initial hip x-ray. The authors found 10 cases of “misinterpretation” of the initial x-ray and 3 cases in which the fracture was not recognized, even in retrospect with knowledge of the final diagnosis. If these cases are all considered false-negative results, x-ray identified 809 of 822 patients with fractures (98.4%).46 Perron et al.52 reviewed the literature and found x-ray to be negative in only 1% to 9% of hip fractures. Dominguez et al.3 found that x-ray identified 219 of 243 (90%) patients with hip fractures. The additional 24 fractures were identified in 62 patients who underwent MRI during the emergency department visit. The authors performed structured follow-up 1 month after the initial evaluation in patients who did not undergo MRI and found no additional fractures. Use of this mixed diagnostic standard, although pragmatic, represents verification bias because not all patients with negative x-ray underwent MRI. Perhaps some patients with normal x-rays had no clinical fracture identified at follow-up but would have had MRI abnormalities consistent with fracture had they undergone initial MRI. Moreover, it is unclear whether all “fractures” identified by MRI were real; this assumes that all MRI abnormalities represent true-positive results, which is clearly not the case in other scenarios, as reviewed earlier in this chapter. Thus care should be taken in stating from this study that the sensitivity of x-ray is 90%—the true sensitivity might be higher or lower.
What Is the Sensitivity of Magnetic Resonance Imaging for Hip Fracture in Patients With Negative X-Ray?
MRI has been designated by the ACR49 as the “most appropriate” imaging study when clinical suspicion of hip fracture persists despite negative x-ray. However, the methodologic quality of studies of MRI is surprisingly poor. Most studies of MRI lack an appropriate diagnostic standard, often suffering from incorporation bias by assuming MRI findings to be correct. The number of patients studied is small. No studies directly compare MRI and CT using an appropriate independent diagnostic standard, as we explain later.
What Is the Sensitivity of CT for Hip Fracture in Patients With Negative X-Ray?
CT is designated in ACR guidelines49 as “least appropriate” (score of one out of nine). The ACR comments that axial imaging with CT may miss fractures in the axial plane and that reformatting of images is necessary—essentially ignoring that multiplanar, high-resolution CT reformations are now widely available. In the past, CT was thought to miss small impacted fractures and nondisplaced fractures parallel to the axial plane, but as described earlier, modern thin-slice CT with multiplanar reconstruction reduces the likelihood of missing such fractures (see Figure 15-5).53
Can Limited Field-of-View Magnetic Resonance Imaging Provide Rapid and Accurate Diagnosis of Hip Fracture?
MRI with a limited field of view focused on the hip and using T1-weighted pulse sequences primarily for fracture detection can be performed in less than 15 minutes at lower cost than wider MR views of the hip and pelvis with greater numbers of pulse sequences. Small studies of this technique assert 100% sensitivity and specificity but suffer from serious methodologic flaws, including wide confidence intervals and selection, incorporation, and verification bias.
Quinn and McCarthy54 prospectively evaluated 20 patients with suspected hip fracture and nondiagnostic x-rays, using a limited MR technique with a surface coil and a 7-minute protocol limited to a single coronal T1-weighted image. They report 100% sensitivity, but the validity of the final diagnosis is uncertain, given that the gold standard was the MRI and clinical outcome—a gross example of incorporation bias. Of the 13 patients diagnosed with fracture by this MR technique, 3 (23%) were treated nonsurgically; perhaps none of these patients had true fractures. The small number of patients in this study would result in broad confidence intervals for the reported sensitivity, even if the study findings are correct.
Rizzo et al.55 reported on 62 consecutive patients with negative hip x-ray, further evaluated with both MRI and radionuclide bone scan. The MRI protocol was limited to T1-weighted images and required less than 15 minutes to complete. The authors concluded that this limited MRI technique was as accurate for diagnosis as bone scan, but no independent diagnostic standard was applied.
Lim et al.56 reported on 57 patients with negative or equivocal hip x-ray who underwent limited MRI and found that a total of 56% of scans were positive for femoral neck fracture (14%), intertrochanteric fracture (9%), or other stable fractures (33%). As with the previous studies, however, MRI findings were assumed to be true positive, with no valid independent diagnostic standard.
Chana et al.57 reported on a series of 35 patients undergoing limited T1-weighted MRI of the hip using an 8-minute imaging protocol following nondiagnostic x-ray. They concluded that MRI revealed pathology in 29 patients, including 21 femur fractures. However, no diagnostic standard was applied to confirm MRI findings.
Studies Comparing Computed Tomography and Magnetic Resonance Imaging
A small number of studies have compared CT to MRI for the diagnosis of occult hip fracture. These studies are subject to many of the limitations described in our earlier discussion of research bias. Because the PubMed search described earlier found a single match, we must settle for a lower methodologic standard. Some existing studies do not examine emergency department patients, although they remain the best available evidence.
Stevens et al.51 compared the detection of fracture by radiography, CT, and MRI in patients participating in a large multicenter trial of operative therapy for osteonecrosis of the femoral head—a clinical scenario different from that of hip pain in an emergency department patient after a fall. MRI found only 38% of subchondral fractures identified by CT, even fewer than did x-ray (71%). The authors assumed CT to be correct in all cases, even stating that “on the corresponding CT scans, the fracture clearly breached the femoral cortex.” This use of CT as the diagnostic standard is a clear example of incorporation bias and limits the study validity. The authors overlooked the possibility that CT findings could represent false-positive results.
Lubovsky et al.58 compared the performance of CT and MRI in 13 patients undergoing advanced imaging following a fall with negative hip x-ray. The authors did not report whether their study was prospective or retrospective, and 7 patients underwent MRI with no CT for comparison. In the 6 patients undergoing both CT and MRI, the authors concluded that the CT was incorrect—though they had no independent diagnostic standard and assumed the MRI to be correct. In the remaining 7 patients, MRI results were again assumed to be valid. Studies such as this provide no scientifically valid information but are sadly frequently cited as evidence supporting MRI.
Pool and Crabbe59 retrospectively reviewed results of hip imaging in 25 patients with negative initial hip x-ray undergoing nuclear medicine bone scan, follow-up x-ray, or CT scan of the hip. Bizarrely, the authors concluded that early MRI could markedly reduce costs—though no patients in their study underwent MRI.
Verbeeten et al.60 retrospectively reviewed T1-weighted and STIR MRI images in 33 emergency department patients with negative initial hip x-ray. They reported 100% sensitivity of MRI, gauged against the standard of surgical intervention. The authors described high interobserver agreement and suggested cost savings because of rapid diagnosis and treatment. Because the clinical outcome of surgical intervention was likely influenced by MRI findings, this study suffers from incorporation bias.
What Is the Sensitivity of Nuclear Medicine Bone Scan for Hip Fracture?
Radionuclide bone scan was commonly performed for evaluation of radiographically occult hip fracture before the wide availability of MRI. Holder et al.61 performed a study of 179 radionuclide examinations, 105 retrospectively reviewed from 97 patients and 74 prospectively obtained in 63 patients. They found that 145 patients had normal or equivocal x-ray. In this group of patients, the sensitivity, specificity, and negative predictive value of bone scan were reported as 97.8%, 95%, and 99%, respectively—but we must view these values with significant reservations. Not all patients underwent the same gold standard for diagnosis, resulting in verification bias (discussed earlier in this chapter). Instead, the final diagnosis was based on a combination of surgical findings, appearance of follow-up radiographs, and clinical course, often determined by retrospective chart review. Because bone scan results were included in the data considered for the final clinical diagnosis, this study suffers from incorporation bias.
The authors also examined the sensitivity of bone scan in relation to the interval from injury to imaging. Keep in mind the earlier caveats about the diagnostic standard as we consider their results: In patients with visible fractures on x-ray, bone scan had been previously reported to have a limited sensitivity in the first 24 hours following injury of around 80%, with sensitivity rising to 95% by 72 hours after injury.62 Holder et al.61 found sensitivity to be high (100%) in scans performed less than 12 hours after injury, but only 8 patients were imaged in this early group. The sensitivity was reported as lower (60%) in the 14 patients imaged between 61 and 72 hours after injury, with intermediate sensitivities in patients imaged between 13 and 60 hours. Delayed imaging of this type is of little use to emergency department patients, and a lack of information about the true sensitivity of bone scan early after injury limits its utility in the emergency department.
Is Magnetic Resonance Imaging Cost-Effective in the Evaluation of Occult Hip Fracture?
Perhaps it goes without saying that the evidence for early MRI cost-effectiveness is limited, given how little rigorous data exists on the diagnostic accuracy of MRI for hip fracture. Some authors have argued that MRI appears cost-effective when delayed diagnosis, complications, the costs of other delayed testing, and costs of hospitalization are considered—but many assumptions underlying these cost estimates can be questioned.
Rubin et al.63 compared MRI to bone scanning to estimate expense and found MRI more cost-effective because of earlier diagnosis and reduced admissions. Their study included only 40 patients, however, and assumes that most or all patients with MRI negative for hip fracture can be discharged from the emergency department. In their study, all 20 patients undergoing bone scan were admitted for imaging, whereas 6 of 19 patients undergoing MRI were discharged. In some practice settings where MRI is not readily available, admission or transfer may be required for MRI, or a prolonged emergency department stay comparable to admission may occur. Many elderly patients may be unable to discharged, even if fracture is reliably excluded, because of inability to ambulate because of pain. In addition, comorbid conditions such as syncope may require hospital admission even if no fracture is present.
Bogost et al.64 studied MRI with large field of view in 70 patients with negative hip x-ray and noted it to reveal pelvic fractures or soft-tissue injuries in 23% and 74% of patients, respectively—although the impact on patient outcomes of these diagnostic improvements is unknown. Moreover, the larger field of view required to detect these additional injuries is more costly and time consuming to perform than the limited MRI examinations described earlier. In 1993 dollars, a limited MRI cost approximately $450, compared with $455 for bone scan and $797 for CT.54 A more comprehensive hip MRI cost $1280 in 1996 when technical and professional charges were included, compared with $460 for bone scan.63
In a Danish study, Verbeeten et al.60 found that the cost of MRI was twice that of the emergency department visit and greater than the cost of a day of hospital admission. Despite this, the authors found a slight cost advantage to early MRI, rather than admission and bone scan, again making the questionable assumption that negative MRI would allow immediate discharge. The cost savings also undoubtedly would vary depending on the threshold applied to work up patients with negative x-ray. If most patients undergoing MRI had positive findings and required admission, relatively little cost savings might be obtained, compared with admission and delayed imaging with bone scan.
Do Clinical Guidelines Exist to Determine Which Patients With Negative Hip X-rays Need Magnetic Resonance Imaging or Other Advanced Imaging?
As we have seen, the choice of advanced imaging for patients with suspected occult hip fracture is based on weak evidence from case series. An even more basic question for the emergency physician is “Which patients with normal hip x-rays should be evaluated further?” As we discussed earlier, x-rays likely identify 90% or more of hip fractures. Dominguez et al.3 found that 545 of 764 patients (71%) patients undergoing hip x-rays had no evident fracture, and only 24 of those 545 patients (4.4%) had hip fracture diagnosed with MRI or clinical follow-up. Clearly, a strategy that continued the evaluation in all patients with negative x-ray would be costly and have a low diagnostic yield. Instead, a subgroup of those patients with negative x-rays but high clinical probability deserves further evaluation. But what parameters should guide the emergency physician?
Clinical judgment appears to play a valuable role in selecting patients with negative x-ray for further imaging. In the study by Dominguez et al., 483 of the 545 patients with negative x-rays did not undergo any further imaging in the emergency department, based solely on individual clinician judgment because this was a retrospective study without a specific imaging protocol or decision rule. None of these patients were found to have a hip fracture at 1-month follow-up, indicating that clinical judgment had 100% negative predictive value in this emergency department population. Among those patients with negative x-ray who underwent emergency department MRI, 24 of 62 (38.7%) had fractures identified by MRI. Assuming that the MRI diagnosis was correct, this is an astonishingly high rate, suggesting that the emergency physicians were able to prospectively recognize patients with probable fracture despite normal x-rays, with a high positive likelihood ratio. If the emergency physician’s gestalt indicated that a fracture was likely, it was present in greater than one third of cases. Structured clinical decision rules such as the National Emergency X-radiography Utilization Study (NEXUS) and the Canadian Cervical Spine Rule do not perform significantly better than this (specificities of 37% and 45%, respectively, in the study by Stiell et al.).65 Perhaps even with focused study it may be difficult to derive a rule more sensitive and specific for hip fracture than the judgment of experienced clinicians. Nonetheless, it is a reasonable goal to articulate the factors that contribute to the judgment that further imaging is required.
Hossain et al.66 retrospectively reviewed records of 76 patients with negative hip x-ray followed by further evaluation with MRI. The authors found two factors to be associated with occult hip fracture: pain on axial loading of the limb and prefracture restricted patient mobility. Neither factor was sufficiently sensitive or specific to be clinically useful, with negative predictive values of only approximately 70%.
Chana et al.57 prospectively evaluated 35 patients with negative x-rays and high suspicion of hip fracture based on any of three factors:
All operative injuries identified by MRI occurred in patients older than 70 years, leading the authors to suggest this age as an independent prospective clinical criterion for MRI. However, only 10 patients in this study were younger than 70. This small study lacks appropriate statistical power to determine whether age less than 70 years is a useful clinical criterion to exclude injuries. Moreover, the authors did not report any follow-up or diagnostic testing in patients without the preceding three clinical factors, raising the possibility of missed injuries in this group. More study is required to refine clinical criteria for MRI in suspected radiographically occult hip fracture.
Recognizing the limited quality of available evidence, MRI is likely to be a relatively sensitive, specific, and cost-effective method of early detection of occult hip fracture. Multidetector CT has not been well-studied for this indication but is considered highly sensitive for fractures in other locations and is a reasonable alternative when MRI is not available or is contraindicated. Prospective trials comparing CT and MRI could better define the sensitivity, specificity, and cost-effectiveness of these diagnostic modalities. Delayed bone scan is another acceptable alternative in patients who cannot undergo MRI or in those who would require admission for pain control or evaluation of other conditions. More studies are required to determine which patients with negative x-ray require advanced imaging because routine imaging of all such patients would be costly and have a low diagnostic yield.
Magnetic Resonance Imaging for Occult Scaphoid Fracture
Fractures of the scaphoid bone are an important and sometimes difficult diagnosis in the emergency department. The proximal scaphoid is supplied with blood primarily via branches of the radial artery that enter the distal scaphoid and perfuse the proximal pole in a retrograde fashion. Scaphoid fractures threaten this blood supply and can lead to avascular necrosis, fracture nonunion, and chronic arthritis. These outcomes may occur despite timely diagnosis and treatment; the risk for nonunion has been reported as 5% to 12% even with appropriate treatment.67 However, when delay in diagnosis occurs, poor outcomes may be attributed to misdiagnosis. Missed scaphoid fractures are a frequent cause of litigation and payouts for medical malpractice,68 accounting for 41% of claims involving the wrist, according to one source.69 Most scaphoid fractures are likely seen with x-ray, but occult scaphoid fractures, clinically suspected but not seen on plain x-ray, remain a major concern in emergency medicine. Faced with the possibility of an unseen fracture, emergency physicians historically have immobilized patients in thumb spica splints, with outpatient imaging repeated to determine the presence of fracture. Because only 7% to 40% of suspected occult scaphoid fractures are ultimately confirmed, most patients with possible injury are subjected to needless immobilization and follow-up, which may be costly in terms of lost work productivity and additional medical expenses.70-73 Immediate MRI in the emergency department has been proposed as an option to reduce diagnostic delay and unnecessary immobilization. Early or emergency department MRI might detect not only occult scaphoid fractures but also other clinically important injuries, such as nonscaphoid fractures of the wrist and forearm and soft-tissue injuries requiring operative repair. Early detection might lead to earlier appropriate therapy and better outcomes. Conversely, normal MRI might rule out these injuries, allowing discontinuation of immobilization, earlier return to work, and a decreased need for follow-up.
In this section, we consider the diagnostic options for suspected occult scaphoid fracture, with a focus on the evidence for MRI. We compare MRI with the alternative management schemes, including immobilization until repeat x-ray in 10 to 14 days, nuclear scintigraphy (bone scan), and immediate CT scan. X-ray, MR, and CT images of acute wrist injuries are shown in Figures 15-13 to 15-16.
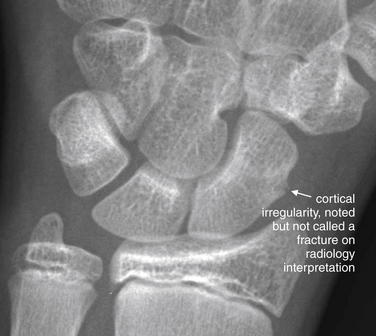
Figure 15-13 Scaphoid fracture: Nondiagnostic x-ray.
This 13-year-old soccer goalie fell on his outstretched wrist while blocking a shot. He had direct tenderness to palpation in the anatomic snuffbox. A series of x-rays were taken over 3 weeks, with no definite fractures appreciated. A subtle cortical irregularity was noted by the radiologists but not felt to represent a fracture. Follow-up magnetic resonance imaging confirmed a fracture (Figure 15-14).
(From Broder J: Musculoskeletal MRI in the emergency department: Using the evidence to maximize resource utilization. Emerg Med Pract 11(3):15, 2009.)
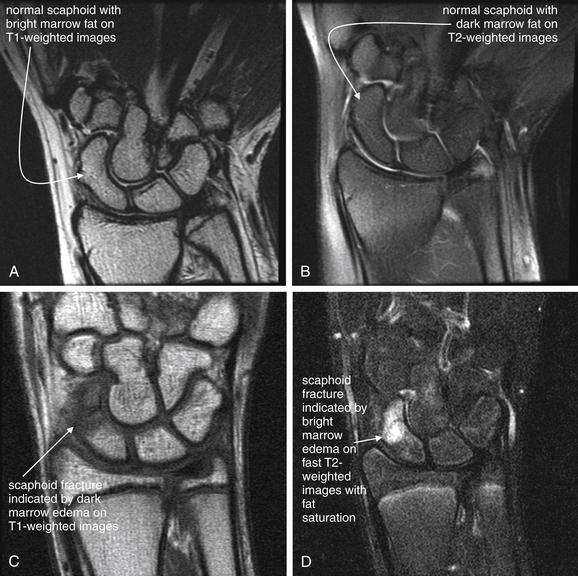
Figure 15-14 Scaphoid fracture, with normal magnetic resonance imaging (MRI) for comparison.
Bony cortex is black on all MRI sequences because of a lack of resonating protons. As a consequence, cortical bone fracture is not seen on MRI. Fracture is suspected when marrow fluid consistent with edema or hemorrhage is seen at a site of injury. On T1-weighted images, fat is bright, whereas fluid is dark. On T2-weighted images or fast T2 images with fat saturation, fat is dark, whereas fluid is bright.A, Normal scaphoid viewed on a T1-weighted thin coronal slice, showing homogeneous marrow fat (bright white).B, Same patient with a normal scaphoid seen on a T2-weighted coronal slice, showing homogeneous marrow fat (dark gray).C, Scaphoid fracture from the same patient as Figure 15-13. A T1-weighted coronal slice shows fluid within the marrow space (dark) at the site of fracture.D, Scaphoid fracture from the same patient as Figure 15-13. This fast T2-weighted image includes fat saturation. The coronal slice shows fluid within the marrow space (bright).
(From Broder J: Musculoskeletal MRI in the emergency department: Using the evidence to maximize resource utilization. Emerg Med Pract 11(3):15, 2009.)
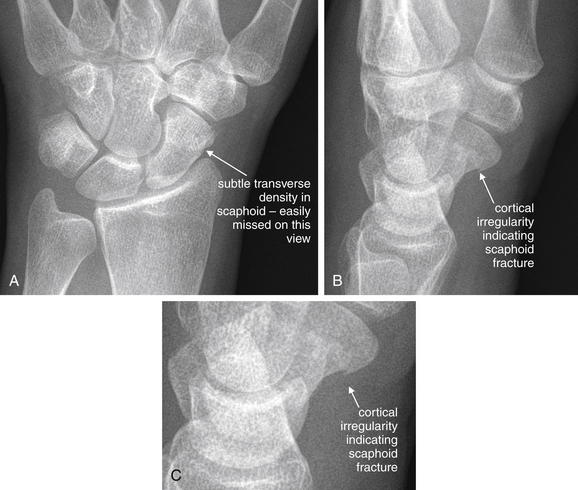
Figure 15-15 Scaphoid fracture: Subtle x-ray.
This 21-year-old female fell backward onto her left wrist and noted pain and reduced range of motion. Her x-ray shows a subtle nondisplaced transverse fracture of the distal pole of the scaphoid. Computed tomography from the same patient is shown in Figure 15-16.A, An anterior–posterior view shows a subtle abnormality—emphasizing the need to look at multiple orthogonal views when assessing for fracture.B, The lateral view shows a tiny cortical defect, indicating fracture.C, Close-up from B.
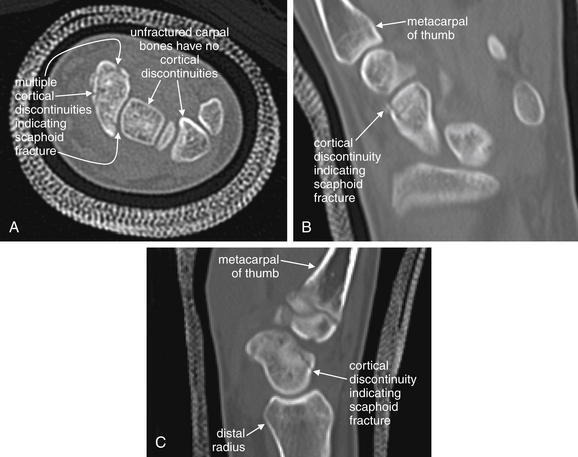
Figure 15-16 Scaphoid fracture: CT.
Same patient as Figure 15-15. Noncontrast CT was performed to characterize further the subtle fracture seen on x-ray. Multiplanar reconstructions from CT can assist in recognition of fractures that are subtle or invisible on x-ray. Ultimately, this patient was treated nonoperatively with thumb spica casting.A, An axial image shows an irregular cortex of the scaphoid. Compare with the intact cortices of the other carpal bones.
B, In this coronal image, the patient’s wrist is tilted slightly, so most carpal bones are not visible. The fracture is again seen.C, A sagittal image again shows cortical breaks.
For all imaging modalities, determination of sensitivity and specificity is complicated by the uncertainty of the appropriate diagnostic standard. For example, as in the cases we considered earlier in this chapter, it is unclear whether MRI signal abnormalities always indicate true-positive results. When x-ray, CT, or nuclear scintigraphy results are discrepant with MRI findings, it is uncertain which modality reflects the truth. A researcher’s choice in selecting the gold standard often reflects biases rather than even-handed consideration of the scientific evidence.
In its appropriateness criteria, the ACR recommends casting with follow-up x-ray in 10 to 14 days or MRI as the most appropriate imaging modalities for suspected acute scaphoid fracture following normal plain x-rays. Both approaches are given a score of eight on the one-to-nine scale used by the ACR, with nine being most appropriate.74 The ACR credits CT an appropriateness score of four unless MRI or casting and follow-up are contraindicated.74 This discrepancy in appropriateness scores might be taken to imply that strong evidence shows the superiority of MRI to CT. However, a careful review of the evidence considered by the ACR and other published work shows this is not the case, as we explain later. The limited evidence supporting the superiority of one diagnostic protocol over others is reflected in the marked practice variation shown in one international survey of 105 hospitals. The usual diagnostic examination after normal x-rays was MRI in 31 (30%), CT in 19 (18%), and scintigraphy in 14 (13%) of 105 examinations. Some hospitals used no formal protocol, leaving the choice of modality to the individual practitioner. Others used a combination of modalities, including MRI to confirm negative CT findings.75
As we did for MRI of the hip, let’s consider several basic questions to place in context the value of MRI in diagnosis of occult scaphoid fracture:
How Sensitive Are Initial X-rays in the Diagnosis of Scaphoid Fracture?
As we discussed earlier in this chapter, a high-quality study of any diagnostic test requires the consistent application of a reliable diagnostic standard in all patients. In the case of x-ray and scaphoid fracture, the gold standard is not clear, and most studies also fall short of this ideal by evaluating only a small percentage of patients with negative x-rays with additional imaging. This leads to verification bias (described earlier), with potential effects on the apparent sensitivity of x-ray. First, because many patients with negative x-ray undergo no diagnostic confirmation, some of these negative x-rays may be false negatives. If all patients with negative x-rays who undergo no confirmatory testing are assumed to have true-negative results, the sensitivity of x-ray may be wrongly inflated. Second, because only a select few high-risk patients may be subjected to advanced imaging techniques, selection and spectrum bias are likely to occur, with a large number of patients found to have injuries despite negative initial x-ray. When injuries are detected in this group, this may suggest that the sensitivity of x-ray was very low, if a similar rate of injury is assumed in all patients with negative initial x-rays. However, the selection- and spectrum-biased group undergoing follow-up imaging likely does not represent the rate of injury in the original population. Relying on the rate of injury in this group results in underestimation of the sensitivity of x-ray in the larger population.
With this said, what is the sensitivity of initial x-ray, and what is the rate of scaphoid fracture identified in patients with negative initial x-ray? The sensitivity of x-ray is variously reported as 59% to 79%, and 7% to 40% of patients with normal initial x-rays are shown to have scaphoid fracture with some form of follow-up.76-77 This wide range undoubtedly is related to the variable diagnostic standards applied in various studies and to the selection and spectrum biases described earlier. In studies that include only patients who follow up because of continued pain, the likelihood of fracture is inflated. Asymptomatic patients likely do not have fractures but are often excluded from these studies.
Are Follow-up X-rays Sensitive for Initially Radiographically Occult Scaphoid Fracture?
Determining the sensitivity of follow-up x-ray is complicated by the same issues of diagnostic standard that thwart studies of initial x-ray. An independent standard is needed, and it is unclear whether MRI findings, follow-up x-ray, or clinical outcome should be accepted as proof of fracture. Not surprisingly, authors variably selected the diagnostic standard.
Breitenseher et al.78 retrospectively studied 42 patients with negative initial plain x-rays but clinical suspicion of scaphoid fracture, using 6-week follow-up x-rays as the diagnostic standard. MRI at 7 days after injury revealed an apparent fracture in 33%. Compared with follow-up x-ray, MRI was nearly 100% sensitive and specific. Several problems with this study limit its application to emergency department patients. First, the study is small and involves a biased sample, not a consecutive emergency department sample of patients with wrist trauma. Second, MRI performed at 7 days after injury may differ significantly from MRI performed in the emergency department. Perhaps early emergency department MRI would show more signal abnormalities, actually representing edema but not fracture, and would therefore be too nonspecific to be clinically useful. In addition, MRI performed too early in the course of injury evolution would possibly be less sensitive, if signal abnormalities representing fracture take hours to appear.
Gabler et al. prospectively enrolled 121 consecutive patients with wrist injury and negative initial x-rays, performing MRI and clinical follow-up in all patients. This study lacks a single diagnostic standard; in some cases the final clinical diagnosis is considered “correct,” whereas in other cases MRI appears to be the gold standard. The authors reported that 28 occult scaphoid fractures were identified, a rate of 23% in patients with nondiagnostic initial x-ray. The authors noted that MRI diagnosed additional occult injuries; including 15 other fractures of carpal bones; 26 other bone injuries, including distal radius, ulna, and metacarpal fractures; and “bone bruises”—MRI signal abnormalities of uncertain clinical importance. Some patients with bone bruises and one with a reported triquetrum fracture diagnosed by MRI were asymptomatic at follow-up and had no further treatment—again, calling into question the importance or clinical validity of MRI. MRI also revealed other soft-tissue injuries including cartilaginous and ligamentous injuries. The authors concluded that only 30% of the detected scaphoid fractures were truly initially occult because 70% were recognized on review of the initial x-rays by “experienced surgeons”—but this reflects a retrospective review of images without blinding to the presence of continued symptoms and likely exaggerates the diagnostic accuracy of x-ray. Several additional methodologic concerns limit application of this study to the emergency department population. We cannot determine the sensitivity of initial x-ray from this study because the number of patients with positive initial x-rays is not reported. Moreover, the rate of scaphoid injury in this population may not be similar to that in U.S. emergency departments because this study examined patients evaluated by a trauma service “fracture clinic” in Austria.76 MRI in this study was performed an average of 3 days after injury, limiting our ability to assess its sensitivity and specificity if performed immediately in the emergency department. The authors suggested that clinical examination and repeat radiography are sufficient in most cases, although their protocol was resource intensive, with three follow-up examinations at 10, 24, and 38 days by hand surgeons and prolonged immobilization of patients. Oddly, the study abstract reports randomization of patients, though the study protocol described in the manuscript does not involve randomization.76
Low and Raby compared 50 sets of initial (negative) and follow-up x-rays with paired MRI as diagnostic standard, using a retrospective sample of 50 patients. Four expert readers reviewed the follow-up x-rays for scaphoid fracture, and the sensitivity and specificity of the readers varied widely, from 9% to 49% and 80% to 93%, respectively. Not surprisingly, given these broad variations in accuracy among readers, the interobserver reliability proved to be poor, with a coefficient of 33%. An interobserver reliability coefficient of 60% is generally considered the threshold for a “reliable” diagnostic test. The authors concluded that x-rays are too insensitive, nonspecific, and unreliable to be used as a method for confirming or ruling out scaphoid fracture. However, it is unclear whether patients with MRI abnormalities that were not detected on follow-up x-ray would be harmed by misdiagnosis. The authors did not report the treatment or outcome in patients with MRI abnormalities, and it is possible that most did not require any specific intervention. If patients with negative follow-up x-rays have good clinical outcomes regardless of MRI appearance, then x-ray may be diagnostically sufficient. In addition, the patient population sampled was not representative of an emergency department population because only those (presumably high risk) patients who underwent both follow-up x-ray and MRI were included.79
Are Follow-up X-rays Adequate to Assess for Scaphoid Fracture in Children Before Skeletal Maturity? Do These Patients Require Magnetic Resonance Imaging or Other Advanced Imaging?
Given the limited evidence for follow-up x-rays in adults (described earlier), it should come as little surprise that controversy remains about the utility of x-ray in children. X-ray should be less sensitive in children with skeletal immaturity because bone density and mineralization are incomplete. The age at which ossification of the scaphoid and other carpal bones occurs varies. The scaphoid begins ossification around 5 to 6 years of age and completes ossification around 13 to 15 years. Before completion of ossification, the scaphoid may be nearly invisible on x-ray.80 Fortunately, pediatric scaphoid fractures are thought to be uncommon, although it is possible that this simply reflects underdiagnosis.81 Large methodologically strong studies in children are lacking. Cook et al.82 examined 18 pediatric patients (8 to 15 years old) undergoing wrist MRI within 2 days of injury. MRI identified six fractures and four cases of bone marrow edema. The authors asserted that marrow edema did not represent fracture and that MRI was 100% sensitive—though the same questions about diagnostic standard exist. The role of MRI in pediatric evaluation remains uncertain. Immobilization and clinical follow-up remain viable options.
How Sensitive Are CT and Magnetic Resonance Imaging for Scaphoid Fracture and Other Wrist Injuries?
The ACR82a rates CT as four of nine in its appropriateness for evaluation of suspected scaphoid fracture following normal x-rays, below both MRI and casting with repeat x-ray in 10 to 14 days. However, CT scan has several potential advantages in the emergency department. Unlike MRI, CT is widely available at all times of day in many emergency departments. Wrist CT for assessment of fracture does not require contrast administration. The radiation exposure from extremity CT is of relatively little clinical concern because the extremities are generally less radiosensitive than organs such as the breast, thyroid, and gonads. Pregnant patients can undergo extremity CT with essentially no radiation exposure to the fetus.74 However, CT scan does not image ligaments and cartilage structures of the wrist that may require surgical repair, a disadvantage relative to MRI—but also of repeated x-rays. Let’s examine some studies evaluating the diagnostic performance of CT and MRI.
Kusano et al.83 reported MRI findings in 52 consecutive patients with suspected scaphoid fractures—though no clear diagnostic standard was defined. MRI findings were interpreted as indicative of fracture in 18 of 52 patients (33%). In 16 of the 18 patients with abnormal MRI, CT scan was also performed and demonstrated 16 fractures. Because CT was not performed in patients with normal MRI, it is uncertain whether it would have revealed injuries missed by MRI—a case of verification bias. The clinical significance of the imaging findings on both CT and MRI in these cases is uncertain.
Brydie and Raby73 studied 195 patients undergoing MRI within 14 days for occult scaphoid fracture after negative x-ray. Based on MRI, 19% of patients had scaphoid fractures, 14% had distal radius fractures, and 5% had other carpal bone fractures. According to a survey of the treating clinicians, management was altered in 92% of patients—though it is unclear whether clinicians were required to state their anticipated management before MRI results were available. Moreover, it is not clear that changes in management benefited patients. For example, MRI may have shown signal abnormalities, prompting prolonged immobilization, when no cortical fracture was actually present. No independent diagnostic standard was established in this study, so the accuracy of MRI findings is unknown.
Kumar et al.84 prospectively enrolled patients with clinically suspected scaphoid fracture but negative x-ray, performing MRI within 24 hours. In the 22 patients enrolled, MRI diagnosed six scaphoid fractures, two distal radius fractures, and a hamate fracture. Of the enrolled patients, 13 had no fracture discovered by MRI. The authors concluded that early MRI prevents unnecessary immobilization and is “sensitive” for occult scaphoid fracture, but this study is quite limited. An independent diagnostic standard is not defined in this study; MRI abnormalities are assumed to be real, and negative MRI is assumed to be correct. This incorporation bias is a serious design flaw that limits the study validity.24 In addition, selection bias may play an important part in this study because consecutive patients were not enrolled. Finally, small studies such as this with no reported adverse outcomes should include confidence intervals rather than reporting a “0%” misdiagnosis rate. Confidence intervals can be estimated by the 3/n methodology when n > or = 30 subjects have been enrolled.85 In this case, if no adverse events occur in n subjects, the upper 95% confidence interval limit is 3/n. For example, if no adverse events are seen in 30 subjects, the upper 95% confidence interval limit is 3/30, or 10%. A larger sample, 99 subjects, gives a narrower limit of 3/99, or 3%. If 300 subjects are enrolled but no adverse events occur, the likely limit of adverse events falls to 3/300, or 1%. Naturally, in a small study such as the Kumar et al. study described here, the confidence intervals are wide, and we cannot be certain that MRI would safely identify all patients with fractures in a larger study.
Groves et al.86 reported a case of scaphoid fracture detected with follow-up nuclear scintigraphy, MRI, and 6-week follow-up x-ray but missed by 16-detector CT using 0.75-mm slice thickness and 0.5-mm multiplanar reconstruction. Many problems limit this report. The MR, nuclear medicine, and x-ray images were not interpreted with blinding to one another, so the interpretation of one set of images was influenced by the others. The patient underwent casting because of the imaging abnormalities, but as usual we cannot know with certainty whether a clinically important fracture was present. Case reports suffer from many limitations in general, representing the lowest echelon of medical evidence. Still, the possibility that CT could miss a real scaphoid fracture should be considered. The authors concluded that CT may miss fractures when neither cortical nor trabecular bone displacement are present, though it is unclear how common or clinically important this scenario may be.
Karle et al.87 reviewed 30 patients with scaphoid nonunion and noted that 70% had been seen by a physician and either misdiagnosed or treated nonoperatively without success. They suggest that all suspected scaphoid fractures undergo CT imaging to guide treatment decisions, with nondisplaced waist fractures treated with casting. Proximal fractures, and comminuted or displaced fractures seen on CT would undergo operative therapy by their classification. However, these recommendations have not been validated by any study of outcomes or compared with management based on x-ray or MRI findings.
Lozano-Calderon et al.88 compared the performance of x-ray alone, CT alone, or the combination of x-ray and CT in determining the presence of scaphoid fracture displacement. Six observers reviewed imaging studies from 30 cases of “known” fracture, 10 displaced and 20 nondisplaced. Intra and interobserver reliability was higher for CT or CT with x-ray compared with x-ray alone. The authors reported the sensitivity and specificity of the three categories of imaging, but the diagnostic standard is unclear, making the validity of these values uncertain. This study includes patients with fractures visible on x-ray, so it is impossible to extrapolate to patients with occult scaphoid fracture.
Memarsadeghi et al.71 prospectively compared CT scan and MRI with a gold standard of follow-up x-ray at 6 weeks in 29 patients with suspected scaphoid fracture but normal initial x-rays. CT and MRI were performed within 6 days of trauma, again limiting the applicability of results to the performance of CT or MRI in the emergency department. CT was performed using narrow collimation (0.5 mm, the acquired slice thickness) and thin multiplanar reconstructions (0.7 mm, the thickness of the digitally reconstructed slices). MRI was performed with a 1-tesla machine using STIR, spin–echo T1, and gradient–echo T2 pulse sequences. Follow-up x-rays demonstrated eight cortical fractures and three trabecular fractures in 11 patients (38%). No false-positive results were obtained with CT or MRI. CT identified all cortical fractures but failed to detect trabecular fractures. Early MRI detected all patients with fractures but did not demonstrate five of eight cortical fractures. The authors thus reported the sensitivity of CT for cortical fractures as 100% but the sensitivity of MRI as only 38%. This small study suggests a complementary role for CT and MRI, with CT being superior for cortical injury and MRI for trabecular injury. However, the clinical importance of fractures solely involving the trabeculae is uncertain. Perhaps detection of cortical fractures is clinically sufficient, in which case CT may be adequate. Given the wide confidence intervals resulting from this small study, which overlap for CT and MRI, it is impossible to say with certainty that one modality is superior to the other. Further study is required.
Cruickshank et al.89 prospectively evaluated 47 nonconsecutive emergency department patients with suspected scaphoid fracture but negative x-ray. Patients were immobilized in a plaster cast and underwent CT within 24 hours. The diagnostic standard was the clinical diagnosis at 10 days, including information from clinical exam, x-ray, and MRI—which was not performed in all patients. The study thus suffers from verification bias. The authors asserted that CT identified 17 of 18 carpal fractures (94.4% sensitive and 100% specific) and detected all scaphoid fractures. One patient with a trapezium fracture detected by CT had a second fracture of the capitate, detected only by MRI. Whether this abnormality represented a real fracture and whether patient management would be altered by the additional diagnosis remain in question. This small study requires validation in a consecutive, unbiased sample, with a more consistent diagnostic standard and a larger sample size to narrow confidence intervals.
Nguyen et al.90 retrospectively reviewed CT scan results from 118 patients with suspected occult scaphoid fracture visiting a fracture clinic in follow-up after an initial emergency department visit. CT (performed within 1 week of injury in 70% of patients) revealed scaphoid fractures in 22% of patients, as well as capitate, triquetral, and radial fractures in an additional 10%. The authors concluded that CT in this setting has a high diagnostic yield. However, the population of patients may differ substantially from those seen in an emergency department because it represents a high-risk group who were not only referred for follow-up but carried through, possibly because of continued symptoms. Ubiquitous use of CT in the emergency department for patients with negative wrist x-ray might have a much lower diagnostic yield. This study has no diagnostic standard; all imaging abnormalities demonstrated by CT are assumed to represent real and clinical important fractures.
Although CT appears to be a promising modality, a well-designed, large, prospective emergency department study with consecutive enrollment, uniform application of a diagnostic standard, and evaluation of clinical outcomes has not been performed.
How Sensitive Is Radionuclide Scintigraphy (Bone Scan) for Scaphoid Fracture?
Radionuclide scintigraphy is a long-standing technique to assess for scaphoid and other occult fractures. In the presence of injury, increased blood flow and radionuclide signal occurs. The clinical importance of such increased signal is not clear. For example, bruising of bone without unstable cortical fracture might result in a similar appearance to clinically significant cortical injury. It is not certain that management decisions should be based on scintigraphy findings, although normal scintigraphy likely excludes injury.
Groves et al.91 studied 51 patients undergoing both 16-detector multislice CT and 99Tcm methylene diphosphonate scintigraphy on the same day. The investigators quantified the radionuclide uptake in all patients and compared uptake in patients with fractures seen on CT and those with no fracture seen on CT. They found that 16 patients had apparent fracture on CT and matching scintigraphic abnormalities. Another 7 patients had abnormal scintigraphy but normal CT. In these patients, the mean scintigraphic activity was approximately half of that in patients with abnormal CT, suggesting that a threshold could be identified to discriminate cortical fractures from bone bruising or other clinically unimportant injuries. Patients with no abnormalities on CT but with scintigraphic abnormalities had no fractures identified on follow-up MRI or radiographs. Although intriguing, these findings have not been validated in a larger study, and the clinical relevance is uncertain. Though a reliable threshold to discriminate cortical fractures from bruising would improve the specificity of nuclear scintigraphy, it might remain more practical to perform CT. If CT is considered the diagnostic standard in this study, then 7 of 35 patients with normal CT had a false-positive nuclear scintigraphy study—a 20% rate that could lead to unnecessary immobilization, follow-up, additional imaging, or even surgery.
A review in the Best Evidence Topic series compared scintigraphy to MRI for the diagnosis of occult scaphoid fractures.92 Using a Medline search from 1966 until March 2005, 11 studies were identified, with only 4 studies relevant to the question, “In an adult with a clinically suspected scaphoid fracture that is not evident on plain x-ray, is magnetic resonance imaging better than bone scintigraphy at reaching a diagnosis?” Only 145 patients had been enrolled in studies directly comparing the two modalities, with variable diagnostic standards. Based on this limited evidence, MRI appears to be slightly more accurate and can anatomically localize soft-tissue injuries, guiding surgical planning. MRI is also faster than bone scan.92 Nonetheless, this review highlights the need for large, multicenter trials with appropriate power, well-defined diagnostic standards, and relevant clinical outcomes. Additional small studies with poor methodology are unlikely to provide reliable data comparing scintigraphy to other modalities.
Is Magnetic Resonance Imaging Cost-Effective for Evaluation of Suspected Scaphoid Fracture?
Our discussion has highlighted the limited evidence for MRI in scaphoid fracture. Uncertainties remain about the clinical significance of abnormalities on MRI, which could in some cases represent false-positive results and prompt unnecessary treatment. Given these limitations, can we determine whether emergent MRI is a cost-effective strategy?
Cost-effectiveness estimates typically include direct costs of medical imaging and indirect costs including follow-up medical diagnostic testing and treatments. Moreover, nonmedical economic costs such as lost productivity because of unnecessary immobilization must be considered, though these costs can be difficult to estimate accurately. Cost-effectiveness of a diagnostic strategy may vary widely depending on disease or injury prevalence, the sensitivity and specificity of the diagnostic tests used, and the costs of over treatment and undertreating. For example, early imaging might be cost-effective in a working population, where lost wages might be a significant cost associated with delayed diagnosis and unnecessary prolonged immobilization. However, in a population of high school students or retired workers, this cost might be negligible. Moreover, if MRI were performed in every patient with wrist trauma and negative x-rays, rather than in a select few with a high rate of injury, the cost of care might be increased. The costs associated with MRI may vary tremendously depending on the specificity of the test, which, as we saw earlier, remains in question. MRI enthusiasts recommend early MRI to allow early detection of injury (when MRI is positive) and to limit unnecessary immobilization (when MRI is negative). However, this assumes high sensitivity and specificity of MRI. If MRI results in frequent false-positive findings (e.g., signal abnormalities that indicate edema but not clinically important fracture), early MRI might actually increase the rate of immobilization and requirement for follow-up. Most existing studies of MRI sensitivity and specificity examine MRI after 1 or more days of delay after injury. It is possible that very early MRI could perform quite differently, for example, becoming nonspecific by identifying some degree of edema in all patients with wrist trauma and pain. With these issues in mind, let’s consider some studies of cost-effectiveness of MRI.
Raby93 used low-field MRI with a dedicated extremity coil in 56 patients within 4 days of injury and 53 patients with persistent symptoms at 10 days to 6 weeks. Seven scaphoid fractures were identified in the early MRI group, with 6 radius and 4 other fractures. In the late MRI group, 14 scaphoid, 9 radial, and 3 other fractures were identified. The author’s cost analysis suggests lower total costs with early, rather than later, scanning. This study assumes all MRI findings to be correct. If extended to an emergency department population, it is unclear whether the proportion of positive and negative imaging studies would be similar, and costs might differ markedly as a result.
Saxena et al.94 compared the cost of usual care (immobilization, clinical follow-up, and repeated x-rays) with early MRI, finding an advantage for early MRI. Gooding et al.95 performed a similar estimate, finding that early MRI was less expensive (NZ$470 vs. NZ$533). Both of these models are limited by numerous assumptions about direct and indirect costs, test sensitivity, and injury prevalence.
Brooks et al.96 randomized 28 patients with suspected but radiographically occult scaphoid fracture to standard care (immobilization, clinical follow-up, and repeat x-rays), with or without MRI. In an accompanying cost-effectiveness analysis, the MRI strategy was slightly more expensive ($594) than usual care ($428), though not statistically different. The small study size means that a real difference in costs might have existed but failed to be detected because of lack of statistical power, with only 17 patients in the control group and 11 in the MRI group. The cost per day saved by MRI by preventing unnecessary immobilization was $44—although such cost savings might vary wildly in a different population because this depends on the patient’s income, job requirements, and ability to perform productively despite immobilization. Clearly differences in these costs would occur between a world-class concert violinist and a retired or unemployed worker. Moreover, this study examined MRI within 5 days of injury; an immediate MRI in the emergency department strategy might result in more savings by eliminating more days of immobilization. The costs of the two strategies would also depend on the prevalence of fractures; fewer days of immobilization would be saved if most patients were found to have fractures.
Jenkins et al.70 estimated mean costs of five diagnostic strategies for occult scaphoid fracture in the United Kingdom in 2006, assuming best-published diagnostic performance of each test: immobilization and 2-week follow-up (£144), MRI (£302), radionuclide bone scan (£243), CT (£202), and ultrasound (£113). The investigators also estimated costs using worst-published diagnostic performance, with similar results. Although the investigators attempted to account for variations in the reported sensitivity and specificity of each imaging strategy in the medical literature, this may not reflect the real-world performance of any of these tests. Moreover, the reported sensitivity and specificity of each modality are largely based on flawed studies such as those we reviewed earlier in this chapter. The cost estimates in this model also assume that a “negative” advanced imaging study would terminate the workup and associated medical costs, which may not be true in a real patient with persistent symptoms. This study also does not incorporate nonmedical costs of immobilization and lost productivity, which would be expected to increase the cost of the follow-up strategy compared with advanced imaging strategies.
Current studies of diagnostic imaging for occult scaphoid fracture suffer from significant methodologic flaws. MRI is likely to be sensitive for scaphoid fracture, other carpal and forearm fractures, and other soft-tissue injuries. The specificity of MRI remains a potential problem, with little evidence yet that MRI abnormalities mandate treatment or alter patient outcomes. Most patients with equivocal x-rays in the emergency department do not require immediate MRI, although in some cases, this may be cost-effective. If “definitive” imaging is required emergently but MRI is unavailable or contraindicated, noncontrast CT or nuclear medicine bone scan may be reasonable alternatives. These modalities do not provide the soft-tissue contrast or resolution required to identify important soft-tissue injuries such as triangular fibrocartilage tears. CT arthrography can be performed but is generally not an emergency department imaging test.
Summary
MR allows musculoskeletal imaging with excellent soft-tissue contrast. MRI remains the recommended imaging modality by the ACR for suspected hip or scaphoid fracture and myelopathy. It is likely highly sensitive for nondisplaced scaphoid and hip fractures and spinal epidural abscess, although studies are complicated by the difficulty of defining a reliable independent diagnostic standard. Future studies may clarify the sensitivity, specificity, and cost-effectiveness of MRI in comparison with other modalities such as CT.
1. Rankey D., Leach J.L., Leach S.D. Emergency MRI utilization trends at a tertiary care academic medical center: Baseline data. Acad Radiol. 2008;15:438-443.
2. Thomas J., Rideau A.M., Paulson E.K., Bisset G.S.3rd. Emergency department imaging: Current practice. J Am Coll Radiol. 2008;5:811-816. e2
3. Dominguez S., Liu P., Roberts C., et al. Prevalence of traumatic hip and pelvic fractures in patients with suspected hip fracture and negative initial standard radiographs: A study of emergency department patients. Acad Emerg Med. 2005;12:366-369.
4. MAG Mutual Healthcare Solutions. 2007 Physicians Fee & Coding Guide, 2007.
5. Evans P.D., Wilson C., Lyons K. Comparison of MRI with bone scanning for suspected hip fracture in elderly patients. J Bone Joint Surg Br. 1994;76:158-159.
6. Kaplan P.A., Helms C.A., Dussault R., et al. Musculoskeletal MRI. Philadelphia: WB Saunders; 2001.
7. Kaplan P.A. Musculoskeletal MRI, ed 1. Philadelphia: WB Saunders; 2001.
8. Moser T., Dosch J.C., Moussaoui A., et al. Multidetector CT arthrography of the wrist joint: How to do it. Radiographics. 2008;28:787-800. quiz 911
9. Grobner T. Gadolinium: A specific trigger for the development of nephrogenic fibrosing dermopathy and nephrogenic systemic fibrosis? Nephrol Dial Transplant. 2006;21:1104-1108.
10. Rodby R.A. Preventing complications of radiographic contrast media: Is there a role for dialysis? Semin Dial. 2007;20:19-23.
11. Prince M.R., Zhang H., Morris M., et al. Incidence of nephrogenic systemic fibrosis at two large medical centers. Radiology. 2008;248:807-816.
12. Joffe P., Thomsen H.S., Meusel M. Pharmacokinetics of gadodiamide injection in patients with severe renal insufficiency and patients undergoing hemodialysis or continuous ambulatory peritoneal dialysis. Acad Radiol. 1998;5:491-502.
13. Kanal E., Barkovich A.J., Bell C., et al. ACR guidance document for safe MR practices: 2007. AJR Am J Roentgenol. 2007;188:1447-1474.
14. Obrador G.T., Levenson D.J. Spinal epidural abscess in hemodialysis patients: Report of three cases and review of the literature. Am J Kidney Dis. 1996;27:75-83.
15. Loewy J., Loewy A., Kendall E.J. Reconsideration of pacemakers and MR imaging. Radiographics. 2004;24:1257-1267.
16. Shellock F.G., Crues J.V. MR procedures: Biologic effects, safety, and patient care. Radiology. 2004;232:635-652.
17. Tope W.D., Shellock F.G. Magnetic resonance imaging and permanent cosmetics (tattoos): Survey of complications and adverse events. J Magn Reson Imaging. 2002;15:180-184.
18. Counter S.A., Olofsson A., Borg E., et al. Analysis of magnetic resonance imaging acoustic noise generated by a 4.7 T experimental system. Acta Otolaryngol. 2000;120:739-743.
19. Counter S.A., Olofsson A., Grahn H.F., Borg E. MRI acoustic noise: Sound pressure and frequency analysis. J Magn Reson Imaging. 1997;7:606-611.
20. Ratnapalan S., Greenberg M., Armstrong D. Tattoos and MRI. Am J Roentgenol. 2004;183:541.
21. Franiel T., Schmidt S., Klingebiel R. First-degree burns on MRI due to nonferrous tattoos. Am J Roentgenol. 187, 2006. W556
22. Landman A., Goldfarb S. Magnetic resonance-induced thermal burn. Ann Emerg Med. 2008;52:308-309.
23. Zieman M., Kanal E., Copper T. 380A IUD and magnetic resonance imaging. Contraception. 2007;75:93-95.
24. Kelly S., Berry E., Roderick P., et al. The identification of bias in studies of the diagnostic performance of imaging modalities. Br J Radiol. 1997;70:1028-1035.
25. Moons K.G., Grobbee D.E. When should we remain blind and when should our eyes remain open in diagnostic studies? J Clin Epidemiol. 2002;55:633-636.
26. Nishikawa H., Imanaka Y., Sekimoto M., et al. Influence of verification bias on the assessment of MRI in the diagnosis of meniscal tear. AJR Am J Roentgenol. 2009;193:1596-1602.
27. Houssami N., Ciatto S., Macaskill P., et al. Accuracy and surgical impact of magnetic resonance imaging in breast cancer staging: Systematic review and meta-analysis in detection of multifocal and multicentric cancer. J Clin Oncol. 2008;26:3248-3258.
28. Carragee E.J., Paragioudakis S.J., Khurana S. 2000 Volvo Award winner in clinical studies: Lumbar high-intensity zone and discography in subjects without low back problems. Spine. 2000;25:2987-2992.
29. Jensen M.C., Brant-Zawadzki M.N., Obuchowski N., et al. Magnetic resonance imaging of the lumbar spine in people without back pain. N Engl J Med. 1994;331:69-73.
30. Smith D.K. Scapholunate interosseous ligament of the wrist: MR appearances in asymptomatic volunteers and arthrographically normal wrists. Radiology. 1994;192:217-221.
31. Sugimoto H., Shinozaki T., Ohsawa T. Triangular fibrocartilage in asymptomatic subjects: Investigation of abnormal MR signal intensity. Radiology. 1994;191:193-197.
32. Pfirrmann C.W., Zanetti M. Variants, pitfalls and asymptomatic findings in wrist and hand imaging. Eur J Radiol. 2005;56:286-295.
33. American College of Radiology: ACR Appropriateness Criteria. Myelopathy. 2008. (Accessed at http://www.acr.org/SecondaryMainMenuCategories/quality_safety/app_criteria/pdf/ExpertPanelonNeurologicImaging/MyelopathyDoc8.aspx.)
34. Davis D.P., Wold R.M., Patel R.J., et al. The clinical presentation and impact of diagnostic delays on emergency department patients with spinal epidural abscess. J Emerg Med. 2004;26:285-291.
35. Darouiche R.O. Spinal epidural abscess. N Engl J Med. 2006;355:2012-2020.
36. American College of Radiology: ACR Appropriateness Criteria. Myelopathy. 2008. (Accessed at http://www.acr.org/SecondaryMainMenuCategories/quality_safety/app_criteria/pdf/ExpertPanelonNeurologicImaging/MyelopathyDoc8.aspx.)
37. Brant-Zawadzki M., Burke V.D., Jeffrey R.B. CT in the evaluation of spine infection. Spine. 1983;8:358-364.
38. Burke D.R., Brant-Zawadzki M. CT of pyogenic spine infection. Neuroradiology. 1985;27:131-137.
39. Tung G.A., Yim J.W., Mermel L.A., et al. Spinal epidural abscess: Correlation between MRI findings and outcome. Neuroradiology. 1999;41:904-909.
40. Kowalski T.J., Layton K.F., Berbari E.F., et al. Follow-up MR imaging in patients with pyogenic spine infections: Lack of correlation with clinical features. AJNR Am J Neuroradiol. 2007;28:693-699.
41. Post M.J., Quencer R.M., Montalvo B.M., et al. Spinal infection: Evaluation with MR imaging and intraoperative US. Radiology. 1988;169:765-771.
42. Karnaze M.G., Gado M.H., Sartor K.J., Hodges F.J.3rd. Comparison of MR and CT myelography in imaging the cervical and thoracic spine. AJR Am J Roentgenol. 1988;150:397-403.
43. Modic M.T., Feiglin D.H., Piraino D.W., et al. Vertebral osteomyelitis: Assessment using MR. Radiology. 1985;157:157-166.
44. Dagirmanjian A., Schils J., McHenry M., Modic M.T. MR imaging of vertebral osteomyelitis revisited. AJR Am J Roentgenol. 1996;167:1539-1543.
45. Ledermann H.P., Schweitzer M.E., Morrison W.B., Carrino J.A. MR imaging findings in spinal infections: Rules or myths? Radiology. 2003;228:506-514.
46. Parker M.J. Missed hip fractures. Arch Emerg Med. 1992;9:23-27.
47. Handoll H.H., Parker M.J. Conservative versus operative treatment for hip fractures in adults. Cochrane Database Syst Rev. 2008. CD000337
48. Rogers F.B., Shackford S.R., Keller M.S. Early fixation reduces morbidity and mortality in elderly patients with hip fractures from low-impact falls. J Trauma. 1995;39:261-265.
49. American College of Radiology: ACR Appropriateness Criteria. Stress (Fatigue/Insufficiency) Fracture, Including Sacrum, Excluding Other Vertebrae. American College of Radiology., 2011. (Accessed at http://www.acr.org/SecondaryMainMenuCategories/quality_safety/app_criteria/pdf/ExpertPanelonMusculoskeletalImaging/StressInsufficiencyFracturesIncludingSacrumExcludingOtherVertebraeDoc20.aspx.)
51. Stevens K., Tao C., Lee S.U., et al. Subchondral fractures in osteonecrosis of the femoral head: Comparison of radiography, CT, and MR imaging. AJR Am J Roentgenol. 2003;180:363-368.
52. Perron A.D., Miller M.D., Brady W.J. Orthopedic pitfalls in the ED: radiographically occult hip fracture. Am J Emerg Med. 2002;20:234-237.
53. Conway W.F., Totty W.G., McEnery K.W. CT and MR imaging of the hip. Radiology. 1996;198:297-307.
54. Quinn S.F., McCarthy J.L. Prospective evaluation of patients with suspected hip fracture and indeterminate radiographs: Use of T1-weighted MR images. Radiology. 1993;187:469-471.
55. Rizzo P.F., Gould E.S., Lyden J.P., Asnis S.E. Diagnosis of occult fractures about the hip: Magnetic resonance imaging compared with bone-scanning. J Bone Joint Surg Am. 1993;75:395-401.
56. Lim K.B., Eng A.K., Chng S.M., et al. Limited magnetic resonance imaging (MRI) and the occult hip fracture. Ann Acad Med Singapore. 2002;31:607-610.
57. Chana R., Noorani A., Ashwood N., et al. The role of MRI in the diagnosis of proximal femoral fractures in the elderly. Injury. 2006;37:185-189.
58. Lubovsky O., Liebergall M., Mattan Y., et al. Early diagnosis of occult hip fractures MRI versus CT scan. Injury. 2005;36:788-792.
59. Pool F.J., Crabbe J.P. Occult femoral neck fractures in the elderly: Optimisation of investigation. N Z Med J. 1996;109:235-237.
60. Verbeeten K.M., Hermann K.L., Hasselqvist M., et al. The advantages of MRI in the detection of occult hip fractures. Eur Radiol. 2005;15:165-169.
61. Holder L.E., Schwarz C., Wernicke P.G., Michael R.H. Radionuclide bone imaging in the early detection of fractures of the proximal femur (hip): Multifactorial analysis. Radiology. 1990;174:509-515.
62. Matin P. The appearance of bone scans following fractures, including immediate and long-term studies. J Nucl Med. 1979;20:1227-1231.
63. Rubin S.J., Marquardt J.D., Gottlieb R.H., et al. Magnetic resonance imaging: A cost-effective alternative to bone scintigraphy in the evaluation of patients with suspected hip fractures. Skeletal Radiol. 1998;27:199-204.
64. Bogost G.A., Lizerbram E.K., Crues J.V.3rd. MR imaging in evaluation of suspected hip fracture: Frequency of unsuspected bone and soft-tissue injury. Radiology. 1995;197:263-267.
65. Stiell I.G., Clement C.M., McKnight R.D., et al. The Canadian C-spine Rule versus the NEXUS low-risk criteria in patients with trauma. N Engl J Med. 2003;349:2510-2518.
66. Hossain M., Barwick C., Sinha A.K., Andrew J.G. Is magnetic resonance imaging (MRI) necessary to exclude occult hip fracture? Injury. 2007;38:1204-1208.
67. Leslie I.J., Dickson R.A. The fractured carpal scaphoid: Natural history and factors influencing outcome. J Bone Joint Surg Br 63-B. 1981:225-230.
68. Chakravarty D., Sloan J., Brenchley J. Risk reduction through skeletal scintigraphy as a screening tool in suspected scaphoid fracture: A literature review. Emerg Med J. 2002;19:507-509.
69. Emedicine. Wrist, Scaphoid Fractures and Complications: 2007. (Accessed at http://www.emedicine.com.)
70. Jenkins P.J., Slade K., Huntley J.S., Robinson C.M. A comparative analysis of the accuracy, diagnostic uncertainty and cost of imaging modalities in suspected scaphoid fractures. Injury. 2008;39:768-774.
71. Memarsadeghi M., Breitenseher M.J., Schaefer-Prokop C., et al. Occult scaphoid fractures: Comparison of multidetector CT and MR imaging—Initial experience. Radiology. 2006;240:169-176.
72. Pillai A., Jain M. Management of clinical fractures of the scaphoid: Results of an audit and literature review. Eur J Emerg Med. 2005;12:47-51.
73. Brydie A., Raby N. Early MRI in the management of clinical scaphoid fracture. Br J Radiol. 2003;76:296-300.
74. American College of Radiology: ACR Appropriateness Criteria. Acute Hand and Wrist Trauma. 2008. (Accessed at http://www.acr.org/SecondaryMainMenuCategories/quality_safety/app_criteria/pdf/ExpertPanelonMusculoskeletalImaging/AcuteHandandWristTraumaDoc1.aspx.)
75. Groves A.M., Kayani I., Syed R., et al. An international survey of hospital practice in the imaging of acute scaphoid trauma. AJR Am J Roentgenol. 2006;187:1453-1456.
76. Gabler C., Kukla C., Breitenseher M.J., et al. Diagnosis of occult scaphoid fractures and other wrist injuries. Are repeated clinical examinations and plain radiographs still state of the art? Langenbecks Arch Surg. 2001;386:150-154.
77. Blum A., Sauer B., Detreille R., et al. [The diagnosis of recent scaphoid fractures: review of the literature]. J Radiol. 2007;88:741-759.
78. Breitenseher M.J., Metz V.M., Gilula L.A., et al. Radiographically occult scaphoid fractures: Value of MR imaging in detection. Radiology. 1997;203:245-250.
79. Low G., Raby N. Can follow-up radiography for acute scaphoid fracture still be considered a valid investigation? Clin Radiol. 2005;60:1106-1110.
80. Stuart H.C., Pyle S.I., Cornoni J., Reed R.B. Onsets, completions and spans of ossification in the 29 bonegrowth centers of the hand and wrist. Pediatrics. 1962;29:237-249.
81. Elhassan B.T., Shin A.Y. Scaphoid fracture in children. Hand Clin. 2006;22:31-41.
82. Cook P.A., Yu J.S., Wiand W., et al. Suspected scaphoid fractures in skeletally immature patients: Application of MRI. J Comput Assist Tomogr. 1997;21:511-515.
82a. American College of Radiology: ACR Appropriateness Criteria. Acute Hand and Wrist Trauma. 2008. (Accessed at http://www.acr.org/SecondaryMainMenuCategories/quality_safety/app_criteria/pdf/ExpertPanelonMusculoskeletalImaging/AcuteHandandWristTraumaDoc1.aspx.)
83. Kusano N., Churei Y., Shiraishi E., Kusano T. Diagnosis of occult carpal scaphoid fracture: A comparison of magnetic resonance imaging and computed tomography techniques. Tech Hand Up Extrem Surg. 2002;6:119-123.
84. Kumar S., O’Connor A., Despois M., Galloway H. Use of early magnetic resonance imaging in the diagnosis of occult scaphoid fractures: The CAST Study (Canberra Area Scaphoid Trial). N Z Med J. 118:U1296, 2005.
85. Eypasch E., Lefering R., Kum C.K., Troidl H. Probability of adverse events that have not yet occurred: A statistical reminder. BMJ. 1995;311:619-620.
86. Groves A.M., Cheow H.K., Balan K.K., et al. Case report: False negative 16 detector multislice CT for scaphoid fracture. Br J Radiol. 2005;78:57-59.
87. Karle B., Mayer B., Kitzinger H.B., et al. [Scaphoid fractures: Operative or conservative treatment? A CT-based classification]. Handchir Mikrochir Plast Chir. 2005;37:260-266.
88. Lozano-Calderon S., Blazar P., Zurakowski D., et al. Diagnosis of scaphoid fracture displacement with radiography and computed tomography. J Bone Joint Surg Am. 2006;88:2695-2703.
89. Cruickshank J., Meakin A., Breadmore R., et al. Early computerized tomography accurately determines the presence or absence of scaphoid and other fractures. Emerg Med Australas. 2007;19:223-228.
90. Nguyen Q., Chaudhry S., Sloan R., et al. The clinical scaphoid fracture: Early computed tomography as a practical approach. Ann R Coll Surg Engl. 2008;90:488-491.
91. Groves A.M., Cheow H.K., Balan K.K., et al. 16 detector multislice CT versus skeletal scintigraphy in the diagnosis of wrist fractures: Value of quantification of 99Tcm-MDP uptake. Br J Radiol. 2005;78:791-795.
92. Foex B., Speake P., Body R. Best evidence topic report: Magnetic resonance imaging or bone scintigraphy in the diagnosis of plain x-ray occult scaphoid fractures. Emerg Med J. 2005;22:434-435.
93. Raby N. Magnetic resonance imaging of suspected scaphoid fractures using a low field dedicated extremity MR system. Clin Radiol. 2001;56:316-320.
94. Saxena P., McDonald R., Gull S., Hyder N. Diagnostic scanning for suspected scaphoid fractures: An economic evaluation based on cost-minimisation models. Injury. 2003;34:503-511.
95. Gooding A., Coates M., Rothwell A. Cost analysis of traditional follow-up protocol versus MRI for radiographically occult scaphoid fractures: A pilot study for the Accident Compensation Corporation. N Z Med J. 117:U1049, 2004.
96. Brooks S., Cicuttini F.M., Lim S., et al. Cost effectiveness of adding magnetic resonance imaging to the usual management of suspected scaphoid fractures. Br J Sports Med. 2005;39:75-79.