Drug evaluation and pharmacoeconomics
Safety, efficacy and economy
The volume, complexity and costs of modern medicines are increasing. The need to compare the therapeutic efficacy (i.e. benefits) of medicines with their potential to cause harm (i.e. risks) and the economic implications of these is of paramount importance to the pharmaceutical industry, to healthcare providers and to society. Pharmacists play a major role in evaluating the safety, efficacy and economics of medicines use.
At a macro-level, the pharmaceutical industry decides which line of drug development would best serve its shareholders’ interests. New chemical entities which show promise must be studied in clinical trials before they can be marketed as medicines (see Ch. 4). After products are licensed and marketed, society and its healthcare systems are then faced with difficult decisions about which specific patient populations to treat, or which new medicines to approve for use. Increasingly, decisions are based on economic evaluations, which attempt to calculate cost:benefit ratios for medicines in potential patient populations. In some countries, only medicines which have a clear cost-effective advantage over existing treatment are funded by government. In the UK, various organizations work in differing ways to examine this aspect of medicine evaluation. At a micro-level, clinicians (doctors, pharmacists or nurses) must then assess the relative harms and benefits of each medicine for individual patients. This involves consideration of factors which can affect drug disposition, efficacy and safety, such as concurrent disease states or other medicines, while also weighing up the risk of untreated disease and potential affordability. As pharmacists become more involved in selecting treatments, the importance of skills in evaluating all these factors to make individual clinical decisions increases. Furthermore, pharmacists are frequently required to evaluate the use of medicines in individual patients prescribed by others. This involves the further skills of drug use review and evaluation.
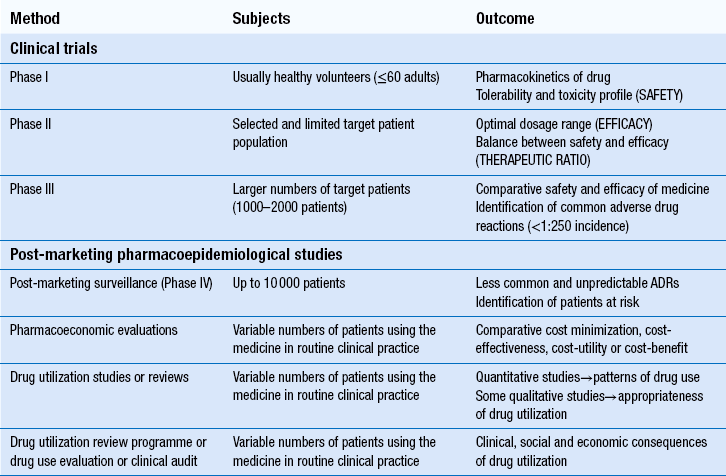
The techniques used in the evaluation of medicines for safety, efficacy and efficiency at pre- and post-marketing stages are summarized in Table 22.1.
Pre-marketing studies
In most countries, evidence of safety, efficacy and quality must be presented to government-appointed regulatory authorities before a new product can be marketed. Manufacturers wishing to market a product in the UK, can apply to the Medicines and Healthcare products Regulatory Agency (MHRA), or to the European Medicines Agency (EMA). Either body must be satisfied with the evidence provided before a marketing authorization (formerly called a product licence) can be granted. The MHRA and EMA have responsibility for assuring the public that all medicines which reach the UK or European markets have been assessed for safety, efficacy and quality. Cost issues are not taken into consideration. Efficacy has to be balanced against toxicity for each product and, while the MHRA’s evaluation includes the active ingredients of a product and its formulation, final decisions must also take into account the nature of the disease to be treated and the duration of the treatment. What is an acceptable benefit to risk ratio may differ for a medicine used to prolong survival in terminal conditions compared to a treatment for symptomatic relief of short-term symptoms.
Prior to clinical trials in humans, the pharmacokinetics and pharmacodynamics of any new drug are studied in animals to indicate therapeutic and possible toxic effects. However, because of substantial species differences in drug handling and response, new drugs must be screened in more than one animal species. Uncertainties in the relationship between the effects of drugs in animals and humans also mean that great caution is needed before progressing to ‘first time in man’ trials.
Phase I trials
These first trials are carried out in healthy adult volunteers, to determine the drug’s toxicity profile and assess tolerability. A dosage range is tested initially with a stepwise increase in drug dose being given to successive volunteers. Subjects in Phase I trials are intensively monitored to determine the nature and severity of any predictable dose-related adverse effects. Pharmacokinetic data are usually generated from both single- and multiple-dose studies. These may be used to assist in deciding the best method of administration.
These trials provide only limited safety data, because the subjects are healthy adults and unlikely to have any compromised drug handling ability. Thus, the potential risks of using the drug in patients at extremes of age, or in those with poor hepatic or renal function, are not known. There are also few subjects (e.g. 50–60), so only very common ADRs are detected.
Phase II trials
They are carried out in relatively small groups of target patients, usually within hospital departments specializing in particular areas of medicine. Their main aims are to test for efficacy and to identify an effective dose in closely monitored and controlled conditions. Phase II studies give the first indication of the likely value of the drug in patients, i.e. its efficacy. There is less emphasis on safety assessments during this phase, but the results will enable a therapeutic ratio (i.e. the balance between efficacy and safety) to be determined. Double-blind randomized controlled trials use a control group with a matching placebo to further assess efficacy. Phase II studies also inform the design of Phase III studies which are more comprehensive. Phases II and III combined may study 1000–2000 patients. The regulatory authorities closely control Phase II and Phase III studies, for which clinical trial certificates or exemptions are required.
Phase III trials
These trials examine safety and efficacy. They are generally large-scale studies comparing a new medicine with other treatments or placebo. Where possible, they should have a randomized controlled design, which is generally accepted as the least biased method of conducting clinical research. Assigning each patient randomly to either the new treatment or control helps to prevent bias (see Ch. 20).
Phase III trials are the main source of the information included in the summary of product characteristics (SPC) for the product. The conduct of clinical trials is subject to guidelines which cover ethical issues, trial design, the roles of investigators and sponsoring company and the storage and analysis of data. For every clinical trial which takes place, approval must be obtained from a research ethics committee. This committee will scrutinize the design of the trial, the information given to patients and the procedures for obtaining consent and that adequate compensation and insurance are available.
Safety is assessed by close monitoring of clinical signs and symptoms during scheduled clinical examinations and consultations, complemented by relevant laboratory investigations. Baseline pre-treatment data are compared with data obtained during periods of treatment with the study medicine and the experiences of treated patients compared to controls. However, systematic assessment of symptoms experienced by the patients included in the trials is not always carried out and a systematic checklist for patients to complete has been suggested. Even with the numbers of patients involved in Phases II and III, these trials can only identify type A ADRs that affect 1 in≥250 patients. Type B ADRs, which are not predictable from the drug’s pharmacological profile and tend to be rare, are more likely to be detected in post-marketing surveillance studies.
Post-marketing studies
Once the licensing authority is satisfied that a product is safe, efficacious and of suitable quality, it grants a marketing authorization, which means that the product can then be promoted to prescribers. This usually results in a large increase in the numbers of patients using the product and it is important that its safety is continuously monitored. The MHRA operates a system of post-marketing surveillance which involves spontaneous reporting of suspected ADRs, similar to that in many other countries. It is known as the Yellow Card scheme (see Ch. 51) and anyone can report suspected ADRs to the MHRA. Such schemes provide early warning signals of potential problems and can lead to hypotheses about associations between a medicine and an effect. These can then be tested using retrospective (e.g. case–control studies) or prospective studies (e.g. cohort studies). The main problems with spontaneous reporting schemes are under-reporting, difficulty in identifying new ADRs and the fact that incidence cannot be calculated, since there is no information on the number of patients exposed to the medicine. The benefits of patients reporting their ADRs to the MHRA have been formally evaluated and it has been shown that patient reports add to the usefulness of data obtained through reports submitted by healthcare professionals. European legislation now requires all member states to develop systems enabling patients to report ADRs to the national medicines regulator.
Case–control studies retrospectively identify patients who have developed a particular ADR and determine their level of exposure to the suspected medicine. This is then compared to a control group of patients without the ADR of interest. Case–control studies are smaller, much less expensive and generate results more quickly than cohort studies. They are used to investigate suspected ADRs identified by other means, e.g. cohort studies or spontaneous reporting and are particularly useful for confirming type B ADRs. They are capable of establishing whether an ADR is caused by a medicine, but cannot measure the incidence of ADRs.
Cohort studies measure the incidence of ADRs in a group of patients exposed to a medicine over a period of time and compare this with the incidence in a similar control group who were not exposed to the medicine. They are useful where a wide range of ADRs are associated with a single medicine, but are less useful for studying rare suspected ADRs. This is because large numbers of patients are required and must be followed-up for prolonged periods of time, which is very expensive and may result in patients being lost to follow-up.
Post-authorization safety studies (PASS)
Formal studies to evaluate the safety of medicines which are sponsored by the pharmaceutical industry are known as post-authorization safety studies PASS. A PASS is defined as any study relating to an authorized medicinal product conducted with the aim of identifying, characterizing or quantifying a safety hazard, confirming the safety profile of the medicinal product, or of measuring the effectiveness of risk management measures. The conduct of these studies is also subject to guidelines. A Code of Conduct requires investigators to register studies before they start and to publish all study findings irrespective of positive or negative results. Such studies use the standard methods of randomized clinical trials, case–control and cohort studies.
Further clinical trials against other drugs/treatments
Most products are marketed having been subject to clinical trials in relatively few patients, which may have excluded certain patient groups. Furthermore, trials may have been conducted against placebo to demonstrate efficacy, but there may be no data on the comparative efficacy of a new product versus an existing treatment for the same condition. Data available at the marketing stage will have demonstrated efficacy, but not the effectiveness of the treatment in practice. In addition, basic research may highlight new theories of how diseases may be treated which require older medicines to be tested for efficacy in conditions where they have not been used previously. Examples of this are the trials required to assess the efficacy of aspirin for prophylaxis against stroke and beta-adrenoceptor blockers in heart failure. As with any other clinical trial, the design is important and the randomized controlled design is considered the most appropriate.
Evaluation of medicines in children
While medicines used in adults must have undergone this rigorous testing before reaching the market and coming into widespread use, this is not generally the case for medicines used in children. Since there are many differences in both pharmacokinetic and pharmacodynamic aspects of medicines between children of different ages and adults, medicines to be used in children need to be tested in children. Information should also be available to prescribers, parents and carers about using medicines in children. Manufacturers are encouraged to develop specific formulations and information leaflets and European legislation requires them to provide and share data. This should ensure the increased availability of medicines which have been specifically developed, tested and licensed for use in children, as well as providing more relevant information about efficacy and toxicity.
Herbal and homoeopathic medicines
Most herbal remedies are not licensed medicinal products and therefore no evaluation is required before they are marketed, but manufacturers can apply to the MHRA for a marketing authorization. Currently around 500 herbal products hold a marketing authorization and so must have fulfilled the same criteria of safety, quality and efficacy (or effectiveness) as any other medicine and be accompanied by a patient information leaflet. Efficacy has not been demonstrated for most herbal medicinal products, therefore manufacturers can instead have the safety and quality formally assessed and recognized through the traditional herbal medicines registration scheme (see Ch. 24).
Homoeopathic remedies can be registered under a scheme which again only assesses quality and safety but does not allow indications to be specified. Alternatively, some homeopathic products may be registered under a different scheme which permits specification for treatment of minor conditions, but to gain such registration, manufacturers must demonstrate efficacy.
Pharmacoeconomic evaluation of medicines
Once a product is licensed, decisions must be made about whether it should be used. Local decisions may be made by drug and therapeutics committees (see Ch. 23). On a larger scale, decisions on whether new treatments should be available on the NHS in the UK are made by NICE, the Scottish Medicines Consortium and the All Wales Medicines Strategy Group. Pharmacoeconomic evaluations play a central role in informing NICE’s decisions, so pharmacists may conduct economic evaluations and certainly need to understand them. It is important to appreciate how NICE’s work differs from that of the MHRA, who decide whether products can be sold in the UK, by comparing benefits to risks. NICE considers whether medicines should be bought by the NHS, by comparing benefits to costs, i.e. whether they are cost-effective.
Estimates of cost-effectiveness are derived from economic evaluations, which are the comparative analysis of two or more alternative courses of action (interventions) in terms of their costs and consequences. Where the intervention is a medicine, the economic evaluation is called pharmacoeconomics. In an economic evaluation, cost refers to the sum product of the resources that are used and the unit cost of each item. Consequences are the health outcomes, for example the impact of therapy on mortality or quality of life (or both). An appreciation of the basic economic principles is necessary to understand the methods used and the basis for economic analyses.
Basic economic principles
Scarcity and choice
Resources such as land, labour and equipment are finite compared with their possible uses, which are infinite. Therefore, no person or organization is capable of achieving all the good things they desire and some hard choices must be made. These choices may concern the fundamental direction of a person’s career or an organization’s responsibilities. They may also be choices about how best to achieve a particular goal. For a person, their salary is one measure of the resources available to them. They might not be able to afford both a new car and an exotic holiday, but must choose which they would get the most pleasure from (economists refer to this as utility).
An organization, such as the NHS, a hospital or a primary care organization, has a budget to fund new and existing activities. The use of this budget should be reviewed to make sure that patients’ health gains from the mix of activities are maximized. The purpose of economic evaluations is to inform decision-makers of the balance between costs and health gains in order that health outcomes are maximized at a population level.
Opportunity cost
When we make choices about personal or workplace activities, we usually spend money to engage appropriate resources. Considering only the amount of money spent as the ‘cost’ is a little narrow-minded. Economists would argue that the true cost (opportunity cost) of an activity is the utility from other activities that we can no longer afford. Thus, the opportunity cost of a person’s car is not £10 000, but might be the pleasure of an expensive holiday which was not taken. Similarly, the opportunity costs of one coronary artery bypass graft might be two hip operations not performed. Acting to minimize opportunity cost, therefore, ensures that the utility we obtain from using resources in a particular way is maximized. We call this efficiency, which is of two types: technical and allocative:
 Technical efficiency is about achieving particular goals on a fixed scale in the most appropriate way (e.g. comparing a range of interventions, including medicines and lifestyle changes, within a programme to reduce blood pressure)
Allocative efficiency is concerned with choosing the right goals in the first place (e.g. coronary heart disease prevention or treating lung cancer) and the most appropriate scale for a healthcare programme.
Few diseases are left completely untreated (because it would not be fair or equitable) but normally, efficiency demands that most of our scarce resources are used to maximize health gains for the greatest number of people. This philosophy is called utilitarianism. If people whose health status cannot be improved by health care are treated, there are fewer resources to help those who can benefit.
Supply and demand
Most people would not consciously consider ‘minimizing opportunity cost’ in their everyday lives. But they would usually try to get the most utility from the smallest amount of expenditure, which is the same thing expressed more simply. The price of goods and their availability are relied on as indicators of quality and desirability. The price mechanism for allocating resources works well if there are many buyers and sellers, each with similar accurate information about the goods and services on offer. However, the market for health care (unlike that for cars and package holidays) does not work very well. The reasons for this include:
Health is demanded but cannot be directly provided
The link between health care and improvements in health is uncertain
We do not know when we will be ill
Providers of health care have more information than consumers
Insurance companies or governments usually pay for health care – not consumers.
When normal markets do not work well, economic evaluation can step in as a substitute for price to assist decision-makers. The costs measured and valued in economic evaluation are analogous to the costs of production for a normal good or service. The consequences measured and valued in economic evaluation are analogous to the utility consumers enjoy when using a normal good or service.
Methods of economic evaluation
The basic steps in all economic evaluations are to:
Clarify the economic question, with particular regard to technical or allocative efficiency, the interventions that will be compared and the population of interest
Obtain the best clinical and economic evidence
Identify and carry out the appropriate form of evaluation to answer the economic question
Identify the key variables that influence the results of the evaluation and test the influence of any assumptions
Present the results clearly and in a form that decision-makers can easily interpret.
All the techniques of economic evaluation involve an explicit consideration and calculation of resource use, to ensure that healthcare expenditure has the maximum possible impact on health status. However, each method of evaluation handles consequences (or health effects) differently.
Principles of costing
The viewpoint (perspective) of an economic evaluation determines what should be included in measuring costs. Typical viewpoints are: a single healthcare organization, the whole healthcare system or society. For the same set of interventions, taking a different viewpoint can result in radically different economic conclusions. To give an example, the costs of drug therapy for attention deficit hyperactivity disorder from a health system perspective is very different to the cost from a societal perspective, which may also consider the impact of treatment on education, social problems and crime.
Resources used directly in healthcare interventions may include:
Healthcare professionals’ time, e.g. doctors, nurses and pharmacists
Equipment, e.g. computers, medical scanners and beds
Space in which to work, including heat, light and rent
Consumables, e.g. medicines, diagnostic kits, syringes and dressings.
It is important to remember that it is not just the product acquisition cost that is used in economic evaluations, but the total costs related to treatment with that product, including for instance hospitalizations, blood tests, GP visits and so on.
Costs borne outside the healthcare system (e.g. by patients and carers, or in other sectors of the economy such as social care) may be less likely to have accepted and accessible market prices. Voluntary care costs, for example, might be valued using an average societal wage rate. Patients’ public transport costs would be clear enough, but for car travel, an appropriate mileage rate needs to be agreed or calculated. The productivity of patients going back to work should normally be excluded from costings. This is because any gains or losses in productivity flow from health status changes, which will be valued separately.
When identifying costs for groups of interventions that will be compared, any costs that are identical for all interventions can be safely ignored. This is because economists are more interested in marginal costs (e.g. the cost of one additional day in hospital) than average costs. Note that these may be very different. For instance, if a hospital operates at normal capacity, the average daily cost of a hospital bed will be similar to the marginal cost. However, if increases in local hospital catchment population required that a new ward needed to be built, then the marginal cost for the first patient admitted to that ward is substantially higher than the average cost (as it includes the cost of building the ward). It is the costs of change and the differences between alternative interventions that are most relevant for practical and effective decision-making.
Healthcare interventions often incur costs over a number of years and the duration of two alternative interventions may be different. So timing is an important factor in many costings and is accounted for in a number of ways. First, all costs are counted in a base year, and are not inflated to account for price rises over the course of the interventions. This ensures that all costs reflect real resource use and not nominal monetary values. Second, capital costs (durable equipment) are apportioned over the lifetime of the equipment. This allows a fair comparison of interventions with different levels of up-front and recurring costs. Third, future costs are ‘discounted’ back to the base year. In general terms, this reflects a preference by people to put off costs rather than pay straightaway.
Whether consequences that occur in the future should be discounted in the same way as costs is open to debate. Without consistent discounting, it is particularly hard to fairly compare health promotion interventions (with up-front costs and far-off consequences) with normal clinical treatments. NICE’s current practice is to discount both costs and benefits, at a rate of 3.5% per annum.
Economic analyses are useful for informing decisions on allocating scarce healthcare resources. Occasionally, decisions are very straightforward and do not require detailed economic analysis. These may include, for instance, examples where a new treatment is both more effective and less costly than existing therapy. Clearly in this situation, the new treatment is preferred, as this ‘dominates’ existing therapy. Conversely, a new treatment might be identified which is less effective, yet more expensive. This would be dominated by existing therapy (Fig. 22.1).
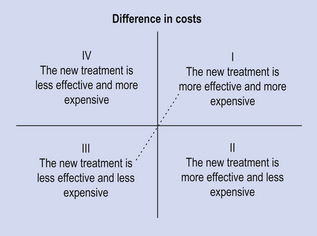
Figure 22.1 Cost-effectiveness plane, illustrating where a new treatment is either less or more effective than current therapy (origin), and whether the costs associated with the new treatment are higher or lower. Decisions on treatments falling into the north-west and south-east quadrants are clear-cut. It is unlikely that treatments in the south-west will be adopted as they are less effective than available alternative therapy. Decisions on whether or not to approve treatments that are both more effective and more costly (north-east quadrant) require the use of economic evaluation, and a threshold cost-effectiveness ratio (represented by the diagonal line), below which treatments are deemed to be cost-effective.
The two logical alternative scenarios, where additional benefits come at additional costs and where fewer benefits are generated at reduced cost, can be represented by the north-east and north-west quadrants of the cost-effectiveness plane, respectively (see Fig. 22.1). In the case of the former, the key question is whether the additional benefits justify the additional cost.
Types of economic evaluation
Cost-minimization analysis
Cost-minimization analysis (CMA) is only appropriate when there is robust evidence to show that two or more interventions have exactly the same health effects, i.e. are therapeutically equivalent in terms of health benefits and adverse effects. Interventions to be assessed by CMA fall on the vertical axis of the cost-effectiveness plane (see Fig. 22.1).
This is a question of technical efficiency and the intervention that costs the least is usually preferred, because spare resources can be used to treat more patients or be reallocated to other programmes. Choosing a more expensive option must be justified because using additional resources to achieve the same outcome takes resources away from other programmes where they might achieve something positive.
An example of CMA is the comparison of different methods for providing domiciliary oxygen. The effectiveness of oxygen provided in cylinders or by concentrator is the same. Concentrators are cheaper for most patients, despite high purchase and maintenance costs.
CMA could also be used to compare branded and generic medicines, or different formulations of the same drug, but its practical applications are limited to cases where therapeutic equivalence has been demonstrated. It has been argued that a lack of significance in the effect differences between interventions in a clinical trial is insufficient grounds for conducting a CMA.
Cost-effectiveness analysis
Cost-effectiveness analysis (CEA) is appropriate when the health effects of two or more interventions are not identical, but are measured in the same units, e.g. life years gained or symptom-free days.
This is a question of technical efficiency and is often appropriate within a particular healthcare programme, for example different interventions which all reduce myocardial infarction and stroke. However, CEA can only deal with one dimension of outcome at a time. Some other examples include: accidents prevented, decrease in blood pressure, deaths averted and strokes avoided. These measures are often clinical indicators or intermediate outcomes, e.g. blood pressure reduction is a predictor of subsequent effects such as stroke and health-related quality of life (HRQoL). The use of clinical indicators can be problematical, not least because the choice of indicator critically affects the results of an evaluation. The most appropriate indicator or outcome should be chosen before a study commences. Examples of CEA are shown in Box 22.1.
Box 22.1 Examples of cost-effectiveness analyses
An economic analysis of the Heart Protection Study compared simvastatin with placebo in over 20 000 adults with vascular disease or diabetes over 5 years. The authors estimated the costs of preventing a major vascular event with 40 mg simvastatin daily was £11 600. However, this ranged from £4500 among participants with a 42% 5-year major vascular event rate, to £31 100 among those with a 12% rate.
Abacavir is a nucleoside-analogue reverse transcriptase inhibitor used in combination with other antiretroviral therapy for the management of HIV. Unfortunately, it causes severe hypersensitivity reactions in about 4–8% of patients; however, HLA B*5701 is a known genetic risk factor for hypersensitivity reactions. A cost-effectiveness analysis of testing patients for HLA B*5701 prior to initiation of abacavir therapy demonstrated that, depending on the choice of comparator, routine testing for HLA B*5701 ranged from being a dominant strategy (less expensive and more beneficial than not testing) to an incremental cost-effectiveness ratio (vs no testing) of €22 811 per hypersensitivity reaction avoided. This means that compared with some antiretroviral therapies, the use of the test costs an additional €22 811 to avoid one hypersensitivity reaction.
Cost-utility analysis
Cost-utility analysis (CUA) is the most useful form of economic evaluation and is appropriate when the health effects of two or more alternatives can be measured in terms of overall impact on quality and quantity of life.
CUA is a special form of CEA in which the consequences are measured in terms of quality-adjusted life years (QALYs). QALYs are calculated by estimating the total life years gained from a treatment and weighing each year (or part thereof) with a quality of life (utility) score. The utility value is 0 for ‘dead’ and 1 for ‘full health’. Various methods can be used to measure and quantify quality of life, to provide a single summary score. The method pharmacists are most likely to be familiar with is a questionnaire such as the EuroQol-5D.
The advantage of the QALY is that it incorporates quality and quantity of life in a common currency that allows comparison of interventions from different clinical areas. So QALYs can be compared for very different interventions such as radiotherapy in advanced breast cancer, surgery for coronary artery bypass grafting and drugs for cardiovascular diseases. In contrast, a CEA measures consequences only in terms of quality or quantity: it is unidimensional. The advantage of CUA using QALYs is that it can answer questions of both technical efficiency and allocative efficiency in health care. For this reason, CUAs are the preferred form of economic evaluation for NICE appraisals.
Figure 22.2 presents a graphical representation of the impact of treatment, such as a medicine, on quality of life and life expectancy. The number of QALYs gained by one medicine over the other is the difference between the areas under the curves. In this figure, the disease is characterized by episodes of remission from symptoms, where quality of life is high, and relapses, where quality of life is low. Neither medicine A nor medicine B affects quality of life appreciably until the final stages of the disease, where it is clear that medicine B is superior – both in improving health-related quality of life and in increasing life expectancy. For each medicine, QALYs are calculated as the area under the curves, so the shaded area represents the number of QALY gains achieved with medicine B compared with medicine A.
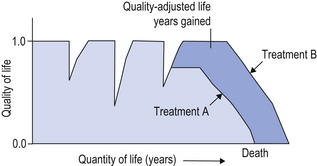
Figure 22.2 A schematic representation of the impact of two treatments (A and B) on a chronic disease that is characterized by episodes of relapse and remissions. The area under the curves represents the total number of quality-adjusted life years (QALYs) associated with each treatment. The gain in QALYs is the shaded area between both curves.
Now imagine that this lifetime QALY gain is equal to 1.0 QALY and that the total lifetime costs to the healthcare system associated with medicine A are £10 000 and with medicine B £20 000, but remember that medicine B is more effective. The incremental cost utility ratio is calculated as the difference in costs divided by the difference in QALYs, which in this case equals £10 000 divided by 1.0, which equals £10 000 per QALY gained. The judgement as to whether this represents good value for money (and in which case whether it will be approved for use by the NHS) depends on whether or not £10 000 per QALY gained is considered acceptable. In practice, treatments and healthcare interventions that cost less than £20 000–£30 000 per QALY gained are considered cost-effective, and are likely to be approved for use.
Table 22.2 lists a range of cost-utility estimates from a selection of appraisals conducted for NICE.
Table 22.2
A list of cost-utility ratios (cost per QALYs) for a range of interventions that were appraised by the National Institute for Health and Clinical Excellence (NICE)
| Medicine and indication | Incremental cost-effectiveness ratio (cost per QALY gained) |
| Ticagrelor for the treatment of acute coronary syndromes | £7897 vs clopidogrel |
| Dabigatran etexilate for the prevention of stroke and systemic embolism in atrial fibrillation | £18 900 compared with warfarin |
| Botulinum toxin type A for the prevention of headaches in adults with chronic migraine | £18 900 compared to placebo |
| Fingolimod for the treatment of highly active relapsing–remitting multiple sclerosis | Between £25 000 to £35 000 vs β-interferon and best supportive care |
| Omalizumab for severe persistent allergic asthma | £34 300 as add-on therapy |
| Adalimumab for the treatment of adults with psoriasis | £36 700 vs intermittent etanercept; and dominating (greater effectiveness and lower costs for adalimumab) when compared with continuous etanercept |
| Abiraterone for castration-resistant metastatic prostate cancer previously treated with a docetaxel-containing regimen | £46 800 compared with prednisolone alone; and extendedly dominating when compared with prednisolone and mitoxantrone |
| Bevacizumab in combination with a taxane for the first-line treatment of metastatic breast cancer | Between £110 000 and £259 000 compared with weekly paclitaxel |
Cost-benefit analysis
Cost-benefit analysis (CBA) is the least common economic evaluation of health care because it is only appropriate when the benefits gained are expressed in monetary units. The term cost-benefit analysis is, however, sometimes used incorrectly in a general way to describe any form of economic evaluation.
In CBA, the monetary units used to assess consequences reflect the value of health status improvement and not the cost of health care. The treatment offering the largest net consequence (value of consequences minus costs) is preferred. This technique can answer questions concerning allocative efficiency across the whole economy. In principle at least, the largest net consequence rule can help us decide whether to build a new hospital or a new road.
There are three ways to place a monetary value on consequences: implied values, the human capital approach and willingness to pay. Implied values are taken from insurance companies, court awards for accidents or risk premiums we pay people to do dangerous jobs. For example, insurance companies may state how much they will pay for the loss of an eye or limb. These values could be applied to the consequences of ophthalmic and vascular surgery respectively. Although implied values are one way to put a publicly acceptable monetary value on health effects, they do not exist for all possible consequences, may not be adjusted regularly and may be unpredictable.
The human capital approach places a value on human life that is equivalent to an individual’s future income stream. This has the disadvantage of judging that the life of a managing director is worth more than that of a shop floor worker. This is unpalatable for most healthcare professionals and not widely applied. However, surveys do suggest that the general public values the lives of the very young and old less highly than the lives of productive workers with families. It has also been suggested that traditional societies tend to sacrifice weaker members first in times of hardship.
Willingness to pay (WTP) is the preferred way to place a monetary value on consequences. In a WTP survey, a description of the intervention and associated health effects is presented to disease sufferers or the general public. After reading the description, people are asked to place a monetary valuation on the scenario, which may incorporate preferences about the method of treatment, information provided by medical tests and actual clinical outcome. WTP may be related to income or ability to pay and this must be considered in any analysis.
Modelling and sensitivity analysis
More often than not, clinical trials do not capture all the data required for an economic analysis. Moreover, it is generally advisable to project the results of clinical trials beyond the time horizon of analysis, to capture lifetime costs and benefits. Economists use mathematical models to compile data from various sources, and to test the robustness of assumptions and uncertainties in the analysis. The most common forms of economic models are decision analyses (represented schematically as decision trees) and Markov models.
A decision tree maps out the alternatives being compared in as much detail as possible. Figure 22.3 shows the start of one possible tree, outlining various treatment options for use of a new medicine. The decision tree starts with a decision node (by convention a square). This is because most health care starts with a decision about whether one alternative or another is the most appropriate course of action. Subsequent probability nodes (by convention, circles) show the chances of each possible consequence occurring. At each probability node, the sum of probabilities is 1, that is, a 100% chance that something will happen.
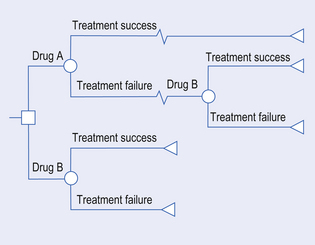
A range of interventions and their possible consequences can be mapped out clearly in a decision tree. Once the options are clear, probabilities can be attached to them using either new trial data or information from the existing literature. For each option we may also identify and state costs. At the end of each route through the decision tree, there should also be a terminal node (by convention, a triangle) associated with a final outcome.
The expected costs and outcomes (e.g. QALY) for each initial decision can be calculated. For instance, if the probability of treatment success with medicine B (used first-line) is 60%, and the costs associated with treatment success and failure are £1000 and £2000, respectively, then the expected cost is (60% × £1000) + (40% × £2000) = £1400. This means that, on average, the costs associated with medicine B, if used as first-line therapy, is £1400. We can calculate the incremental cost-effectiveness ratio by performing the same calculation to the costs and benefits for all the branches of the tree. Computer software to help draw and analyse decision trees makes their use particularly attractive for the comparison of multiple interventions.
Sensitivity analysis is the act of changing assumptions about the value or probability of costs and consequences, to determine whether or not the results of an evaluation are sensitive to such changes. Even without the help of a decision tree or computer software, evaluators should highlight any assumptions they make about costs and consequences and list the key variables that influence their recommendations.
Markov models are helpful for modelling the progression of chronic diseases. A disease is divided into health states (e.g. good health, bad health, death) and during a chosen period of time, a cohort of individuals is given a probability of moving from one state to another. Estimates of resource use and health effects are also attached to each state and transition. The model is then cycled to produce long-term estimates of cost-effectiveness in hypothetical patient cohorts.
Many healthcare professionals are distrustful of modelling and hypothetical data. However, in some cases, it is the best information we have. These techniques should not be rejected out of hand, but instead questions asked about the assumptions made to produce the model and the accuracy of typical clinical scenarios. Better information is better than nothing at all and modelling can be a great deal better than a badly designed trial.
Appraising economic evaluations
During the process of making decisions about whether to recommend drugs for use in the NHS, NICE and other similar bodies assess the quality of research which has been carried out, using standardized methods. The quality of published clinical studies and economic evaluations in the medical and pharmacy literature is variable. For both, methodological details must be critically appraised to ensure the validity of the results prior to decision-making. Examples of useful checklists can be found in SIGN Guideline 50: A Guideline Developer’s Handbook (www.sign.ac.uk).
Drug utilization review and evaluation
As well as being involved in the evaluation of new medicines both before and after marketing, pharmacists play a large role in evaluating whether medicines are being used appropriately. Rational use of medicines increases the quality of patient care and promotes cost-effective health care. The techniques used for this are drug utilization review (DUR), drug use evaluation (DUE) and clinical audit. (Audit is described in Ch. 12).
DUR is the assessment of patterns of drug use in a particular clinical context. DUE incorporates qualitative measures and emphasizes outcomes, including pharmacoeconomic assessment. DUE can identify problems in drug use, reduce ADRs, optimize drug therapy and minimize drug-related expenditure.
Selection of which drugs to study may be because of:
High cost, e.g. pregabalin, dabigatran
Wide usage or changes in usage, e.g. ulcer-healing drugs
Known or suspected inappropriate use, e.g. clopidogrel
Potential for improvements in patient care, e.g. bisphosphonates.
Some medicines will fall into more than one category, increasing the potential benefits of conducting DUR. Changes in legislation can result in changes in the way medicines are used and usage patterns may change when a new product is marketed. DUR can provide information on what these changes are and DUE can determine whether they are beneficial.
Drug utilization review
DUR was developed in the 1960s and focused on describing which medicines were being used and their costs. It can involve the development of standards for the use of each medicine or group of medicines, which can be used as criteria against which the actual use of the medicines can be measured. This form of DUR is therefore very similar to clinical audit (see Ch. 12). The general study of patterns of medicines use and their associated costs is an important activity for pharmacists. This activity is used to identify therapeutic areas where drug choice requires review, more cost-effective therapy can be substituted or there is unexplained variation in prescribing between groups of prescribers or between populations. The subsequent activities which are undertaken to address these issues also often involve pharmacists. These may include clinical medication review, MUR, prescription review, therapeutic switching programmes, clinical audit and DUE.
So that comparisons can be made between populations (such as those of different geographical areas or served by different prescribers), systems for classifying drugs and methods for quantifying their use are needed. The most widespread systems are the anatomical therapeutic chemical (ATC) system and the defined daily dose (DDD), recommended by the WHO for international use. In the UK, the BNF is more frequently used for therapeutic classification than the ATC, but DDDs are widely used to quantify medicines use. There is a DDD for every drug on the market, based on the average recommended daily maintenance dose for the drug when used for its most common indication in adults. It is expressed in g, mg, microgram (μg), mmol or units or as the number of tablets for combination products. The WHO sets the DDD for every drug.
While DDDs are used worldwide, other methods of measuring prescribing are also used in the UK primary care setting. The average daily quantity (ADQ) has been developed for a number of drugs to reflect typical prescribing in England. To make comparisons between populations, a denominator is required, often 1000 patients. For example, the DDD of diazepam is 10 mg. It may be found that diazepam is used with a DDD of 2000/1000 per year. This means that for every 1000 people, 2000 doses of diazepam were prescribed in a year, or 2 doses/person per year. By using DDDs, not only are quantities prescribed accounted for, but also an allowance is made for the frequency of administration. In order to enhance comparisons still further, a denominator which takes account of the differing needs of populations can be used. Examples of this are the ASTRO-PU (which accounts for the age, sex and temporary residential status of a population) and the STAR-PU which also accounts for variability within therapeutic groups.
Data can also be expressed in terms of cost, rather than quantity, again using this range of denominators. Thus it becomes possible to identify prescribing which is higher or lower than the norm for the actual population served in terms of either quantity or cost.
Drug use evaluation
Evaluating the use of medicines retrospectively, and relating them to patient outcomes can be a valuable learning experience, but prospective DUE is much more beneficial to both prescribers and patients. If changes in prescribing are found to be necessary, these can be implemented after or even during the evaluation. As with clinical audit, the involvement of relevant prescribers is essential, to ensure benefits.
There are various levels at which the use of medicines can be studied. These range from very broad measures with little detail, usually obtained from routinely collected data, to more expensive methods, in which a great deal of useful information is obtained on individual patients. DUR studies which use only drug supply, purchase or prescribing records cannot be used to determine medicines use in relation to indication and outcome. The information which they provide is incomplete and any suggestions of prescribing being inappropriate based solely on this type of data should be made cautiously. Prescribing advisers may use prescribing indicators as an indicative measure of the quality and cost of prescribing. They use the standard measures already described, but involve specific ways of combining data to enable more useful comparisons to be made. Some prescribing indicators are listed in Box 22.2. Their main purpose is to raise awareness of what is being prescribed and to highlight areas for more detailed methods of investigation, such as by examination of medical records.
Box 22.2 Examples of areas where prescribing indicators have been developed and are used to evaluate prescribing
Proportion of generic prescribing (should be high)
Benzodiazepine prescriptions measured as ADQ per STAR-PU (should be minimal)
Prescribing rate of ACE inhibitors as a proportion of ACE inhibitors and angiotensin-2 receptor blockers (should be minimal)
Prescribing rate of antibacterials measured as items per STAR-PU (should be minimal)
Using purchasing records
The simplest level of information about which medicines are being used is obtained from purchasing records. Providing pharmacies use computerized systems for purchase, these data are readily available. This type of information allows comparison between pharmacies or over time, but does not show how the medicines are being used. It can point to potential areas which may need further investigation.
While DDDs can be used to measure purchases, other measures such as cost, number of containers and number of dosage units may be more readily available.
Using issue records
A more detailed record of use can be obtained from the medicines issued from pharmacies, to individual patients via prescriptions or to wards in hospitals. The units used are the same as those of purchase. Again, computerization allows these data to be obtained easily.
In the community, these data are captured when prescriptions are priced centrally. These data can then be used to enable prescribers to evaluate their prescribing. However, more commonly, pharmacists may undertake this evaluation, using the techniques described here. Central data are available, such as those by the Prescribing Support Unit of the NHS Information Centre, which enable comparison of an individual’s or a group’s prescribing to the national ‘norm’.
In some hospitals, it is possible to link data from pharmacy issues to individual clinicians. This will increase as electronic prescribing becomes more widespread. Even if the data can only be applied at ward level, this can still be helpful in developing and monitoring ward-based policies on medicines use.
Using prescription records
More detailed information from prescriptions, which includes the actual dose prescribed and the concurrent medication, may be available in community pharmacies from PMRs. However, without patient registration and the recording of non-prescription medicines purchased, these are incomplete. In hospitals, this level of data is only easily obtainable with electronic prescribing. Prescription data however, allows evaluation of the appropriateness of doses used, the extent of polypharmacy, prescribing errors and drug interactions.
Using medical records and trained investigators
To examine decisions behind the use of particular medicines and their effectiveness in patients, it is necessary to examine medical records. This requires expertise and time and can often be frustrated by inadequate record-keeping. Some hospitals and many general practices have computerized patient records, which facilitate links between indications and drugs prescribed and possibly also to computerized laboratory data. Many systems, however, are either undeveloped or, as with PMRs, the records are often inaccurate or incomplete. Clearly, it is not possible to compensate for either a lack of data or inaccurate data. However, small studies undertaken manually can still be of considerable value in determining whether medicines are being used appropriately and effectively. These studies usually involve trained investigators, such as pharmacists, reviewing medical records.
Pharmacists can undertake prospective DUE, which avoids the problem of inadequate records, by allowing data to be recorded and questions to be asked at the time of prescribing. This may help to improve the use of medicines through changing prescribing behaviour. It can also involve the patient, so providing a full picture of medicines use, including outcomes and compliance. While more expensive than DUR using purchase, issue or prescribing data, this may be regarded as part of the routine practice of pharmacists. Increasingly, national and local clinical guidelines specify, among other things, the treatments to be given to patient populations, emphasizing the importance of both DUE and clinical audit. The labour-intensive nature of these activities will be reduced when complete and accurate computerized data are available in patient records which are shared between healthcare professionals.
Evaluation of non-prescription medicines
Published information on the epidemiology of self-limiting minor illnesses is limited. Similarly, data on the pharmacoepidemiology of the medicines used in self-treatment of these minor illnesses is limited. The number of such medicines which can be bought from pharmacies or other outlets is constantly increasing, with many former POMs being re-regulated to allow their purchase (see Ch. 4). Manufacturers of non-prescription medicines collect data on sales, which provide a global overview of which medicines are being purchased. DUR requires similar methods to those used for prescription medicines, namely study of purchase or supply and data stored in community pharmacy PMRs. DUE of non-prescription medicines is increasing, through studies using patient questionnaires. Such studies show that use is often inappropriate, but usually only involve community pharmacies and not the use of medicines purchased from other outlets. As increasing numbers of potent medicines become widely available without prescription, the requirement for a practical yet scientifically robust method of evaluating both the use of and adverse reactions associated with these medicines increases.
Key Points
Pharmacists have an important role to play in evaluating the safety, efficiency and economy of medicines’ use
The MHRA or EMA require evidence of safety, efficacy and quality before granting a marketing authorization for a new drug
Clinical trials take place in three phases: Phase I determines the basic toxicity and tolerability; Phase II tests for efficacy and identifies an effective dose; Phase III determines safety and efficacy on a larger sample using randomized controlled trials
Post-marketing surveillance is required to establish many adverse reactions, particularly rarer ones
Spontaneous reporting of ADRs to the MHRA is an important mechanism of post-marketing surveillance. Prescribers, pharmacists and patients can all report suspected ADRs
Pharmacoeconomics applies the principles of economic evaluation to medicines
Some of the basic economic concepts are scarcity, choice and opportunity cost
The principles of costing may be straightforward but can be difficult to apply, especially when trying to identify all the cost consequences related to a given treatment
Cost-minimization analysis (CMA) may be applied (with caution) when outcomes are the same and relative cost is the variation
Cost-effectiveness analysis (CEA) is applied when both outcomes and cost can vary, but outcomes are measured in common units
Cost-utility analysis (CUA) incorporates quality of life and quantity of life into a single index, and is the most useful form of economic evaluation to assist in informing resource allocation
Cost-benefit analysis (CBA) is complex, and is not used frequently for evaluating healthcare interventions
To accommodate decision-taking in health care, modelling and sensitivity analysis methods can be used
Drug utilization review (DUR) is used to evaluate patterns of drug use within populations
Drug use evaluation (DUE) relates drug use to patient outcome and along with clinical audit, can be used to evaluate whether drugs are used optimally in practice
Data which can be used for DUR and DUE include drug purchase records, drug issue records, prescription records and medical records