Physiologic Changes of Pregnancy
Robert Gaiser MD
Chapter Outline
Physical Examination and Cardiac Studies
Hemodynamic Changes during Labor and the Puerperium
Metabolism and Respiration during Labor and the Puerperium
Hematology and Coagulation during the Puerperium
Anatomy, Barrier Pressure, and Gastroesophageal Reflux
Gastric Function during Labor and the Puerperium
Neuraxial Analgesia and Anesthesia
Marked anatomic and physiologic changes occur during pregnancy that allow the woman to adapt to the developing fetus and its metabolic demands. The enlarging uterus places mechanical strain on the woman's body. Greater hormonal production by the ovaries and the placenta further alters maternal physiology. The hallmark of successful anesthetic management of the pregnant woman is recognition of these anatomic and physiologic changes and appropriate adaptation of anesthetic techniques to account for them. The physiologic alterations of normal pregnancy and their anesthetic implications are reviewed in this chapter.
Body Weight and Composition
The mean maternal weight increase during pregnancy is 17% of the prepregnancy weight or approximately 12 kg.1 It results from an increase in the size of the uterus and its contents (uterus, 1 kg; amniotic fluid, 1 kg; fetus and placenta, 4 kg), increases in blood volume and interstitial fluid (approximately 1 kg each), and deposition of new fat and protein (approximately 4 kg). The weight gain during pregnancy recommended by the Institute of Medicine reflects the increased incidence of obesity2 and depends on the prepregnancy body mass index (BMI; Table 2-1). The expected weight increase during the first trimester in a nonobese individual is 1 to 2 kg, and there is a 5- to 6-kg increase in each of the last two trimesters. The recommended gain is less in obese individuals. Obesity is a major problem in the United States and has many implications for obstetric anesthesia (see Chapter 50). Excessive weight gain during pregnancy is a risk factor for a long-term increase in BMI.3
TABLE 2-1
Recommended Weight Gain during Pregnancy
| Prepregnancy Body Mass Index (kg/m2) | Total Weight Gain in kg (lb) | Rate of Weight Gain during 2nd and 3rd Trimester in kg/wk (lb/wk) |
| < 18.5 | 12.7-18.2 (28-40) | 0.45 (1) |
| 18.5-24.9 | 11.4-15.9 (25-35) | 0.45 (1) |
| 25.0-29.9 | 6.8-11.4 (15-25) | 0.27 (0.6) |
| ≥ 30 | 5.0-9.1 (11-20) | 0.23 (0.5) |
Modified from Institute of Medicine (U.S.) Committee to Reexamine IOM Pregnancy Weight Guidelines, Rasmussen KM, Yaktine AL, editors. Weight Gain During Pregnancy: Reexamining the Guidelines. Washington, DC, National Academies Press, 2009.
Cardiovascular Changes
Physical Examination and Cardiac Studies
Pregnancy causes the heart to increase in size, a result of both greater blood volume and increased stretch and force of contraction.4 These changes, coupled with the elevation of the diaphragm from the expanding uterus, cause several changes in the physical examination and in cardiac studies.
Changes in heart sounds include accentuation of the first heart sound with exaggerated splitting of the mitral and tricuspid components (Box 2-1).5 The second heart sound changes little, although the aortic-pulmonic interval tends to vary less with respiration during the third trimester, a finding without clinical significance. A fourth heart sound may be heard in 16% of pregnant women, although typically it disappears at term. A grade II systolic ejection murmur is commonly heard at the left sternal border6; the murmur is considered a benign flow murmur, attributable to cardiac enlargement from increased intravascular volume, which causes dilation of the tricuspid annulus and regurgitation. Elevation of the diaphragm by the growing uterus shifts the heart anteriorly and to the left. The point of maximal cardiac impulse is displaced cephalad to the fourth intercostal space and also to the left to at least the midclavicular line.
The electrocardiogram typically changes, especially during the third trimester. Heart rate steadily increases during the first and second trimesters, and both the PR interval and the uncorrected QT interval are shortened. This has clinical implications for women with long QT syndrome (see Chapter 42). The QRS axis shifts to the right during the first trimester but may shift to the left during the third trimester.7 Depressed ST segments and isoelectric low-voltage T waves in the left-sided precordial and limb leads are commonly observed.8
Echocardiography demonstrates left ventricular hypertrophy by 12 weeks' gestation with a 50% increase in mass at term.9 This hypertrophy results from an increase in the size of the preexisting cardiomyocytes rather than an increase in the number of cells. The hypertrophy is eccentric, resembling that occurring from exercise.1 The annular diameters of the mitral, tricuspid, and pulmonic valves increase; 94% of term pregnant women exhibit tricuspid and pulmonic regurgitation, and 27% exhibit mitral regurgitation.10 The aortic annulus is not dilated.
Central Hemodynamics
For accurate determination of central hemodynamic changes during pregnancy, measurements should be made with the patient in a resting position, tilted to the left, to minimize aortic and vena caval compression. Comparisons must be made with an appropriate control, such as prepregnancy values or a matched group of nonpregnant women. If control measurements are made during the postpartum period, a sufficient interval must have elapsed for hemodynamic parameters to have returned to prepregnancy values; this may take 24 weeks or more.11
Cardiac output begins to increase by 5 weeks' gestation and is 35% to 40% above baseline by the end of the first trimester.9,12 It continues to increase throughout the second trimester until it is approximately 50% greater than nonpregnant values (Figures 2-1 and 2-2).9,11,13-15 Cardiac output does not change from this level during the third trimester. Some studies have reported a decrease in cardiac output during the third trimester; typically this is when measurements are made in the supine position and thus reflects aortocaval compression rather than a true gestational decline.
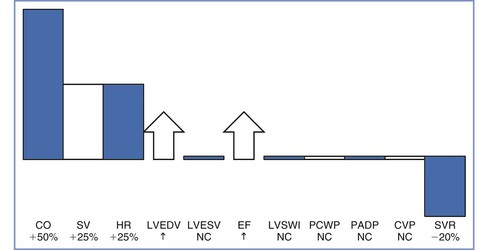
FIGURE 2-1 Central hemodynamic changes at term gestation. Changes are relative to the nonpregnant state. CO, cardiac output; SV, stroke volume; HR, heart rate; LVEDV, left ventricular end-diastolic volume; LVESV, left ventricular end-systolic volume; EF, ejection fraction; LVSWI, left ventricular stroke work index; PCWP, pulmonary capillary wedge pressure; PADP, pulmonary artery diastolic pressure; CVP, central venous pressure; SVR, systemic vascular resistance; NC, no change. (Data from Conklin KA. Maternal physiological adaptations during gestation, labor, and puerperium. Semin Anesth 1991; 10:221-34.)
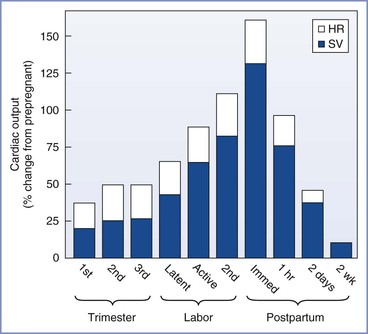
FIGURE 2-2 Cardiac output during pregnancy, labor, and the puerperium. Values during pregnancy are measured at the end of the first, second, and third trimesters. Values during labor are measured between contractions. For each measurement, the relative contributions of heart rate (HR) and stroke volume (SV) to the change in cardiac output are illustrated.
The initial increase in cardiac output results from an increase in heart rate, which occurs by the fourth to fifth week of pregnancy.9 The heart rate increases 15% to 25% above baseline by the end of the first trimester and remains relatively unchanged from that level for the remainder of the pregnancy.9,11-16 Cardiac output continues to increase during the second trimester because of an increase in stroke volume. Stroke volume increases by approximately 20% during the first trimester and by 25% to 30% above baseline during the second trimester.9,11,12,16 The increase in stroke volume correlates with increasing estrogen levels.1 Left ventricular mass increases by 23% from the first to the third trimester.17 Cardiac output increases to meet the demands of the developing fetus, and the distribution of cardiac output to the uterine circulation increases from 5% to 12% during the second half of pregnancy.18
Left ventricular end-diastolic volume increases during pregnancy, whereas end-systolic volume remains unchanged, resulting in a larger ejection fraction.9,11-14,16 Central venous, pulmonary artery diastolic, and pulmonary capillary wedge pressures are within the normal nonpregnant range.15 The apparent discrepancy between left ventricular filling pressure and end-diastolic volume is explained by hypertrophy and dilation, with the dilated ventricle accommodating a greater volume without an increase in pressure.
Myocardial contractility increases, as demonstrated by higher velocity of left ventricular circumferential fiber shortening (Figure 2-3).9,13,16 Tissue Doppler imaging, which is relatively independent of preload, has been used to assess diastolic function.19 Left ventricular diastolic function is not impaired during pregnancy, whereas systolic function is increased during the second trimester.
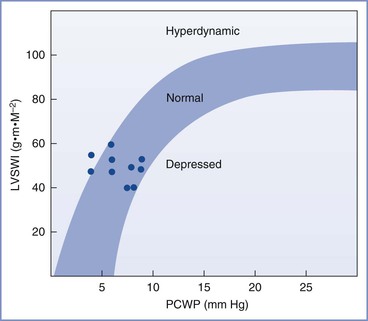
FIGURE 2-3 Left ventricular function in late phase of third-trimester normotensive pregnant patients. LVSWI, left ventricular stroke work index; PCWP, pulmonary capillary wedge pressure. (Modified from Clark SL, Cotton DB, Lee W, et al. Central hemodynamic assessment of cardiac function. Am J Obstet Gynecol 1989; 161:439-42.)
The increase in cardiac output during pregnancy results in increased perfusion to the uterus, kidneys, and extremities. Uterine blood flow increases from a baseline value of approximately 50 mL/min to a level at term of 700 to 900 mL/min.20-24 Approximately 90% of this flow perfuses the intervillous space, with the balance perfusing the myometrium.22 At term, skin blood flow is approximately three to four times the nonpregnant level, resulting in higher skin temperature.25 Renal plasma flow is increased by 80% at 16 to 26 weeks' gestation but declines to 50% above the nonpregnant baseline at term.26
The U.S. Department of Health and Human Services recommends that pregnant women have at least 150 minutes of moderate-intensity aerobic activity every week27; however, most women do not achieve this goal. Pregnant women are less active, with only half as many meeting guidelines for vigorous activity compared with nonpregnant women.28 For every two women who exercise before pregnancy, one will not do so during pregnancy. Failure to exercise results in greater gestational weight gain.29 Exercise is safe for the fetus29,30; in a study of 45 women, exercise on a treadmill of moderate intensity (40% to 59% of heart rate reserve) did not affect fetal heart or umbilical artery Doppler indices.30
During exercise, maximal oxygen consumption is greater in pregnancy,31 especially during cardiovascular exercise. The rate of increase in minute ventilation is greater with exercise during pregnancy.32 Cardiac output is also greater, primarily from increased stroke volume33 and increased oxygen delivery to the fetus.
Blood Pressure
Positioning, gestational age, and parity affect blood pressure measurements. Brachial sphygmomanometry yields the highest measurements in the supine position and the lowest measurements in the lateral position.14,34 Blood pressure increases with maternal age, and for a given age, nulliparous women have a higher mean pressure than parous women.35 Systolic, diastolic, and mean blood pressure decrease during midpregnancy and return toward baseline as the pregnancy approaches term.36 Diastolic blood pressure decreases more than systolic blood pressure, with early to mid-gestational decreases of approximately 20%.37 The changes in blood pressure are consistent with changes in systemic vascular resistance, which decreases during early gestation, reaches its nadir (35% decline) at 20 weeks' gestation, and increases during late gestation. Unlike blood pressure, systemic vascular resistance remains approximately 20% below the nonpregnant level at term.11,15 A postulated explanation for the decreased systemic vascular resistance is the development of a low-resistance vascular bed (the intervillous space) as well as vasodilation caused by prostacyclin, estrogen, and progesterone. The lower blood pressure persists beyond the pregnancy. A longitudinal study of 2304 initially normotensive women over 20 years showed that nulliparous women at baseline who subsequently delivered one or more infants had a blood pressure that was 1 to 2 mm Hg lower than corresponding women who did not have children. This finding demonstrates that pregnancy may create long-lasting vascular changes.37
Aortocaval Compression
The extent of compression of the aorta and inferior vena cava by the gravid uterus depends on positioning and gestational age. At term, partial vena caval compression occurs when the woman is in the lateral position, as documented by angiography.38 This finding is consistent with the 75% elevation above baseline of femoral venous and lower inferior vena cava pressures.39 Despite caval compression, collateral circulation maintains venous return, as reflected by the right ventricular filling pressure, which is unaltered in the lateral position.15
In the supine position, nearly complete obstruction of the inferior vena cava is evident at term.40 Blood returns from the lower extremities through the intraosseous, vertebral, paravertebral, and epidural veins.41 However, this collateral venous return is less than would occur through the inferior vena cava, resulting in a decrease in right atrial pressure.42 Compression of the inferior vena cava occurs as early as 13 to 16 weeks' gestation and is evident from the 50% increase in femoral venous pressure observed when these women assume the supine position (Figure 2-4).43 By term, femoral venous and lower inferior vena caval pressures are approximately 2.5 times the nonpregnant measurements in the supine position.39,43
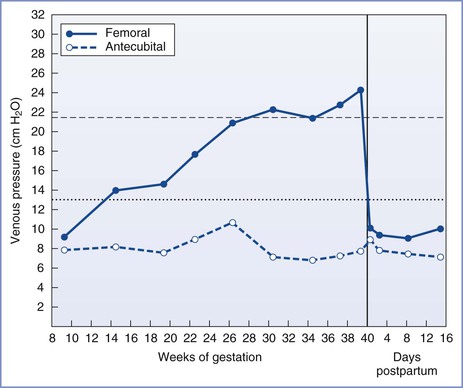
FIGURE 2-4 Femoral and antecubital venous pressures in the supine position throughout normal pregnancy and the puerperium. (Modified from McLennan CE. Antecubital and femoral venous pressure in normal and toxemic pregnancy. Am J Obstet Gynecol 1943; 45:568-91.)
In the supine position, the aorta may be compressed by the term gravid uterus. This compression accounts for lower pressure in the femoral versus the brachial artery in the supine position.44,45 These findings are consistent with angiographic studies in supine pregnant women, which show partial obstruction of the aorta at the level of the lumbar lordosis and enhanced compression during periods of maternal hypotension.46
At term, the left lateral decubitus position results in less enhancement of cardiac sympathetic nervous system activity and less suppression of cardiac vagal activity than the supine or right lateral decubitus position.47 Women who assume the supine position at term gestation experience a 10% to 20% decline in stroke volume and cardiac output,48,49 consistent with the fall in right atrial filling pressure. Blood flow in the upper extremities is normal, whereas uterine blood flow decreases by 20% and lower extremity blood flow decreases by 50%.50 Perfusion of the uterus is less affected than that of the lower extremities because compression of the vena cava does not obstruct venous outflow via the ovarian veins.51 The adverse hemodynamic effects of aortocaval compression are reduced once the fetal head is engaged.44,45 The sitting position has also been shown to result in aortocaval compression, with a decrease in cardiac output of 10%.52 Flexing the legs rotates the uterus to compress against the vena cava. Short intervals in the sitting position, such as occurs during epidural catheter placement, have no impact on uteroplacental blood flow.
Some term pregnant women exhibit an increase in brachial artery blood pressure when they assume the supine position, which is caused by higher systemic vascular resistance from compression of the aorta. Up to 15% of women at term experience bradycardia and a substantial drop in blood pressure when supine, the so-called supine hypotension syndrome.53 It may take several minutes for the bradycardia and hypotension to develop, and the bradycardia is usually preceded by a period of tachycardia. The syndrome results from a profound drop in venous return for which the cardiovascular system is not able to compensate.
Hemodynamic Changes during Labor and the Puerperium
Cardiac output during labor (but between uterine contractions) increases from pre-labor values by approximately 10% in the early first stage, by 25% in the late first stage, and by 40% in the second stage of labor.54-56 In the immediate postpartum period, cardiac output may be as much as 75% above pre-delivery measurements.55 These changes result from an increase in stroke volume due to greater venous return and to alterations in sympathetic nervous system activity. During uterine contractions, 300 to 500 mL of blood is displaced from the intervillous space into the central circulation (“autotransfusion”).57-59 Increased intrauterine pressure forces blood from the intervillous space through the relatively unimpeded ovarian venous outflow system. The postpartum increase in cardiac output results from relief of vena caval compression, diminished lower extremity venous pressure, and a reduction of maternal vascular capacitance.56 Cardiac output decreases to just below pre-labor values at 24 hours postpartum57 and returns to prepregnancy levels between 12 and 24 weeks postpartum.11 Heart rate decreases rapidly after delivery, reaches prepregnancy levels by 2 weeks postpartum, and is slightly below the prepregnancy rate for the next several months.11,60 Other anatomic and functional changes of the heart are also fully reversible.18,61
The Respiratory System
Despite the multiple anatomic and physiologic changes that occur during pregnancy, it is remarkable that pregnancy has a relatively minor impact on lung function.
Anatomy
The thorax undergoes both mechanical and hormonal changes during pregnancy.62,63 Relaxin (the hormone responsible for relaxation of the pelvic ligaments) causes relaxation of the ligamentous attachments to the lower ribs.62,63 The subcostal angle progressively widens from 68.5 to 103.5 degrees. The anteroposterior and transverse diameters of the chest wall each increase by 2 cm, resulting in an increase of 5 to 7 cm in the circumference of the lower rib cage. These changes peak at 37 weeks' gestation. The subcostal angle remains about 20% wider than the baseline value after delivery.64 The vertical measurement of the chest cavity decreases by as much as 4 cm as a result of the elevated position of the diaphragm.
Capillary engorgement of the larynx and the nasal and oropharyngeal mucosa begins early in the first trimester and increases progressively throughout pregnancy.65 The effect of estrogen on the nasal mucosa leads to symptoms of rhinitis and nosebleeds. Nasal breathing commonly becomes difficult, and epistaxis may occur. Nasal congestion may contribute to the perceived shortness of breath of pregnancy.66 Throughout the first and second trimesters, the voice has been described as rounded and well carried with good vibration. During the third trimester, vocal cord fatigue is more prevalent with a decrease in the maximum time of phonation. Both of these changes resolve in the immediate postpartum period.67
Airflow Mechanics
Inspiration in the term pregnant woman is almost totally attributable to diaphragmatic excursion68 because of greater descent of the diaphragm from its elevated resting position and limitation of thoracic cage expansion because of its expanded resting position (Table 2-2). Both large- and small-airway function are minimally altered during pregnancy. The shape of flow-volume loops, the absolute flow rates at normal lung volumes,69 forced expiratory volume in one second (FEV1), the ratio of FEV1 to forced vital capacity (FVC), and closing capacity are unchanged during pregnancy.70 There is no significant change in respiratory muscle strength during pregnancy despite the cephalad displacement of the diaphragm. Furthermore, despite the upward displacement of the diaphragm by the gravid uterus, diaphragm excursion actually increases by 2 cm.71
TABLE 2-2
Effects of Pregnancy on Respiratory Mechanics
| Parameter | Change* |
| Diaphragm excursion | Increased |
| Chest wall excursion | Decreased |
| Pulmonary resistance | Decreased 50% |
| FEV1 | No change |
| FEV1/FVC | No change |
| Flow-volume loop | No change |
| Closing capacity | No change |
* Relative to nonpregnant state.
FEV1, Forced expiratory volume in 1 second; FVC, forced vital capacity.
Adapted from Conklin KA. Maternal physiological adaptations during gestation, labor, and the puerperium. Semin Anesth 1991; 10:221-34.
The peak expiratory flow rate achieved with a maximal effort after a maximal inspiration is often considered a surrogate for the FEV1 and is often used to monitor asthma therapy. Studies of changes in peak expiratory flow rate during pregnancy have had conflicting results, most likely reflecting differences in measurement devices and patient position during measurements. Nonetheless, Harirah et al.72 found that peak expiratory flow rate declined throughout gestation in all positions and that flow rates in the supine position were lower than those during standing and sitting. The mean rate of decline was 0.65 L/min per week, and peak expiratory flow rate remained below normal at 6 weeks postpartum. By contrast, Grindheim et al.73 reported that peak expiratory flow rate increased in 100 pregnant women followed longitudinally, starting at an average of 6.7 L/s in the early second trimester and peaking at 7.2 L/s at term (Figure 2-5). These authors also reported that the FVC increased by 100 mL after 14 to 16 weeks' gestation, with the change being greater in parous than in primigravid women.73 The changes in functional residual capacity (FRC) that occur during pregnancy may persist postpartum.
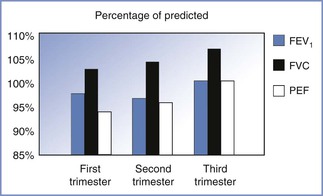
FIGURE 2-5 Changes in airflow mechanics during pregnancy. The magnitude of the increase in flow rates is small. The forced expiratory volume in one second (FEV1) is within the normal range of predictive values for nonpregnant individuals. FVC, forced vital capacity; PEF, peak expiratory flow. (Based on data from Grindheim G, Toska K, Estensen ME, Rosseland LA. Changes in pulmonary function during pregnancy: a longitudinal study. BJOG 2012; 119:94-101.)
Lung Volumes and Capacities
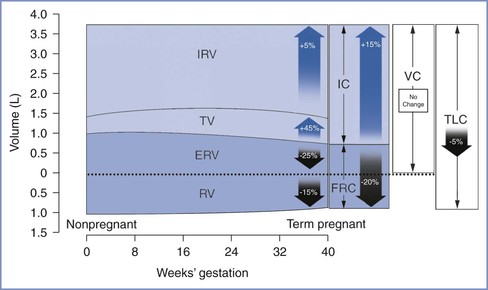
Lung volumes can be measured using body plethysmography or by inert gas techniques with slightly differing results.74 During pregnancy, total lung capacity is slightly reduced,75 whereas tidal volume increases by 45%, with approximately half the change occurring during the first trimester (Table 2-3 and Figure 2-6). The early change in tidal volume is associated with a reduction in inspiratory reserve volume. Residual volume tends to drop slightly, a change that maintains vital capacity. Inspiratory capacity increases by 15% during the third trimester because of increases in tidal volume and inspiratory reserve volume.76,77 There is a corresponding decrease in expiratory reserve volume.76,77 The FRC begins to decrease by the fifth month of pregnancy and decreases by 400 to 700 mL to 80% of the prepregnancy value at term.76,77 This change is caused by elevation of the diaphragm as the enlarging uterus enters the abdominal cavity and is accounted for by a 25% reduction in expiratory reserve volume (200 to 300 mL) and a 15% reduction in residual volume (200 to 400 mL). Assumption of the supine position causes the FRC to decrease further to 70% of the prepregnancy value. The supine FRC can be increased by 10% (approximately 188 mL) by placing the patient in a 30-degree head-up position.78
TABLE 2-3
Changes in Respiratory Physiology at Term Gestation
| Parameter | Change* |
| Lung Volumes | |
| Inspiratory reserve volume | +5% |
| Tidal volume | +45% |
| Expiratory reserve volume | −25% |
| Residual volume | −15% |
| Lung Capacities | |
| Inspiratory capacity | +15% |
| Functional residual capacity | −20% |
| Vital capacity | No change |
| Total lung capacity | −5% |
| Ventilation | |
| Minute ventilation | +45% |
| Alveolar ventilation | +45% |
* Relative to nonpregnant state.
From Conklin KA. Maternal physiological adaptations during gestation, labor and the puerperium. Semin Anesth 1991; 10:221-34.
Ventilation and Blood Gases
During pregnancy, respiratory rate and pattern remain relatively unchanged. Minute ventilation increases via an increase in tidal volume from 450 to 600 mL and a small increase in respiratory rate of 1 to 2 breaths/min.79 This occurs primarily during the first 12 weeks of gestation with a minimal increase thereafter. The ratio of total dead space to tidal volume remains constant during pregnancy, resulting in an increase in alveolar ventilation of 30% to 50% above baseline. The increase in minute ventilation results from hormonal changes and from an increase in CO2 production at rest by approximately 30% to 300 mL/min. The latter is closely related to the blood level of progesterone,80 which acts as a direct respiratory stimulant. The progesterone-induced increase in chemosensitivity results in a steeper slope and a leftward shift of the CO2-ventilatory response curve. This change occurs early in pregnancy and remains constant until delivery.69
Dyspnea is a common complaint during pregnancy, affecting up to 75% of women.81 Contributing factors include increased respiratory drive, decreased PaCO2, the enlarging uterus, larger pulmonary blood volume, anemia, and nasal congestion. Dyspnea typically begins in the first or second trimester but improves as the pregnancy progresses. In a study in which 35 women were observed closely during pregnancy and postpartum, dyspnea was not due to alterations in central ventilatory control or respiratory mechanical factors but rather to the awareness of the increased ventilation.82 Exercise has no effect on pregnancy-induced changes in ventilation or alveolar gas exchange.83 The hypoxic ventilatory response is increased during pregnancy to twice the normal level, secondary to elevations in estrogen and progesterone levels.84 This increase occurs despite blood and cerebrospinal fluid (CSF) alkalosis.
During pregnancy, PaO2 increases to 100 to 105 mm Hg (13.3 to 14.0 kPa) as a result of greater alveolar ventilation (Table 2-4).85 The higher PaO2 results from the decline in PaCO2 and a lower arteriovenous oxygen difference, which reduces the impact of venous admixture on PaO2.86,87 As pregnancy progresses, oxygen consumption continues to increase, and cardiac output increases to a lesser extent, resulting in a reduced mixed venous oxygen content and increased arteriovenous oxygen difference. After mid gestation, pregnant women in the supine position frequently have a PaO2 less than 100 mm Hg (13.3 kPa). This occurs because the FRC may be less than closing capacity, resulting in closure of small airways during normal tidal volume ventilation.85 Moving a pregnant woman from the supine to the erect or lateral decubitus position improves arterial oxygenation and reduces the alveolar-to-arterial oxygen gradient. The increased oxygen tension facilitates the transfer of oxygen across the placenta to the fetus.
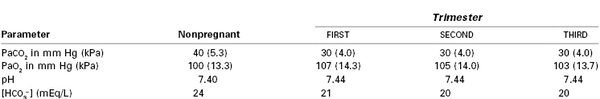
PaCO2 declines to approximately 30 mm Hg (4.0 kPa) by 12 weeks' gestation but does not change further during the remainder of pregnancy. Although a gradient exists between the end-tidal CO2 tension and PaCO2 in nonpregnant women, the two measurements are equivalent during early pregnancy,88 at term gestation,89 and in the postpartum period.90 This is attributable to a reduction in alveolar dead space, which results from an increase in cardiac output during pregnancy. The mixed venous PCO2 is 6 to 8 mm Hg (0.8 to 1.1 kPa) below the nonpregnant level from the later first trimester until term.1
Metabolic compensation for the respiratory alkalosis of pregnancy reduces serum bicarbonate concentration to approximately 20 mEq/L, the base excess by 2 to 3 mEq/L, and the total buffer base by approximately 5 mEq/L.91 This compensation is incomplete, as demonstrated by the elevation of venous,92 capillary,93 and arterial85 blood pH by 0.02 to 0.06 units.
Metabolism and Respiration during Labor and the Puerperium
Minute ventilation in the unmedicated parturient increases by 70% to 140% in the first stage of labor and by 120% to 200% in the second stage of labor compared with prepregnancy values.94 Pain, anxiety, and coached breathing techniques increase minute ventilation. PaCO2 may decrease to as low as 10 to 15 mm Hg (1.3 to 2.0 kPa). Oxygen consumption increases above the pre-labor value by 40% in the first stage and by 75% in the second stage, secondary to the increased metabolic demands of hyperventilation, uterine activity, and maternal expulsive efforts.94,95 The maternal aerobic requirement for oxygen exceeds oxygen consumption during labor, as is evident from the progressive elevation of blood lactate concentration, an index of anaerobic metabolism.95-98 Provision of effective neuraxial analgesia prevents these changes during the first stage of labor and mitigates the changes during the second stage of labor.95,98
FRC increases after delivery but remains below the prepregnancy volume for 1 to 2 weeks. Although minute ventilation decreases halfway toward nonpregnant values by 72 hours, oxygen consumption, tidal volume, and minute ventilation remain elevated until at least 6 to 8 weeks after delivery. The alveolar and mixed venous PCO2 values increase slowly after delivery and are still slightly below prepregnancy levels at 6 to 8 weeks postpartum.1
Hematology
Blood Volume
Maternal plasma volume expansion begins as early as 6 weeks' gestation and continues until it reaches a net increase of approximately 50% by 34 weeks' gestation (Table 2-5, Figure 2-7).99-102 After 34 weeks' gestation, the plasma volume stabilizes or decreases slightly. Red blood cell volume decreases during the first 8 weeks of pregnancy, increases to the prepregnancy level by 16 weeks, and undergoes a further rise to 30% above the prepregnancy level at term.100,102,103 The increase in plasma volume exceeds the increase in red blood cell volume, resulting in the physiologic anemia of pregnancy. Hemoglobin concentration, which typically ranges from 12 to 15.8 g/dL in the nonpregnant woman, decreases to 11.6 to 13.9 g/dL in the first trimester, 9.7 to 14.8 g/dL in the second trimester, and 9.5 to 15.0 g/dL in the third trimester.104 Hematocrit, which ranges from 35.4% to 44.4% in the nonpregnant woman, decreases to 31% to 41% in the first trimester, 30% to 39% in the second trimester, and 28% to 40% in the third trimester.100 There is an increase in plasma volume from 49 to 67 mL/kg, an increase in total blood volume from 76 to 94 mL/kg, and little change in red cell volume (27 mL/kg) (Figure 2-8).100 Blood volume is positively correlated with the size of the fetus in singleton pregnancies and is greater in multiple gestations.101 The physiologic hypervolemia facilitates delivery of nutrients to the fetus, protects the mother from hypotension, and reduces the risks associated with hemorrhage at delivery. The decrease in blood viscosity from the lower hematocrit creates lower resistance to blood flow, which may be an essential component of maintaining the patency of the uteroplacental vascular bed.
TABLE 2-5
Hematologic Parameters at Term Gestation
| Parameter | Change* or Actual Measurement |
| Blood volume | +45%* |
| Plasma volume | +55%* |
| Red blood cell volume | +30%* |
| Hemoglobin concentration (g/dL) | 11.6 |
| Hematocrit | 35.5% |
* Relative to nonpregnant state.
Adapted from Conklin KA. Maternal physiological adaptations during gestation, labor, and puerperium. Semin Anesth 1991; 10:221-34.
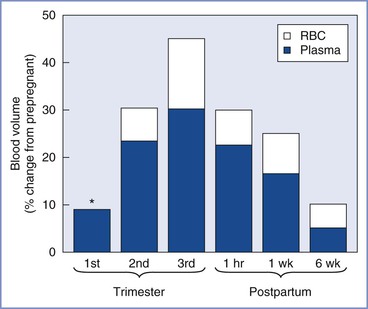
FIGURE 2-7 Blood volume during pregnancy and the puerperium. Values during pregnancy measured at the end of the first, second, and third trimesters. Postpartum values measured after a vaginal delivery. The values for red blood cell volume (RBC) and plasma volume (Plasma) do not represent the actual percentage of change in these parameters but rather reflect the relative contribution of each to the change in blood volume. The asterisk indicates that RBC volume is below the prepregnancy volume at the end of the first trimester.
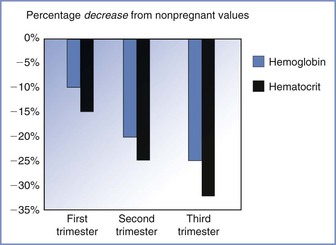
FIGURE 2-8 The decrease in both hemoglobin concentration and hematocrit during pregnancy underlies the physiologic anemia of pregnancy. The decrease is greater for hematocrit and the greatest decreases occur during the third trimester. (Based on data from Abbassi-Ghanavati M, Greer LG, Cunningham FG. Pregnancy and laboratory studies: a reference table for clinicians. Obstet Gynecol 2009; 114:1326-31.)
The increase in plasma volume results from fetal and maternal hormone production, and several systems may play a role. Additionally, the expansion of plasma volume may help to maintain blood pressure in the presence of decreased vascular tone.103,105 The maternal concentrations of estrogen and progesterone increase nearly 100-fold during pregnancy. Estrogens increase plasma renin activity, enhancing renal sodium absorption and water retention via the renin-angiotensin-aldosterone system. Fetal adrenal production of the estrogen precursor dehydroepiandrosterone may be the underlying control mechanism. Progesterone also enhances aldosterone production. These changes result in marked increases in plasma renin activity and aldosterone level as well as in retention of approximately 900 mEq of sodium and 7000 mL of total body water. The concentration of plasma adrenomedullin, a potent vasodilating peptide, increases during pregnancy and correlates significantly with blood volume.106
Red blood cell volume increases in response to elevated erythropoietin concentration107 and the erythropoietic effects of progesterone, prolactin, and placental lactogen. Both hemoglobin concentration and hematocrit decrease after conception to approximately 11.2 g/dL and 34%, respectively, by mid gestation,102,103 which is a 15% decrease from prepregnancy levels. During the late third trimester, the hemoglobin concentration and hematocrit increase to approximately 11.6 g/dL and 35.5%, respectively, because red blood cell volume increases more than plasma volume. Women who do not receive iron supplements during pregnancy have greater decreases in hemoglobin concentration and hematocrit.102
Plasma Proteins
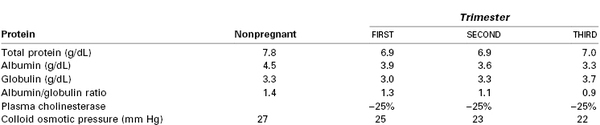
Plasma albumin concentration decreases from a nonpregnant range of 4.1-5.3 g/dL to 3.1-5.1 g/dL in the first trimester, 2.6-4.5 g/dL in the second trimester, and 2.3-4.2 g/dL in the third trimester (Table 2-6).104,108,109 The globulin level decreases by 10% in the first trimester and then increases throughout the remainder of pregnancy to 10% above the prepregnancy value at term.108 The albumin-globulin ratio decreases during pregnancy from 1.4 to 0.9, and the total plasma protein concentration decreases from 7.8 to 7.0 g/dL.109 Maternal colloid osmotic pressure decreases by approximately 5 mm Hg during pregnancy.15,110,111 The plasma cholinesterase concentration falls by approximately 25% during the first trimester and remains at that level until the end of pregnancy.112,113
Coagulation
Pregnancy is associated with enhanced platelet turnover, clotting, and fibrinolysis (Box 2-2). Thus, pregnancy represents a state of accelerated but compensated intravascular coagulation.
Increases in platelet factor 4 and beta-thromboglobulin signal elevated platelet activation, and the progressive increase in platelet distribution width and platelet volume are consistent with greater platelet consumption during pregnancy.114-116 Platelet aggregation in response to collagen, epinephrine, adenosine diphosphate, and arachidonic acid is increased.117 Despite changes in platelet count and/or function, the bleeding time measurement is not altered during normal gestation.118 Some investigators have noted a decrease in platelet count,116,119 whereas others have noted no change,114,115 suggesting that increased platelet production compensates for greater activation. The platelet count usually decreases during the third trimester, with an estimated 8% of pregnant women having a platelet count less than 150,000/mm3 and 0.9% of pregnant women having a platelet count less than 100,000/mm3.115,120 The most common causes of thrombocytopenia are gestational thrombocytopenia, hypertensive disorders of pregnancy, and idiopathic thrombocytopenia. The decrease in platelet count in the third trimester is due to increased destruction and hemodilution.121 Gestational thrombocytopenia is an exaggerated normal response.
The concentrations of most coagulation factors, including fibrinogen (factor I), proconvertin (factor VII), antihemophilic factor (factor VIII), Christmas factor (factor IX), Stuart-Prower factor (factor X), and Hageman factor (factor XII), increase during pregnancy. The increase in factor VIII is generally more marked in the third trimester. The concentrations of some factors increase by more than 100% (factors VII, VIII, IX, and fibrinogen).121-124 Prothrombin (factor II) and proaccelerin (factor V) concentrations do not change, whereas the concentrations of thromboplastin antecedent (factor XI) and fibrin-stabilizing factor (factor XIII) decrease.123-125 An increase in most factor concentrations, shortening of the prothrombin time (PT) and activated partial thromboplastin time (aPTT),122 an increase in fibrinopeptide A concentration, and a decrease in antithrombin III concentration suggest activation of the clotting system (PT decreases from 12.7 to 15.4 seconds in nonpregnant women to 9.6 to 12.9 seconds in the third trimester, and aPTT decreases from 26.3 to 39.4 seconds in nonpregnant women to 24.7 to 35 seconds in the third trimester).126 Protein S activity decreases steadily during pregnancy, reaching the lowest values at delivery.127
Thromboelastrography demonstrates evidence of hypercoagulability in pregnancy. These changes (decrease in R and K values, increase in the α angle and maximum amplitude [MA], and decrease in lysis) are observed as early as 10 to 12 weeks' gestation and are even greater during labor (Figure 2-9).128-130 In vitro, exogenous oxytocin decreases R and K values, while increasing the α angle, thus resulting in an even more hypercoagulable state.131 The in vivo effects of exogenous oxytocin are not known.
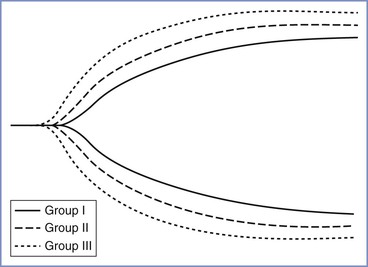
FIGURE 2-9 Comparative thromboelastographs in nonpregnant (Group I), nonlaboring term pregnant (Group II), and laboring (Group III) women. (From Steer PL, Krantz HB. Thromboelastrography and Sonoclot analysis in the healthy parturient. J Clin Anesth 1993; 5:419-24.)
The greater concentration of fibrin degradation products signals increased fibrinolytic activity during gestation.114 The marked elevation in the plasminogen concentration also is consistent with enhanced fibrinolysis.132
Hematology and Coagulation during the Puerperium
Blood loss during normal vaginal delivery and the early puerperium is approximately 600 mL.133 The normal physiologic changes of pregnancy allow the healthy parturient to compensate for this loss. However, blood loss after either vaginal or cesarean delivery is often underestimated and the discrepancy between actual and estimated blood loss is greater with increasing blood loss.134
Blood volume decreases to 125% of the prepregnancy level during the first postpartum week,133 followed by a more gradual decline to 110% of the prepregnancy level at 6 to 9 weeks postpartum. The hemoglobin concentration and hematocrit decrease during the first 3 postpartum days, increase gradually during the next 3 days (because of a reduction in plasma volume), and continue to increase to prepregnancy measurements by 3 weeks postpartum.135
Cesarean delivery results in a blood loss of approximately 1000 mL within the first few hours of delivery.133 The hematocrit in the immediate postpartum period is lower after cesarean delivery than after vaginal delivery because of the greater blood loss during cesarean delivery.133
Albumin and total protein concentrations and colloid osmotic pressure decline after delivery and gradually return to prepregnancy levels by 6 weeks postpartum.110 The plasma cholinesterase value decreases below the pre-delivery level by the first postpartum day and remains at that decreased level during the next week.112,113 Globulin concentrations are elevated throughout the first postpartum week.108
Beginning with delivery and during the first postpartum day, there is a rapid decrease in the platelet count and in the concentrations of fibrinogen, factor VIII, and plasminogen and an increase in antifibrinolytic activity.136 Clotting times remain shortened during the first postpartum day,137 and thromboelastography remains consistent with a hypercoagulable state.131 During the first 3 to 5 days postpartum, increases are noted in the fibrinogen concentration and platelet count, changes that may account for the greater incidence of thrombotic complications during the puerperium.137 The coagulation profile returns to the nonpregnant state by 2 weeks postpartum.136
The Immune System
The blood leukocyte count increases progressively during pregnancy from the prepregnancy level of approximately 6,000/mm3 to between 9,000 and 11,000/mm3.119 This change reflects an increase in the number of polymorphonuclear cells, with the appearance of immature granulocytic forms (myelocytes and metamyelocytes) in most pregnant women. The proportion of immature forms decreases during the last 2 months of pregnancy. The lymphocyte, eosinophil, and basophil counts decrease, whereas the monocyte count does not change. The leukocyte count increases to approximately 13,000/mm3 during labor and increases further to an average of 15,000/mm3 on the first postpartum day.135 By the sixth postpartum day, the leukocyte count decreases to an average of 9,250/mm3, although the count is still above normal at 6 weeks postpartum.
Polymorphonuclear leukocyte function is impaired during pregnancy, as evidenced by depressed neutrophil chemotaxis and adherence.138 This impairment may account for the greater incidence of infection during pregnancy and improved symptoms in some pregnant women with autoimmune diseases (e.g., rheumatoid arthritis). Levels of immunoglobulins A, G, and M are unchanged during gestation, but humoral antibody titers to certain viruses (e.g., herpes simplex, measles, influenza type A) are decreased.139
During pregnancy, the uterine mucosa is characterized by a large number of maternal immune cells found in close contact with the trophoblast. The fetal expression of paternal antigens requires adaptations in the maternal immune system so that the fetus is not perceived by the mother as “foreign.”140,141 This “immune tolerance” occurs because of a lack of fetal antigen expression, because of separation of the mother from the fetus, or from a functional suppression of the maternal lymphocytes.142 During the first trimester of pregnancy, T lymphocytes express granulysin, a novel cytolytic protein, which provides a protective role at the maternal-fetal interface.143 Human T cells may be classified into T-helper cells types 1 and 2 (Th1 and Th2) on the basis of their cytokine production. Successful pregnancy is associated with a predominant Th2 cytokine profile. Th1 cytokines are detrimental to pregnancy. These cells also produce natural antimicrobial agents within the uterus, which are important for prevention of uterine infection during pregnancy.144
The Gastrointestinal System
Anatomy, Barrier Pressure, and Gastroesophageal Reflux
The stomach is displaced upward toward the left side of the diaphragm during pregnancy, and its axis is rotated approximately 45 degrees to the right from its normal vertical position. This altered position displaces the intra-abdominal segment of the esophagus into the thorax in most women, causing a reduction in tone of the lower esophageal high-pressure zone (LEHPZ), which normally prevents the reflux of gastric contents. Progestins also may contribute to a relaxation of the LEHPZ.145
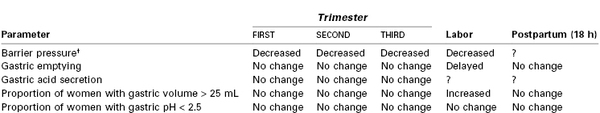
Approximately 30% to 50% of women experience gastroesophageal reflux disease (GERD) during pregnancy,146 with the majority (80%) experiencing regurgitation not heartburn (pyrosis) (20%).147 The prevalence of GERD is approximately 10% in the first trimester, 40% in the second trimester, and 55% in the third trimester. In the first trimester of pregnancy, basal LEHPZ pressure may not change, but the sphincter is less responsive to physiologic stimuli that usually increase pressure.148 In the second and third trimesters, LEHPZ pressure gradually decreases to approximately 50% of basal values, reaching a nadir at 36 weeks' gestation and returning to prepregnancy values at 1 to 4 weeks postpartum (Table 2-7). Risk factors for GERD in pregnancy include gestational age, heartburn antecedent to pregnancy, and multiparity. Gravidity, prepregnancy BMI, and weight gain during pregnancy do not correlate with the occurrence of reflux, whereas maternal age has an inverse correlation.147,149
Gastrointestinal Motility
Gastric emptying is not altered during pregnancy. This has been demonstrated by studies that measured the absorption of orally administered acetaminophen150-152 and by studies that assessed the emptying of a test meal by radiographic,153 ultrasonographic,152,154 dye dilution,155 epigastric impedance,156 and applied potential tomographic157 techniques. In a study of morbidly obese women at term, no difference was noted between gastric emptying of 300 mL and 50 mL of water, suggesting that fasting guidelines should not differ for obese versus lean parturients.158
Esophageal peristalsis and intestinal transit are slowed during pregnancy,154,159 which has been attributed to the inhibition of gastrointestinal contractile activity by progesterone. However, this inhibition may be an indirect action that results from a negative effect of progesterone on the plasma concentration of motilin, which declines during pregnancy.154 Up to 40% of women suffer from constipation at some time during their pregnancy.160 The prevalence of constipation is greatest in the first two trimesters of gestation and declines in the third trimester.
Gastric Acid Secretion
Early work suggested that both basal and maximal gastric acid secretion decline in mid gestation, reaching a nadir at 20 to 30 weeks' gestation.161 Van Thiel et al.162 demonstrated no difference in basal or peak gastric acid secretion in four pregnant women studied in each trimester and at 1 to 4 weeks postpartum, although a plasma gastrin level significantly lower than postpartum levels was observed during the first trimester. Levels of gastric pH and serum gastrin concentration were compared in 100 women who were not in labor but were scheduled for elective cesarean delivery and in 100 nonpregnant women undergoing gynecologic surgery.163 The pH was lower in the pregnant group (2.4 versus 3.0), but serum gastrin levels were not different despite the fact that gastrin is secreted by the placenta from 15 weeks' gestation onward.164 Other studies that have examined stomach contents have shown that approximately 80% of both pregnant and nonpregnant women have a gastric pH of 2.5 or less, approximately 50% have gastric volumes of 25 mL or greater, and 40% to 50% exhibit both low pH and gastric volume greater than 25 mL. These results are similar to those obtained from studies of women at a mean gestation of 15 weeks.165
Nausea and Vomiting
Approximately 80% of pregnant women will experience nausea and vomiting during pregnancy.166 The symptoms typically start between 4 to 9 weeks' gestation and may last until 12 to 16 weeks' gestation.167 Of these women, 1% to 5% will develop symptoms that persist throughout the pregnancy, known as hyperemesis gravidarum (see Chapter 16).
Gastric Function during Labor and the Puerperium
Gastric emptying is slowed during labor, as shown by ultrasonographic imaging, emptying of a test meal, and the rate of absorption of oral acetaminophen.168,169 Direct measurements show that the mean gastric volume increases.170 However, in one study, postpartum gastric volume was found to be no different in parturients who consumed water in labor compared with those who consumed an isotonic sports drink composed of mixed carbohydrates and electrolytes.171 Gastric acid secretion may decrease during labor because only 25% of parturients who are in labor have gastric pH of 2.5 or less.172 Gastric emptying is delayed during the early postpartum period but returns to prepregnancy levels by 18 hours postpartum.173 Gastric volume and pH values are similar in fasting women more than 18 hours after delivery and in nonpregnant individuals who have fasted before elective surgery.174-176 The effects of opioids and neuraxial analgesia on gastric emptying are discussed in Chapters 23 and 29.
The Liver and Gallbladder
Liver size, morphology, and blood flow do not change during pregnancy, although the liver is displaced upward, posterior, and to the right during late pregnancy.
Serum levels of bilirubin, alanine aminotransferase, aspartate aminotransferase, and lactate dehydrogenase increase to the upper limits of the normal range during pregnancy.177 The total alkaline phosphatase activity increases twofold to fourfold, mostly from production by the placenta. Excretion of sulfobromophthalein into bile decreases, whereas the hepatic extraction and retention of this compound increases.178
Biliary stasis and greater secretion of bile with cholesterol increase the risk of gallbladder disease during pregnancy.179 The incidence of gallstones is 5% to 12% in pregnant women.180 One in 1,600 to 1 in 10,000 women undergo cholecystectomy during pregnancy. Progesterone inhibits the contractility of gastrointestinal smooth muscle, leading to gallbladder hypomotility.181 The size of the total bile acid pool increases by about 50% during pregnancy, and the relative proportions of the various bile acids change.182 The changes in the composition of bile revert rapidly after delivery, even in patients with gallstones.
The Kidneys
Owing to an increase in total intravascular volume, both renal vascular and interstitial volume increase during pregnancy. These increases are reflected in enlarged kidneys, with renal volume increased by as much as 30%.183 Vasodilation of the kidneys contributes to the overall decline in systemic vascular resistance during the first trimester. The collecting system, including the renal calyces, pelvis, and ureters, dilates. Hydronephrosis may occur in 80% of women by mid pregnancy.184
Both the glomerular filtration rate (GFR) and the renal plasma flow increase markedly during pregnancy secondary to reduced renal vascular resistance.26 The renal plasma flow is 75% greater than nonpregnant values by 16 weeks' gestation and is maintained until 34 weeks, when a slight decline occurs. By the end of the first trimester, the GFR is 50% greater than baseline, and this rate is maintained until the end of pregnancy. The GFR does not return to prepregnancy levels until 3 months postpartum. Because the GFR does not increase as rapidly or as much as the renal plasma flow, the filtration fraction decreases from nonpregnant levels until the third trimester.185 The potential role of nitric oxide in the renal vasodilation was tested and confirmed in a rat model.186
Creatinine clearance is increased to 150 to 200 mL/min from the normal baseline values of 120 mL/min.187 The increase occurs early in pregnancy, reaches a maximum by the end of the first trimester, decreases slightly near term, and returns to the prepregnancy level by 8 to 12 weeks postpartum.185 These renal hemodynamic alterations are among the earliest and most dramatic maternal adaptations to pregnancy. The increased GFR results in reduced blood concentrations of nitrogenous metabolites. The blood urea nitrogen concentration decreases to 8 to 9 mg/dL by the end of the first trimester and remains at that level until term.187 Serum creatinine concentration is a reflection of skeletal muscle production and urinary excretion. In pregnancy, skeletal muscle production of creatinine remains relatively constant but the GFR is increased, resulting in a reduced serum creatinine concentration. The serum creatinine concentration decreases progressively to 0.5 to 0.6 mg/dL by the end of pregnancy. The serum uric acid level declines in early pregnancy because of the rise in GFR, to 2.0 to 3.0 mg/dL by 24 weeks' gestation.188 Subsequently, the uric acid level begins to increase, reaching the prepregnancy level by the end of pregnancy. Tubular reabsorption of urate accounts for this elevated uric acid level during the third trimester.
Total protein excretion and urinary albumin excretion are higher than nonpregnant levels. Average 24-hour total protein and albumin excretion are 200 mg and 12 mg, respectively (upper limits are 300 mg and 20 mg, respectively).189,190 Proteinuria (> 300 mg/24 h) has been described without the diagnosis of preeclampsia.191 However, women with isolated proteinuria are more likely to progress to preeclampsia than women with isolated hypertension. The protein-to-creatinine ratio in a random urine sample correlates well with a 24-hour urine protein measurement, and a value of greater than 0.18 has been estimated as indicating significant proteinuria192; this test may be an alternative method if time is lacking for a 24-hour urine collection. The degree of proteinuria in normal pregnancy also correlates with gestation. Women with twin pregnancies have greater protein excretion compared with those with singleton pregnancies.193
Glucose is filtered and almost completely absorbed in the proximal tubule. In the nonpregnant state, a small amount of glucose is excreted. Pregnancy imposes a change in the glucose resorptive capacity of the proximal tubules, so all pregnant women exhibit an elevation of glucose excretion. Of pregnant women who have normal glucose tolerance to an oral load and normal glucose excretion when not pregnant, approximately half will exhibit a doubling of glucose excretion. Most of the remainder have increases of 3 to 10 times the nonpregnant amount, and a small proportion (< 10%) excrete as much as 20 times the nonpregnant amount.194 Overall, the amount of glucose excreted in the third trimester is several times greater than that in the nonpregnant state. The normal nonpregnant pattern of glucose excretion is reestablished within a week after delivery.
The kidney is also involved in maintenance of acid-base status during pregnancy. An increase in alveolar ventilation results in respiratory alkalosis. A compensatory response occurs in the kidney, with greater bicarbonate excretion and a decline in serum bicarbonate levels. The decrease in serum bicarbonate affects the pregnant woman's ability to buffer an acid load.
Nonplacental Endocrinology
Thyroid Function
The thyroid gland enlarges by 50% to 70% during pregnancy because of follicular hyperplasia and greater vascularity. The estrogen-induced increase in thyroid-binding globulin results in a 50% increase in total triiodothyronine (T3) and thyroxine (T4) concentrations during the first trimester, which are maintained until term.195 The concentrations of free T3 and T4 do not change. The concentration of thyroid-stimulating hormone (TSH) decreases during the first trimester but returns to the nonpregnant level shortly thereafter and undergoes no further change during the remainder of pregnancy. The fetal thyroid gland cannot produce thyroid hormone until the end of the first trimester and relies solely on maternal T4 production during this critical time of development and organogenesis.
Approximately 4% to 7% of women of childbearing age are either hypothyroid or at risk of hypothyroidism during pregnancy.196 Only 20% to 30% of affected women demonstrate symptoms of hypothyroidism, likely because symptoms of hypothyroidism mimic features of pregnancy.197 In a large study of 502,036 pregnant women, 15% of tested women had gestational hypothyroidism, with 33% of these women demonstrating symptoms.198 Based on these results, many physicians advocate universal screening, which appears to be cost effective, given the risk of decreased intelligence in the offspring, miscarriage, and postpartum bleeding if hypothyroidism is left untreated.199
Glucose Metabolism
Mean blood glucose concentration remains within the normal range during pregnancy, although the concentration may be lower in some women during the third trimester compared with nonpregnant individuals.200 This finding is explained by the greater glucose demand of the fetus and the placenta. The relative hypoglycemic state results in fasting hypoinsulinemia. Pregnant women also exhibit exaggerated starvation ketosis.
Pregnant women are insulin resistant because of hormones such as placental lactogen secreted by the placenta.201 The blood glucose levels after a carbohydrate load are greater in pregnant women than in nonpregnant women, despite a hyperinsulinemic response. These changes resolve within 24 hours of delivery.
Adrenal Cortical Function
The concentration of corticosteroid-binding globulin (CBG) doubles during gestation as a result of an estrogen-induced enhancement of hepatic synthesis.202 The elevated CBG value results in a 100% increase in the plasma cortisol concentration at the end of the first trimester and a 200% increase at term. The concentration of unbound, metabolically active cortisol at the end of the third trimester is two and one-half times the nonpregnant level. The increase in free cortisol results from greater production and reduced clearance. Protein binding of corticosteroids is affected by an increase in the CBG concentration and a decrease in the serum albumin level. CBG binding capacity usually saturates at low concentrations of glucocorticoids. Clearance of betamethasone is greater during pregnancy, possibly because the drug is metabolized by placental enzymes.203
The Musculoskeletal System
Back pain during pregnancy is common. A cohort of 200 consecutive women without back pain at the start of pregnancy were observed throughout their pregnancy.204 At 12 weeks' gestation, 19% of the study population complained of backache. The incidence increased to 47% at 24 weeks' gestation and peaked at 49% at 36 weeks' gestation. After delivery, the prevalence of back pain declined to 9.4%. Despite a relatively high prevalence, only 32% of women with low back pain during pregnancy reported this problem to their physicians and only 25% of providers recommended specific therapy.205
The etiology of the back pain is multifactorial. One theory is that the enlarging uterus results in exaggerated lumbar lordosis, placing mechanical strain on the lower back. The hormonal changes of pregnancy may also play a role. Relaxin, a polypeptide hormone of the insulin-like growth factor family, is associated with remodeling of collagen fibers and pelvic connective tissue. The primary source of circulating relaxin is the corpus luteum; the placenta is a secondary source. Serum relaxin levels in early pregnancy are positively correlated with the presence of back pain.206
Women who develop low back pain during pregnancy may avoid subsequent pregnancy to prevent recurrence. These women have a very high risk of a new episode during a subsequent pregnancy.207 In the majority of patients, low back pain during pregnancy responds to activity and postural modification. Exercises to increase the strength of the abdominal and back muscles are helpful. Scheduled rest periods with elevation of the feet to flex the hips and decrease the lumbar lordosis help relieve muscle spasm and pain.208
The enhancement of the lumbar lordosis during pregnancy alters the center of gravity over the lower extremities (Figure 2-10) and may lead to other mechanical problems. Exaggerated lumbar lordosis tends to stretch the lateral femoral cutaneous nerve, possibly resulting in meralgia paresthetica, with paresthesia or sensory loss over the anterolateral thigh. Anterior flexion of the neck and slumping of the shoulders usually accompany the enhanced lordosis, sometimes leading to a brachial plexus neuropathy.
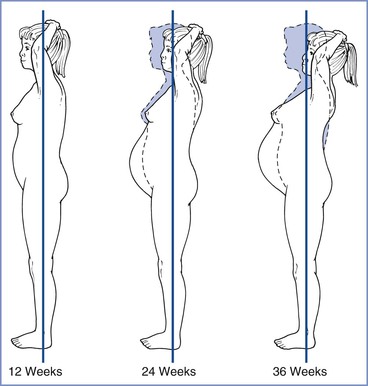
FIGURE 2-10 Changes in posture during pregnancy. The first and the subsequent dotted-line figures represent a woman's posture before growth of the uterus and its contents have affected the center of gravity. The second and third solid figures show that as the uterus enlarges and the abdomen protrudes, the lumbar lordosis is enhanced and the shoulders slump and move posteriorly. (Modified from Beck AC, Rosenthal AH. Obstetrical Practice. Baltimore, Williams & Wilkins, 1955;146.)
Mobility of the sacroiliac, sacrococcygeal, and pubic joints increases during pregnancy in preparation for passage of the fetus. A widening of the pubic symphysis is evident by 30 weeks' gestation. These changes are attributable to relaxin and the biomechanical strain of pregnancy on the ligaments.209 Relaxin may also contribute to the greater incidence of carpal tunnel syndrome during pregnancy by changing the nature of the connective tissue so that more fluid is absorbed.210
The human fetus requires approximately 30 g of calcium for skeletal development by the time of term delivery.211 Although intestinal absorption of calcium by the mother increases from as early as 12 weeks' gestation to meet this increased demand, it is insufficient to meet fetal demand and thus the maternal skeleton undergoes resorption.212 This does not cause long-term changes in skeletal calcium content or strength. Pregnant women with a twin gestation have a much higher calcium requirement. Compared with singleton pregnancies, there is a larger increase in bone resorption in twin gestation.213
The Nervous System
Sleep
Sleep disturbances from mechanical and hormonal factors occur commonly during pregnancy. Latency and duration of rapid eye movement (REM) sleep are influenced by changes in progesterone and estrogen concentrations. Pregnant women have more complaints of insomnia and daytime sleepiness. The American Academy of Sleep Medicine defined pregnancy-associated sleep disorder as the occurrence of insomnia or excessive sleepiness that develops in the course of pregnancy.214 Progesterone has a strong sedating effect, and cortisol, levels of which are higher in pregnancy, is associated with an increase in REM sleep.215 In a cohort study of 189 healthy nulliparous women, Facco et al. reported that mean (± SD) sleep duration was shorter in the third trimester (7.0 ± 1.2 hours) compared with the baseline period between 6 and 20 weeks' gestation (7.4 ± 1.2 hours).216
The Pittsburgh Sleep Quality Index, a sum of seven components assessing sleep quality, sleep latency, sleep duration, and daytime drowsiness, indicated poor sleep quality as the pregnancy progressed. Polysomnography reveals reduced slow-wave and REM phases of sleep, decreased total sleep time, and increased rate of wakening after sleep onset.217 Sleep may be poor for up to 3 months postpartum.218 Upper airway changes lead to increased airflow resistance and snoring. Although only 4% of nonpregnant women snore, as many as 23% of pregnant women snore by the third trimester. Snoring is more common in women with preeclampsia.
Pregnancy is associated with transient restless leg syndrome, a disorder in which the patient experiences the need to move her legs. The incidence ranges from 15% in the first trimester to 23% in the third trimester.219
Central Nervous System
Cerebral blood flow increases in pregnancy. Nevo et al.220 measured cerebral blood flow in 210 women at different gestational ages and found that it increased from 44.4 mL/min/100 g during the first trimester to 51.8 mL/min/100 g during the third trimester (Figure 2-11). The increase was secondary to a decrease in cerebrovascular resistance and an increase in internal carotid artery diameter. Two other changes in the brain that occur during pregnancy include (1) an increase in permeability of the blood-brain barrier owing to decreased cerebrovascular resistance with an increase in hydrostatic pressure and (2) an increase in capillary density in the posterior cerebral cortex.221
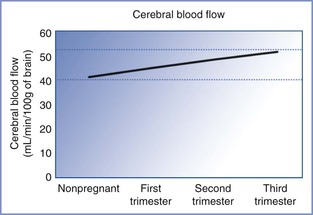
FIGURE 2-11 Cerebral blood flow during pregnancy. Cerebral blood flow increases as pregnancy progresses and is attributable to vasodilation from the hormonal changes of pregnancy. This increase in cerebral blood flow explains the increased risk of complications in patients with intracranial pathology as pregnancy progresses. (Based on data from Nevo O, Soustiel JF, Thaler I. Maternal cerebral blood flow during normal pregnancy: a cross-sectional study. Am J Obstet Gynecol 2010; 203:475.e1-6.)
Women experience an elevation in the threshold to pain and discomfort near the end of pregnancy and during labor.222 The mechanism, although unclear, may be related to the effects of progesterone and endorphins. Elevated concentrations of endorphins and enkephalins are found in the plasma and CSF of parturients,223 and opioid antagonists abolish pregnancy-induced analgesia to visceral stimulation in experimental animals.224
Vertebral Column
Anatomic and mechanical changes occur to the vertebral column during pregnancy. The epidural space can be regarded as a rigid tube that contains two fluid-filled distensible tubes, the dural sac, and epidural veins. The volume of epidural fat and the epidural veins enlarge during pregnancy; spinal CSF volume is reduced.40
In the lateral position, lumbar epidural pressure is positive in term pregnant women but negative in more than 90% of nonpregnant women.225 Turning a parturient from the lateral to the supine position increases the epidural pressure. Epidural pressure also increases during labor because of increased diversion of venous blood through the vertebral plexus secondary to either enhanced compression of the inferior vena cava in the supine position or greater intra-abdominal pressure during pain and pushing. The epidural pressure returns to the nonpregnant level by 6 to 12 hours postpartum.
Despite compression of the dural sac by the epidural veins, the CSF pressure in pregnant women is the same as in nonpregnant women.226 Uterine contractions and pushing result in an increase in CSF pressure that is secondary to acute increases in epidural vein distention.
Sympathetic Nervous System
Dependence on the sympathetic nervous system for maintenance of hemodynamic stability increases progressively throughout pregnancy and reaches a peak at term.227-229 The dependence on the sympathetic nervous system returns to that of the nonpregnant state by 36 to 48 hours postpartum.
Anesthetic Implications
Positioning
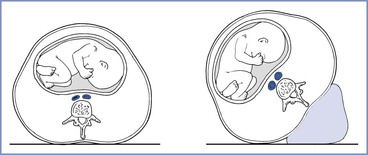
Aortocaval compression, decreased blood pressure and cardiac output, and impairment of uteroplacental blood flow occur when a pregnant woman is placed in the supine position. This may compromise fetal well-being and neonatal outcome during labor or cesarean delivery.230-232 Therefore, after 20 weeks' gestation, the supine position should be avoided and the uterus should be displaced to the left by placement of a wedge underneath the right hip or by tilting the operating table to the left (Figure 2-12). Anesthetic drugs or techniques that cause venodilation further reduce venous return with caval obstruction. Studies performed with pregnant women placed in the lateral position have not shown major decreases in cardiac output.233,234
Blood Replacement
At delivery, maternal vascular capacitance is reduced by the volume of the intervillous space (at least 500 mL). Therefore, during vaginal or cesarean delivery, this volume of blood does not need to be replaced and should not be considered in the estimation of blood loss for replacing red blood cells. Hemoconcentration occurs as maternal blood volume declines from 94 mL/kg at term to 76 mL/kg during the postpartum period; this should be considered in the decision as to whether a parturient should receive crystalloid, colloid, or blood for volume replacement.100
General Anesthesia
Airway Management, Oxygenation, and Ventilation
Changes in the maternal airway and respiratory physiology mandate modification of airway management during pregnancy (Box 2-3) (see Chapter 30). The proportion of pregnant women with a Mallampati IV classification increases by 34% between 12 and 38 weeks' gestation.235 Vascular engorgement of the airway results in edema of the oral and nasal pharynx, larynx, and trachea,236 which may lead to difficult tracheal intubation and difficult mask ventilation. Airway edema may be exacerbated in patients with upper respiratory tract infection or preeclampsia and in those who have been pushing for a long time during the second stage of labor. Management of the difficult obstetric airway is discussed in Chapter 30.
Because FRC is reduced, oxygen consumption is increased, and FRC is less than closing capacity in up to 50% of supine individuals.70 Pregnant women become hypoxemic more rapidly than nonpregnant women during episodes of apnea. During apnea accompanying rapid-sequence induction of general anesthesia, PaO2 decreases twice as rapidly (139 versus 58 mm Hg/min) in pregnant versus nonpregnant women.237 Denitrogenation is achieved faster in pregnant versus nonpregnant women because of elevated minute ventilation and decreased FRC. However, after complete denitrogenation via inhalation of 100% oxygen, parturients tolerate only 2 to 3 minutes of apnea, versus 9 minutes in nonpregnant patients, before oxygen saturation decreases to less than 90%.
Ventilation should be adjusted to maintain PaCO2 at approximately 30 mm (4 kPa). This can be achieved with minute ventilation of 121 mL/kg/min; in comparison, 77 mL/kg/min is required to maintain a comparable PaCO2 in nonpregnant women.238 Decreased plasma bicarbonate concentration reduces buffering capacity in pregnancy. Allowing the PaCO2 to increase to the normal level for nonpregnant women results in respiratory acidosis.
Intravenous and Inhalation Anesthetics
Propofol requirement decreases 10% during the first trimester239; this decrease is not accounted for by progesterone because the dose reduction does not correlate with progesterone levels. The elimination half-life of propofol is unaffected by pregnancy, although clearance may be higher.240 The average induction dose of thiopental in pregnant women is 18% lower in the first trimester and 35% lower at term compared with that in nonpregnant women.241,242 The elimination half-life of thiopental in pregnant women is 26.1 hours, compared with 11.5 hours in nonpregnant women243; this is explained by a marked increase in volume of distribution despite increased clearance. Plasma protein binding of thiopental is similar in term pregnant and nonpregnant women.243
The rate of rise of alveolar versus inspired anesthetic concentration (FA/FI) of volatile anesthetics, and thus the speed of induction, is increased during pregnancy because of greater minute ventilation and reduced FRC, despite higher cardiac output.
The minimum alveolar concentration (MAC) for volatile anesthetics is up to 40% lower in pregnancy.244-246 Although MAC is a spinal nociceptive reflex that involves both sensory and motor components,247 practitioners have interpreted this decrease in MAC as indicating that pregnant patients have a decreased requirement for inhaled anesthetics. However, this interpretation has been questioned. Ueyama et al.248 compared bispectral index values in 15 patients undergoing cesarean delivery with sevoflurane general anesthesia versus 15 patients undergoing elective gynecologic surgery and found no difference between groups. This finding suggests that the hypnotic effect of sevoflurane was not enhanced by pregnancy. The investigators concluded that although pregnancy may decrease MAC, it does not decrease volatile anesthetic requirements, and suggested that parturients should be given the same dose of volatile anesthetics as nonpregnant patients. Further work is required to confirm these findings.
Muscle Relaxants
Pseudocholinesterase activity is decreased by 24% before delivery and by 33% on the third postpartum day.249 It returns to normal 2 to 6 weeks postpartum. The reduced activity does not usually result in clinically relevant prolongation of paralysis after a single dose of succinylcholine. Twitch height recovery after administration of succinylcholine is similar between pregnant and nonpregnant women, and recovery may even be faster because the larger volume of distribution results in a lower initial drug concentration and a shorter time before the threshold for recovery is attained. Pregnant women may be less sensitive than nonpregnant women to comparable plasma concentrations of succinylcholine, a feature that also may contribute to more rapid recovery during pregnancy.
Pregnant and postpartum women exhibit enhanced sensitivity to the aminosteroid muscle relaxants vecuronium and rocuronium.250,251 The greater sensitivity to vecuronium is not explained by altered pharmacokinetics because the drug exhibits increased clearance and a shortened elimination half-life in pregnant women.252 The mean onset time and clinical duration of cisatracurium are significantly shorter in women immediately after delivery than in nonpregnant women.253
Chronotropic Agents and Vasopressors
Pregnancy reduces the chronotropic response to isoproterenol and epinephrine because of down-regulation of beta-adrenergic receptors.254 These agents are less-sensitive markers of intravascular injection during administration of an epidural test dose in pregnant patients than in nonpregnant patients. Because of down-regulation of adrenergic receptors, treatment of hypotension requires higher doses of vasopressors such as phenylephrine in pregnant women than in nonpregnant women.
Neuraxial Analgesia and Anesthesia
Technical Considerations and Positioning
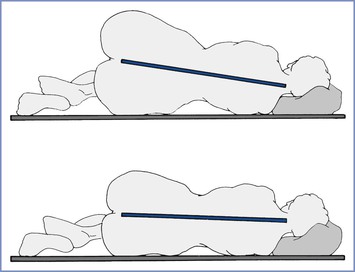
Increased lumbar lordosis during pregnancy may reduce the vertebral interspinous gap, thus creating technical difficulty in administering neuraxial anesthesia (Box 2-4 and Figure 2-13) (see Chapter 12). Widening of the pelvis results in a head-down tilt when a pregnant woman is in the lateral position (Figure 2-14). This may increase the rostral spread of hyperbaric local anesthetics when injected intrathecally with patients in the lateral position. The flow of CSF from a spinal needle is unchanged throughout gestation because pregnancy does not alter CSF pressure.226 However, flow rate may increase during a uterine contraction because of increased CSF pressure.
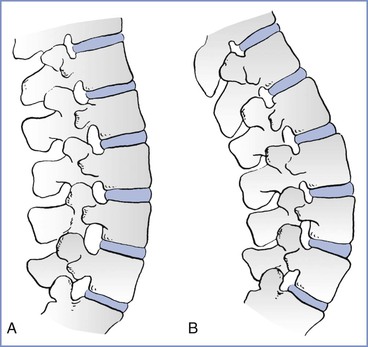
FIGURE 2-13 Effects of pregnancy on the lumbar spine. A, Nonpregnant. B, Pregnant. There is a marked increase in lumbar lordosis and a narrowing of the interspinous spaces during pregnancy. (Modified from Bonica JJ. Principles and Practice of Obstetric Analgesia and Anesthesia, Volume 1. Philadelphia, FA Davis, 1967:35.)
Local Anesthetic Dose Requirements
Pregnant patients show decreased local anesthetic dose requirement in the first trimester. This change occurs well before significant mechanical changes have occurred in the vertebral canal,255 suggesting that there are pregnancy-induced alterations in nerve tissue sensitivity, either directly or indirectly from changes in hormone concentrations.256
Pregnant women exhibit a more rapid onset and a longer duration of spinal anesthesia than nonpregnant women who receive the same dose of local anesthetic. These results are consistent with enhanced neural sensitivity to local anesthetics; pregnancy-associated elevation in CSF pH may contribute to these effects.257-259 The dose of hyperbaric local anesthetic required in term pregnant women is 25% lower than that in nonpregnant women.260,261 This is attributed to the following factors: (1) reduction of spinal CSF volume, which accompanies distention of the vertebral venous plexus40; (2) enhanced neural sensitivity to local anesthetics; (3) increased rostral spread when injections are made with the patient in the lateral position; (4) inward displacement of intervertebral foraminal soft tissue, resulting from increased abdominal pressure262; and (5) a higher level of the apex of the thoracic kyphosis (the lowest point of the thoracic spinal canal in the supine position) during late pregnancy.263 Spinal dose requirements change rapidly in the postpartum period, with segmental dose requirements returning to those of nonpregnant women within 24 to 48 hours264 as spinal CSF volume expands with the relief of vena caval compression. In contrast to spinal anesthesia, pregnancy appears to have less effect on the spread of epidural anesthesia.265,266
Pregnancy does not enhance the susceptibility of ewes to the neurotoxicity of lidocaine or to the cardiac toxicity of bupivacaine (see Chapter 13). The incidence of lethal ventricular arrhythmias is no greater in pregnant than in nonpregnant ewes treated with bupivacaine, ropivacaine, or levobupivacaine.267
Hypotension during Neuraxial Analgesia and Anesthesia
Pregnancy increases dependence on the sympathetic nervous system for the maintenance of venous return and systemic vascular resistance.228 This, together with the effects of aortocaval compression, means that pregnant patients are particularly prone to hypotension and hemodynamic instability from sympathetic block induced by neuraxial anesthesia. Management of hypotension is discussed in Chapter 26.
Effects of Neuraxial Anesthesia on Respiratory Function
FRC diminishes during neuraxial anesthesia, resulting in an increase in respiratory dead space and ventilation-perfusion mismatch. Abdominal muscles are important for forced expiration and coughing, and paralysis of these muscles during neuraxial anesthesia decreases peak expiratory flow rate, maximum expiratory pressure, and the ability to increase intra-abdominal and intrathoracic pressures during coughing.268-270
References
1. Spätling L, Fallenstein F, Huch A, et al. The variability of cardiopulmonary adaptation to pregnancy at rest and during exercise. Br J Obstet Gynaecol. 1992;99(Suppl 8):1–40.
2. Institute of Medicine (U.S.) Committee to Reexamine IOM Pregnancy Weight Guidelines, Rasmussen KM, Yaktine AL. Weight Gain During Pregnancy: Reexamining the Guidelines. National Academies Press: Washington, DC; 2009.
3. Amorim AR, Rossner S, Neovius M, et al. Does excess pregnancy weight gain constitute a major risk for increasing long-term BMI? Obesity. 2007;15:1278–1286.
4. Eghbali M, Wang Y, Toro L, Stefani E. Heart hypertrophy during pregnancy: a better functioning heart? Trends Cardiovasc Med. 2006;16:285–291.
5. Cutforth R, MacDonald CB. Heart sounds and murmurs in pregnancy. Am Heart J. 1966;71:741–747.
6. Northcote RJ, Knight PV, Ballantyne D. Systolic murmurs in pregnancy: value of echocardiographic assessment. Clin Cardiol. 1985;8:327–328.
7. Carruth JE, Mivis SB, Brogan DR, Wenger NK. The electrocardiogram in normal pregnancy. Am Heart J. 1981;102:1075–1078.
8. Oram S, Holt M. Innocent depression of the S-T segment and flattening of the T-wave during pregnancy. J Obstet Gynaecol Br Emp. 1961;68:765–770.
9. Robson SC, Hunter S, Boys RJ, Dunlop W. Serial study of factors influencing changes in cardiac output during human pregnancy. Am J Physiol. 1989;256:H1060–H1065.
10. Campos O, Andrade JL, Bocanegra J, et al. Physiologic multivalvular regurgitation during pregnancy: a longitudinal Doppler echocardiographic study. Int J Cardiol. 1993;40:265–272.
11. Robson SC, Hunter S, Moore M, Dunlop W. Haemodynamic changes during the puerperium: a Doppler and M-mode echocardiographic study. Br J Obstet Gynaecol. 1987;94:1028–1039.
12. Capeless EL, Clapp JF. Cardiovascular changes in early phase of pregnancy. Am J Obstet Gynecol. 1989;161:1449–1453.
13. Laird-Meeter K, van de Ley G, Bom TH, et al. Cardiocirculatory adjustments during pregnancy—an echocardiographic study. Clin Cardiol. 1979;2:328–332.
14. Katz R, Karliner JS, Resnik R. Effects of a natural volume overload state (pregnancy) on left ventricular performance in normal human subjects. Circulation. 1978;58:434–441.
15. Clark SL, Cotton DB, Lee W, et al. Central hemodynamic assessment of normal term pregnancy. Am J Obstet Gynecol. 1989;161:1439–1442.
16. Rubler S, Damani PM, Pinto ER. Cardiac size and performance during pregnancy estimated with echocardiography. Am J Cardiol. 1977;40:534–540.
17. Schannwell CM, Zimmermann T, Schneppenheim M, et al. Left ventricular hypertrophy and diastolic dysfunction in healthy pregnant women. Cardiology. 2002;97:73–78.
18. Flo K, Wilsgaard T, Vartun A, Acharya G. A longitudinal study of the relationship between maternal cardiac output measured by impedance cardiography and uterine artery blood flow in the second half of pregnancy. BJOG. 2010;117:837–844.
19. Fok WY, Chan LY, Wong JT, et al. Left ventricular diastolic function during normal pregnancy: assessment by spectral tissue Doppler imaging. Ultrasound Obstet Gynecol. 2006;28:789–793.
20. Assali NS, Rauramo L, Peltonen T. Measurement of uterine blood flow and uterine metabolism. VIII. Uterine and fetal blood flow and oxygen consumption in early human pregnancy. Am J Obstet Gynecol. 1960;79:86–98.
21. Thaler I, Manor D, Itskovitz J, et al. Changes in uterine blood flow during human pregnancy. Am J Obstet Gynecol. 1990;162:121–125.
22. Rekonen A, Luotola H, Pitkanen M, et al. Measurement of intervillous and myometrial blood flow by an intravenous 133Xe method. Br J Obstet Gynaecol. 1976;83:723–728.
23. Kauppila A, Koskinen M, Puolakka J, et al. Decreased intervillous and unchanged myometrial blood flow in supine recumbency. Obstet Gynecol. 1980;55:203–205.
24. Palmer SK, Zamudio S, Coffin C, et al. Quantitative estimation of human uterine artery blood flow and pelvic blood flow redistribution in pregnancy. Obstet Gynecol. 1992;80:1000–1006.
25. Katz M, Sokal MM. Skin perfusion in pregnancy. Am J Obstet Gynecol. 1980;137:30–33.
26. Dunlop W. Serial changes in renal haemodynamics during normal human pregnancy. Br J Obstet Gynaecol. 1981;88:1–9.
27. U.S. Department of Health and Human Services. Physical Activity Guidelines for Americans. Department of Health and Human Services: Washington, DC; 2008.
28. Gaston A, Cramp A. Exercise during pregnancy: a review of patterns and determinants. J Sci Med Sport. 2011;14:299–305.
29. Nascimento SL, Surita FG, Parpinelli MA, et al. The effect of an antenatal physical exercise programme on maternal/perinatal outcomes and quality of life in overweight and obese pregnant women: a randomised clinical trial. BJOG. 2011;118:1455–1463.
30. Szymanski LM, Satin AJ. Exercise during pregnancy: fetal responses to current public health guidelines. Obstet Gynecol. 2012;119:603–610.
31. Pernoll ML, Metcalfe J, Schlenker TL, et al. Oxygen consumption at rest and during exercise in pregnancy. Respir Physiol. 1975;25:285–293.
32. Ueland K, Novy MJ, Metcalfe J. Cardiorespiratory responses to pregnancy and exercise in normal women and patients with heart disease. Am J Obstet Gynecol. 1973;115:4–10.
33. Wolfe LA, Walker RM, Bonen A, McGrath MJ. Effects of pregnancy and chronic exercise on respiratory responses to graded exercise. J Appl Physiol. 1994;76:1928–1936.
34. Wilson M, Morganti AA, Zervoudakis I, et al. Blood pressure, the renin-aldosterone system and sex steroids throughout normal pregnancy. Am J Med. 1980;68:97–104.
35. Christianson RE. Studies on blood pressure during pregnancy. I. Influence of parity and age. Am J Obstet Gynecol. 1976;125:509–513.
36. Iwasaki R, Ohkuchi A, Furuta I, et al. Relationship between blood pressure level in early pregnancy and subsequent changes in blood pressure during pregnancy. Acta Obstet Gynecol Scand. 2002;81:918–925.
37. Gunderson EP, Chiang V, Lewis CE, et al. Long-term blood pressure changes measured from before to after pregnancy relative to nonparous women. Obstet Gynecol. 2008;112:1294–1302.
38. Kerr MG, Scott DB, Samuel E. Studies of the inferior vena cava in late pregnancy. Br Med J. 1964;1:522–533.
39. Kerr MG. The mechanical effects of the gravid uterus in late pregnancy. J Obstet Gynaecol Br Commonw. 1965;72:513–529.
40. Hirabayashi Y, Shimizu R, Fukuda H, et al. Soft tissue anatomy within the vertebral canal in pregnant women. Br J Anaesth. 1996;77:153–156.
41. Bieniarz J, Yoshida T, Romero-Salinas G, et al. Aortocaval compression by the uterus in late human pregnancy. IV. Circulatory homeostasis by preferential perfusion of the placenta. Am J Obstet Gynecol. 1969;103:19–31.
42. Lees MM, Scott DB, Kerr MG, Taylor SH. The circulatory effects of recumbent postural change in late pregnancy. Clin Sci. 1967;32:453–465.
43. McLennan CE. Antecubital and femoral venous pressure in normal and toxemic pregnancy. Am J Obstet Gynecol. 1943;45:568–591.
44. Eckstein KL, Marx GF. Aortocaval compression and uterine displacement. Anesthesiology. 1974;40:92–96.
45. Kinsella SM, Whitwam JG, Spencer JA. Aortic compression by the uterus: identification with the Finapres digital arterial pressure instrument. Br J Obstet Gynaecol. 1990;97:700–705.
46. Abitbol MM. Aortic compression by pregnant uterus. N Y State J Med. 1976;76:1470–1475.
47. Kuo CD, Chen GY, Yang MJ, Tsai YS. The effect of position on autonomic nervous activity in late pregnancy. Anaesthesia. 1997;52:1161–1165.
48. Milsom I, Forssman L. Factors influencing aortocaval compression in late pregnancy. Am J Obstet Gynecol. 1984;148:764–771.
49. Clark SL, Cotton DB, Pivarnik JM, et al. Position change and central hemodynamic profile during normal third-trimester pregnancy and post partum. Am J Obstet Gynecol. 1991;164:883–887.
50. Drummond GB, Scott SE, Lees MM, Scott DB. Effects of posture on limb blood flow in late pregnancy. BMJ. 1974;2:587–588.
51. Kinsella SM, Lohmann G. Supine hypotensive syndrome. Obstet Gynecol. 1994;83:774–788.
52. Armstrong S, Fernando R, Columb M, Jones T. Cardiac index in term pregnant women in the sitting, lateral, and supine positions: an observational, crossover study. Anesth Analg. 2011;113:318–322.
53. Howard BK, Goodson JH, Mengert WF. Supine hypotensive syndrome in late pregnancy. Obstet Gynecol. 1953;1:371–377.
54. Robson SC, Dunlop W, Boys RJ, Hunter S. Cardiac output during labour. Br Med J (Clin Res Ed). 1987;295:1169–1172.
55. Ueland K, Hansen JM. Maternal cardiovascular dynamics. 3. Labor and delivery under local and caudal analgesia. Am J Obstet Gynecol. 1969;103:8–18.
56. Kjeldsen J. Hemodynamic investigations during labour and delivery. Acta Obstet Gynecol Scand Suppl. 1979;89:1–252.
57. Adams JQ, Alexander AM Jr. Alterations in cardiovascular physiology during labor. Obstet Gynecol. 1958;12:542–549.
58. Hendricks CH. The hemodynamics of a uterine contraction. Am J Obstet Gynecol. 1958;76:969–982.
59. Lee W, Rokey R, Miller J, Cotton DB. Maternal hemodynamic effects of uterine contractions by M-mode and pulsed-Doppler echocardiography. Am J Obstet Gynecol. 1989;161:974–977.
60. Robson SC, Dunlop W, Hunter S. Haemodynamic changes during the early puerperium. Br Med J (Clin Res Ed). 1987;294:1065.
61. Sadaniantz A, Saint LL, Parisi AF. Long-term effects of multiple pregnancies on cardiac dimensions and systolic and diastolic function. Am J Obstet Gynecol. 1996;174:1061–1064.
62. Thomson K, Cohen M. Studies on the circulation in pregnancy. II. Vital capacity observations in normal pregnant women. Surg Gynecol Obstet. 1938;66:591–603.
63. Goldsmith LT, Weiss G, Steinetz BG. Relaxin and its role in pregnancy. Endocrinol Metab Clin North Am. 1995;24:171–186.
64. Contreras G, Gutiérrez M, Beroíza T, et al. Ventilatory drive and respiratory muscle function in pregnancy. Am Rev Respir Dis. 1991;144:837–841.
65. Leontic EA. Respiratory disease in pregnancy. Med Clin North Am. 1977;61:111–128.
66. Wise RA, Polito AJ, Krishnan V. Respiratory physiologic changes in pregnancy. Immunol Allergy Clin North Am. 2006;26:1–12.
67. Hamdan AL, Mahfoud L, Sibai A, Seoud M. Effect of pregnancy on the speaking voice. J Voice. 2009;23:490–493.
68. Grenville-Mathers R, Trenchard HJ. The diaphragm in the puerperium. J Obstet Gynaecol Br Emp. 1953;60:825–833.
69. Nørregaard O, Schultz P, Ostergaard A, Dahl R. Lung function and postural changes during pregnancy. Respir Med. 1989;83:467–470.
70. Russell IF, Chambers WA. Closing volume in normal pregnancy. Br J Anaesth. 1981;53:1043–1047.
71. Lemos A, de Souza AI, Figueiroa JN, et al. Respiratory muscle strength in pregnancy. Respir Med. 2010;104:1638–1644.
72. Harirah HM, Donia SE, Nasrallah FK, et al. Effect of gestational age and position on peak expiratory flow rate: a longitudinal study. Obstet Gynecol. 2005;105:372–376.
73. Grindheim G, Toska K, Estensen ME, Rosseland LA. Changes in pulmonary function during pregnancy: a longitudinal cohort study. BJOG. 2012;119:94–101.
74. Hegewald MJ, Crapo RO. Respiratory physiology in pregnancy. Clin Chest Med. 2011;32:1–13.
75. Baldwin GR, Moorthi DS, Whelton JA, MacDonnell KF. New lung functions and pregnancy. Am J Obstet Gynecol. 1977;127:235–239.
76. Alaily AB, Carrol KB. Pulmonary ventilation in pregnancy. Br J Obstet Gynaecol. 1978;85:518–524.
77. Gee JB, Packer BS, Millen JE, Robin ED. Pulmonary mechanics during pregnancy. J Clin Invest. 1967;46:945–952.
78. Hignett R, Fernando R, McGlennan A, et al. A randomized crossover study to determine the effect of a 30 degrees head-up versus a supine position on the functional residual capacity of term parturients. Anesth Analg. 2011;113:1098–1102.
79. Bobrowski RA. Pulmonary physiology in pregnancy. Clin Obstet Gynecol. 2010;53:285–300.
80. Zwillich CW, Natalino MR, Sutton FD, Weil JV. Effects of progesterone on chemosensitivity in normal men. J Lab Clin Med. 1978;92:262–269.
81. Jensen D, Webb KA, Davies GA, O'Donnell DE. Mechanisms of activity-related breathlessness in healthy human pregnancy. Eur J Appl Physiol. 2009;106:253–265.
82. Jensen D, Duffin J, Lam YM, et al. Physiological mechanisms of hyperventilation during human pregnancy. Respir Physiol Neurobiol. 2008;161:76–86.
83. McAuley SE, Jensen D, McGrath MJ, Wolfe LA. Effects of human pregnancy and aerobic conditioning on alveolar gas exchange during exercise. Can J Physiol Pharmacol. 2005;83:625–633.
84. Moore LG, McCullough RE, Weil JV. Increased HVR in pregnancy: relationship to hormonal and metabolic changes. J Appl Physiol. 1987;62:158–163.
85. Templeton A, Kelman GR. Maternal blood-gases, (PAO2-PaO2), physiological shunt and VD/Vt in normal pregnancy. Br J Anaesth. 1976;48:1001–1004.
86. Bader RA, Bader ME, Rose DF, Braunwald E. Hemodynamics at rest and during exercise in normal pregnancy as studied by cardiac catheterization. J Clin Invest. 1955;34:1524–1536.
87. Sady MA, Haydon BB, Sady SP, et al. Cardiovascular response to maximal cycle exercise during pregnancy and at two and seven months post partum. Am J Obstet Gynecol. 1990;162:1181–1185.
88. Shankar KB, Moseley H, Vemula V, et al. Arterial to end-tidal carbon dioxide tension difference during anaesthesia in early pregnancy. Can J Anaesth. 1989;36:124–127.
89. Shankar KB, Moseley H, Kumar Y, Vemula V. Arterial to end tidal carbon dioxide tension difference during caesarean section anaesthesia. Anaesthesia. 1986;41:698–702.
90. Shankar KB, Moseley H, Kumar Y, et al. Arterial to end-tidal carbon dioxide tension difference during anaesthesia for tubal ligation. Anaesthesia. 1987;42:482–486.
91. Dayal P, Murata Y, Takamura H. Antepartum and postpartum acid-base changes in maternal blood in normal and complicated pregnancies. J Obstet Gynaecol Br Commonw. 1972;79:612–624.
92. Seeds AE, Battaglia FC, Hellegers AE. Effects of pregnancy on the pH, PCO2, and bicarbonate concentrations of peripheral venous blood. Am J Obstet Gynecol. 1964;88:1086–1089.
93. Lim VS, Katz AI, Lindheimer MD. Acid-base regulation in pregnancy. Am J Physiol. 1976;231:1764–1769.
94. Hagerdal M, Morgan CW, Sumner AE, Gutsche BB. Minute ventilation and oxygen consumption during labor with epidural analgesia. Anesthesiology. 1983;59:425–427.
95. Pearson JF, Davies P. The effect on continuous lumbar epidural analgesia on maternal acid-base balance and arterial lactate concentration during the second stage of labour. J Obstet Gynaecol Br Commonw. 1973;80:225–229.
96. Jouppila R, Hollmén A. The effect of segmental epidural analgesia on maternal and foetal acid-base balance, lactate, serum potassium and creatine phosphokinase during labour. Acta Anaesthesiol Scand. 1976;20:259–268.
97. Thalme B, Raabe N, Belfrage P. Lumbar epidural analgesia in labour. II. Effects on glucose, lactate, sodium, chloride, total protein, haematocrit and haemoglobin in maternal, fetal and neonatal blood. Acta Obstet Gynecol Scand. 1974;53:113–119.
98. Pearson JF, Davies P. The effect of continuous lumbar epidural analgesia on the acid-base status of maternal arterial blood during the first stage of labour. J Obstet Gynaecol Br Commonw. 1973;80:218–224.
99. Bernstein IM, Ziegler W, Badger GJ. Plasma volume expansion in early pregnancy. Obstet Gynecol. 2001;97:669–672.
100. Lund CJ, Donovan JC. Blood volume during pregnancy: significance of plasma and red cell volumes. Am J Obstet Gynecol. 1967;98:394–403.
101. Hytten FE, Paintin DB. Increase in plasma volume during normal pregnancy. J Obstet Gynaecol Br Emp. 1963;70:402–407.
102. Taylor DJ, Lind T. Red cell mass during and after normal pregnancy. Br J Obstet Gynaecol. 1979;86:364–370.
103. Pritchard JA. Changes in the blood volume during pregnancy and delivery. Anesthesiology. 1965;26:393–399.
104. Abbassi-Ghanavati M, Greer LG, Cunningham FG. Pregnancy and laboratory studies: a reference table for clinicians. Obstet Gynecol. 2009;114:1326–1331.
105. Duvekot JJ, Cheriex EC, Pieters FA, et al. Early pregnancy changes in hemodynamics and volume homeostasis are consecutive adjustments triggered by a primary fall in systemic vascular tone. Am J Obstet Gynecol. 1993;169:1382–1392.
106. Hayashi Y, Ueyama H, Mashimo T, et al. Circulating mature adrenomedullin is related to blood volume in full-term pregnancy. Anesth Analg. 2005;101:1816–1820.
107. Cotes PM, Canning CE, Lind T. Changes in serum immunoreactive erythropoietin during the menstrual cycle and normal pregnancy. Br J Obstet Gynaecol. 1983;90:304–311.
108. Coryell MN, Beach EF, Robinson AR, et al. Metabolism of women during the reproductive cycle. XVII. Changes in electrophoretic patterns of plasma proteins throughout the cycle and following delivery. J Clin Invest. 1950;29:1559–1567.
109. Mendenhall HW. Serum protein concentrations in pregnancy. I. Concentrations in maternal serum. Am J Obstet Gynecol. 1970;106:388–399.
110. Robertson EG, Cheyne GA. Plasma biochemistry in relation to oedema of pregnancy. J Obstet Gynaecol Br Commonw. 1972;79:769–776.
111. Wu PY, Udani V, Chan L, et al. Colloid osmotic pressure: variations in normal pregnancy. J Perinat Med. 1983;11:193–199.
112. Evans RT, Wroe JM. Plasma cholinesterase changes during pregnancy: their interpretation as a cause of suxamethonium-induced apnoea. Anaesthesia. 1980;35:651–654.
113. Leighton BL, Cheek TG, Gross JB, et al. Succinylcholine pharmacodynamics in peripartum patients. Anesthesiology. 1986;64:202–205.
114. Gerbasi FR, Bottoms S, Farag A, Mammen E. Increased intravascular coagulation associated with pregnancy. Obstet Gynecol. 1990;75:385–389.
115. Tygart SG, McRoyan DK, Spinnato JA, et al. Longitudinal study of platelet indices during normal pregnancy. Am J Obstet Gynecol. 1986;154:883–887.
116. Fay RA, Hughes AO, Farron NT. Platelets in pregnancy: hyperdestruction in pregnancy. Obstet Gynecol. 1983;61:238–240.
117. Norris LA, Sheppard BL, Bonnar J. Increased whole blood platelet aggregation in normal pregnancy can be prevented in vitro by aspirin and dazmegrel (UK38485). Br J Obstet Gynaecol. 1992;99:253–257.
118. Berge LN, Lyngmo V, Svensson B, Nordoy A. The bleeding time in women: an influence of the sex hormones? Acta Obstet Gynecol Scand. 1993;72:423–427.
119. Pitkin RM, Witte DL. Platelet and leukocyte counts in pregnancy. JAMA. 1979;242:2696–2698.
120. Kadir RA, McLintock C. Thrombocytopenia and disorders of platelet function in pregnancy. Semin Thromb Hemost. 2011;37:640–652.
121. Thornton P, Douglas J. Coagulation in pregnancy. Best Pract Res Clin Obstet Gynaecol. 2010;24:339–352.
122. Talbert LM, Langdell RD. Normal values of certain factors in the blood clotting mechanism in pregnancy. Am J Obstet Gynecol. 1964;90:44–50.
123. Kasper CK, Hoags MS, Aggeler PM, Stone S. Blood clotting factors in pregnancy: Factor VIII concentrations in normal and AHF-deficient women. Obstet Gynecol. 1964;24:242–247.
124. Stirling Y, Woolf L, North WR, et al. Haemostasis in normal pregnancy. Thromb Haemost. 1984;52:176–182.
125. Coopland A, Alkjaersig N, Fletcher AP. Reduction in plasma factor 13 (fibrin stabilizing factor) concentration during pregnancy. J Lab Clin Med. 1969;73:144–153.
126. Liu J, Yuan E, Lee L. Gestational age-specific reference intervals for routine haemostatic assays during normal pregnancy. Clin Chim Acta. 2012;413:258–261.
127. Szecsi PB, Jørgensen M, Klajnbard A, et al. Haemostatic reference intervals in pregnancy. Thromb Haemost. 2010;103:718–727.
128. Sharma SK, Philip J, Wiley J. Thromboelastographic changes in healthy parturients and postpartum women. Anesth Analg. 1997;85:94–98.
129. Steer PL, Krantz HB. Thromboelastography and Sonoclot analysis in the healthy parturient. J Clin Anesth. 1993;5:419–424.
130. Karlsson O, Sporrong T, Hillarp A, et al. Prospective longitudinal study of thromboelastography and standard hemostatic laboratory tests in healthy women during normal pregnancy. Anesth Analg. 2012;115:890–898.
131. Butwick A, Harter S. An in vitro investigation of the coagulation effects of exogenous oxytocin using thromboelastography in healthy parturients. Anesth Analg. 2011;113:323–326.
132. Hellgren M. Hemostasis during normal pregnancy and puerperium. Semin Thromb Hemost. 2003;29:125–130.
133. Ueland K. Maternal cardiovascular dynamics. VII. Intrapartum blood volume changes. Am J Obstet Gynecol. 1976;126:671–677.
134. Toledo P, McCarthy RJ, Hewlett BJ, et al. The accuracy of blood loss estimation after simulated vaginal delivery. Anesth Analg. 2007;105:1736–1740.
135. Taylor DJ, Phillips P, Lind T. Puerperal haematological indices. Br J Obstet Gynaecol. 1981;88:601–606.
136. Ygge J. Changes in blood coagulation and fibrinolysis during the puerperium. Am J Obstet Gynecol. 1969;104:2–12.
137. Bonnar J, McNicol GP, Douglas AS. Coagulation and fibrinolytic mechanisms during and after normal childbirth. Br Med J. 1970;2:200–203.
138. Krause PJ, Ingardia CJ, Pontius LT, et al. Host defense during pregnancy: neutrophil chemotaxis and adherence. Am J Obstet Gynecol. 1987;157:274–280.
139. Baboonian C, Griffiths P. Is pregnancy immunosuppressive? Humoral immunity against viruses. Br J Obstet Gynaecol. 1983;90:1168–1175.
140. Piccinni MP. Role of T-cell cytokines in decidua and in cumulus oophorus during pregnancy. Gynecol Obstet Invest. 2007;64:144–148.
141. Munoz-Suano A, Hamilton AB, Betz AG. Gimme shelter: the immune system during pregnancy. Immunol Rev. 2011;241:20–38.
142. Chen SJ, Liu YL, Sytwu HK. Immunologic regulation in pregnancy: from mechanism to therapeutic strategy for immunomodulation. Clin Dev Immunol. 2012;2012:258–391.
143. Vujaklija DV, Gulic T, Sucic S, et al. First trimester pregnancy decidual natural killer cells contain and spontaneously release high quantities of granulysin. Am J Reprod Immunol. 2011;66:363–372.
144. King AE, Kelly RW, Sallenave JM, et al. Innate immune defences in the human uterus during pregnancy. Placenta. 2007;28:1099–1106.
145. Van Thiel DH, Gavaler JS, Stremple J. Lower esophageal sphincter pressure in women using sequential oral contraceptives. Gastroenterology. 1976;71:232–234.
146. Richter JE. Review article: the management of heartburn in pregnancy. Aliment Pharmacol Ther. 2005;22:749–757.
147. Ramu B, Mohan P, Rajasekaran MS, Jayanthi V. Prevalence and risk factors for gastroesophageal reflux in pregnancy. Indian J Gastroenterol. 2011;30:144–147.
148. Fisher RS, Roberts GS, Grabowski CJ, Cohen S. Altered lower esophageal sphincter function during early pregnancy. Gastroenterology. 1978;74:1233–1237.
149. Marrero JM, Goggin PM, de Caestecker JS, et al. Determinants of pregnancy heartburn. Br J Obstet Gynaecol. 1992;99:731–734.
150. Macfie AG, Magides AD, Richmond MN, Reilly CS. Gastric emptying in pregnancy. Br J Anaesth. 1991;67:54–57.
151. Whitehead EM, Smith M, Dean Y, O'Sullivan G. An evaluation of gastric emptying times in pregnancy and the puerperium. Anaesthesia. 1993;48:53–57.
152. Wong CA, Loffredi M, Ganchiff JN, et al. Gastric emptying of water in term pregnancy. Anesthesiology. 2002;96:1395–1400.
153. La Salvia LA, Steffen EA. Delayed gastric emptying time in labor. Am J Obstet Gynecol. 1950;59:1075–1081.
154. Chiloiro M, Darconza G, Piccioli E, et al. Gastric emptying and orocecal transit time in pregnancy. J Gastroenterol. 2001;36:538–543.
155. Davison JS, Davison MC, Hay DM. Gastric emptying time in late pregnancy and labour. J Obstet Gynaecol Br Commonw. 1970;77:37–41.
156. O'Sullivan GM, Sutton AJ, Thompson SA, et al. Noninvasive measurement of gastric emptying in obstetric patients. Anesth Analg. 1987;66:505–511.
157. Sandhar BK, Elliott RH, Windram I, Rowbotham DJ. Peripartum changes in gastric emptying. Anaesthesia. 1992;47:196–198.
158. Wong CA, McCarthy RJ, Fitzgerald PC, et al. Gastric emptying of water in obese pregnant women at term. Anesth Analg. 2007;105:751–755.
159. Derbyshire EJ, Davies J, Detmar P. Changes in bowel function: pregnancy and the puerperium. Dig Dis Sci. 2007;52:324–328.
160. Parry E, Shields R, Turnbull AC. Transit time in the small intestine in pregnancy. J Obstet Gynaecol Br Commonw. 1970;77:900–901.
161. Murray FA, Erskine JP, Fielding J. Gastric secretion in pregnancy. J Obstet Gynaecol Br Emp. 1957;64:373–381.
162. Van Thiel DH, Gavaler JS, Joshi SN, et al. Heartburn of pregnancy. Gastroenterology. 1977;72:666–668.
163. Hong JY, Park JW, Oh JI. Comparison of preoperative gastric contents and serum gastrin concentrations in pregnant and nonpregnant women. J Clin Anesth. 2005;17:451–455.
164. Attia RR, Ebeid AM, Fischer JE, Goudsouzian NG. Maternal fetal and placental gastrin concentrations. Anaesthesia. 1982;37:18–21.
165. Wyner J, Cohen SE. Gastric volume in early pregnancy: effect of metoclopramide. Anesthesiology. 1982;57:209–212.
166. Miller F. Nausea and vomiting in pregnancy: the problem of perception—is it really a disease? Am J Obstet Gynecol. 2002;186:S182–S183.
167. Gill SK, Maltepe C, Koren G. The effect of heartburn and acid reflux on the severity of nausea and vomiting of pregnancy. Can J Gastroenterol. 2009;23:270–272.
168. Carp H, Jayaram A, Stoll M. Ultrasound examination of the stomach contents of parturients. Anesth Analg. 1992;74:683–687.
169. Murphy DF, Nally B, Gardiner J, Unwin A. Effect of metoclopramide on gastric emptying before elective and emergency caesarean section. Br J Anaesth. 1984;56:1113–1116.
170. Roberts RB, Shirley MA. Reducing the risk of acid aspiration during cesarean section. Anesth Analg. 1974;53:859–868.
171. Kubli M, Scrutton MJ, Seed PT, O'Sullivan G. An evaluation of isotonic “sport drinks” during labor. Anesth Analg. 2002;94:404–408.
172. Lahiri SK, Thomas TA, Hodgson RM. Single-dose antacid therapy for the prevention of Mendelson's syndrome. Br J Anaesth. 1973;45:1143–1146.
173. Gin T, Cho AM, Lew JK, et al. Gastric emptying in the postpartum period. Anaesth Intensive Care. 1991;19:521–524.
174. James CF, Gibbs CP, Banner T. Postpartum perioperative risk of aspiration pneumonia. Anesthesiology. 1984;61:756–759.
175. Blouw R, Scatliff J, Craig DB, Palahniuk RJ. Gastric volume and pH in postpartum patients. Anesthesiology. 1976;45:456–457.
176. Lam KK, So HY, Gin T. Gastric pH and volume after oral fluids in the postpartum patient. Can J Anaesth. 1993;40:218–221.
177. Romalis G, Claman AD. Serum enzymes in pregnancy. Am J Obstet Gynecol. 1962;84:1104–1110.
178. Combes B, Shibata H, Adams R, et al. Alterations in sulfobromophthalein sodium-removal mechanisms from blood during normal pregnancy. J Clin Invest. 1963;42:1431–1442.
179. Blum A, Tatour I, Monir M, et al. Gallstones in pregnancy and their complications: postpartum acute pancreatitis and acute peritonitis. Eur J Intern Med. 2005;16:473–476.
180. Mendez-Sanchez N, Chavez-Tapia NC, Uribe M. Pregnancy and gallbladder disease. Ann Hepatol. 2006;5:227–230.
181. Ryan JP, Pellecchia D. Effect of progesterone pretreatment on guinea pig gallbladder motility in vitro. Gastroenterology. 1982;83:81–83.
182. Kern F Jr, Everson GT, DeMark B, et al. Biliary lipids, bile acids, and gallbladder function in the human female: effects of contraceptive steroids. J Lab Clin Med. 1982;99:798–805.
183. Jeyabalan A, Lain KY. Anatomic and functional changes of the upper urinary tract during pregnancy. Urol Clin North Am. 2007;34:1–6.
184. Rasmussen PE, Nielsen FR. Hydronephrosis during pregnancy: a literature survey. Eur J Obstet Gynecol Reprod Biol. 1988;27:249–259.
185. Davison JM, Hytten FE. Glomerular filtration during and after pregnancy. J Obstet Gynaecol Br Commonw. 1974;81:588–595.
186. Conrad KP. Maternal vasodilation in pregnancy: the emerging role of relaxin. Am J Physiol Regul Integr Comp Physiol. 2011;301:R267–R275.
187. Sims EA, Krantz KE. Serial studies of renal function during pregnancy and the puerperium in normal women. J Clin Invest. 1958;37:1764–1774.
188. Lind T, Godfrey KA, Otun H, Philips PR. Changes in serum uric acid concentrations during normal pregnancy. Br J Obstet Gynaecol. 1984;91:128–132.
189. Airoldi J, Weinstein L. Clinical significance of proteinuria in pregnancy. Obstet Gynecol Surv. 2007;62:117–124.
190. Higby K, Suiter CR, Phelps JY, et al. Normal values of urinary albumin and total protein excretion during pregnancy. Am J Obstet Gynecol. 1994;171:984–989.
191. Morikawa M, Yamada T, Minakami H. Outcome of pregnancy in patients with isolated proteinuria. Curr Opin Obstet Gynecol. 2009;21:491–495.
192. Khazardoost S, Maryamnoorzadeh, Abdollahi A, Shafaat M. Comparison of 8-h urine protein and random urinary protein-to-creatinine ratio with 24-h urine protein in pregnancy. J Matern Fetal Neonatal Med. 2012;25:138–140.
193. Smith NA, Lyons JG, McElrath TF. Protein:creatinine ratio in uncomplicated twin pregnancy. Am J Obstet Gynecol. 2010;203:381–384.
194. Davison JM, Hytten FE. The effect of pregnancy on the renal handling of glucose. Br J Obstet Gynaecol. 1975;82:374–381.
195. Harada A, Hershman JM, Reed AW, et al. Comparison of thyroid stimulators and thyroid hormone concentrations in the sera of pregnant women. J Clin Endocrinol Metab. 1979;48:793–797.
196. Dichtel LE, Alexander EK. Preventing and treating maternal hypothyroidism during pregnancy. Curr Opin Endocrinol Diabetes Obes. 2011;18:389–394.
197. Negro R, Schwartz A, Gismondi R, et al. Universal screening versus case finding for detection and treatment of thyroid hormonal dysfunction during pregnancy. J Clin Endocrinol Metab. 2010;95:1699–1707.
198. Blatt AJ, Nakamoto JM, Kaufman HW. National status of testing for hypothyroidism during pregnancy and postpartum. J Clin Endocrinol Metab. 2012;97:777–784.
199. Wang S, Teng WP, Li JX, et al. Effects of maternal subclinical hypothyroidism on obstetrical outcomes during early pregnancy. J Endocrinol Invest. 2012;35:322–325.
200. Felig P, Lynch V. Starvation in human pregnancy: hypoglycemia, hypoinsulinemia, and hyperketonemia. Science. 1970;170:990–992.
201. Fisher PM, Sutherland HW, Bewsher PD. The insulin response to glucose infusion in normal human pregnancy. Diabetologia. 1980;19:15–20.
202. Rosenthal HE, Slaunwhite WR Jr, Sandberg AA. Transcortin: a corticosteroid-binding protein of plasma. X. Cortisol and progesterone interplay and unbound levels of these steroids in pregnancy. J Clin Endocrinol Metab. 1969;29:352–367.
203. Pacheco LD, Ghulmiyyah LM, Snodgrass WR, Hankins GD. Pharmacokinetics of corticosteroids during pregnancy. Am J Perinatol. 2007;24:79–82.
204. Kristiansson P, Svärdsudd K, von Schoultz B. Back pain during pregnancy: a prospective study. Spine (Phila Pa). 1976;21:702–709.
205. Wang SM, Dezinno P, Maranets I, et al. Low back pain during pregnancy: prevalence, risk factors, and outcomes. Obstet Gynecol. 2004;104:65–70.
206. Kristiansson P, Nilsson-Wikmar L, von Schoultz B, et al. Back pain in in-vitro fertilized and spontaneous pregnancies. Hum Reprod. 1998;13:3233–3238.
207. Brynhildsen J, Hansson A, Persson A, Hammar M. Follow-up of patients with low back pain during pregnancy. Obstet Gynecol. 1998;91:182–186.
208. Borg-Stein J, Dugan SA, Gruber J. Musculoskeletal aspects of pregnancy. Am J Phys Med Rehabil. 2005;84:180–192.
209. Berg G, Hammar M, Moller-Nielsen J, et al. Low back pain during pregnancy. Obstet Gynecol. 1988;71:71–75.
210. Wilkinson M. The carpal-tunnel syndrome in pregnancy. Lancet. 1960;275:453–454.
211. Kovacs CS. Calcium and bone metabolism disorders during pregnancy and lactation. Endocrinol Metab Clin North Am. 2011;40:795–826.
212. Naylor KE, Iqbal P, Fledelius C, et al. The effect of pregnancy on bone density and bone turnover. J Bone Miner Res. 2000;15:129–137.
213. Nakayama S, Yasui T, Suto M, et al. Differences in bone metabolism between singleton pregnancy and twin pregnancy. Bone. 2011;49:513–519.
214. American Academy of Sleep Medicine. International Classification of Sleep Disorders Revised: Diagnostic and Coding Manual. American Academy of Sleep Medicine: Westchester, IL; 2000.
215. Pien GW, Schwab RJ. Sleep disorders during pregnancy. Sleep. 2004;27:1405–1417.
216. Facco FL, Kramer J, Ho KH, et al. Sleep disturbances in pregnancy. Obstet Gynecol. 2010;115:77–83.
217. Santiago JR, Nolledo MS, Kinzler W, Santiago TV. Sleep and sleep disorders in pregnancy. Ann Intern Med. 2001;134:396–408.
218. Schweiger MS. Sleep disturbance in pregnancy: a subjective survey. Am J Obstet Gynecol. 1972;114:879–882.
219. Manconi M, Govoni V, De VA, et al. Pregnancy as a risk factor for restless legs syndrome. Sleep Med. 2004;5:305–308.
220. Nevo O, Soustiel JF, Thaler I. Maternal cerebral blood flow during normal pregnancy: a cross-sectional study. Am J Obstet Gynecol. 2010;203:475–476.
221. Cipolla MJ, Sweet JG, Chan SL. Cerebral vascular adaptation to pregnancy and its role in the neurological complications of eclampsia. J Appl Physiol. 2011;110:329–339.
222. Cogan R, Spinnato JA. Pain and discomfort thresholds in late pregnancy. Pain. 1986;27:63–68.
223. Abboud TK, Sarkis F, Hung TT, et al. Effects of epidural anesthesia during labor on maternal plasma beta-endorphin levels. Anesthesiology. 1983;59:1–5.
224. Iwasaki H, Collins JG, Saito Y, Kerman-Hinds A. Naloxone-sensitive, pregnancy-induced changes in behavioral responses to colorectal distention: pregnancy-induced analgesia to visceral stimulation. Anesthesiology. 1991;74:927–933.
225. Messih MN. Epidural space pressures during pregnancy. Anaesthesia. 1981;36:775–782.
226. Marx GF, Zemaitis MT, Orkin LR. Cerebrospinal fluid pressures during labor and obstetrical anesthesia. Anesthesiology. 1961;22:348–354.
227. Assali NS, Prystowsky H. Studies on autonomic blockade. I. Comparison between the effects of tetraethylammonium chloride (TEAC) and high selective spinal anesthesia on blood pressure of normal and toxemic pregnancy. J Clin Invest. 1950;29:1354–1366.
228. Tabsh K, Rudelstorfer R, Nuwayhid B, Assali S. Circulatory responses to hypovolemia in the pregnant and nonpregnant sheep after pharmacologic sympathectomy. Am J Obstet Gynecol. 1986;154:411–419.
229. Goodlin RC. Venous reactivity and pregnancy abnormalities. Acta Obstet Gynecol Scand. 1986;65:345–348.
230. Abitbol MM. Supine position in labor and associated fetal heart rate changes. Obstet Gynecol. 1985;65:481–486.
231. Huch A, Huch R, Schneider H, Rooth G. Continuous transcutaneous monitoring of fetal oxygen tension during labour. Br J Obstet Gynaecol. 1977;84(Suppl 1):1–39.
232. Crawford JS, Burton M, Davies P. Time and lateral tilt at Caesarean section. Br J Anaesth. 1972;44:477–484.
233. Lees MM, Taylor SH, Scott DB, Kerr MG. A study of cardiac output at rest throughout pregnancy. J Obstet Gynaecol Br Commonw. 1967;74:319–328.
234. Ueland K, Novy MJ, Peterson EN, Metcalfe J. Maternal cardiovascular dynamics. IV. The influence of gestational age on the maternal cardiovascular response to posture and exercise. Am J Obstet Gynecol. 1969;104:856–864.
235. Pilkington S, Carli F, Dakin MJ, et al. Increase in Mallampati score during pregnancy. Br J Anaesth. 1995;74:638–642.
236. Dobb G. Laryngeal oedema complicating obstetric anaesthesia. Anaesthesia. 1978;33:839–840.
237. Archer GW Jr, Marx GF. Arterial oxygen tension during apnoea in parturient women. Br J Anaesth. 1974;46:358–360.
238. Rampton AJ, Mallaiah S, Garrett CP. Increased ventilation requirements during obstetric general anaesthesia. Br J Anaesth. 1988;61:730–737.
239. Mongardon N, Servin F, Perrin M, et al. Predicted propofol effect-site concentration for induction and emergence of anesthesia during early pregnancy. Anesth Analg. 2009;109:90–95.
240. Gin T, Gregory MA, Chan K, et al. Pharmacokinetics of propofol in women undergoing elective caesarean section. Br J Anaesth. 1990;64:148–153.
241. Christensen JH, Andreasen F, Jansen JA. Pharmacokinetics of thiopental in caesarian section. Acta Anaesthesiol Scand. 1981;25:174–179.
242. Gin T, Mainland P, Chan MT, Short TG. Decreased thiopental requirements in early pregnancy. Anesthesiology. 1997;86:73–78.
243. Morgan DJ, Blackman GL, Paull JD, Wolf LJ. Pharmacokinetics and plasma binding of thiopental. II. Studies at cesarean section. Anesthesiology. 1981;54:474–480.
244. Palahniuk RJ, Shnider SM, Eger EI. Pregnancy decreases the requirement for inhaled anesthetic agents. Anesthesiology. 1974;41:82–83.
245. Abboud TK, Zhu J, Richardson M, et al. Desflurane: a new volatile anesthetic for cesarean section: maternal and neonatal effects. Acta Anaesthesiol Scand. 1995;39:723–726.
246. Preckel B, Bolten J. Pharmacology of modern volatile anaesthetics. Best Pract Res Clin Anaesthesiol. 2005;19:331–348.
247. Jinks SL, Martin JT, Carstens E, et al. Peri-MAC depression of a nociceptive withdrawal reflex is accompanied by reduced dorsal horn activity with halothane but not isoflurane. Anesthesiology. 2003;98:1128–1138.
248. Ueyama H, Hagihira S, Takashina M, et al. Pregnancy does not enhance volatile anesthetic sensitivity on the brain: an electroencephalographic analysis study. Anesthesiology. 2010;113:577–584.
249. Shnider SM. Serum cholinesterase activity during pregnancy, labor and the puerperium. Anesthesiology. 1965;26:335–339.
250. Baraka A, Jabbour S, Tabboush Z, et al. Onset of vecuronium neuromuscular block is more rapid in patients undergoing caesarean section. Can J Anaesth. 1992;39:135–138.
251. Puhringer FK, Sparr HJ, Mitterschiffthaler G, et al. Extended duration of action of rocuronium in postpartum patients. Anesth Analg. 1997;84:352–354.
252. Dailey PA, Fisher DM, Shnider SM, et al. Pharmacokinetics, placental transfer, and neonatal effects of vecuronium and pancuronium administered during cesarean section. Anesthesiology. 1984;60:569–574.
253. Pan PH, Moore C. Comparison of cisatracurium-induced neuromuscular blockade between immediate postpartum and nonpregnant patients. J Clin Anesth. 2001;13:112–117.
254. DeSimone CA, Leighton BL, Norris MC, et al. The chronotropic effect of isoproterenol is reduced in term pregnant women. Anesthesiology. 1988;69:626–628.
255. Fagraeus L, Urban BJ, Bromage PR. Spread of epidural analgesia in early pregnancy. Anesthesiology. 1983;58:184–187.
256. Datta S, Lambert DH, Gregus J, et al. Differential sensitivities of mammalian nerve fibers during pregnancy. Anesth Analg. 1983;62:1070–1072.
257. Popitz-Bergez FA, Leeson S, Thalhammer JG, Strichartz GR. Intraneural lidocaine uptake compared with analgesic differences between pregnant and nonpregnant rats. Reg Anesth. 1997;22:363–371.
258. Flanagan HL, Datta S, Lambert DH, et al. Effect of pregnancy on bupivacaine-induced conduction blockade in the isolated rabbit vagus nerve. Anesth Analg. 1987;66:123–126.
259. Hirabayashi Y, Shimizu R, Saitoh K, et al. Acid-base state of cerebrospinal fluid during pregnancy and its effect on spread of spinal anaesthesia. Br J Anaesth. 1996;77:352–355.
260. Barclay DL, Renegar OJ, Nelson EW Jr. The influence of inferior vena cava compression on the level of spinal anesthesia. Am J Obstet Gynecol. 1968;101:792–800.
261. Hirabayashi Y, Shimizu R, Saitoh K, Fukuda H. Spread of subarachnoid hyperbaric amethocaine in pregnant women. Br J Anaesth. 1995;74:384–386.
262. Hogan QH, Prost R, Kulier A, et al. Magnetic resonance imaging of cerebrospinal fluid volume and the influence of body habitus and abdominal pressure. Anesthesiology. 1996;84:1341–1349.
263. Hirabayashi Y, Shimizu R, Fukuda H, et al. Anatomical configuration of the spinal column in the supine position. II. Comparison of pregnant and non-pregnant women. Br J Anaesth. 1995;75:6–8.
264. Abouleish EI. Postpartum tubal ligation requires more bupivacaine for spinal anesthesia than does cesarean section. Anesth Analg. 1986;65:897–900.
265. Grundy EM, Zamora AM, Winnie AP. Comparison of spread of epidural anesthesia in pregnant and nonpregnant women. Anesth Analg. 1978;57:544–546.
266. Kalas DB, Senfield RM, Hehre FW. Continuous lumbar peridural anesthesia in obstetrics. IV. Comparison of the number of segments blocked in pregnant and nonpregnant subjects. Anesth Analg. 1966;45:848–851.
267. Santos AC, DeArmas PI. Systemic toxicity of levobupivacaine, bupivacaine, and ropivacaine during continuous intravenous infusion to nonpregnant and pregnant ewes. Anesthesiology. 2001;95:1256–1264.
268. Moir DD. Ventilatory function during epidural analgesia. Br J Anaesth. 1963;35:3–7.
269. Egbert LD, Tamersoy K, Deas TC. Pulmonary function during spinal anesthesia: the mechanism of cough depression. Anesthesiology. 1961;22:882–885.
270. von Ungern-Sternberg BS, Regli A, Bucher E, et al. The effect of epidural analgesia in labour on maternal respiratory function. Anaesthesia. 2004;59:350–353.