Chapter 14 Image quality
 Good image quality will ensure the maximum amount of diagnostic information is gained from the image. Understanding the cause of faults will ensure rectification of the cause and improved image quality.
INTRODUCTION
One of the fundamental roles of practitioners in radiography is to produce optimum radiographs for reporting. Image quality is difficult to define because it is subjective in its nature, but an optimum quality image enables the observer to extract information from the image and make an accurate diagnosis. Poor quality images have a poor signal-to-noise ratio and detract from the process of extracting information. However, there are characteristics of a radiograph, which may be evaluated, and enable the practitioner to distinguish the diagnostic quality of the image. These factors include:
These factors can be affected during the production and processing of the image (both analogue and digital processing) and once the image has been produced or displayed. It is essential that if a film is produced it is viewed under optimum viewing conditions and must not be held up to the nearest light bulb! Digital images must also be viewed on an appropriate monitor with diagnostic resolution.
SIGNAL-TO-NOISE RATIO
One concept used to define image quality is the signal-to-noise ratio. The signal is the useful information from the patient being imaged and the noise is anything that detracts from accessing the information. Useful information is derived from photoelectric interactions within the patient (absorption by body structures) and noise is derived from scattered photons, because the image receptor does not have the ability to determine their origin. In radiographic images if the signal level is high compared to the noise, structures within the body will be clearly seen, but if the signal level is similar to or less than the noise level then the structure will become obliterated.
Images produced in radiography are often a compromise between obtaining a perfect signal and reducing the noise. The production of images is constrained by a number of factors including the radiation dose level and each component of the imaging chain. For example, a faster film-screen system is utilised when imaging the abdomen than for the extremities and this enables the practitioner not only to produce a diagnostic image with minimal noise but to minimise the radiation dose to sensitive organs.
MAGNIFICATION
When producing a radiographic image all objects in the image are larger than the object being X-rayed. This magnification is due to the geometry of imaging. The ideal situation is to have the object being X-rayed as close as possible to the image receptor, parallel to the X-ray tube and the image receptor, with the radiation beam at right angles to the object. This minimises the magnification of the image but also, more importantly, the magnification of the unsharpness in the image (Figs 14.1 and 14.2).
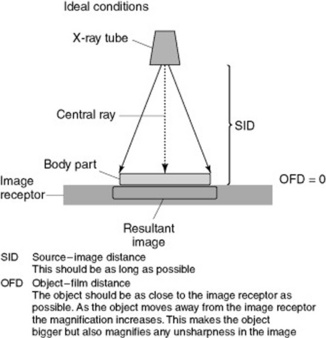
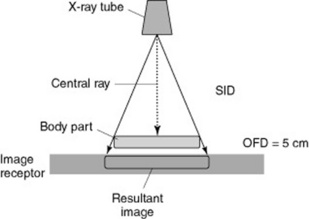
Figure 14.2 Image demonstrating magnification – if the body part is not in contact with the cassette, the result is magnification.
If the object being imaged is not parallel to the image receptor it will be magnified; however, each end will be magnified differently and this will produce distortion. This may be elongation or foreshortening of the image (Fig. 14.3).
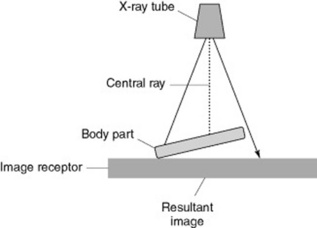
Figure 14.3 Image demonstrating distortion – if the body part is not parallel with the cassette, the result is distortion. Distortion also occurs when the X-ray beam is angled across the object being X-rayed.
The focus to image receptor (SID; see p. 91) should be as long as possible and the distance between the patient and the image receptor (object–film distance, OFD) as short as possible. For practical reasons the SID is usually 110 cm for techniques on the X-ray table and 180 cm for chest and cervical spine erect film work. The OFD should be as close as possible and ideally the object is in contact with the image receptor. Using a Bucky assembly also causes magnification of the image but the grid is necessary to reduce scatter and improve the contrast of the image. Practically, the mechanism which moves the grid and houses the Bucky is kept as small as possible.
SHARPNESS
In order to determine the image quality the image must be sharp. Blurring will reduce the image quality and also reduce the diagnostic quality of the image. The factors affecting sharpness are:
MOVEMENT UNSHARPNESS
Movement unsharpness should be kept to a minimum by careful radiographic technique. Making the patients comfortable, giving them precise instructions on breath holding and planning the procedures all help reduce this. Using short exposure times also helps reduce blur in the image. Exposure times as low as 0.003 seconds for a chest radiograph enable the practitioner to ensure minimum movement, even in paediatric patients.
RESOLUTION OF THE IMAGING SYSTEM
This is covered in more detail in other chapters of the book (see pp. 141, 154). However, it should be noted that the fastest film-screen combination or exposure index compatible with diagnostic quality should be used. When determining the quality required in an image the practitioner must be aware of what structures need to be defined. An image to determine the position of bones in a plaster cast following an orthopaedic reduction needs less resolution than the original image to diagnose the fracture. Ideally the smaller of the foci of the X-ray tube should be used (fine focus) but if this does not enable a short exposure time to be used on a patient likely to move then the practitioner may need to use a broad focus. This is another example of where the practitioner needs to make a decision that is a compromise between the ideal conditions and getting a diagnostic image.
GEOMETRY OF IMAGING
The positioning of the patient (geometry) to produce an image has a direct relationship to the quality of that image. The section on magnification (p. 162) outlined the ideal conditions needed to produce radiographic images and dealt with the requirements to reduce magnification (p. 163). It also emphasised that any increase in the size of the object also increases the unsharpness of the image and this will be explored in this section.
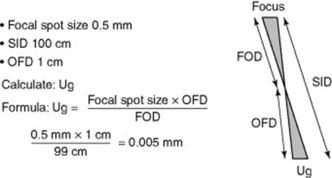
Figure 14.4 is a diagrammatic representation of image production and shows that a penumbra (unsharpness) is formed with any image that is produced from a finite source (focal spot). The diagram uses a large distance between the object and image receptor to illustrate the principle of the penumbra. In practice the amount of geometric unsharpness (Ug) in an image is small and may be much less than 1 mm.
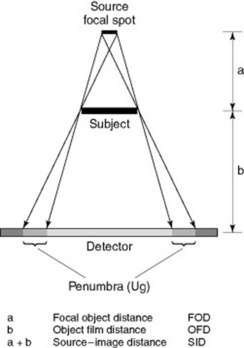
Measurement of the penumbra (Ug) is a straightforward calculation using similar triangles. Figure 14.5 demonstrates the diagrammatic representation of similar triangles and the calculation to determine unsharpness in an image ofa finger due to geometric unsharpness. The values used are typical in radiography and the unsharpness is only 0.005 mm.
MEASUREMENT OF UNSHARPNESS IN AN IMAGE
The sharpness of the image can be measured using a test tool (resolution) or by viewing the image and determining whether fine structures can be visualised (definition). The resolution can be determined by measuring the ability of the imaging system to resolve the smallest object of the test tool and is expressed in line pairs per millimetre (lp mm−1). This is perhaps an abstract concept to illustrate sharpness and it would be more sensible to determine the definition within the image; for example, can I see the bony trabeculae?
Again, however, definition within the image is subjective and depends on a number of factors including the viewing conditions and the experience of the practitioner viewing the image.
RADIOGRAPHIC DENSITY
Radiographic density is generally applied to hard copy images and can be defined as the amount of overall blackening on the film.
It is an easy concept to understand at each extreme of density. All practitioners will be familiar with an image which has so much blackening that it is impossible to see any detail within the image, making it undiagnostic. Similarly, a film which has insufficient blackening, where the structures cannot be defined at all, has no diagnostic value. The secret to good practice is to produce an image with the ‘optimum density’, enabling the practitioner viewing the film to make an accurate evaluation of the patient’s condition and therefore the correct diagnosis. Unfortunately in conventional film-screen radiography, once the image is processed there is little that can be done to rectify a poor quality image except use a bright light to look at images with too much blackening.
The equivalent term when viewing digital images is ‘brightness’ and this may be defined as the intensity of light that represents the individual pixels in the image. Brightness is controlled by the processing software and can be adjusted following image processing.
Numerous factors can affect the radiographic density, as shown in Box 14.1.
Box 14.1 Factors affecting the radiographic density
| Milliampere-second (mA s) | This is the product of the mA and duration of the exposure (exposure time). The mA s directly affects the density of the image. Increasing the mA s increases the intensity (number of photons) in the X-ray beam and hence the number incident on the image receptor. |
| Kilovoltage (kVp) | Increasing the kVp increases the intensity of the X-ray beam. Unlike mA s there is no direct relationship between density and kVp. Changes in the kVp also affect the quality of the beam (the range of photons) and the radiographic contrast. |
| Source–image distance (SID) | The intensity of the X-ray beam changes due to the inverse square law. As the distance to the source of the radiation (focus) increases the intensity decreases as a product of the square of the distance. |
| Use of grids | These absorb both the primary beam but, more predominantly, the scattered radiation. Grids reduce the overall density of the image and improve the radiographic contrast. |
| Film-screen speed | When using a film-screen combination the relative speed of the system will affect the density. Higher film-screen speeds are more efficient and increase the density of the image. |
| Collimation | Increasing the area of the patient that is irradiated will produce more scattered radiation and hence reduce the density of the image. |
| Good collimation increases the contrast of the image. | |
| Tube filtration | This is fixed in modern tubes but altering the filtration may affect the range of photons produced and hence the density. |
| Processing | Both the development of film in a film processor and the operating characteristics of the digital processor can affect the density. |
When viewing a radiograph that is suboptimal, due to the radiographic density, it can be difficult to define the reason for the problem. This will be discussed at the end of the chapter.
CONTRAST
Contrast is a more difficult concept to understand in an image and can be influenced by a number of factors (Box 14.2). There are a number of ways of defining contrast in an image. Generally when we refer to contrast we mean the radiographic contrast, but practitioners should be precise in their terminology.
Box 14.2 Factors affecting radiographic contrast
| Kilovoltage (kVp) | Increasing the kVp increases the intensity of the X-ray beam. The predominant process above 60 kVp is Compton scatter. Generally speaking, as the kVp increases the radiographic contrast decreases and this is due to the increased scattered radiation produced. |
| Subject contrast | The composition of the patient varies depending on the anatomical area. Images of the chest and abdomen have very different inherent contrast. |
| Collimation | It is essential to collimate (restrict the size of the beam) to the area being X-rayed. Increasing the area irradiated increases the scatter produced and therefore reduces the contrast. |
| Film-screen combination | The type and speed of the film-screen combination determines the inherent contrast of the image. |
| Grids | Grids eliminate scattered radiation and increase the contrast of the image. |
| Air gap | Air gaps have a similar function to grids. If there is a large distance between the object and the image receptor (OFD) a number of scattered photons, as they travel forward, will miss the image receptor. |
| Processing | Both the development of film and the manipulation of the digital image can affect the contrast. |
| VDU characteristics | The contrast can be adjusted by windowing the image post acquisition. Together with brightness adjustment, windowing allows the practitioners to view a wide range of structures. |
| Contrast agents | These are used to enhance the contrast of the image. They generally occupy an internal structure of the body, e.g. bowel. The subject contrast is therefore altered, affecting the contrast of the image. |
The radiographic contrast of any image will affect the ability to make an accurate diagnosis: if it is not optimum important structures may be poorly defined and an incorrect diagnosis made.
Practitioners may think that resolution of an image is dependant on the contrast qualities of the image. Unfortunately, due to the subjective nature of viewing images, the concept that these two factors are dependent on each other still confuses inexperienced practitioners. High contrast images appear sharper (higher resolution) to the inexperienced practitioner. When viewing images the ability to see small structures is the true measure of definition. The resolution should always be measured in an image, which has an optimum radiographic density and contrast.
LATITUDE
The latitude of the film-screen combination is determined during manufacture. Latitude can be defined as the region of useful exposure which will produce an image in the diagnostic range of densities.
In film-screen imaging an optimum exposure will produce an image with the details required in the useful density range (Fig. 14.8). Unfortunately it is not possible to manufacture a film with both high contrast and wide latitude. Generally speaking, the faster the film (the less exposure it needs to reach the maximum density) the higher the radiographic contrast and the narrower the latitude. A film-screen system with a speed index of 100 has the highest resolution and a wide exposure latitude. A film-screen system with a speed index of 400 requires less exposure to produce an image and has less resolution and narrow latitude. Figure 14.9 demonstrates the characteristic curves for two films – film A is a 400-speed system and film B a 100-speed.
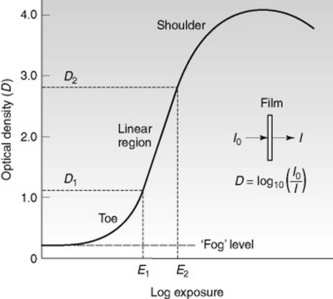
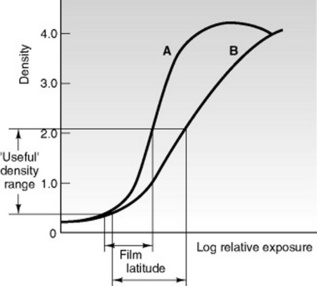
Overexposure will produce an image with too high a radiographic density whilst underexposure will produce an image with one that is too low. In a faster speed film-screen combination, which has narrower latitude, it is easier to over- or underexpose the image as the useful density region is narrow. The contrast of the image in both of these circumstances is reduced, affecting the practitioner’s ability to see detail within the image.
VIEWING A RADIOGRAPH
Having taken all the knowledge and skills of the practitioner to produce an optimum image it is essential that the image produced is viewed under optimum conditions. The equipment used and the environment used to view the image will affect the practitioner’s ability to extract information from the image. It is important not only to have correct viewing conditions but also to concentrate on viewing the image without distraction from colleagues.
The viewing box is the main equipment for viewing hard copy images. It is essential that all viewing boxes are part of a Quality Assurance programme and that the colour and intensity of light output are comparable. The viewing box must have even illumination, with a northern or tropical daylight output and a colour temperature of 6500 K.
There are six specific factors associated with the viewing of images that need to be considered when viewing images. The following information is taken from EUR 16260EN:
‘The proper assessment of image quality and accurate reporting on the diagnostic information in the radiographs can best be achieved when the viewing conditions meet the following requirement:
ACCEPTABLE IMAGE GUIDELINES
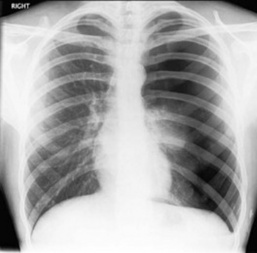
Image quality is normally considered in terms of the practitioner’s ability to perceive normal anatomy or detect any potential pathology. The image must have optimum contrast and density, maximum image sharpness and minimal noise. The image should demonstrate the anatomy or pathology of interest as conspicuously as possible; for example in extremity radiography this is bony trabeculae and for a chest radiograph a sharp reproduction of the vascular pattern in the whole lung, particularly the peripheral vessels, is required.
EUR 16260 EN gives details of guidelines for quality criteria for a number of radiographic examinations (chest, skull, lumbar spine and pelvis)1 and EUR 16261EN outlines quality criteria for paediatrics.2 Images should only be repeated if they are not of diagnostic quality (Box 14.3). If the clinical question is answered by the image but it is of poor aesthetic quality the image should not be repeated.
Box 14.3 Factors affecting acceptable image quality
| Image annotation | The patient identification, the date of examination, positional markers and the name of the facility must be present and legible on the film. These annotations should not obscure the diagnostically relevant areas of the radiograph. |
| Patient positioning | Correct patient positioning plays a major role in determining the success of any radiographic examination. The area of interest must be included and the patient must be correctly positioned to demonstrate the relevant anatomy. |
| Image definition | The relevant anatomy is visualised and the area of interest sufficiently penetrated, e.g. bone trabeculae, skin surface. The structures are shown without misleading distortion. |
| Collimation | Image quality is improved and the radiation dose to the patient is reduced by limiting the X-ray beam to the smallest field giving the required diagnostic information. Radiosensitive organs need to be excluded whenever possible from the primary beam. On no occasion should the X-ray beam fall outside the image receptor area. |
| Protective shielding | for radiation protection purposes, standard protection devices should be available to shield radiosensitive tissues or organs whenever possible. |
| Film blackening and contrast | This has a major influence on image quality. The range of the mean optical density (D) of a clinical radiograph should normally lie between D = 1.0 and D = 1.4 and the optical densities of fog and film base should not exceed D = 0.25. For the diagnostically relevant parts of the film, the overall range of optical densities should lie between 0.5 and 2.2. These densities are difficult to assess subjectively; therefore the definition of one or a few critical points of the particular radiographic projections would be desirable where the optical density of a specific anatomical feature and its contrast relative to the surrounding image could be measured; e.g. bony trabeculae and skin surface. |
| Film processing | Optimal processing of the radiographic film has important implications both for the diagnostic quality of the image and for the radiation dose to the patient. Film processors should be maintained at their optimum operating conditions as determined by regular and frequent (i.e. daily) quality control procedures. |
| Radiographic exposure conditions | Knowledge and correct use of appropriate radiographic exposure factors, for example kVp, focal spot value, tube filtration, and source–image distance (SID) is necessary because they have a considerable impact on image quality. |
| Artefacts | The image should be free from artefacts, especially clothing which may obscure relevant details. |
COMMON FAULTS WITH REMEDY
This is a difficult concept to articulate and I would strongly advise the practitioner to perform the task of image evaluation with an experienced radiographer or clinical tutor. Often it is difficult to determine the exact cause of the fault and a systematic approach is desirable to determine what may have caused your image to be of poor quality (Table 14.1).
Table 14.1 Common faults with remedy
Whitley AS, Sloane C, Hoadley G, et al. Clarke’s positioning in radiography, 12th edn. London: Hodder Arnold, 2005.
The definitive work on radiographic technique. Comprehensive information presented in a logical manner with excellent illustrations..
Gunn C. Radiographic imaging: a practical approach, 3rd revised edn. Edinburgh: Churchill Livingstone, 2002.
Covers all aspects of imaging technology, easy to use, learn from and an easy reference..
Fauber T. Radiographic imaging and exposure, 2nd edn. St Louis: Mosby, 2004.
Thorough yet practical approach to fundamental principles. This is an American text so you need to be a little cautious of terminology..
http://health.gulfcoast.edu/chest2/image.htm. [Accessed 28 February 2008]
Interesting definition of terms with images..
http://www.nde-ed.org/EducationResources/CommunityCollege/Radiography/cc_rad_index.htm. [Accessed 28 February 2008]
Excellent website with a comprehensive range of information..