Chapter 3 Measuring health
Overview
We have seen in Chapter 1 how people define health in different ways and in Chapter 2 how there are different determinants of health. This would suggest that measuring health is not a simple task. This appears to be borne out by the existence of a number of ways of measuring health and a lack of clear agreement about which are the best ways to measure health and which sources of information are most useful. This chapter looks first at why we might want to measure health. It goes on to investigate the different means of measuring health currently in use and unpacks some of the assumptions underlying their use. Finally, the uses of the different kinds of measures are explored. The practical uses of measuring health are discussed further in Chapters 18 and 19 on needs assessment and programme planning, and in Chapter 20 on evaluation.
Why measure health?
Finding a means to measure health is an important practical task for health promoters. There are several reasons why this is so.
Ways of measuring health
Depending on the purpose, different measures of health may be used or developed. The means of measuring health depend primarily on the view of health which is held. If health is basically about physical functioning, then measures of physical fitness will be an adequate measure of health. If health is defined as having no disease, then measures of the extent of disease may be used (in reverse) as measures of health. However, if health is defined as including social and mental aspects and as meaning something other than being not ill, specific measurements of health will need to be developed.
 BOX 3.1
If you wanted to describe the health of the people where you live or work, what information would you need?
It is likely that you included:
Community health workers who profile their communities have many different ways of building a picture of their area. Some of these are described in Chapter 18 on needs assessment. In this chapter we look at sources of information available to describe a community’s health. A great deal of information is available online. For example, in the UK you can find out about your local area by visiting http://neighbourhood.statistics.gov.uk and, for those living in Scotland, www.gro-scotland.gov.uk/statistics.
We shall look next at the contribution of epidemiology through the measurement of health as a negative variable, and move on to consider the measurement of health as a positive variable. Measuring health as a negative variable means measuring the opposite to health (e.g. disease or death) and using these results to infer the degree of health. Health is therefore being defined as a negative (health is not being ill or dead), not as a positive (health as positive well-being).
Measuring health as a negative variable (e.g. health is not being diseased or ill)
Epidemiology is the study of the occurrence and spread of diseases in the population. It is concerned with the health status (or, more usually, the ill-health status) of populations. Health promoters use epidemiological evidence to identify health problems, at-risk groups and the effectiveness of preventive measures. The most common means of assessing a population’s health are through mortality and morbidity rates. This reflects the reductionist model of health which sees health as a simple matter of illness or its absence. Thus data on deaths and illnesses are often used as surrogate measures of health. There are clearly shortcomings to this approach. Measuring conditions which limit health, such as illness, is not the same as measuring health itself. Measuring mortality rates does not reflect the extent of illness in the population, nor does it say anything about the quality of health experienced by people when they were alive. Conditions such as arthritis or schizophrenia cause considerable suffering and pain but do not lead to premature death and so are not reflected in mortality rates.
 BOX 3.2
If you wished to develop a health promotion intervention to improve food hygiene, why would mortality rates be a poor indicator of its priority?
On the plus side, statistics concerning mortality are readily obtainable in developed countries. A death certificate is taken to the Registrar of Births, Deaths and Marriages and the Director of Public Health in every health authority and the total number of deaths, the geographic and population variations and the causes of death are all collated in each district’s annual public health report. The statistics can also be used in international comparisons because most countries hold some form of database on deaths and disease rates.
All countries have systems of collecting data on the health status of the population and the use of services. Although these statistics are often presented as if they were objective facts, it is important to remember that statistics are devised by people in a social context, subject to assumptions, bias and error. At every stage of the data-collecting process, decisions are taken which help shape the ultimate form of information presented.
In low-income countries mortality statistics may not be complete. Can you think of reasons why this might be the case?
The International Classification of Diseases, Injuries and Causes of Death (ICD) classifies death according to diagnosed diseases which cause death, e.g. cancer of the lung. Death certificates which use the ICD thus give no information about contributory risk factors such as smoking or diet.
Mortality statistics
There are several different ways of expressing death rates. The crude death rate is the number of deaths per 1000 people per year. However, this figure is affected by the age structure of the population, which may vary over time and region. An area with a high proportion of older people, such as a south-coast retirement town, would have consistently higher death rates than a more deprived area with a higher percentage of premature deaths, such as an inner-city area. The standardized mortality ratio (SMR) measures the death rate, taking into account differences in age structure. It is the number of deaths experienced within a population group (which may be defined by geographic or socioeconomic factors) compared to what would be expected for this group if national averages applied, taking age differences into account. The overall average for England and Wales is 100, so SMRs of below 100 indicate a lower than average mortality rate, whereas SMRs of more than 100 indicate higher than average mortality rates.
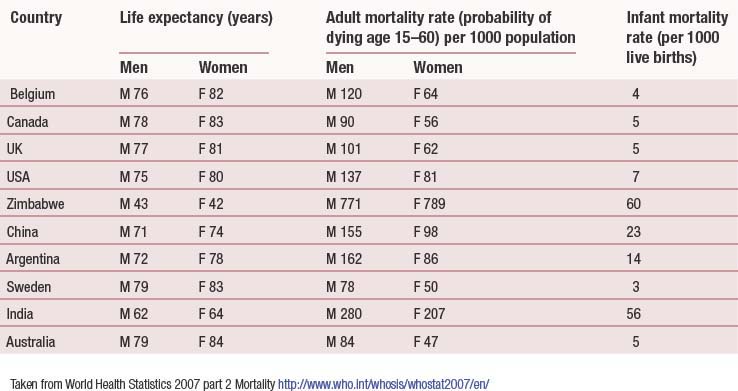
The infant mortality rate (IMR) is another commonly used statistic. The IMR is the number of deaths in the first year of life per 1000 live births. The IMR is strongly associated with adult mortality rates. It reflects maternal health, particularly nutrition, and the provision of social care and child welfare. The IMR is therefore capable of being used as an indicator of the general health of the population, particularly when comparisons between countries are being drawn. The perinatal mortality rate (PMR) is the number of stillbirths and deaths in the first 7 days after birth per 1000 births. The neonatal death rate is the number of deaths occurring in the first 28 days after birth per 1000 live births. Both the SMR and the IMR are readily available statistics, and therefore easy to use as surrogate measures of health. Table 3.1 (p. 39) compares key health indicators for different countries worldwide.
Death rates are also available broken down by gender, social class and cause. In the UK, it is well established that death rates are related to social class and gender (Department of Health 2005; Lantz et al 2001; Townsend et al 1998). People in the lower social classes have higher than average death rates at all ages and for virtually all causes. These social class differences show no sign of diminishing. Indeed, social class inequalities in IMRs and life expectancy continue to grow, although there are some signs of progress, e.g. in child poverty and housing indicators (Department of Health 2005). It may well take some time for any strategies currently being implemented to have an impact on mortality indicators. Women in developed countries live longer on average than men, so their premature death rate is lower than that of men. This is discussed in greater detail in Chapter 2.
Reductions in mortality for selected causes among targeted groups in the population constitute the majority of targets in public health strategies.
 BOX 3.6
Targets of Saving Lives: Our Healthier Nation
By 2010, reductions in mortality in the following areas:
Baseline: 1996 (Department of Health 1999).
Morbidity statistics
Statistics measuring illness and disease are more difficult to obtain. This is due in part to the difficulty in establishing a hard and fast line between health and disease. There is no one source of data for the whole population concerning disease and illness. Instead, there are a number of different sources of relevant information. These are summarized below.
Sources of health information in the UK
These sources of data may be accessed from public health departments, hospital-based data sets, the Health Protection Agency, primary care consultation rates, local delivery plans, local surveys and the Office for National Statistics. Useful websites include: www.statistics.gov.uk (Office for National Statistics); www.hpa.org.uk (Health Protection Agency); www.apho.org.uk (Association of Public Health Observatories); www.rcgp.org.uk (Royal College of General Practitioners); and www.hse.gov.uk (Health and Safety Executive).
Morbidity
Information on health status and behaviour
GP records on diagnoses, communicable and respiratory disease monitoring, e.g. PRIMIS+(primary care information services)
Demographic data
The health services collect routine data on the use of their services and activity rate. These data can be used to express the disease experience of different populations but there are several problems with adopting this approach. The main problem with using many of the health authority measurements is that they were developed primarily for administrative, planning or management tasks, and reflect available services and use of these services rather than health itself. Health authority data are primarily collected as a management tool. To some extent, this determines what data are collected. Routinely available morbidity data represent only the tip of the illness iceberg. Many people who are ill do not seek help from primary care services or hospitals. However, the advantage of using data of this kind is that they are routinely collected, are consistent across regions and are easily accessed.
Hospital episodes statistics (HES) is a patient-based data set that contains all finished episodes of hospital care by diagnosis and treatment (www.hesonline.nhs.uk):
The General Household Survey (GHS) is a continuous government survey of a sample of the population. The GHS includes questions on people’s experience of illness, both long-term (chronic) and within the last fortnight (acute). GHS data are difficult to use comparatively over time as the wording of the questions changes occasionally. The following are examples of questions used in the GHS:
The GHS is useful in providing information on people’s subjective experience of illness, because it relies on people’s self-reported illness rather than use of services. It also collects information on people’s health-related behaviour such as smoking, drinking and exercise. For example, one question asks: ‘Do you smoke cigarettes at all nowadays?’
A number of proxy measures of health are used such as the number of days at work lost due to sickness. However, such data are only available for people in paid employment. The large section of the population who are not in paid employment, and their experience of illness, is therefore invisible.
Two areas of equal size and population structure experience very different unemployment rates. Area A has 40% unemployment whereas area B has 10%. The sickness rate for employed people is the same.
Area B will have the highest sickness rate, but it is likely that the actual extent of ill health will be greater in area A, because unemployment is associated with increased ill health (Moser et al 1990; White 1991; Bethune 1997).
Various government research studies have developed measures to assess disability and to produce estimates of the number of people with disabilities in the population. The Office for National Statistics (ONS) uses questions based on the World Health Organization’s International Classification of Impairments, Disabilities and Handicaps (1980). These disability indices are based on the results of questionnaires asking people what, if any, difficulty they experience in daily life. The onus is therefore placed on the individual being unable to perform certain tasks such as taking a bath or walking unaided up flights of stairs. The reason for these difficulties could be located in housing design and might be capable of being remedied by modifying the home environment. However, by treating disability as an inherent individual attribute, the effect of the social environment in generating and maintaining disability is rendered invisible. This approach has been criticized by proponents of the social model of disability, who argue that the social production of disability should be recognized and challenged (Shakespeare & Watson 1997). The revised World Health Organization (2001) International Classification of Functioning, Disability and Health separates impairments of body functions from restrictions in the ability to perform social roles and participate.
A typical question from disability surveys is: ‘Does this illness or disability limit your activities in any way?’
Epidemiological studies examine the distribution and patterns of health and disease in populations. Epidemiological data help to build up a picture by:
Scale of the problem
Causation and association
Lung cancer and smoking
Most patients with lung cancer have smoked. The proportion of smokers who develop lung cancer is much higher than the proportion of non-smokers. Does smoking cause lung cancer?
Not all smokers will develop lung cancer, and some non-smokers will develop lung cancer. That someone smokes is not a sufficient or necessary cause to develop lung cancer, but it is a very strong risk factor and the more an individual smokes, the greater the risk. The Bradford Hill criteria for determining causation are discussed in Crichton (2008) and Unwin et al (1997).
Identifying risk
Epidemiologists assess risk in terms of the statistical probability of adverse events or death occurring. The link between these events and identified contributory factors varies from negligible to high. Lay people, by contrast, assess risk in the light of their personal experience. This difference in focus (whole populations versus specific individuals at a specific time) is problematic for health promoters. Rose (1981) called this the ‘prevention paradox’: for one person to benefit, many people have to change their behaviour, even though they will not benefit from so doing. Public awareness of this paradox can become a barrier to behaviour change.
Epidemiological studies of mortality, illness, disease and disability are often used to talk about health. Such usage reinforces, albeit in an indirect way, the definition of health as ‘not disease’. But the advantage of such statistics is that they are already collected, are relatively consistent and are readily available. Recognizing the limitations of such measures has prompted health promoters to develop new means of measuring health as an independent phenomenon distinct from illness or disease. These measures may be conveniently divided into those describing health as an objective quality which is an attribute of people or environments, and those describing health as a subjective reality which is socially produced.
Measures of health as an objective attribute
There are a number of ways of measuring health as an objective factor, including:
Health measures
There are a number of measures of the health status of people, including vital statistics such as height and weight, and dental health status (the decayed, missing and filled teeth, or DMF, index). Floud (1989) argues that the average height of a population may be taken as a measure of health, as it represents a proxy for nutritional status and therefore welfare. The Health Survey for England 2003 (Department of Health 2004) included height and weight measurements for this reason. In the same way, Townsend et al (1987) use the percentage of low-birth-weight babies as an indicator of health.
Health behaviour indicators
Increasingly common are measurements of people’s behaviour which are then used as a measure of health. For example, the number of people smoking, drinking alcohol, using drugs, taking regular exercise, eating a healthy diet, practising safer sex or planned fertility may all be used to describe different populations, and to make comparisons between them regarding relative health status. This information may be routinely collected, such as smoking prevalence in young people, or it may be obtained from commissioned surveys. For example, Cancer Research UK commissioned the ONS to carry out a sun protection survey in 2003 (http://cancerresearchuk.org). These lifestyle measures are sometimes narrowed down to more specific behaviour in relation to the health services. For example, the percentage of children immunized against childhood illnesses, or the percentage of women screened for cervical and breast cancer, may be used to describe the health status of a population.
Environmental indicators
The same method may be applied to physical and social environments. Measurements of the physical environment include air and water quality, and housing type and density. These measures are routinely collected by the environmental health departments of local authorities. The European Happy Planet Index combines measures of carbon footprints, life expectancy and life satisfaction (Thompson et al 2007).
Socioeconomic indicators
Socioeconomic status (SES), including educational attainment, occupational status and income, is related to health in developed countries, with higher SES being associated with better health (Adler et al 2007). The social environment may also be measured in terms of its ‘healthiness’. One of the measures most commonly used to assess the social environment is wealth. The gross domestic product (GDP – the value of all goods and services produced within a nation in a given year) measures economic well-being, but this forms only part of social well-being (also called quality of life or social welfare). Happiness and life satisfaction are only weakly related to GDP for the developed Organization for Economic Cooperation and Development (OECD) countries (Allin 2007). Factors that are more strongly associated with health include well-developed primary health care systems (Macinko et al 2003), redistributive and egalitarian policies (Navarro et al 2006) and more equal income distribution, high levels of female education and reduced ethnic fragmentation and conflict (Filmer & Pritchett 1999).
The United Nations Development Programme has introduced a new way of measuring development that incorporates health. The human development index (HDI) is a single statistic that combines indicators of life expectancy, educational attainment and income and was first used in 1990 (http://hdr.undp.org/en/humandev/hdi/). Since then, gender inequalities have also been added into the equation, leading to the gender-related development index.
Objective measurements of people’s health status, health-related behaviour and the environment may be combined to provide an overall picture of health. The health of different populations, from neighbourhoods to nations, may be assessed and compared using this method. Targets for improvements in health may also be set using these measurements.
Improvements in the social and physical environment, such as an increase in the number, accessibility and safety of play areas and sports centres, or improvements in housing amenities and density, may also be added into the equation (Catford 1983; World Health Organization 1985). People’s health-related beliefs and attitudes, and the extent to which they conform to professional beliefs, have also been considered to be a measure of health (Catford 1983). For example, the percentage of the population seeking to make recommended lifestyle changes, or having an understanding of basic health issues, has been suggested as a positive health measure. Subjective social status (SSS), a judgement of one’s socioeconomic position taking into account education, income and occupation, has also been linked to health status (Adler et al 2007). Combining a number of discrete elements to measure health is attractive because it gives a more rounded picture of health, and provides a clear basis and direction for health promoters.
Health impact assessment
Health impact assessment (HIA) has emerged as a systematic means of assessing health and measuring the health outcomes of policies and interventions on defined populations (Lock 2000). HIAs are often used to evaluate the impact of policies that focus on factors other than health. HIA includes qualitative and quantitative methodologies and collaboration with interested partners, including workers, clients and other stakeholders. This allows for a multidisciplinary definition of health to evolve. Some examples may be found via the HIA gateway at www.apho.org.uk. A rapid HIA of the proposed Olympic Games was conducted for London (www.londonshealth.gov.uk/PDF/Olympic_HIA.pdf). It concluded that hosting the Olympic Games would provide net benefits to local communities due to increased employment, greater physical activity and enhanced community cohesion.
Measuring deprivation
Much of the evidence which finds that people who are most disadvantaged experience more illness and premature death has derived from the link between occupational class and health status. Occupational class is still the main measure of SES, although other factors such as gender, age and ethnicity are also recognized as having an important impact on SES. The limitations of using occupational categories are discussed in Chapter 2. The classification of socioeconomic classes is derived from census information on type of employment. Since 2001 eight socioeconomic classes have been used (see Chapter 2 for further details).
The index of multiple deprivation (IMD) combines seven discrete domains of deprivation at a local area level to form a single score. The seven domains of deprivation are: income; employment; health and disability; education, skills and training; housing and services; living environment; and crime (www.communities.gov.uk). Each domain includes several different indicators. For example, the income domain includes:
In addition indices for income deprivation affecting children and older people have been developed.
Explanations of health inequalities are discussed in Chapter 2 and may be divided into four categories: psychosocial (social stress); behavioural (lifestyle choices); lifecourse (cumulative cross-generational factors); and neomaterialist explanations (wider socioeconomic and psychosocial environments) (Bartley 2004).
Subjective health measures
The previous section has outlined means of measuring health as if it were an objective property of beings, societies, or environments, capable of scientific scrutiny. However, it is apparent that health is not such a simple or uncontested attribute. Chapter 1 highlighted the importance of subjective interpretations of health and the multiple meanings health may have in different contexts. This has led some researchers to attempt to devise measurements of health which incorporate subjective reporting of health. Herzlich (1973) identified three different aspects to people’s accounts of health:
Bowling (1997) identifies five dimensions of subjective health:
This is very similar to the Blaxter’s (1990) earlier classification, with the one difference being the last category, where Blaxter identified physical fitness and vitality instead of life satisfaction and morale.
Jeff is 78 years old. His wife died last year after several years of Alzheimer’s disease, during which he cared for her. He has one son who visits rarely. Jeff has been in good physical health and used to walk to the local shops every day. He lives in the same terraced house in which he was born. The area is now full of young working couples. Jeff has been to see his GP for the first time in 8 years because he is suffering from acute headaches.
Physical well-being, functional ability and health status
Most measures of functional ability use people’s self-reports of physical activity, such as the ability to perform everyday activities, e.g. personal care, degree of mobility, domestic activities. A widely used tool to measure health is the short-form 36-item (SF-36) health survey (Ware & Sherbourne 1992). The SF-36 is a multi-item scale that assesses the following eight health concepts:
The SF-36 measures people’s subjective assessment of their physical, mental and social health. It does not measure physical health in an objective manner, e.g. screening for markers of disease. The main criticism of such measures is that people may become accustomed to limitations of bodily function and not perceive them as such.
Psychological well-being
Several questionnaires have been developed to measure psychological well-being, including Goldberg’s general health questionnaire (GHQ) (Goldberg et al 1997). Goldberg’s GHQ, which measures minor psychological distress and social dysfunction, has been validated for use worldwide and includes items such as:
Social health
Health includes the dimension of social health, which may be defined as the degree to which people function adequately as members of the community. A key characteristic of social health is social support, incorporating both the extent of a person’s social networks and perceived adequacy (Antonovsky 1987). More recently, the concept of ‘social capital’ has been used to describe these networks and the trust which links people together in a community (Wilkinson 1996). Higher levels of social capital are associated with better health, less violent crime, better schooling, more tolerance and more economic and civic equality (Putnam 2001). Attempts to measure social capital have used data regarding membership of voluntary organizations, clubs and committees as well as data on informal networking and questions about trust to assess the degree of civic participation (Paldam 2001; Putnam 2001). It has been argued that a reduction or disinvestment in social capital, triggered by increased income inequality, leads to increased mortality (Kawachi et al 1997).
Quality of life
Quality of life has been used by some researchers to encompass the broader notion of health. Research amongst older people found quality of life included the following components (Brown et al 2004):
Quality of life is therefore a complex concept, including several different multilevel interacting influences. Veenhoven (1996) has identified the concept of happy life expectancy (HLE), a combination of life expectancy plus appreciation of life. HLE scores are highest in north-west European countries and lowest in Africa.
What might account for the high scores for happy life expectancy in north-west European countries and the low scores for African countries?
Seventy percent of the statistical variance in HLE scores is explained by four characteristics: affluence, freedom, education and tolerance.
QALYs
The desire to include a measurement of health in evaluating health care outcomes has led to the development of quality-adjusted life years (QALYs). QALYs are an explicit attempt to include not just years of life saved but also the quality of life, when making resource allocation decisions regarding different medical procedures. The quality of life includes things such as freedom from pain and discomfort, and the ability to live independently. The assessment of quality of life is made by both health professionals and lay people. The QALY is the arithmetic product of life expectancy and an adjustment for the quality of the remaining life years gained (Baldwin et al 1990). These two components are quite separate. QALYs are an important tool in making decisions about how to ration health care resources.
There is much theoretical and methodological confusion in attempts to measure different aspects of positive health and a lack of consensus in how this may best be achieved. It is an area which is currently being refined and researched, and is undoubtedly important to any adequate conceptualization and measurement of health.
Conclusion
Measuring health is an important activity for health promoters, and is integral to the planning and evaluation of health promotion programmes. Yet there is no consensus on the best means to measure health, and a wide variety of methods have been used. Some are opportunistic, relying on data already collected and available, such as the annual Health Survey for England and QALYs. The drawback of using these methods is that they use data which have been collected for specific reasons, often managerial or administrative. Other methods, such as the SF-36, have arisen from research which has addressed the issue of how to measure health. The fact that the concept ‘health’ can have so many different meanings, as outlined in Chapter 1, also contributes to the variety of different methods used. Some methods focus on one dimension of health, whereas others try to span different dimensions. It is also the case that different measures may suit different purposes. It is unlikely that any one method will ever prove to be a comprehensive measure of health, even if it combines different measurements within a weighted index. What is important then is to be specific about why you wish to measure health, and then to go on to select the most appropriate means of doing so, bearing in mind constraints on the time and money you have at your disposal.