Chapter 8 High-throughput screening
Introduction: a historical and future perspective
Systematic drug research began about 100 years ago, when chemistry had reached a degree of maturity that allowed its principles and methods to be applied to problems outside the field, and when pharmacology had in turn become a well-defined scientific discipline. A key step was the introduction of the concept of selective affinity through the postulation of ‘chemoreceptors’ by Paul Ehrlich. He was the first to argue that differences in chemoreceptors between species may be exploited therapeutically. This was also the birth of chemotherapy. In 1907, Ehrlich identified compound number 606, Salvarsan (diaminodioxy-arsenobenzene) (Ehrlich and Bertheim, 1912), which was brought to the market in 1910 by Hoechst for the treatment of syphilis, and hailed as a miracle drug (Figure 8.1).
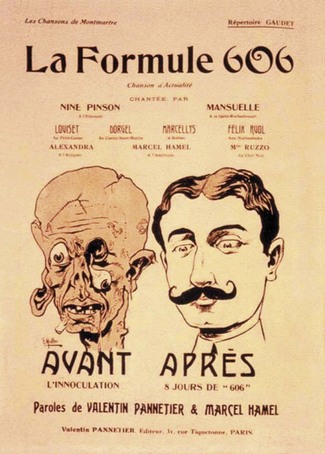
Fig. 8.1 In France, where Salvarsan was called ‘Formule 606’, true miracles were expected from the new therapy.
This was the first time extensive pharmaceutical screening had been used to find drugs. At that time screening was based on phenotypic readouts e.g. antimicrobial effect, a concept which has since led to unprecedented therapeutic triumphs in anti-infective and anticancer therapies, based particularly on natural products. In contrast, today’s screening is largely driven by distinct molecular targets and relies on biochemical readout.
In the further course of the 20th century drug research became influenced primarily by biochemistry. The dominant concepts introduced by biochemistry were those of enzymes and receptors, which were empirically found to be drug targets. In 1948 Ahlquist made a crucial, further step by proposing the existence of two types of adrenoceptor (α and β) in most organs. The principle of receptor classification has been the basis for a large number of diverse drugs, including β-adrenoceptor agonists and antagonists, benzodiazepines, angiotensin receptor antagonists and ultimately monoclonal antibodies.
Today’s marketed drugs are believed to target a range of human biomolecules (see Chapters 6 and 7), ranging from various enzymes and transporters to G-protein-coupled receptors (GPCRs) and ion channels. At present the GPCRs are the predominant target family, and more than 800 of these biomolecules have been identified in the human genome (Kroeze et al., 2003). However, it is predicted that less than half are druggable and in reality proteases and kinases may offer greater potential as targets for pharmaceutical products (Russ and Lampel, 2005). Although the target portfolio of a pharmaceutical company can change from time to time, the newly chosen targets are still likely to belong to one of the main therapeutic target classes. The selection of targets and target families (see Chapter 6) plays a pivotal role in determining the success of today’s lead molecule discovery.
Over the last 15 years significant technological progress has been achieved in genomic sciences (Chapter 7), high-throughput medicinal chemistry (Chapter 9), cell-based assays and high-throughput screening. These have led to a ‘new’ concept in drug discovery whereby targets with therapeutic potential are incorporated into biochemical or cell-based assays which are exposed to large numbers of compounds, each representing a given chemical structure space. Massively parallel screening, called high-throughput screening (HTS), was first introduced by pharmaceutical companies in the early 1990s and is now employed routinely as the most widely applicable technology for identifying chemistry starting points for drug discovery programmes.
Nevertheless, HTS remains just one of a number of possible lead discovery strategies (see Chapters 6 and 9). In the best case it can provide an efficient way to obtain useful data on the biological activity of large numbers of test samples by using high-quality assays and high-quality chemical compounds. Today’s lead discovery departments are typically composed of the following units: (1) compound logistics; (2) assay development and screening (which may utilize automation); (3) tool (reagent) production; and (4) profiling. Whilst most HTS projects focus on the use of synthetic molecules typically within a molecular weight range of 250–600 Da, some companies are interested in exploring natural products and have dedicated research departments for this purpose. These groups work closely with the HTS groups to curate the natural products, which are typically stored as complex mixtures, and provide the necessary analytical skills to isolate the single active molecule.
Compared with initial volume driven HTS in the 1990s there is now much more focus on quality-oriented output. At first, screening throughput was the main emphasis, but it is now only one of many performance indicators. In the 1990s the primary concern of a company’s compound logistics group was to collect all its historic compound collections in sufficient quantities and of sufficient quality to file them by electronic systems, and store them in the most appropriate way in compound archives. This resulted in huge collections that range from several hundred thousand to a few million compounds. Today’s focus has shifted to the application of defined electronic or physical filters for compound selection before they are assembled into a library for testing. The result is a customized ensemble of either newly designed or historic compounds for use in screening, otherwise known as ‘cherry picking’. However, it is often the case that the HTS departments have sufficient infrastructure to enable routine screening of the entire compound collection and it is only where the assay is complex or relatively expensive that the time to create ‘cherry picked’, focused, compound sets is invested (Valler and Green, 2000).
In assay development there is a clear trend towards mechanistically driven high-quality assays that capture the relevant biochemistry (e.g. stochiometry, kinetics) or cell biology. Homogeneous assay principles, along with sensitive detection technologies, have enabled the miniaturization of assay formats producing a concomitant reduction of reagent usage and cost per data point. With this evolution of HTS formats it is becoming increasingly common to gain more than one set of information from the same assay well either through multiparametric analysis or multiplexing, e.g. cellular function response and toxicity (Beske and Goldbard, 2002; Hanson, 2006; Hallis et al., 2007). The drive for information rich data from HTS campaigns is no more evident than through the use of imaging technology to enable subcellular resolution, a methodology broadly termed high content screening (HCS). HCS assay platforms facilitate the study of intracellular pharmacology through spatiotemporal resolution, and the quantification of signalling and regulatory pathways. Such techniques increasingly use cells that are more phenotypically representative of disease states, so called disease-relevant cell lines (Clemons, 2004), in an effort to add further value to the information provided.
Screening departments in large pharmaceutical companies utilize automated screening platforms, which in the early days of HTS were large linear track systems, typically five metres or more in length. The more recent trends have been towards integrated networks of workstation-based instrumentation, typically arranged around the circumference of a static, rotating robotic arm, which offers greater flexibility and increased efficiency in throughput due to reduced plate transit times within the automated workcell. Typically, the screening unit of a large pharmaceutical company will generate tens of millions of single point determinations per year, with fully automated data acquisition and processing. Following primary screening, there has been an increased need for secondary/complementary screening to confirm the primary results, provide information on test compound specificity and selectivity and to refine these compounds further. Typical data formats include half-maximal concentrations at which a compound causes a defined modulatory effect in functional assays, or binding/inhibitory constants. Post-HTS, broader selectivity profiling may be required, for active compounds against panels of related target families. As HTS technologies are adopted into other related disciplines compound potency and selectivity are no longer the only parameters to be optimized during hit-finding. With this broader acceptance of key technologies, harmonization and standardization of data across disciplines are crucial to facilitate analysis and mining of the data. Important information such as compound purity and its associated physico-chemical properties such as solubility can be derived very quickly on relatively large numbers of compounds and thus help prioritize compounds for progression based on overall suitability, not just potency (Fligge and Schuler, 2006). These quality criteria, and quality assessment at all key points in the discovery process, are crucial. Late-stage attrition of drug candidates, particularly in development and beyond, is extremely expensive and such failures must be kept to a minimum. This is typically done by an extensive assessment of chemical integrity, synthetic accessibility, functional properties, structure–activity relationship (SAR) and biophysicochemical properties, and related absorption, distribution, metabolism and excretion (ADME) characteristics, as discussed further in Chapters 9 and 10.
In summary, significant technological progress has been made over the last 15 years in HTS. Major concepts such as miniaturization and parallelization have been introduced in almost all areas and steps of the lead discovery process. This, in turn, has led to a great increase in screening capacity, significant savings in compound or reagent consumption, and, ultimately, improved cost-effectiveness. More recently, stringent quality assessment in library management and assay development, along with consistent data formats in automated screening, has led to much higher-quality screening outcomes. The perception of HTS has also changed significantly in the past decade and is now recognized as a multidisciplinary science, encompassing biological sciences, engineering and information technology. HTS departments generate huge amounts of data that can be used together with computational chemistry tools to drive compound structure–activity relationships and aid selection of focused compound sets for further testing from larger compound libraries. Where information rich assays are used complex analysis algorithms may be required to ensure the relevant data are extracted. Various statistical, informatics and filtering methods have recently been introduced to foster the integration of experimental and in silico screening, and so maximize the output in lead discovery. As a result, lead-finding activities continue to benefit greatly from a more unified and knowledge-based approach to biological screening, in addition to the many technical advances towards even higher-throughput screening.
Lead discovery and high-throughput screening
A lead compound is generally defined as a new chemical entity that could potentially be developed into a new drug by optimizing its beneficial effects and minimizing its side effects (see Chapter 9 for a more detailed discussion of the criteria). HTS is currently the main approach for the identification of lead compounds, i.e. large numbers of compounds (the ‘compound library’) are usually tested in a random approach for their biological activity against a disease-relevant target. However, there are other techniques in place for lead discovery that are complementary to HTS.
Besides the conventional literature search (identification of compounds already described for the desired activity), structure-based virtual screening is a frequently applied technique (Ghosh et al., 2006; Waszkowycz, 2008). Molecular recognition events are simulated by computational techniques based on knowledge of the molecular target, thereby allowing very large ‘virtual’ compound libraries (greater than 4 million compounds) to be screened in silico and, by applying this information, pharmacophore models can be developed. These allow the identification of potential leads in silico, without experimental screening and the subsequent construction of smaller sets of compounds (‘focused libraries’) for testing against a specific target or family of targets (Stahura et al., 2002; Muegge and Oloff, 2006). Similarly, X-ray analysis of the target can be applied to guide the de novo synthesis and design of bioactive molecules. In the absence of computational models, very low-molecular-weight compounds (typically 150–300 Da, so-called fragments), may be screened using biophysical methods to detect low-affinity interactions. The use of protein crystallography and X-ray diffraction techniques allows elucidation of the binding mode of these fragments and these can be used as a starting point for developing higher affinity leads by assemblies of the functional components of the fragments (Rees et al., 2004; Hartshorn et al., 2005; Congreve et al., 2008).
Typically, in HTS, large compound libraries are screened (‘primary’ screen) and numerous bioactive compounds (‘primary hits’ or ‘positives’) are identified. These compounds are taken through successive rounds of further screening (’secondary’ screens) to confirm their activity, potency and where possible gain an early measure of specificity for the target of interest. A typical HTS activity cascade is shown in Figure 8.2 resulting in the identification of hits, usually with multiple members of a similar chemical core or chemical series. These hits then enter into the ‘hit-to-lead’ process during which medicinal chemistry teams synthesize specific compounds or small arrays of compounds for testing to develop an understanding of the structure–activity relationship (SAR) of the underlying chemical series. The result of the hit-to-lead phase is a group of compounds (the lead series) which has appropriate drug-like properties such as specificity, pharmacokinetics or bioavailability. These properties can then be further improved by medicinal chemistry in a ‘lead optimization’ process (Figure 8.3). Often the HTS group will provide support for these hit-to-lead and lead optimization stages through ongoing provision of reagents, provision of assay expertise or execution of the assays themselves.
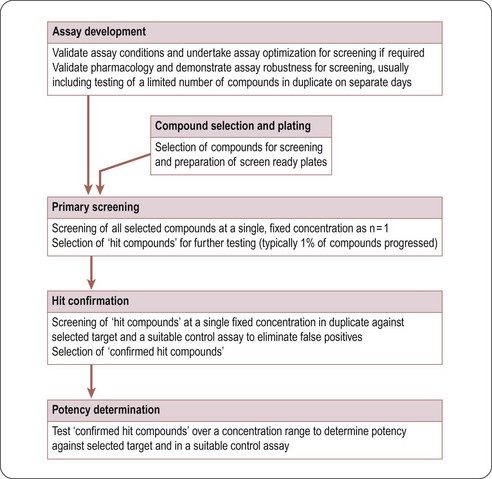
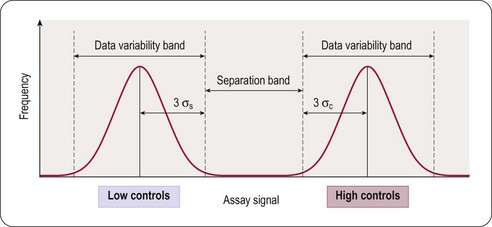
Fig. 8.3 Illustration of data variability and the signal window, given by the separation band between high and low controls.
Adapted, with permission, from Zhang et al., 1999.
Assay development and validation
The target validation process (see Chapters 6 and 7) establishes the relevance of a target in a certain disease pathway. In the next step an assay has to be developed, allowing the quantification of the interaction of molecules with the chosen target. This interaction can be inhibition, stimulation, or simply binding. There are numerous different assay technologies available, and the choice for a specific assay type will always be determined by factors such as type of target, the required sensitivity, robustness, ease of automation and cost. Assays can be carried out in different formats based on 96-, 384-, or 1536-well microtitre plates. The format to be applied depends on various parameters, e.g. readout, desired throughput, or existing hardware in liquid handling and signal detection with 384- (either standard volume or low volume) and 1536-well formats being the most commonly applied. In all cases the homogeneous type of assay is preferred, as it is quicker, easier to handle and cost-effective, allowing ‘mix and measure’ operation without any need for further separation steps.
Next to scientific criteria, cost is a key factor in assay development. The choice of format has a significant effect on the total cost per data point: the use of 384-well low-volume microtitre plates instead of a 96-well plate format results in a significant reduction of the reaction volume (see Table 8.1). This reduction correlates directly with reagent costs per well. The size of a typical screening library is between 500 000 and 1 million compounds. Detection reagent costs per well can easily vary between US$0.05 and more than U$0.5 per data point, depending on the type and format of the assay. Therefore, screening an assay with a 500 000 compound library may cost either US$25 000 or US$250 000, depending on the selected assay design – a significant difference! It should also be borne in mind that these costs are representative for reagents only and the cost of consumables (assay plates and disposable liquid handling tips) may be an additional consideration. Whilst the consumables costs are higher for the higher density formats, the saving in reagent costs and increased throughput associated with miniaturization usually result in assays being run in the highest density format the HTS department has available.
Table 8.1 Reaction volumes in microtitre plates
| Plate format | Typical assay volume |
|---|---|
| 96 | 100–200 µL |
| 384 | 25–50 µL |
| 384 low volume | 5–20 µL |
| 1536 | 2–10 µL |
Once a decision on the principal format and readout technology is taken, the assay has to be validated for its sensitivity and robustness. Biochemical parameters, reagents and screening hardware (e.g. detectors, microtitre plates) must be optimized. To give a practical example, in a typical screen designed for inhibitors of protease activity, test compounds are mixed together with the enzyme and finally substrate is added. The substrate consists of a cleavable peptide linked to a fluorescent label, and the reaction is quantified by measuring the change in fluoresecence intensity that accompanies the enzymic cleavage. In the process of validation, the best available labelled substrate (natural or synthetic) must be selected, the reaction conditions optimized (for example reaction time, buffers and temperature), enzyme kinetic measurements performed to identify the linear range, and the response of the assay to known inhibitors (if available) tested. Certain types of compound or solvent (which in most cases will be dimethylsulfoxide, DMSO) may interfere with the assay readout and this has to be checked. The stability of assay reagents is a further important parameter to be determined during assay validation, as some assay formats require a long incubation time.
At this point other aspects of screening logistics have to be considered. If the enzyme is not available commercially it has to be produced in-house by process development, and batch-to-batch reproducibility and timely delivery have to be ensured. With cell-based screens it must be guaranteed that the cell production facility is able to deliver sufficient quantities of consistently functioning, physiologically intact cells during the whole screening campaign and that there is no degradation of signal or loss of protein expression from the cells with extended periods of subculture.
The principal goal of developing HTS assays is the fast and reliable identification of active compounds (‘positives’ or ‘hits’) from chemical libraries. Most HTS programmes test compounds at only one concentration. In most instances this approximates to a final test concentration in the assay of 10 micromolar. This may be adjusted depending on the nature of the target but in all cases must be within the bounds of the solvent tolerance of the assay determined earlier in the development process. In order to identify hits with confidence, only small variations in signal measurements can be tolerated. The statistical parameters used to determine the suitability of assays for HTS are the calculation of standard deviations, the coefficient of variation (CV), signal-to-noise (S/N) ratio or signal-to-background (S/B) ratio. The inherent problem with using these last two is that neither takes into account the dynamic range of the signal (i.e. the difference between the background (low control) and the maximum (high control) signal), or the variability in the sample and reference control measurements. A more reliable assessment of assay quality is achieved by the Z’-factor equation (Zhang et al., 1999):

where SD = standard deviation and the maximum possible value of Z is 1. For biochemical assays a value greater than 0.5 represents a good assay whereas a value less than 0.5 is generally unsatisfactory for HTS. A lower Z’ threshold of 0.4 is usually considered acceptable for cell-based assays.
This equation takes into account that the quality of an assay is reflected in the variability of the high and low controls, and the separation band between them (Figure 8.3). Z’-factors are obtained by measuring plates containing 50% low controls (in the protease example: assay plus reference inhibitor, minimum signal to be measured) and 50% high controls (assay without inhibitor; maximum signal to be measured). In addition, inter- and intra-plate coefficients of variation (CV) are determined to check for systematic sources of variation. All measurements are normally made in triplicate. Once an assay has passed these quality criteria it can be transferred to the robotic screening laboratory. A reduced number of control wells can be employed to monitor Z’-values when the assay is progressed to HTS mode, usually 16 high- and 16 low-controls on a 384-well plate, with the removal of no more than two outlying controls to achieve an acceptable Z’-value. The parameter can be further modified to calculate the Z-value, whereby the average signal and standard deviation of test compound wells are compared to the high-control wells (Zhang et al., 1999). Due to the variability that will be present in the compound wells, and assuming a low number of active compounds, the Z-value is usually lower than the Z’-value.
Whilst there are been several alternatives of Zhang’s proposal for assessing assay robustness, such as power analysis (Sui and Wu, 2007), the simplicity of the equation still make the Z’-value the primary assessment of assay suitability for HTS.
The Assay Guidance Website hosted by the National Institutes of Health Center for Translational Therapeutics (NCTT) (http://assay.nih.gov/assay/index.php/Table_of_Contents) provides comprehensive guidance of factors to consider for a wide range of assay formats.
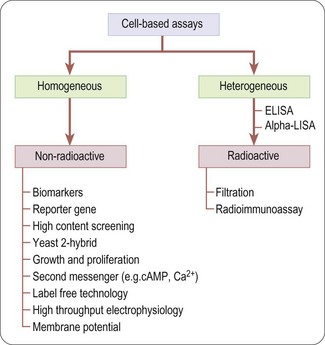
Biochemical and cell-based assays
There is a wide range of assays formats that can be deployed in the drug discovery arena (Hemmilä and Hurskainen, 2002), although they broadly fall into two categories: biochemical and cell-based.
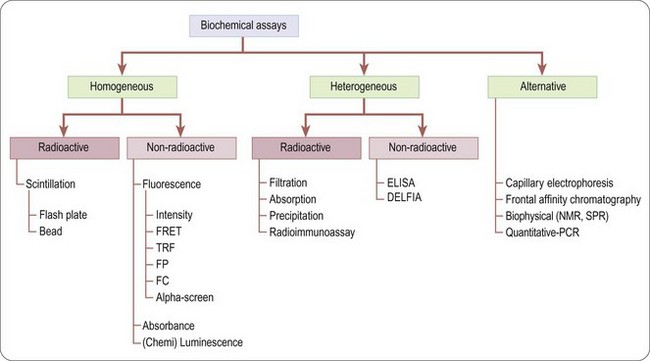
Biochemical assays (Figure 8.4) involve the use of cell-free in-vitro systems to model the biochemistry of a subset of cellular processes. The assay systems vary from simple interactions, such as enzyme/substrate reactions, receptor binding or protein–protein interactions, to more complex models such as in-vitro transcription systems. In contrast to cell-based assays, biochemical assays give direct information regarding the nature of the molecular interaction (e.g. kinetic data) and tend to have increased solvent tolerance compared to cellular assays, thereby permitting the use of higher compound screening concentration if required. However, biochemical assays lack the cellular context, and are insensitive to properties such as membrane permeability, which determine the effects of compounds on intact cells.
Unlike biochemical assays, cell-based assays (Figure 8.5) mimic more closely the in-vivo situation and can be adapted for targets that are unsuitable for screening in biochemical assays, such as those involving signal transduction pathways, membrane transport, cell division, cytotoxicity or antibacterial actions. Parameters measured in cell-based assays range from growth, transcriptional activity, changes in cell metabolism or morphology, to changes in the level of an intracellular messenger such as cAMP, intracellular calcium concentration and changes in membrane potential for ion channels (Moore and Rees, 2001). Importantly, cell-based assays are able to distinguish between receptor antagonists, agonists, inverse agonists and allosteric modulators which cannot be done by measuring binding affinity in a biochemical assay.
Many cell-based assays have quite complex protocols, for example removing cell culture media, washing cells, adding compounds to be tested, prolonged incubation at 37°C, and, finally, reading the cellular response. Therefore, screening with cell-based assays requires a sophisticated infrastructure in the screening laboratory (including cell cultivation facilities, and robotic systems equipped to maintain physiological conditions during the assay procedure) and the throughput is generally lower.
Cell-based assays frequently lead to higher hit rates, because of non-specific and ‘off-target’ effects of test compounds that affect the readout. Primary hits therefore need to be assessed by means of secondary assays such as non- or control-transfected cells in order to determine the mechanism of the effect (Moore and Rees, 2001).
Although cell-based assays are generally more time-consuming than cell-free assays to set up and run in high-throughput mode, there are many situations in which they are needed. For example, assays involving G-protein coupled receptors (GPCRs), membrane transporters and ion channels generally require intact cells if the functionality of the test compound is to be understood, or at least membranes prepared from intact cells for determining compound binding. In other cases, the production of biochemical targets such as enzymes in sufficient quantities for screening may be difficult or costly compared to cell-based assays directed at the same targets. The main pros and cons of cell-based assays are summarized in Table 8.2.
Table 8.2 Advantages and disadvantages of cell-based assays
| Advantages | Disadvantages |
|---|---|
| Cytotoxic compounds can be detected and eliminated at the outset | Require high-capacity cell culture facilities and more challenging to fully automate |
| In receptor studies, agonists can be distinguished from antagonists | Often require specially engineered cell lines and/or careful selection of control cells |
| Detection of allosteric modulators | Reagent provision and control of variability of reagent batches |
| Binding and different functional readouts can be used in parallel – high information content | Cells liable to become detached from support |
| Phenotypic readouts are enabling when the molecular target is unknown (e.g. to detect compounds that affect cell division, growth, differentiation or metabolism) | High rate of false positives due to non-specific effects of test compounds on cell function |
| More disease relevant than biochemical asays | Assay variability can make assays more difficult to miniaturize |
| No requirement for protein production/scale up | Assay conditions (e.g. use of solvents, pH) limited by cell viability |
Assay readout and detection
Ligand binding assays
Assays to determine direct interaction of the test compound with the target of interest through the use of radiolabelled compounds are sensitive and robust and are widely used for ligand-binding assays. The assay is based on measuring the ability of the test compound to inhibit the binding of a radiolabelled ligand to the target, and requires that the assay can distinguish between bound and free forms of the radioligand. This can be done by physical separation of bound from unbound ligand (heterogeneous format) by filtration, adsorption or centrifugation. The need for several washing steps makes it unsuitable for fully automated HTS, and generates large volumes of radioactive waste, raising safety and cost concerns over storage and disposal. Such assays are mainly restricted to 96-well format due to limitations of available multiwell filter plates and achieving consistent filtration when using higher density formats. Filtration systems do provide the advantage that they allow accurate determination of maximal binding levels and ligand affinities at sufficient throughput for support of hit-to-lead and lead optimization activities.
In the HTS arena, filtration assays have been superseded by homogeneous formats for radioactive assays. These have reduced overall reaction volume and eliminate the need for separation steps, largely eliminating the problem of waste disposal and provide increased throughput.
The majority of homogenous radioactive assay types are based on the scintillation proximity principle. This relies on the excitation of a scintillant incorporated in a matrix, in the form of either microbeads (’SPA’) or microplates (Flashplates™, Perkin Elmer Life and Analytical Sciences) (Sittampalam et al., 1997), to the surface of which the target molecule is also attached (Figure 8.6). Binding of the radioligand to the target brings it into close proximity to the scintillant, resulting in light emission, which can be quantified. Free radioactive ligand is too distant from the scintillant and no excitation takes place. Isotopes such as 3H or 125I are typically used, as they produce low-energy particles that are absorbed over short distances (Cook, 1996). Test compounds that bind to the target compete with the radioligand, and thus reduce the signal.

Fig. 8.6 Principle of scintillation proximity assays.
Reproduced with kind permission of GE Healthcare.
With bead technology (Figure 8.8A), polymer beads of ~5 µm diameter are coated with antibodies, streptavidin, receptors or enzymes to which the radioligand can bind (Bosworth and Towers, 1989; Beveridge et al., 2000). Ninety-six- or 384-well plates can be used. The emission wavelength of the scintillant is in the range of 420 nm and is subject to limitations in the sensitivity due to both colour quench by yellow test compounds, and the variable efficiency of scintillation counting, due to sedimentation of the beads. The homogeneous platforms are also still subject to limitations in throughput associated with the detection technology via multiple photomultiplier tube-based detection instruments, with a 384-well plate taking in the order of 15 minutes to read.
The drive for increased throughput for radioactive assays led to development of scinitillants, containing europium yttrium oxide or europium polystyrene, contained in beads or multiwell plates with an emission wavlength shifted towards the red end of the visible light spectrum (~560 nm) and suited to detection on charge-coupled device (CCD) cameras (Ramm, 1999). The two most widely adopted instruments in this area are LEADseeker™ (GE Healthcare) and Viewlux™ (Perkin Elmer), using quantitative imaging to scan the whole plate, resulting in a higher throughput and increased sensitivity. Imaging instruments provide a read time typically in the order of a few minutes or less for the whole plate irrespective of density, representing a significant improvement in throughput, along with increased sensitivity. The problem of compound colour quench effect remains, although blue compounds now provide false hits rather than yellow. As CCD detection is independent of plate density, the use of imaging based radioactive assays has been adopted widely in HTS and adapted to 1536-well format and higher (see Bays et al., 2009, for example).
In the microplate form of scintillation proximity assays the target protein (e.g. an antibody or receptor) is coated on to the floor of a plate well to which the radioligand and test compounds are added. The bound radioligand causes a microplate surface scintillation effect (Brown et al., 1997). FlashPlate™ has been used in the investigation of protein–protein (e.g. radioimmunoassay) and receptor–ligand (i.e. radioreceptor assay) interactions (Birzin and Rohrer, 2002), and in enzymatic (e.g. kinase) assays (Braunwaler et al., 1996).
Due to the level of sensitivity provided by radioactive assays they are still widely adopted within the HTS setting. However, environmental, safety and local legislative considerations have led to the necessary development of alternative formats, in particular those utilizing fluorescent-ligands (Lee et al., 2008; Leopoldo et al., 2009). Through careful placement of a suitable fluorophore in the ligand via a suitable linker, the advantages of radioligand binding assays in terms of sensitivity can be realized without the obvious drawbacks associated with the use of radioisotopes. The use of fluorescence-based technologies is discussed in more detail in the following section.
Fluorescence technologies
The application of fluorescence technologies is widespread, covering multiple formats (Gribbon and Sewing, 2003) and yet in the simplest form involves excitation of a sample with light at one wavelength and measurement of the emission at a different wavelength. The difference between the absorbed wavelength and the emitted wavelength is called the Stokes shift, the magnitude of which depends on how much energy is lost in the fluorescence process (Lakowicz, 1999). A large Stokes shift is advantageous as it reduces optical crosstalk between photons from the excitation light and emitted photons.
Fluorescence techniques currently applied for HTS can be grouped into six major categories:
• Fluorescence resonance energy transfer
• AlphaScreen™ (amplified luminescence proximity homogeneous assay).
Fluorescence intensity
In fluorescence intensity assays, the change of total light output is monitored and used to quantify a biochemical reaction or binding event. This type of readout is frequently used in enzymatic assays (e.g. proteases, lipases). There are two variants: fluorogenic assays and fluorescence quench assays. In the former type the reactants are not fluorescent, but the reaction products are, and their formation can be monitored by an increase in fluorescence intensity.
In fluorescence quench assays a fluorescent group is covalently linked to a substrate. In this state, its fluorescence is quenched. Upon cleavage, the fluorescent group is released, producing an increase in fluorescence intensity (Haugland, 2002).
Fluorescence intensity measurements are easy to run and cheap. However, they are sensitive to fluorescent interference resulting from the colour of test compounds, organic fluorophores in assay buffers and even fluorescence of the microplate itself (Comley, 2003).
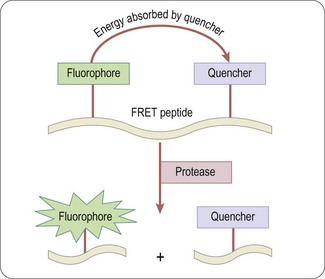
Fluorescence resonance energy transfer (FRET)
In this type of assay a donor fluorophore is excited and most of the energy is transferred to an acceptor fluorophore or a quenching group; this results in measurable photon emission by the acceptor. In simple terms, the amount of energy transfer from donor to acceptor depends on the fluorescent lifetime of the donor, the spatial distance between donor and acceptor (10–100 Å), and the dipole orientation between donor and acceptor. The transfer efficiency for a given pair of fluorophores can be calculated using the equation of Förster (Clegg, 1995).
Usually the emission wavelengths of donor and acceptor are different, and FRET can be determined either by the quenching of the donor fluorescence by the acceptor (as shown in Figure 8.7) or by the fluorescence of the acceptor itself. Typical applications are for protease assays based on quenching of the uncleaved substrate, although FRET has also been applied for detecting changes in membrane potential in cell-based assays for ion channels (Gonzalez and Maher, 2002). With simple FRET techniques interference from background fluorescence is often a problem, which is largely overcome by the use of time-resolved fluorescence techniques, described below.
Time resolved fluorescence (TRF)
TRF techniques (Comley, 2006) use lanthanide chelates (samarium, europium, terbium and dysprosium) that give an intense and long-lived fluorescence emission (>1000 µs). Fluorescence emission is elicited by a pulse of excitation light and measured after the end of the pulse, by which time short-lived fluorescence has subsided. This makes it possible to eliminate short-lived autofluorescence and reagent background, and thereby enhance the signal-to-noise ratio. Lanthanides emit fluorescence with a large Stokes shift when they coordinate to specific ligands. Typically, the complexes are excited by UV light, and emit light of wavelength longer than 500 nm.
Europium (Eu3+) chelates have been used in immunoassays by means of a technology called DELFIA (dissociation-enhanced lanthanide fluoroimmuno assay). DELFIA is a heterogeneous time-resolved fluorometric assay based on dissociative fluorescence enhancement. Cell-and membrane-based assays are particularly well suited to the DELFIA system because of its broad detection range and extremely high sensitivity (Valenzano et al., 2000).
High sensitivity – to a limit of about 10−17 moles/well – is achieved by applying the dissociative enhancement principle. After separation of the bound from the free label, a reagent is added to the bound label which causes the weakly fluorescent lanthanide chelate to dissociate and form a new highly fluorescent chelate inside a protective micelle. Though robust and very sensitive, DELFIA assays are not ideal for HTS, as the process involves several binding, incubation and washing steps.
The need for homogeneous (‘mix and measure’) assays led to the development of LANCETM (Perkin Elmer Life Sciences) and HTRF® (Homogeneous Time-Resolved Fluorescence; Cisbio). LANCETM, like DELFIA®, is based on chelates of lanthanide ions, but in a homogeneous format. The chelates used in LANCETM can be measured directly without the need for a dissociation step, however in an aqueous environment the complexed ion can spontaneously dissociate and increase background fluorescence (Alpha et al., 1987).
In HTRF® (Figure 8.8) these limitations are overcome by the use of a cryptate molecule, which has a cage-like structure, to protect the central ion (e.g. Eu+) from dissociation. HTRF® uses two separate labels, the donor (Eu)K and the acceptor APC/XL665 (a modified allophycocyanine from red algae) and such assays can be adapted for use in plates up to 1536-well format.

Fig. 8.8 HTRF assay type: the binding of a europium-labelled ligand (= donor) to the allophycocyanine (APC = acceptor)-labelled receptor brings the donor–acceptor pair into close proximity and energy transfer takes place, resulting in fluorescence emission at 665 nm.
Reproduced with kind permission of Cisbio.
In both LANCETM and HTRF®, measurement of the ratio of donor and acceptor fluorophore emission can be applied to compensate for non-specific quenching of assay reagents. As a result, the applications of both technologies are widespread, covering detection of kinase enzyme activity (Jia et al., 2006), protease activity (Karvinen et al., 2002), second messengers such as cAMP and inositiol tri-phosphate (InsP3) (Titus et al., 2008; Trinquet et al., 2006) and numerous biomarkers such as interleukin 1β (IL-1β) and tumour necrosis factor alpha (TNFα) (Achard et al., 2003).
Fluorescence polarization (FP)
When a stationary molecule is excited with plane-polarized light it will fluoresce in the same plane. If it is tumbling rapidly, in free solution, so that it changes its orientation between excitation and emission, the emission signal will be depolarized. Binding to a larger molecule reduces the mobility of the fluorophore so that the emission signal remains polarized, and so the ratio of polarized to depolarized emission can be used to determine the extent of binding of a labelled ligand (Figure 8.11; Nasir and Jolley, 1999). The rotational relaxation speed depends on the size of the molecule, the ambient temperature and the viscosity of the solvent, which usually remain constant during an assay.
The method requires a significant difference in size between labelled ligand and target, which is a major restriction to its application (Nosjean et al., 2006) and the reliance on a single, non-time resolved fluorescence output makes the choice of fluorphore important to minimize compound interference effects (Turek-Etienne et al., 2003). FP-based assays can be used in 96-well up to 1536-well formats.
Fluorescence correlation methods
Although an uncommon technique in most HTS departments, due the requirement for specific and dedicated instrumentation, this group of fluorescence technologies provide highly sensitive metrics using very low levels of detection reagents and are very amendable to ultra-high throughput screening (uHTS) (Eggeling et al., 2003). The most widely applied readout technology, fluorescence correlation spectroscopy, allows molecular interactions to be studied at the single-molecule level in real time. Other proprietary technologies such as fluorescence intensity distribution analysis (FIDA and 2-dimensional FIDA (Kask et al., 2000) also fall into this grouping, sharing the common theme of the analysis of biomolecules at extremely low concentrations. In contrast to other fluorescence techniques, the parameter of interest is not the emission intensity itself, but rather intensity fluctuations. By confining measurements to a very small detection volume (achieved by the use of confocal optics) and low reagent concentrations, the number of molecules monitored is kept small and the statistical fluctuations of the number contributing to the fluorescence signal at any instant become measurable. Analysis of the frequency components of such fluctuations can be used to obtain information about the kinetics of binding reactions.
With help of the confocal microscopy technique and laser technologies, it has become possible to measure molecular interactions at the single molecule level. Single molecule detection (SMD) technologies provide a number of advantages: significant reduction of signal-to-noise ratio, high sensitivity and time-resolution. Furthermore, they enable the simultaneous readout of various fluorescence parameters at the molecular level. SMD readouts include fluorescence intensity, translational diffusion (fluorescence correlation spectroscopy, FCS), rotational motion (fluorescence polarization), fluorescence resonance energy transfer, and time-resolved fluorescence. SMD technologies are ideal for miniaturization and have become amenable to automation (Moore et al., 1999). Further advantages include very low reagent consumption and broad applicability to a variety of biochemical and cell-based assays.
Single molecular events are analysed by means of confocal optics with a detection volume of approximately 1 fL, allowing miniaturization of HTS assays to 1 µL or below. The probability is that, at any given time, the detection volume will have a finite number of molecular events (movement, intensity, change in anisotropy), which can be measured and computed. The signal-to-noise ratio typically achieved by these methods is high, while interference from scattered laser light and background fluorescence are largely eliminated (Eigen and Rigler, 1994).
Fluorescence lifetime analysis (Moger et al., 2006) is a relatively straightforward assay methodology that overcomes many of the potential compound intereference effects achieved through the use of TRF, but without the requirement for expensive fluorophores. The technique utilizes the intrinsic lifetime of a fluorophore, corresponding to the time the molecule spends in the excited state. This time is altered upon binding of the fluorophore to a compound or protein and can be measured to develop robust assays that are liable to minimum compound intereference using appropriate detection instrumentation.
AlphaScreen™ Technology
The proprietary bead-based technology from Perkin Elmer is a proximity-based format utilizing a donor bead which, when excited by light at a wavelength of 680 nm, releases singlet oxygen that is absorbed by an acceptor bead, and assuming it is in sufficiently close proximity (<200 nm) this results in the emission of light between 520 and 620 nm (Figure 8.9). This phenomenon is unusual in that the wavlength of the emitted light is shorter and therefore has higher energy than the excitation wavelength. This is of significance since it reduces the potential for compound inner filter effects; however, reactive functionality may still inhibit the energy transfer.
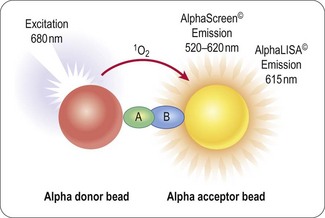
As with other bead-based technologies the donor and acceptor beads are available with a range of surface treatments to enable the immobilization or capture of a range of analytes. The range of immobolization formats and the distance over which the singlet oxygen can pass to excite the donor bead provide a suitable format for developing homogeneous antibody-based assays similar to enzyme-linked immunosorbent assays (ELISA) which are generally avoided in the HTS setting due to multiple wash, addition and incubation steps. These bead-based ELISA, such as AlphaLISA™ (Perkin Elmer), provide the required sensitivity for detection of biomarkers in low concentration and can be configured to low volume 384-well format without loss of signal window.
Cell-based assays
Readouts for cell-based assays
Readouts that can be used for cell-based assays are many and varied. In some cases, such as radioligand binding or enzyme activity, the readouts are essentially the same as those described above. Here we describe five cell-based readout technologies that have found general application in many types of assay, namely fluorometric methods, reporter gene assays, yeast complementation assays, high-throughput electrophysiology assays and more recently label free detection platforms. Some informative case histories of cell-based assays based on different readout principles have been presented by Johnston and Johnston (2002).
Fluorometric assays
Fluorometric assays are widely used to monitor changes in the intracellular concentration of ions or other constituents such as cAMP. A range of fluorescent dyes has been developed which have the property of forming reversible complexes with ions such as Ca2+ or Tl+ (as a surrogate for K+). Their fluorescent emission intensity changes when the complex is formed, thereby allowing changes in the free intracellular ion concentration to be monitored, for example in response to activation or block of membrane receptors or ion channels, Other membrane-bound dyes are available whose fluorescence signal varies according to the cytoplasmic or mitochondrial membrane potential. Membrane-impermeable dyes which bind to intracellular structures can be used to monitor cell death, as only dying cells with leaky membranes are stained. In addition to dyes, ion-sensitive proteins such as the jellyfish photo-protein aequorin (see below), which emits a strong fluorescent signal when complexed with Ca2+, can also be used to monitor changes in [Ca2+]i. Cell lines can be engineered to express this protein, or it can be introduced by electroporation. Such methods find many applications in cell biology, particularly when coupled with confocal microscopy to achieve a high level of spatial resolution. For HTS applications, the development of the Fluorescence Imaging Plate Reader (FLIPR™, Molecular Devices Inc., described by Schroeder and Negate, 1996), allowing the simultaneous application of reagents and test compounds to multiwell plates and the capture of the fluorescence signal from each well was a key advance in allowing cellular assays to be utilized in the HTS arena. Early instruments employed an argon laser to deliver the excitation light source with the emission measured using a CCD imaging device. In more recent models the laser has been replaced with an LED light source (www.moleculardevices.com) and overcomes some of the logistical considerations for deploying these instruments in some laboratories. Repeated measurements can be made at intervals of less than 1 s, to determine the kinetics of the cellular response, such as changes in [Ca2+]i or membrane potential, which are often short-lasting, so that monitoring the time profile rather than taking a single snapshot measurement is essential.
Reporter gene assays
Gene expression in transfected eukaryotic cells can be quantified by linking a promoter sequence to a reporter gene, whose level of expression is readily monitored, and reflects the degree of activation or inhibition of the promoter (Naylor, 1999). Compounds activating or inhibiting the promoter itself, or interfering with a signal pathway connected to that promoter, can thus be detected. By using two different reporter constructs e.g. firefly and Renilla luciferase, different targets can be screened simultaneously (Kent et al., 2005). The principle of a reporter gene assay for GPCR activity, based on luciferase, is shown in Figure 8.10. Reporter readouts can also be duplexed with more immediate readouts of cell signalling, such as calcium sensitive dyes, to reduce the false positive liability associated with using a single assay readout (Hanson, 2006)
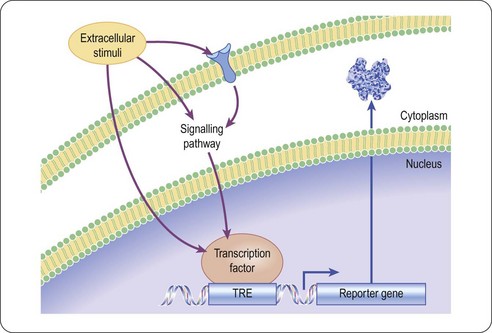
Fig. 8.10 Reporter gene assay principle for the detection of a ligand mediated signalling event in a cell based assay. Upon binding of a small molecule to the receptor the signalling cascade is initiated, resulting in the binding of a signalling mediator to a specific transcription factor response element, controlling the expression of the reporter protein.
Commonly used reporter genes are CAT (chloramphenicol acetyltransferase), GAL (β-galactosidase), LAC (β-lactamase) (Zlokarnik et al., 1998), LUC (luciferase, Kolb and Neumann, 1996) and GFP (green fluorescence protein, Kain, 1999), usually employing a colorimetric or fluorescent readout and each having relative merits (Suto and Ignar, 1997). The number of reporter genes is dwarfed compared to the range of promoters that can be employed in this format, covering a diversity of signalling events.
Whilst having been widely deployed in the drug discovery process there are several limitations of reporter gene technology, not least because of the measurement of a response distal to the ligand interaction and the longer compound incubation times required, increasing the potential for cytotoxic events (Hill et al., 2001).
Yeast complementation assay
Yeast is a well-characterized organism for investigating mammalian systems, and the yeast two-hybrid assay is a powerful genetic screening technique for measuring the protein–protein and protein–DNA interactions that underlie many cellular control mechanisms (Tucker, 2002 and reviewed in Brückner et al., 2009). Widely applied in cell and systems biology to study the binding of transcription factors at the sequence level, it can also be used to screen small molecules for their interference with specific protein–protein and protein–DNA interactions, and has recently been adapted for other types of drug–target interactions (Fields and Song, 1989; Young et al., 1998; Serebriiskii et al., 2001). Conventional in vitro measurements, such as immunoprecipitation or chromatographic co-precipitation (Regnier, 1987; Phizicky and Fields, 1995), require the interacting proteins in pure form and at high concentrations, and therefore are often of limited use.
The yeast two-hybrid system uses two separated peptide domains of transcription factors: a DNA-specific binding part (DNB) and a transcription activation domain (AD). The DNB moiety is coupled to one protein (the ‘bait’), and the AD moiety to another (the ‘prey’). If the prey protein binds to the bait protein, the AD moiety is brought into close association with the reporter gene, which is thereby activated, producing a product (e.g. GAL or LAC, as described above, or an enzyme which allows the yeast to grow in the presence of cycloheximide). The addition of a test compound that blocks the specific protein–protein interaction prevents activation of the reporter gene. Serebriiskii et al. (2001) describe a project in which lead compounds able to block the activation of a specific N-type voltage-gated Ca2+ channel have been identified with a yeast two-hybrid assay. The bait and prey proteins contained domains of two different channel subunits which need to associate to form a functional channel.
High throughput electrophysiology assays
The progression of ion channels, and in particular voltage-gated ion channels, as druggable targets using screening approaches was, until recently, severely limited by the throughput of conventional electrophysiology techniques and lack of suitable higher throughput assay platforms. Although fluorescence methods using membrane potential sensitive dyes such as DiBAC4(3) and the FLIPR™ variants of this and the FRET based voltage sensor probes (Gonzalez and Maher, 2002) were widely used, the methodology could not provide accurate voltage control and the temporal resolution of the evoked responses was poor. The introduction of planar patch-clamp instruments, particularly systems such as IonWorks Quattro which record using multihole planar substrate consumables (Finkel et al., 2006, Southan and Clark, 2009) has to a certain extent overcome the throughput hurdle. The operating principle of this instrument is shown in Figure 8.11 and whilst the data point generation is not as high throughput so as to compete with fluorescence methods (a maximum of approximately 3000 data points per day per instrument compared with > 20 000 per day for a FLIPR™) it is sufficient for screening of targeted libraries, diverse compound decks up to around 100 000 compounds and the confirmation of a large number of hits identified in less physiologically relevant platforms.
Label free detection platforms
The current drive for the drug discovery process is to move towards as physiologically relevant systems as possible and away from target overexpression in heterologous expression systems and, in the case of G-protein coupled receptors, to avoid the use of promiscuous G-proteins where possible. The downside to this is that endogenous receptor expression levels tend to be lower and therefore more sensitive detection methods are required. Also, for the study of targets where the signalling mechanism is unknown, e.g. orphan GPCRs, multiple assay systems would need to be developed which would be time consuming and costly. Consequently, the application of assay platforms which detect gross cellular responses, usually cell morphology due to actin cytoskeleton remodelling, to physiological stimuli have been developed. These fall into two broad categories, those that detect changes in impedance through cellular dielectric spectroscopy (Ciambrone et al., 2004), e.g. CellKey™, Molecular Devices Corporation; xCelligence, Roche Diagnostics or the use of optical biosensors (Fang, 2006), e.g. Epic™, Corning Inc; or Octect, Fortebio. The application of these platforms in the HTS arena is still in its infancy largely limited by throughput and relatively high cost per data point compared to established methods. However, the assay development time is quite short, a single assay may cover a broad spectrum of cell signalling events and these methods are considered to be more sensitive than many existing methods enabling the use of endogenous receptor expression and even the use of primary cells in many instances (Fang et al., 2007; Minor, 2008).
High content screening
High content screening (HCS) is a further development of cell-based screening in which multiple fluorescence readouts are measured simultaneously in intact cells by means of imaging techniques. Repetitive scanning provides temporally and spatially resolved visualization of cellular events. HCS is suitable for monitoring such events as nuclear translocation, apoptosis, GPCR activation, receptor internalization, changes in [Ca2+]i, nitric oxide production, apoptosis, gene expression, neurite outgrowth and cell viability (Giuliano et al., 1997).
The aim is to quantify and correlate drug effects on cellular events or targets by simultaneously measuring multiple signals from the same cell population, yielding data with a higher content of biological information than is provided by single-target screens (Liptrot, 2001).
Current instrumentation is based on automated digital microscopy and flow cytometry in combination with hard and software systems for the analysis of data. Within the configuration a fluorescence-based laser scanning plate reader (96, 384- or 1536-well format), able to detect fluorescent structures against a less fluorescent background, acquires multicolour fluorescence image datasets of cells at a preselected spatial resolution. The spatial resolution is largely defined by the instrument specification and whether it is optical confocal or widefield. Confocal imaging enables the generation of high-resolution images by sampling from a thin cellular section and rejection of out of focus light; thus giving rise to improved signal : noise compared to the more commonly applied epi-fluorescence microscopy. There is a powerful advantage in confocal imaging for applications where subcellular localization or membrane translocation needs to be measured. However, for many biological assays, confocal imaging is not ideal e.g. where there are phototoxicity issues or the applications have a need for a larger focal depth.
HCS relies heavily on powerful image pattern recognition software in order to provide rapid, automated and unbiased assessment of experiments.
The concept of gathering all the necessary information about a compound at one go has obvious attractions, but the very sophisticated instrumentation and software produce problems of reliability. Furthermore, the principle of ‘measure everything and sort it out afterwards’ has its drawbacks: interpretation of such complex datasets often requires complex algorithms and significant data storage capacity. Whilst the complexity of the analysis may seem daunting, high content screening allows the study of complex signalling events and the use of phenotypic readouts in highly disease relevant systems. However, such analysis is not feasible for large number of compounds and unless the technology is the only option for screening in most instances HCS is utilized for more detailed study of lead compounds once they have been identified (Haney et al., 2006).
Biophysical methods in high-throughput screening
Conventional bioassay-based screening remains a mainstream approach for lead discovery. However, during recent years alternative biophysical methods such as nuclear magnetic resonance (NMR) (Hajduk and Burns, 2002), surface plasmon resonance (SPR) (Gopinath, 2010) and X-ray crystallography (Carr and Jhoti, 2002) have been developed and/or adapted for drug discovery. Usually in assays whose main purpose is the detection of low-affinity low-molecular-weight compounds in a different approach to high-throughput screening, namely fragment-based screening. Hits from HTS usually already have drug-like properties, e.g. a molecular weight of ~ 300 Da. During the following lead optimization synthesis programme an increase in molecular weight is very likely, leading to poorer drug-like properties with respect to solubility, absorption or clearance. Therefore, it may be more effective to screen small sets of molecular fragments (<10 000) of lower molecular weight (100–250 Da) which can then be chemically linked to generate high-affinity drug-like compounds. Typically, such fragments have much weaker binding affinities than drug-like compounds and are outside the sensitivity range of a conventional HTS assay. NMR-, SPR- or X-ray crystallography-based assays are better suited for the identification of weak binders as these methodologies lend themselves well to the area of fragment based screening. As the compound libraries screened are generally of limited size throughput is less important than sensitive detection of low-affinity interactions. Once the biophysical interactions are determined, further X-ray protein crystallographic studies can be undertaken to understand the binding mode of the fragments and this information can then be used to rapidly drive the fragment-to-hit or fragment-to-lead chemistry programme (Carr et al., 2005).
As discussed in Chapter 9, the chemical linkage of weak binding fragments can generate a high-affinity lead without violating the restrictions in molecular weight. The efficiency of this strategy has been demonstrated by several groups (Nienaber et al., 2000; Lesuisse et al., 2002).
Assay formats – miniaturization
Multiwell plates began to be used for screening in the early 1980s, before which time tube-based assays were routinely used in a low-throughput mode. The introduction of 96-well plates allowed the automation and miniaturization of biochemical experiments and was rapidly followed by the transition of many cell-based assays into the same density formats. The drive to increase throughput and reduce associated reagent costs has seen great advances in liquid handling and detection technologies since the 1990s with most vendors basing their approach on adaptation of the 96-well format to reduce the space between wells (the pitch) whilst maintaining an overall standard footprint and depth for the plate for the ease and constancy of instrument design (see Society for Laboratory Automation and Screening, www.slas.org/education/microplate.cfm). Reducing the pitch by one-half yields a four-fold increase in density to 384 wells per plate and a further two-fold reduction gives rise to 1536-well format plates. In both cases, the wells of these increased density plates can still be addressed using standard 96-well technology, although for liquid handling the reduced volumes and well area associated with the 1536-well formats present challenges for tip-based, displacement dispensing. To overcome this, the low-volume 384-well plate (Garyantes, 2002) has emerged as an important format, offering lower reagent usage per well whilst overcoming the issues of well access. In turn, the liquid-handling technologies to support 1536-well plates has developed significantly through the use of fixed tips or non-contact dispensing using piezo-electric dispensers or acoustic dispensing. These latter formats do not rely on tip-based technology and can dispense volumes as low as 2.5 nanolitres (Dunn and Feygin, 2000; Ellson et al., 2003).
Beyond the 96-, 384- and 1536-well arena there remains a drive for further increased density to 3456-well format (Kornienko et al., 2004) and micro-fluidics/lab-on-a-chip (Pihl et al., 2005) approaches to further reduce reagent usage.
Regardless of the microplate format adopted by a screening laboratory, the advances in microplates, liquid handling, plate stacking and handling devices, and sensitive reagents and detection instrumentation (such as CCD imagers) have advanced to the point where execution of a high throughput screen is rarely the bottleneck in drug discovery. Although as the density increases the time to develop a robust assay with low variability can also increase as the challenges of reagent evaporation and mixing are overcome.
Robotics in HTS
In many dedicated HTS facilities automation is employed to varying degrees to facilitate execution of the screen. This varies from the use of automated work stations with some manual intervention to the use of fully automated robotic platforms. During the assay development phases the key pieces of automation present in the automated platform will be used to ensure the assay is optimized correctly followed by transfer of the assay to a robotic workstation that can operate in high-throughput mode (typically up to 100 000 compounds per day at a single concentration). The robotic system consists of devices for storage, incubation and transportation of plates in different format; instruments for liquid transfer; and a series of plate readers for the various detection technologies. In many instances, these devices will be replicated on the same system to allow the screen to continue, albeit at lower throughput, should one device fail mid-run.
A typical robotic system is illustrated in Figure 8.12. Robotic arms and/or automated transport systems move plates between different devices. Plate storage devices (‘hotels’) and incubators are used for storage and incubation of microplates. Incubators can be cooled or heated; for mammalian cell cultivation they can also be supplied with CO2 and are designed to facilitate automatic transfer of plates in and out. Compound plates are typically supplied with seals that can be perforated by the liquid handling devices to allow easy dilution and compound transfer to the assay plates. The assay plates themselves may either have removable lids or be sealed automatically once all reagents have been added. Stackers are sequential storage units for microtitre plates, connected to automated pipetting instruments and are equally common in laboratories where HTS is conducted without the large scale application of automation as they allow the scientists to walk away and return when the pipetting steps are complete. Various detection devices (enabling different modes of detection) are located at the output of the system before the assay plate, and usually the compound plate as well, are automatically discarded to waste. Central to the platform is the control (scheduling) software which controls the overall process including correct timing of different steps during the assay. This is critical, and ensures co-ordination of the use of the different devices (pipetters, incubators, readers etc.) to produce maximum efficiency. This software will also control recovery and/or continued operation of the platform, in the event of an error, without manual intervention. As one can imagine, programming and testing of the different process steps for individual screens can be a time-consuming part of the operation and frequently dedicated automation teams exist in large HTS departments to expedite this.

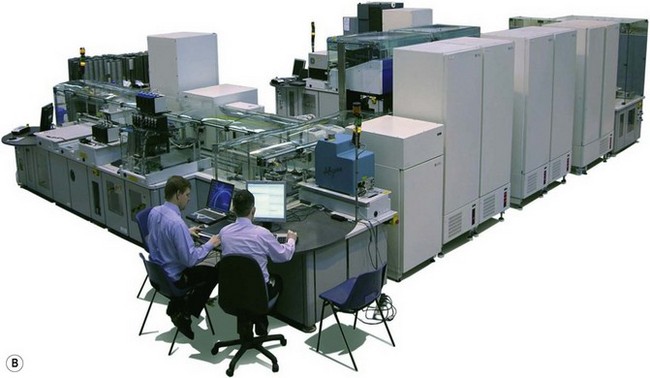
Fig. 8.12 Typical layout of fully automated high throughput screening platform. (A) Computer-aided design of the automated HTS work station and (B) photograph of the final installation.
Images supplied courtesy of the RTS Group, a leading supplier or laboratory automation, and Novartis.
Before primary screening can start sample plates have to be prepared, which is usually done offline by separate automated liquid transfer systems (384-tip pipettes or acoustic dispensing devices). Compound storage plates, containing the library to be screened prepared as DMSO solutions, are delivered from the compound library warehouse and samples are further diluted with aqueous buffer to reach the desired compound and DMSO concentration for the assay. Samples are usually transferred to the assay plates by the robot during the assay run.
During the screening itself, all processes have to be monitored online to ensure the quality of the data obtained. The performance of the assay is continuously measured by calculating Z’ values for each plate (see earlier section). For this purpose, each screening plate includes high and low controls for quality analysis, in addition to the compounds for screening.
For the selection of positives a variety of methods may be applied based upon the control wells present on the assay plate. This hit threshold may be an arbitrary activity cut-off set across the screen or statistically based on a plate-by-plate or screen-wide basis and is then usually set at least three standard deviations away from the mean of the library signal (Brideau et al., 2003).
Data analysis and management
Owing to the large volume of data generated in HTS, efficient data management is essential. Software packages for HTS (e.g. ActivityBase, Spotfire, GeneData) are available to carry out the principal tasks:
In HTS each biochemical experiment in a single well is analysed by an automated device, typically a plate reader or other kind of detector. The output of these instruments comes in different formats depending on the type of reader. Where possible the HTS favours the use of a single ‘end point’ read rather than more time-consuming multiple or kinetic readings. However, the instrument itself may perform some initial calculations and these heterogeneous types of raw data are automatically transferred into the data management software. Assay plates are typically identified by a unique bar-code to relate the data to the compound plate layout. Ideally the plate reader will have an integral bar-code reader and the data file will be automatically named with the bar-code to provide an error-free association of the correct data file with the compounds tested.
In a next step raw data are translated into contextual information by calculating results. Data on percentage inhibition or percentage of control are normalized with values obtained from the high and low controls present in each plate. In secondary screening IC50/EC50 and Ki values are also calculated. The values obtained depend on the method used (e.g. the fitting algorithm used for concentration–response curves) and have to be standardized for all screens within a company. Once the system captures the data it is then necessary to apply validation rules and techniques, such as trimmed means, to eliminate outliers (ideally using an automated algorithm) and to apply predetermined acceptance criteria to the data, for example, the signal-to-noise ratio, the Z’-value, or a test for gaussian distribution of the data. All plates that fail against one or more quality criteria are flagged and discarded.
The process may also involve a step to monitor visually the data that have been flagged, as a final check on quality. This is to ensure the system has performed correctly, i.e. no missed reagent dispense or patterns indicative of blocked dispenser tips or edge effects which may lead to false positives or negatives (Gunter et al., 2003). Whilst this inspection may be performed manually there are a number of software packages available, e.g. GeneData Assay Analyzer (www.genedata.com), which flag such errors and, in the case of edge effects, apply mathematical corrections to overcome them. Examples of validation data obtained in a typical screening of 100,000 compounds and some common data patterns revealed by tracking such parameters are shown in Figure 8.13. In addition to tracking high and low control values, most HTS departments also include quality-control plates at regular intervals throughout an assay run which contain standard compounds to allow target pharmacology to be monitored.
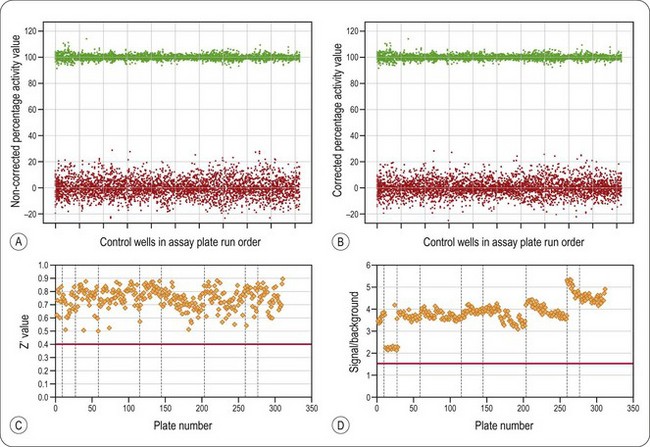
Fig. 8.13 Data validation checks in a typical screening assay. Distribution of high (green symbols) and low controls (red symbols) (% inhibition) in a set of screening plates. Each marker represents one well. Panel (A) shows the original data and (B) is the same data following treatment with GeneData Assay Analyzer to take account of spatially induced effects. Note the reduction in variability of the low control well data. (C) Z’ values and (D) signal to background ratios from an HTS campaign. The plate run order is shown on the x-axis and vertical dashed line divide each screening run, the horizontal lines at Z’ = 0.5 and signal-to-background = 1.5 represents the quality control pass levels and each data point represents on assay plate. The data demonstrate a decline in assay performance during each screening day. The marked change in rate of assay performance deterioration after plate 150 correlates with a change in the batch of a key assay component.
Data kindly supplied by BioFocus, with permission.
On completion of the screen it is advisable to plot a distribution histogram of the compound data against the control well populations and any other quality-control wells that have been included (Figure 8.14). The median of the test wells should be the same as the null control population and, if the assay is robust as demonstrated by the Z’ value, there will be good separation between the two control well populations. The variability of the null control population can be used to determine an acceptable cut-off level for selecting the hit compounds for further progression.
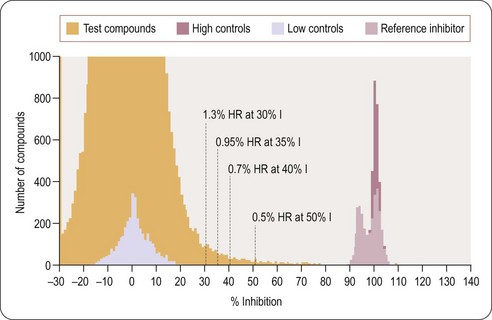
Fig. 8.14 Histogram analysis of compound activity against control well populations from a screen to identify antagonists of a G-protein coupled receptor. The median of the compound wells is in line with the null control population. The hit rate (% HR) associated with selecting each of the percentage inhibition value (% I) is as indicated. As the percentage inhibition is lowered the confidence in the reality of the hit is reduced; however, these compounds can provide useful information on the hit series being identified. Note the reference compound controls appear to fall into two populations. This is associated with the change in reagent batch as described in Figure 8.13.
Data kindly supplied by BioFocus, with permission.
In addition to registering the test data, all relevant information about the assay has to be logged, for example the supplier and batch of reagents, storage conditions, a detailed assay protocol, plate layout, and algorithms for the calculation of results. Each assay run is registered and its performance documented. If assay performance is charted any significant change in assay quality can be reviewed and if caused by reagent change readily identified
HTS will initially deliver hits in targeted assays. Retrieval of these data has to be simple, and the data must be exchangeable between different project teams to generate knowledge from the mass of data.
Screening libraries and compound logistics
Compound logistics
In the drug discovery value chain the effective management of compound libraries is a key element and is usually handled by a dedicated compound logistics group, either within the screening organization or at a specialist outsourcing provider. The compound management facility is the central port for transshipment of compounds in lead discovery, not only for primary screening, but also during the hit-to-lead phase. It is the unit responsible for registration of samples, their preparation, storage and retrieval. This facility has to ensure global compound accessibility, both individually and in different formats; maintain compound integrity (quality control and proper storage); guarantee error-free compound handling; guarantee efficient compound use; and guarantee a rapid response to compound requests.
Many pharmaceutical companies have greatly increased both the size and quality of their compound collection. Screening libraries frequently exceed 1,000,000 compounds and originate from many different sources with variable quality, although there has been great attention to how the assays themselves are impacted by poor compound quality, particularly solubility (Di and Kerns, 2006). This has necessitated both hardware and software automation of compound management in order to cope with the increasing demands of HTS and lead discovery.
Most advanced systems use fully automated robotics for handling compounds (Figure 8.15). Compounds used for screening are stored as liquids in microtitre plates in a controlled environment (temperature −4°C to −20°C; low humidity or storage under an inert atmosphere and control of freeze-thaw cycles) and numerous studies have been undertaken to identify the most appropriate conditions to maintain compound stability (e.g. Blaxill et al., 2009).
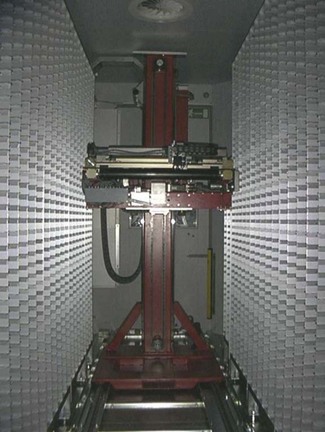
Fig. 8.15 Storage of a compound screening collection in 384-well plates at −4°C. A robot is able to move around and collect the plates or individual samples specified in the compound management software.
Splitting the collection into a number of copies in different formats secures a balance between fast response times to the various compound requests and optimal storage conditions. Different sets of compound libraries are needed, depending on the target and project specifications with the preferred storage format of the compound collection being dictated by the chosen screening plate density, i.e. 384- or 1536-well.
Because library sets are not static, as new compounds are continuously being added, samples in the repository need to be individually addressable to allow a flexible and quick rearrangement of existing libraries to more specific, focused collections. Advanced compound logistic systems store compound libraries in a single tube system so that individual tubes can be accessed without the need to take out a whole plate from the storage facility.
This functionality is a prerequisite for efficient ‘cherry picking’. After primary screening, positive compounds have to be confirmed in secondary assays and concentration–response curves determined. The individual active compounds have to be located and reformatted in microtitre plates. With a large number of targets and projects running at any one time, a highly automated compound handling systems is needed to do this efficiently.
Profiling
High-throughput screening, the subject of this chapter, has as its first objective the identification of a few ‘validated hits’ (defined in Chapter 9) within large compound libraries. The decision as to whether a particular hit is worth pursuing as a chemical lead in a drug discovery project depends on several factors, important ones being its chemical characteristics and its pharmacodynamic and pharmacokinetic properties. These aspects, broadly covered by the term ‘compound profiling’, are discussed in detail in the next three chapters.
The technology involved in miniaturization, automation and assay readouts required for HTS has developed rapidly and continues to do so. As this technology evolves, the laboratory set-ups installed in HTS facilities are steadily broadening their capabilities beyond their primary function of identifying hits to apply HTS techniques to more diverse compound profiling assays relating not only to the target selectivity of compound libraries, but also to their pharmacokinetic characteristics. Increasingly, therefore, early compound profiling tasks on ‘hit’ compounds are being carried out in HTS laboratories where the necessary technological expertise is concentrated. Such assays are also very helpful in the ‘lead identification’ stage of a project, where focused synthetic compound libraries based on the initial hits need to be assessed. As this work generally involves testing small compound libraries, usually fewer than 1000 compounds at a time, in several different assays, small dedicated robotic workstations are needed, rather than the fast but inflexible factory-style robotic assemblies used for large-scale HTS.
In vitro pharmacokinetic assays (see Chapter 10), which are not generally project specific and can be automated to run in medium-throughput fashion, are very suitable for running in this environment. This extension of the work of HTS laboratories beyond the primary task of finding hits is a clear and continuing trend, for which the term ‘high-throughput profiling’ (HTP) has been coined. It brings the work of HTS laboratories into a close and healthy relationship with drug discovery teams. The highly disciplined approach to assay formats and data logging that is essential for HTS, but not second nature to many laboratory scientists, brings the advantage that profiling data collected over a wide range of projects and drug targets is logged in standard database formats, and is therefore a valuable company-wide tool for analysing structure–activity relationships. This necessity to handle and visualize such data has driven the development software packages such as Spotfire (spotfire.tibco.com).
In summary, it is clear that pharmacological profiling will be an increasing activity of HTS units in the future, and will help to add further value in the drug discovery chain.
Achard S, Jean A, Lorphelin D, et al. Homogeneous assays allow direct ‘in well’ cytokine level quantification. Assay and Drug Development Technologies. 2003;1(supplement 2):181–185.
Alpha B, Lehn JM, Mathis G. Energy-transfer luminescence of europium(III) and terbium(III) with macrobicyclic polypyridine ligands. Angewandte Chemie. 1987;99:259–261.
Bays N, Hill A, Kariv I. A simplified scintillation proximity assay for fatty acid synthase activity: development and comparison with other FAS activity assays. Journal of Biomolecular. Screening. 2009;14:636–642.
Beske O, Goldbard S. High-throughout cell analysis using multiplexed array technologies. Drug Discovery Today. 2002;7:S131–S135.
Beveridge M, Park YW, Hermes J, et al. Detection of p56(lck) kinase activity using scintillation proximity assay in 384-well format and imaging proximity assay in 384- and 1536-well format. Journal of Biomolecular Screening. 2000;5:205–212.
Birzin ET, Rohrer SP. High-throughput receptor-binding methods for somatostatin receptor 2. Analytical Biochemistry. 2002;307:159–166.
Blaxill Z, Holland-Crimmen S, Lifely R. Stability through the ages: the GSK experience. Journal of Biomolecular Screening. 2009;14:547–556.
Bosworth N, Towers P. Scintillation proximity assay. Nature. 1989;341:167–168.
Braunwaler AF, Yarwood DR, Hall T, et al. A solid-phase assay for the determination of protein tyrosine kinase activity of c-src using scintillating microtitration plates. Analytical Biochemistry. 1996;234:23–26.
Brideau C, Gunter B, Pikounis B, et al. Improved statistical methods for hit selection in high-throughput screening. Journal of Biomolecular Screening. 2003;8:634–647.
Brown BA, Cain M, Broadbent J, et al. FlashPlate technology. In: Devlin PJ, ed. High-throughput screening. New York: Marcel Dekker; 1997:317–328.
Brückner A, Polge C, Lentze N, et al. Yeast two-hybrid, a powerful tool for systems biology. International Journal of Molecular Science. 2009;10:2763–2788.
Carr R, Congreve M, Murray C, et al. Fragment-based lead discovery: leads by design. Drug Discovery Today. 2005;10:987–992.
Carr R, Jhoti H. Structure-based screening of low-affinity compounds. Drug Discovery Today. 2002;7:522–527.
Ciambrone G, Liu V, Lin D, et al. Cellular dielectric spectroscopy: a powerful new approach to label-free cellular analysis. Journal of Biomolecular Screening. 2004;9:467–480.
Clegg RM. Fluorescence resonance energy transfer. Current Opinion in Biotechnology. 1995;6:103–110.
Clemons P. Complex phenotypic assays in high-throughput screening. Current Opinions in Chemical Biology. 2004;8:334–338.
Comley J. Assay interference a limiting factor in HTS? Drug Discovery World Summer. 91, 2003.
Comley J. TR-FRET based assays – getting better with age. Drug Discovery World Spring. 2006:22–37.
Congreve M, Chessari G, Tisi D, et al. Recent developments in fragment-based drug discovery. Journal of Medicinal Chemistry. 2008;51:3661–3680.
Cook ND. Scintillation proximity assay: a versatile high-throughput screening technology. Drug Discovery Today. 1996;1:287–294.
Di L, Kerns E. Biological assay challenges from compound solubility: strategies for bioassay optimization. Drug Discovery Today. 2006;11:446–451.
Dunn D, Feygin I. Challenges and solutions to ultra-high-throughput screening assay miniaturization: submicroliter fluid handling. Drug Discovery Today. 2000;5(Suppl. 12):S84–S91.
Eggeling C, Brand L, Ullmann D, et al. Highly sensitive fluorescence detection technology currently available for HTS. Drug Discovery Today. 2003;8:632–641.
Ehrlich P, Bertheim A. Berichte. 1912;4:756.
Eigen M, Rigler R. Sorting single molecules: application to diagnostics and evolutionary biotechnology. Proceedings of the National Academy of Sciences of the USA. 1994;91:5740–5747.
Ellson R, Mutz M, Browning B, et al. Transfer of low nanoliter acoustics – automation considerations. Journal of the Association for Laboratory Automation. 2003;8:29–34.
Fang Y. Label-free cell-based assays with optical biosensors in drug discovery. Assay and Drug Development Technologies. 2006;4:583–595.
Fang Y, Guangshan L, Ferrie A. Non-invasive optical biosensor for assaying endogenous G protein-coupled receptors in adherent cells. Journal of Pharmacological and Toxicological Methods. 2007;55:314–322.
Fields S, Song O. A novel genetic system to detect protein–protein interactions. Nature. 1989;340:245–246.
Finkel A, Wittel A, Yang N, et al. Population patch clamp improves data consistency and success rates in the measurement of ionic currents. Journal of Biomolecular Screening. 2006;11:488–496.
Fligge T, Schuler A. Integration of a rapid automated solubility classification into early validation of hits obtained by high throughput screening. Journal of Pharmaceutical and Biomedical Analysis. 2006;42:449–454.
Garyantes TK. 1536-well assay plates: when do they make sense? Drug Discovery Today. 2002;7:489–490.
Ghosh S, Nie A, An J, et al. Structure-based virtual screening of chemical libraries for drug discovery. Current Opinion in Chemical Biology. 2006;10:194–202.
Giuliano KA, de Basio RL, Dunlay RT, et al. High-content screening: a new approach to easing key bottlenecks in the drug recovery process. Journal of Biomolecular Screening. 1997;2:249–259.
Gonzalez J, Maher M. Cellular fluorescent indicators and voltage/ion probe reader (VIPR(tm)): tools for ion channel and receptor drug discovery. Receptors and Channels. 2002;8:283–295.
Gopinath S. Biosensing applications of surface plasmon resonance-based Biacore technology. Sensors and Actuators B. 2010;150:722–733.
Gribbon P, Sewing A. Fluorescence readouts in HTS: no gain without pain? Drug Discovery Today. 2003;8:1035–1043.
Gunter B, Brideau C, Pikounis B, et al. Statistical and graphical methods for quality control determination of high-throughput screening data. Journal of Biomolecular Screening. 2003;8:624–633.
Hajduk PJ, Burns DJ. Integration of NMR and high-throughput screening. Combinatorial Chemistry High Throughput Screening. 2002;5:613–621.
Hallis T, Kopp A, Gibson J, et al. An improved beta-lactamase reporter assay: multiplexing with a cytotoxicity readout for enhanced accuracy of hit identification. Journal of Biomolecular Screening. 2007;12:635–644.
Haney S, LaPan P, Pan J, et al. High-content screening moves to the front of the line. Drug Discovery Today. 2006;11:889–894.
Hanson B. Multiplexing Fluo-4 NW and a GeneBLAzer® transcriptional assay for high-thoughput screening of G-protein-coupled receptors. Journal of Biomolecular Screening. 2006;11:644–651.
Hartshorn M, Murray C, Cleasby A, et al. Fragment-based lead discovery using X-ray crystallography. Journal of Medicinal Chemistry. 2005;48:403–413.
Haugland RP. Handbook of fluorescent probes and chemical research, 9th edn. Molecular Probes. Web edition www.probes.com/handbook, 2002.
Hemmilä I, Hurskainen P. Novel detection strategies for drug discovery. Drug Discovery Today. 2002;7:S150–S156.
Hill S, Baker G, Rees S. Reporter-gene systems for the study of G-protein-coupled receptors. Current Opinion in Pharmacology. 2001;1:526–532.
Jia Y, Quinn C, Gagnon A, et al. Homogeous time-resolved fluorescence and its applications for kinase assays in drug discovery. Analytical Biochemistry. 2006;356:273–281.
Johnston PA, Johnston PA. Cellular platforms for HTS: three case studies. Drug Discovery Today. 2002;7:353–363.
Kain RK. Green fluorescent protein (GFP): applications in cell-based assays for drug discovery. Drug Discovery Today. 1999;4:304–312.
Karvinen J, Hurskainen P, Gopalakrishnan S, et al. Homogeneous time-resolved fluorescence quenching assay (LANCE) for Caspase-3. Journal of Biomolecular Screening. 2002;7:223–231.
Kask P, Palo K, Fay N, et al. Two-dimensional fluorescence intensity distribution analysis: theory and applications. Biophysics Journal. 2000;78:1703–1713.
Kent T, Thompson K, Naylor L. Development of a generic dual-reporter gene assay for screening G-protein-couped receptors. Journal of Biomolecular Screening. 2005;10:437–446.
Kolb AJ, Neumann K. Luciferase measurements in high throughput screening. Journal of Biomolecular Screening. 1996;1:85–88.
Kornienko O, Lacson R, Kunapuli P, et al. Miniaturization of whole live cell-based GPCR assays using microdispensing and detection systems. Journal of Biomolecular Screening. 2004;9:186–195.
Kroeze W, Sheffler D, Roth B. G-protein-coupled receptors at a glance. Journal of Cell Science. 2003;116:4867–4869.
Lakowicz JR. Principles of fluorescence spectroscopy. New York: Plenum Press; 1999.
Lee P, Miller S, Van Staden C, et al. Development of a homogeneous high-throughput live-cell G-protein-coupled receptor binding assay. Journal of Biomolecular Screening. 2008;13:748–754.
Leopoldo M, Lacivita E, Berardi F, et al. Developments in fluorescent probes for receptor research. Drug Discovery Today. 2009;14:706–712.
Lesuisse D, Lange G, Deprez P, et al. SAR and X-ray. A new approach combining fragment-based screening and rational drug design: application to the discovery of nanomolar inhibitors of Src SH2. Journal of Medicinal Chemistry. 2002;45:2379–2387.
Liptrot C. High content screening – from cells to data to knowledge. Drug Discovery Today. 2001;6:832–834.
Minor L. Label-free cell-based functional assays. Combinatorial Chemistry and High Throughput Screening. 2008;11:573–580.
Moger J, Gribon P, Sewing A, et al. The application of fluorescence lifetime readouts in high-throughput screening. Journal of Biomolecular Screening. 2006;11:765–772.
Moore K, Rees S. Cell-based versus isolated target screening: how lucky do you feel? Journal of Biomolecular Screening. 2001;6:69–74.
Moore KJ, Turconi S, Ashman S, et al. Single molecule detection technologies in miniaturized high throughput screening: fluorescence correlation spectroscopy. Journal of Biomolecular Screening. 1999;4:335–354.
Muegge I, Oloff S. Advances in virtual screening. Drug Discovery Today: Technologies. 2006;3:405–411.
Nasir MS, Jolley ME. Fluorescence polarization: an analytical tool for immunoassay and drug discovery. Combinatorial Chemistry High Throughput Screening. 1999;2:177–190.
Naylor L. Reporter gene technology: the future looks bright. Biochemical Pharmacology. 1999;58:749–757.
Nienaber VL, Richardson PL, Klighofer V, et al. Discovering novel ligands for macromolecules using X-ray crystallographic screening. Nature Biotechnology. 2000;18:1105–1108.
Nosjean O, Souchaud S, Deniau C, et al. A simple theoretical model for fluorescence polarization binding assay development. Journal of Biomolecular Screening. 2006;11:949–958.
Phizicky EM, Fields S. Protein–protein interactions: methods for detection and analysis. Microbiology Review. 1995;59:94–123.
Pihl J, Karlsson M, Chiu D. Microfluidics technologies in drug discovery. Drug Discovery Today. 2005;10:1377–1383.
Regnier FE. Chromatography of complex protein mixtures. Journal of Chromatography. 1987;418:115–143.
Ramm P. Imaging systems in assay screening. Drug Discovery Today. 1999;4:401–410.
Rees D, Congreve M, Murray C, et al. Fragment-based lead discovery. Natures Reviews Drug Discovery. 2004;3:660–672.
Russ A, Lampel S. The druggable genome: an update. Drug Discovery Today. 2005;10:1607–1610.
Schroeder KS, Negate BD. FLIPR, a new instrument for accurate high-throughput optical screening. Journal of Biomolecular Screening. 1996;1:75–80.
Serebriiskii IG, Khazak V, Golemis EA. Redefinition of the yeast two-hybrid system in dialogue with changing priorities in biological research. Biotechniques. 2001;30:634–655.
Sittampalam GS, Kahl SD, Janzen WP. High-throughput screening: advances in assay technologies. Current Opinion in Chemistry and Biology. 1997;1:384–391.
Southan A, Clark G. Recent technological advances in electrophysiology based screening technology and the impact upon ion channel discovery research. High Throughput Screening: Methods and Protocols (Methods in Molecular Biology). 2009;565:187–208.
Stahura F, Xue L, Godden J, et al. Methods for compound selection focused on hits and application in drug discovery. Journal of Molecular Graphics and Modelling. 2002;20:439–446.
Sui Y, Wu Z. Alternative statistical parameter for high-thoughput screening assay quality assessment. Journal of Biomolecular Screening. 2007;12:229–234.
Suto C, Ignar D. Selection of an optimal reporter gene for cell-based high throughput screening assays. Journal of Biomolecular Screening. 1997;2:7–9.
Titus S, Neumann S, Zheng W, et al. Quantitative high-throughput screening using a live-cell cAMP assay identifies small-molecule agonists of the TSH receptor. Journal of Biomolecular Screening. 2008;13:120–127.
Trinquet E, Fink M, Bazin H, et al. D-myo-Inositol 1-phosphate as a surrogate of D-myo-inositol 1,4,5-tris phosphate to monitor G protein-coupled receptor activation. Analytical Biochemistry. 2006;358:126–135.
Tucker C. High-throughput cell-based assays in yeast. Drug Discovery Today. 2002;7:S125–S130.
Turek-Etienne T, Small E, Soh S, et al. Evaluation of fluorescent compound interference in 4 fluorescence polarization assays: 2 kinases, 1 protease and 1 phosphatase. Journal of Biomolecular Screening. 2003;8:176–184.
Valenzano KJ, Miller W, Kravitz JN, et al. Development of a fluorescent ligand-binding assay using the AcroWell filter plate. Journal of Biomolecular Screening. 2000;5:455–461.
Valler MJ, Green D. Diversity screening versus focussed screening in drug discovery. Drug Discovery Today. 2000;5:286–293.
Waszkowycz B. Towards improving compound selection in structure-based virtual screening. Drug Discovery Today. 2008;13:219–226.
Young K, Lin S, Sun L, et al. Identification of a calcium channel modulator using a high throughput yeast two-hybrid screen. National Biotechnology. 1998;16:946–950.
Zhang JH, Chung TD, Oldenburg KR. A simple statistical parameter for use in evaluation and validation of high-throughput screening assays. Journal of Biomolecular Screening. 1999;4:67–73.
Zlokarnik G, Negulescu PA, Knapp TE, et al. Quantitation of transcription and clonal selection of single living cells with beta-lactamase as reporter. Science. 1998;279:84–88.