Chapter 22 Drug discovery and development
facts and figures
In this chapter we present summary information about the costs, timelines and success rates of the drug discovery and development operations of major pharmaceutical companies. The information comes from published sources, particularly the websites of the Association for the British Pharmaceutical Industry (www.abpi.org.uk), the European Federation of Pharmaceutical Industries and Associations (www.efpia.eu) and the Pharmaceutical Research and Manufacturers of America (www.phrma.org). Much of this information comes, of course, directly or indirectly from the pharmaceutical companies themselves, who are under no obligation to release more than is legally required. In general, details of the development process are quite well documented, because the regulatory authorities must be notified of projects in clinical development. Discovery research is less well covered, partly because companies are unwilling to divulge detailed information, but also because the discovery phase is much harder to codify and quantify. Development projects focus on a specific compound, and it is fairly straightforward to define the different components, and to measure the cost of carrying out the various studies and support activities that are needed so that the compound can be registered and launched. In the discovery phase, it is often impossible to link particular activities and costs to specific compounds; instead, the focus is often on a therapeutic target, such as diabetes, Parkinson’s disease or lung cancer, or on a molecular target, such as a particular receptor or enzyme, where even the therapeutic indication may not yet be determined. The point at which a formal drug discovery project is recognized and ‘managed’ in the sense of having a specific goal defined and resources assigned to it, varies greatly between companies. A further complication is that, as described in Section 2 of this book, the scientific strategies applied to drug discovery are changing rapidly, so that historic data may not properly represent the current situation. For these reasons, it is very difficult to obtain anything more than crude overall measures of the effectiveness of drug discovery research. There are, for example, few published figures to show what proportion of drug discovery projects succeed in identifying a compound fit to enter development, whether this probability differs between different therapeutic areas, and how it relates to the resources allocated. We attempt to predict some trends and new approaches at the end of this chapter.
As will be seen from the analysis that follows, the most striking aspects of drug discovery and development are that (a) failure is much more common than success, (b) it costs a lot, and (c) it takes a very long time (Figure 22.1). By comparison with other research-based industries, pharmaceutical companies are playing out a kind of slow-motion and very expensive arcade game, with the odds heavily stacked against them, but offering particularly rich rewards.
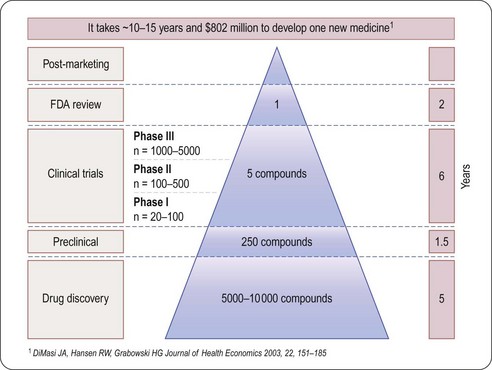
Fig. 22.1 The attrition of compounds through the discovery and development pipeline (PhRMA).
Reproduced, with permission, from DiMasi et al., 2003.
Spending
Worldwide, the R&D spending of the American-based pharmaceutical companies has soared, from roughly $5 billion in 1982 to $40 billion in 1998 and $70 billion in both 2008 and 2009. Figure 22.2 shows total R&D expenditure for US-based companies over the period 1995–2009. The R&D expenditure of the 10 largest pharmaceutical companies in 2009 averaged nearly $5 billion per company over the range of Roche at $8.7 billion to Lilly at $4.13 billion (Carroll, 2010). Marketing and administration costs for these companies are about three times as great as R&D costs. The annual increase in R&D spending in the industry in most cases has exceeded sales growth over the last decade, reflecting the need to increase productivity (see Kola and Landis, 2004). Today a minimum of 15–20% of sales revenues are reinvested in R&D, a higher percentage than in any other industry (Figure 22.3). The tide may have turned, however, and in 2010 the overall global R&D spend for the industry fell to $68 billion (a 3% reduction from 2009) (Hirschler, 2011). This fall reflects a growing disillusion with the poor returns on money invested in pharmaceutical R&D and some companies (notably Pfizer with a 25% reduction over the next 2 years) have announced plans to make further cuts in their budgets. The overall cost of R&D covers discovery research as well as the various development functions, described in Section 3 of this book. The average distribution of R&D expenditure on these different functions is shown in Table 22.1. These proportions represent the overall costs of these different functions and do not necessarily reflect the costs of developing an individual compound. As will be discussed later, the substantial drop-out rate of compounds proceeding through development means that the overall costs cover many failures as well as the few successes. Overall cost of developing a compound to launch and how much this has increased between 1979 and 2005 is shown in Figure 22.4.
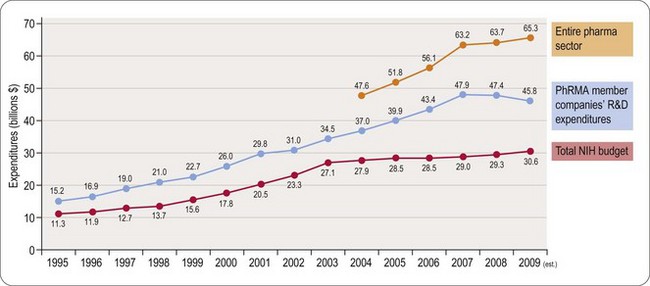
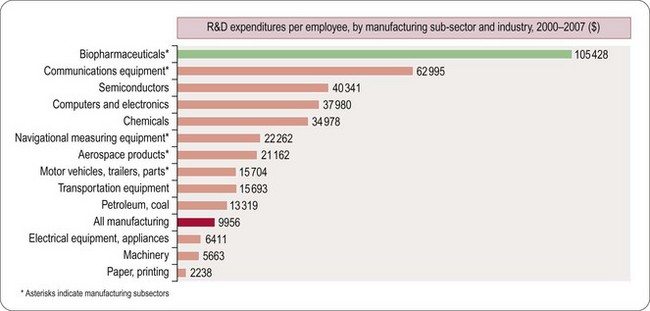
Table 22.1 R&D expenditure by function (2008)
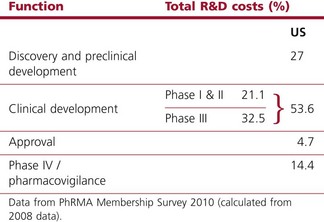
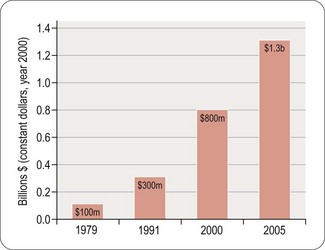
Fig. 22.4 The costs (corrected for inflation) of drug development continue to increase (PhRMA, 2011).
Numbers of compounds in clinical development according to therapeutic classes is shown in Figure 22.5, based on a survey of the American research-based pharmaceutical industry, and is dominated by four therapeutic areas, namely:
• Central nervous system disorders (including Alzheimer’s disease, schizophrenia, depression, epilepsy and Parkinson’s disease)
• Cancer, endocrine and metabolic diseases (including osteoporosis, diabetes and obesity)
• Cardiovascular diseases (including atherosclerosis, coronary disease and heart failure)
• Infectious diseases (including bacterial, viral and other infections such as malaria).
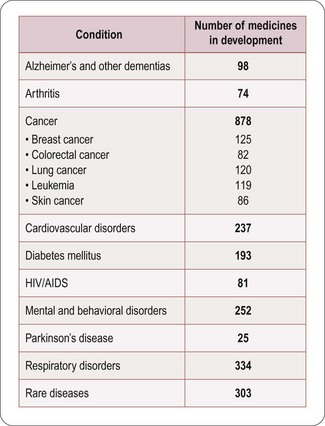
Fig. 22.5 Numbers of compounds in clinical development for different therapeutic targets (PhRMA, 2011).
The trend in the last decade has been away from cardiovascular disease towards other priority areas, particularly cancer and metabolic disorders, and also a marked increase in research on biopharmaceuticals, whose products are used in all therapeutic areas. There is also a marked increase in the number of drugs being introduced for the treatment of rare or orphan diseases driven by enabling legislation in the USA and EU (see Chapter 20).
How much does it cost to develop a drug?
Estimating the cost of developing a drug is not as straightforward as it might seem, as it depends very much on what is taken into account in the calculation. Factors such as ‘opportunity costs’ (the loss of income that theoretically results from spending money on drug development rather than investing it somewhere else) and tax credits (contributions from the public purse to encourage drug development in certain areas) make a large difference, and are the source of much controversy. The Tufts Centre for Drug Development Studies estimated the average cost of developing a drug in 2000 to be $802 million, increasing to $897 million in 20031 (DiMasi et al., 2003; Figure 22.1), compared with $31.8 million (inflation-adjusted) in 1987, and concluded that the R&D cost of a new drug is increasing at an annual rate of 7.4% above inflation.
Based on different assumptions, even larger figures – $1.1 billion per successful drug launch over the period 1995–2000, and $1.7 billion for 2000–2002 – were calculated by Gilbert et al. (2003).
The fact that more than 70% of R&D costs represents discovery and ‘failure’ costs, and less than 30% represents direct costs (which, being determined largely by requirements imposed by regulatory authorities, are difficult to reduce), has caused research-based pharmaceutical companies in recent years to focus on improving (a) the efficiency of the discovery process, and (b) the success rate of the compounds entering development (Kola and Landis, 2004). A good recent example of expensive failure of a compound in late-stage clinical development is illustrated by the experience of Pfizer with their cholesterol ester transfer protein (CETP) inhibitor, torcetrapib (Mullard, 2011). This new approach to treating cardiovascular disease by raising levels of the ‘good’ HDL cholesterol had looked very promising in the laboratory and in early clinical testing, but in late 2006 development was halted when a large Phase III clinical trial revealed that patients treated with the drug had an increased risk of death and heart problems. At the point of termination of their studies Pfizer had already spent $800 million on the project. The impact extended beyond Pfizer, as both Roche (dalcetrapib) and Merck (anacetrapib) had their own compounds acting on this mechanism in clinical development. It was necessary to decide if this was a class effect of the mechanism or whether it was just a compound-specific off-target effect limited to torcetrapib. Intensive comparisons of these agents in collaboration with academic groups and a published full analysis of the torcetrapib clinical trial data allowed the conclusion that this was most likely to be an effect limited to torcetrapib, possibly mediated by aldosterone, and it was not seen with the other two CETP blockers (Mullard, 2011). Roche and Merck were able to restart their clinical trials, but using very large numbers of patients and focusing on clinical outcomes to establish efficacy and safety. The Pfizer experience probably added 4 years to the time needed to complete development of the Merck compound anacetrapib and made this process more expensive (for example the pivotal study that started in 2011 will recruit 30 000 patients) with no guarantee of commercial success. In addition the patent term available to recover development costs and to make any profit is now 4 years shorter (see Chapter 19). It is not unreasonable to estimate that collectively the pharmaceutical industry will have spent more than $3 billion investigating CETP as a mechanism before we have either a marketed product or the mechanism is abandoned.
Sales revenues
Despite the stagnation in compound registrations over the past 25 years, the overall sales of pharmaceuticals have risen steadily. In the period 1999–2004 the top 14 companies showed an average sales growth of 10% per year, whereas in 2004–2009 growth was still impressive but at a lower rate of 6.7% per year. However, the boom years may be behind us and the prediction is that for 2009–2014 the growth will be a modest 1.2% per year (Goodman, 2009). Loss of exclusivity as patents expire is the most important reason for reduced sales growth (Goodman, 2009). The total global sales in 2002 reached $400.6 billion and in 2008 had risen to $808 billion (EFPIA, 2010). In Europe the cost of prescribed drugs accounts for some 17% of overall healthcare costs (EFPIA, 2010).
Profitability
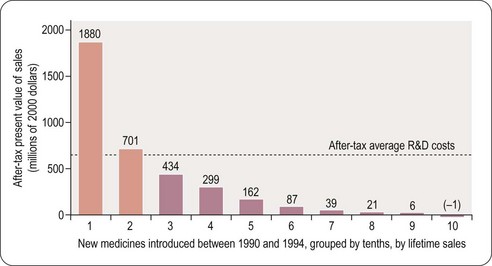
For a drug to make a profit, sales revenue must exceed R&D, manufacture and marketing costs. Grabowski et al. (2002) found that only 34% of new drugs introduced between 1990 and 1994 brought in revenues that exceeded the average R&D cost (Figure 22.6). This quite surprising result, which at first sight might suggest that the industry is extremely bad at doing its sums, needs to be interpreted with caution for various reasons. First, development costs vary widely, depending on the nature of the compound, the route of administration and the target indication, and so a drug may recoup its development cost even though its revenues fall below the average cost. Second, the development money is spent several years before any revenues come in, and sales predictions made at the time development decisions have to be taken are far from reliable. At any stage, the decision whether or not to proceed is based on a calculation of the drug’s ‘net present value’ (NPV) – an amortised estimate of the future sales revenue, minus the future development and marketing costs. If the NPV is positive, and sufficiently large to justify the allocation of development capacity, the project will generally go ahead, even if the money already spent cannot be fully recouped, as terminating it would mean that none of the costs would be recouped. At the beginning of a project NPV estimates are extremely unreliable – little more than guesses – so most companies will not pay much attention to them for decision-making purposes until the project is close to launch, when sales revenues become more predictable. Furthermore, unprofitable drugs may make a real contribution to healthcare, and companies may choose to develop them for that reason.
Even though only 34% of registered drugs in the Grabowski et al. (2002) study made a profit, the profits on those that did so more than compensated for the losses on the others, leaving the industry as a whole with a large overall profit during the review period in the early 1990s. The situation is no longer quite so favourable for the industry, partly because of price control measures in healthcare, and partly because of rising R&D costs. In the future there will be more emphasis on the relative efficacy of drugs and it will only be those new agents that have demonstrable superiority over generic competitors that will be able to command high prices (Eichler et al., 2010). It is likely that the pharmaceutical industry will adapt to changed circumstances, although whether historical profit margins can be maintained is uncertain.
Pattern of sales
The distribution of sales (2008 figures) by major pharmaceutical companies according to different therapeutic categories is shown in Table 22.2. Recent changes reflect a substantial increase in sales of anticancer drugs and drugs used to treat psychiatric disorders. The relatively small markets for drugs used to treat bacterial and parasitic infections contrasts sharply with the worldwide prevalence and severity of these diseases, a problem that is currently being addressed at government level in several countries. The USA represents the largest and fastest-growing market for pharmaceuticals (61% of global sales in 2010). Together with Europe (22%) and Japan (5%), these regions account for 88% of global sales. The rest of the established world market accounts for only 10%, with 3% in emerging markets (EFPIA, 2010). The approaching patent cliff (see later) suggests that with the current business model there may be a 5–10% reduction in sales and a 20–30% reduction in net income over 2012–2015 for the 13 largest companies (Munos, 2009). Not all predictions are pessimistic and IMS have recently opined that global drug sales will top $1 trillion in 2014 (Berkrot, 2010). Whilst accepting that growth in USA and other developed markets is slowing, they believe that this will be more than compensated for by growth in developing markets (China is growing at 22–25% per year and Brazil at 12–15% per year).
Table 22.2 Global sales by therapeutic area (Maggon, 2009)
| Therapeutic area | $US billions |
|---|---|
| Arthritis | 35 |
| Infectious disease | 24 |
| Cancer | 70 |
| Cardiovascular disease | 105 |
| Central nervous system | 118 |
| Diabetes | 21 |
| Respiratory disease | 25 |
Blockbuster drugs
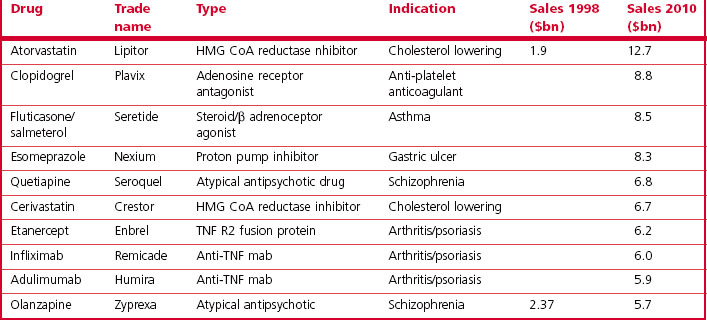
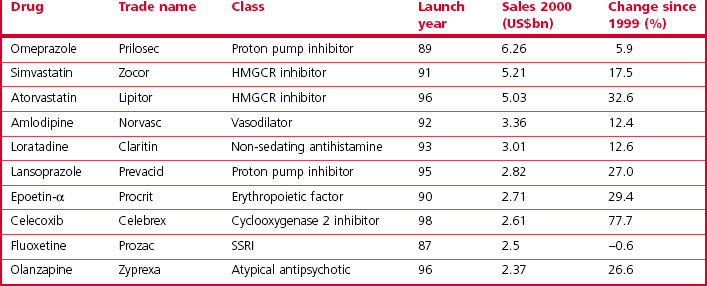
The analysis by Grabowski et al. (2002) showed that 70% of the industry’s profits came from 20% of the drugs marketed, highlighting the commercial importance of finding ‘blockbuster’ drugs – defined as those achieving annual sales of $1 billion or more – as these are the ones that actually generate significant profits. A recent analysis of pharmaceutical company pipelines showed that 18 new blockbusters were registered in the period 2001–2006, roughly four per year globally among the 30 or so new compounds that are currently being registered each year. In 2000, a total of 44 marketed drugs achieved sales exceeding $1 billion, compared with 17 in 1995 and 35 in 1999. The contribution of blockbuster drugs to the overall global sales also increased from 18% in 1997 to 45% in 2001, reflecting the fact that sales growth in the blockbuster sector has exceeded that in the market overall. The top 10 best selling drugs in 2010 are shown in Table 22.3 and this should be compared with the top 10 best selling drugs in 2000 shown in Table 22.4. Only atorvastatin and olanzapine appear in both tables as many of the other drugs have become generics in the interim and have, therefore, lost much of their sales revenue due to competition. It is also noteworthy that there was only one biological in the top 10 in 2000 whereas in 2010 there were three. Munos (2009) analysed the peak sales achieved by 329 recently introduced drugs and calculated that the probability of a new product achieving blockbuster status was only 21%, even though companies take a drug into clinical development only if they believe it has blockbuster potential.
Table 22.3 Global sales of top ten drugs (from IMS, 2011)
The spate of pharmaceutical company mergers in the last decade has also been driven partly by the need for companies to remain in blockbuster territory despite the low rate of new drug introductions and the difficulty of predicting sales. By merging, companies are able to increase the number of compounds registered and thus reduce the risk that the pipeline will contain no blockbusters. This may have a negative effect on R&D performance and creativity, however (Kneller, 2010; LaMattina, 2011)
Timelines
One important factor that determines profitability is the time taken to develop and launch a new drug, in particular the time between patent approval and launch, which will determine the length of time during which competitors are barred from introducing cheap generic copies of the drug. A drug that is moderately successful by today’s standards might achieve sales of about $400 million/year, so each week’s delay in development, by reducing the competition-free sales window, will cost the company roughly $8 million.
Despite increasing expenditure on R&D costs and decreased output, the mean development time from first synthesis or isolation (i.e. excluding discovery research preceding synthesis of the development compound) to first launch was over 14 years in 1999, having increased somewhat over the preceding decade. Half of this time was taken up by discovery and preclinical development and half by clinical studies. A further 2 years was required for FDA review and approval. The long FDA review times during the 1980s have since come down substantially (Reichert, 2003), mainly because user fees and fast-track procedures for certain types of drug were introduced. Current estimates of time taken for R&D leading to a new marketed product are in the region of 10 years with a further 2 or 3 years need for preparation and submission of the regulatory package and its approval (EFPIA, 2010).
There are, of course, wide variations in development times between individual projects, although historically there has been little consistent difference between different therapeutic areas (with the exception of anti-infective drugs, for which development times are somewhat shorter, and anticancer drugs, for which they have been longer by about 2 years). During the 1990s, most biopharmaceuticals were recombinant versions of human hormones, and their clinical development was generally quicker than that of small molecules. More recently, biopharmaceuticals have become more diverse and many monoclonal antibodies have been developed, and these have generally encountered more problems in development because their therapeutic and unwanted effects are unpredictable, and so clinical development times for biopharmaceuticals have tended to increase.
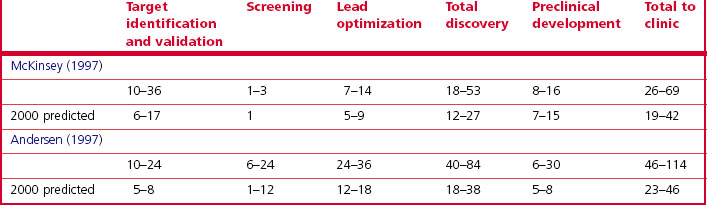
Information about the time taken for discovery – from the start of a project to the identification of a development compound – is sparse in the public literature. Management consultants McKinsey and Arthur Andersen estimate that in 1995, the time taken from the start of the discovery project to the start of clinical studies was extremely variable, ranging from 21 to 103 months (Table 22.5). Both studies predicted a reduction in discovery time by the year 2000 to 46 months or less, owing to improved discovery technologies. Although solid data are lacking, few believe that such a dramatic improvement has actually occurred.
Intensifying competition in the pharmaceutical marketplace also is demonstrated by the shrinking period of exclusivity during which the first drug in a therapeutic class is the sole drug in that class, thereby reducing the time a premium can be charged to recover the R&D expenditure. For example, cimetidine (Tagamet), an ulcer drug introduced in 1977, had an exclusivity period of 6 years before another drug in the same class, ranitidine (Zantac), was introduced. In contrast, celecoxib (Celebrex), the first selective cyclooxygenase-2 inhibitor (COX-2), which had a significant advantage over established non-steroidal anti-inflammatory drugs, was on the market only 3 months before a second, very similar, drug, rofecoxib (Vioxx), was approved (Figure 22.7). (Vioxx was withdrawn in 2004, because it was found to increase the risk of heart attacks: other COX-2 inhibitors were subsequently withdrawn or given restricted labels.)

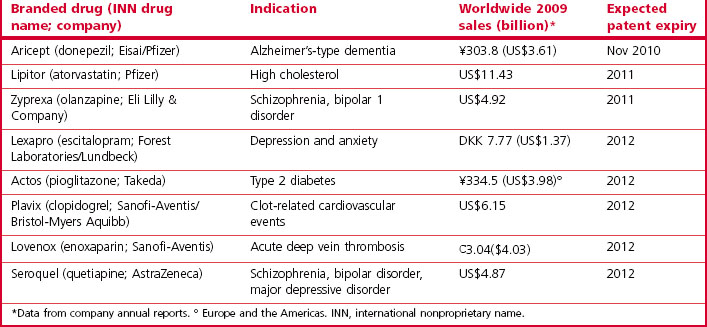
Loss of patent protection opens up the competition to generic products (the same compound being manufactured and sold at a much lower price by companies that have not invested in the R&D underlying the original discovery), and the sales revenue from the branded compound generally falls sharply. Over the period 2010–2014 drugs generating combined revenues of $78 billion (Harrison, 2011) will lose patent protection (Table 22.6). Half of the revenue erosion is predicted to be in 2011 as Lipitor (atorvastatin) loses patent protection. This drug (see Table 22.3) earned >$12 billion for Pfizer in 2010 and accounts for more than 20% of their total revenues. The loss of patent protection and the introduction of low-priced generic atorvastatin will not only affect Pfizer, as other drugs with longer patent life in the statin class will now face significant competition on price as well as on efficacy. These global figures vary from year to year as individual high-revenue drugs drop out of patent protection, and the revenue swings for an individual company are of course much more extreme than the global average, so maintaining a steady pipeline of new products and timing their introduction to compensate for losses as products become open to generic competition is a key part of a company’s commercial strategy.
Table 22.6 Selected drugs facing patent expiry in the USA 2010–2012 (from Harrison, 2011)
Pipelines and attrition rates
As we have already seen, the number of new chemical entities registered as pharmaceuticals each year has declined over the last decade or at best has stayed flat, and various analyses (Drews, 2003a,b; Kola and Landis, 2004; Munos, 2009) have pointed to a serious ‘innovation deficit’. According to these calculations, to sustain a revenue growth rate of 10% – considered to be a healthy level – the 10 largest pharmaceutical companies each needed to launch on average 3.1 new compounds each year, compared to 1.8 launches per company actually achieved in 2000 – a rate insufficient to maintain even zero growth. As mergers increase the size of companies and their annual revenues these numbers increase proportionally (e.g. in 2003 Pfizer had revenues of $45 billion and to sustain this level of income it would need to generate nine NCEs per year (Kola and Landis, 2004)). A recent survey indicated that the top 10 pharmaceutical companies are producing 1.17 NCEs per year if based in the USA and 0.83 NCEs per year if based in Europe – a considerable shortfall (Pammolli et al., 2011). Goodman (2009) concluded that most pharmaceutical companies are not replacing the products they lose from patent expiry sufficiently quickly and can only remain competitive by rigorous cost-cutting initiatives. The large numbers of layoffs in the industry in the last 2 years would support his conclusion.
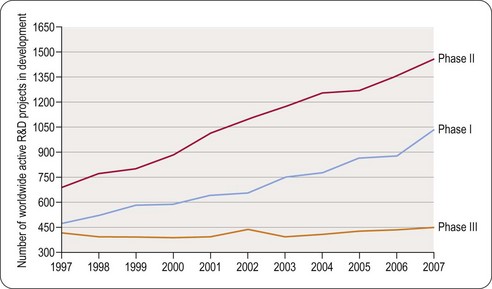
The number of clinical trials being carried out in each therapeutic area (Figure 22.5) provides a measure of potential future launches. The figures shown may somewhat overestimate the numbers, because official notification of the start of clinical projects is obligatory, but projects may be terminated or put on hold without formal notification. Estimates of the number of active preclinical projects are even more unreliable, as companies are under no obligation to reveal this information, and the definition of what constitutes a project is variable. The number of clinical trials appears large in relation to the number of new compounds registered in each year, partly because each trial usually lasts for more than 1 year, and partly because many trials (i.e. different indications, different dosage forms) are generally performed with each compound, including previously registered compounds as well as new ones.
The fact that in any year there are more Phase II than Phase I clinical projects in progress reflects the longer duration of Phase II studies, which more than offsets the effect of attrition during Phase I. The number of Phase III projects is smaller, despite their longer duration, because of the attrition between Phase II and Phase III.
High attrition rates – which would horrify managers in most technology-based industries – are a fact of life in pharmaceuticals, and are the main reason why drug discovery and development is so expensive and why drug prices are so high in relation to manufacturing costs. The cumulative attrition based on projects in the mid-1990s, predicts an overall success rate of 20% from the start of clinical development (Phase I). A more recent analysis quoted by the FDA (FDA Report, 2004) suggest a success rate of compounds entering Phase I trials of only 8%, and this can be even lower for particular therapeutic areas (e.g. 5% for oncology (Kola and Landis, 2004)).
The main reasons currently for failure of compounds are summarized in Figure 22.8 (Arrowsmith, 2011). It can be seen that the situation has changed little since Kola and Landis (2004) showed that unsatisfactory pharmacokinetic properties and lack of therapeutic efficacy in patients were the commonest shortcomings in 1991 but that by 2000 the pharmacokinetic issues had largely been addressed. As discussed in Chapter 10, determined efforts have been made to control for pharmacokinetic properties in the discovery phase, and this appears to have reduced the failure rate during development. Accurate prediction of therapeutic efficacy in the discovery phase remains a problem, however, particularly in disease areas, such as psychiatric disorders, where animal models are unsatisfactory. The analysis in Figure 22.8A shows that large numbers of drugs with novel mechanisms of action are failing in areas of high medical need such as cancer and neurodegeneration. In Figure 22.8B it can be seen that 66% of failures are due to lack of clinical efficacy regardless of therapeutic target and 21% due to inadequate safety (Arrowsmith, 2011). It has been estimated that in a typical research project 20–30% of the time is spent fine-tuning molecules to fit the available animal models of disease perfectly even though in many cases these models are not predictive of clinical efficacy (Bennani, 2011). It is especially concerning that drugs are still failing due to lack of efficacy in Phase III clinical trials (see Figure 22.9) and that, although increasing numbers of compounds are reaching Phase I and II clinical evaluation, the number of active Phase III compounds has not increased between 1997 and 2007. It has been suggested that the remedy is to make Phase II trials more rigorous on the grounds that Phase II failures are less disruptive and less costly than Phase III failures (Arrowsmith, 2011). Even having reached the registration phase, 23% of compounds subsequently fail to become marketed products (Kola and Landis, 2004). The problem of lack of predictability of long-term toxicity such that compounds need to be withdrawn after launch is still largely intractable.
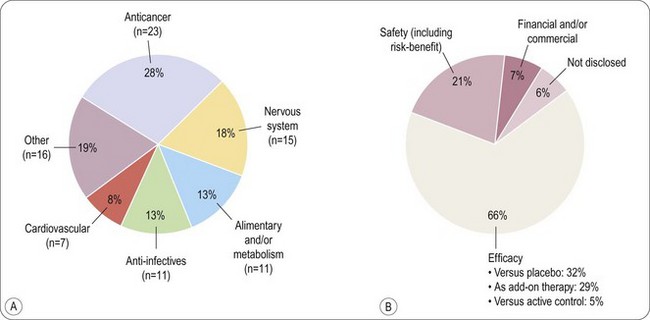
Fig. 22.8 Reasons for compound failure in development.
Reproduced, with permission, from Arrowsmith, 2011.
Biotechnology-derived medicines
An increasing share of research and development projects is devoted to the investigation of therapies using biotechnology-derived molecules (see Chapters 12 and 13). The first such product was recombinant human insulin (Humulin), introduced by Lilly in 1982. From 1991 to 2003, 79 out of 469 (17%) new molecules registered were biopharmaceuticals. Recently (2002–2008) the proportion was around 30% – partly reflecting reduced numbers of small molecules registered in recent years – and this is predicted to increase to about 50% over the next few years. In 2002 an estimated 371 biopharmaceuticals were in clinical development (PhRMA Survey, 2002), with strong emphasis on new cancer therapies (178 preparations) and infectious diseases, including AIDS (68 preparations). One growth area is monoclonal antibodies (MAbs). The first agent in this class, adulimumab, was approved by the FDA in 2002, but between then and 2010 an additional six were registered with three under review. In 2010 there were seven in Phase III and 81 in Phase I or II clinical trials (Nelson et al., 2010). Overall biologicals have had a higher probability of success than small molecules with 24% of agents entering Phase I trials becoming marketed products (Kola and Landis, 2004).
Many biotechnology-based projects originate not in mainstream pharmaceutical companies, but in specialized small biotechnology companies, which generally lack the money and experience to undertake development projects. This has resulted in increased in-licensing activities, whereby a large company licenses in and develops the substance, for which it pays fees, milestone payments and, eventually, royalties to the biotechnology company.
Recent introductions
An analysis of the 58 new substances approved by the FDA in the period 2001–2002 showed that about half of the new synthetic compounds were directed at receptor targets (mostly GPCRs, and some steroid receptors), all of which had been identified pharmacologically many years earlier, as had the transporter and enzyme targets. Only a minority of the new compounds were ‘first-in-class’ drugs. In 2006 only about 30% of the drugs approved by the FDA were new chemical compounds the rest being modified formulations or new uses for existing drugs (Austin, 2006). The 20% of compounds directed at infectious agents in 2002 were also mainly ‘follow-up’ compounds, directed at familiar targets, and so it is clear that during the 1990s, when these drugs were being discovered and developed, the industry was operating quite conservatively (DiMasi and Faden, 2011). Although, as described in Section 2, many new technologies are being applied in the hope of improving the speed and efficiency of drug discovery, drug targets and therapeutic approaches had not really changed. You are more likely to produce blockbusters, it was argued, by following the routes that produced blockbusters in the past than by trying new approaches with the aim of being ‘first-in-class’ (DiMasi and Faden, 2011). In a survey of 259 drugs registered by the FDA between 1999 and 2008 (Swinney and Anthony, 2011) it was found that only 75 of the 259 were first-in-class agents with novel mechanisms of action. Of the small molecule drugs in the survey target-based screening had produced 17 with 28 being discovered by using phenotypic disease model screening. Thus, even though the industry is becoming more centred on molecular target-based screening, this is not the source of the majority of new drugs. One worrying trend is the reduction in effort across the industry in the search for new drugs to treat psychiatric and neurological disorders, as, although this is the most difficult research area, the medical need for drugs has never been higher (Abbott, 2010; Kaitin and Milne, 2011).
Biopharmaceuticals registered between 1999 and 2008 include several protein mediators produced by recombinant methods and a number of monoclonal antibodies. Vaccines are also strongly represented. Of the 75 first-in-class drugs registered by the FDA in this period, 50 (67%) were small molecules and 25 (33%) were biologicals. Judging from the portfolio of new biotechnology products currently undergoing clinical evaluation, the trend towards biopharmaceuticals is set to continue, with cancer and inflammation/autoimmune diseases as the main therapeutic targets. A milestone was reached in 2012 when a biological became the world’s top selling drug as a consequence of patent expiry for the previous top sellers (Hirschler, 2012).
Some new drug introductions are aimed at small patient populations sometimes coupled with a biomarker to identify sensitive groups of patients who will benefit, and, as a consequence, these drugs are hyper-expensive (Hunter and Wilson, 2011). One recent example is a new treatment for multiple sclerosis from Novartis where a course of treatment will cost $48 000 in the USA (Von Schaper and Kresge, 2011). It is not clear whether such treatments will be affordable (Hunter and Wilson, 2011) or whether they will be beneficial to the profitability of the industry in the long term.
Predicting the future?
Many models have been proposed as the ideal way to discover drugs, but there is now general cynicism and the intrinsic cyclical nature of drug discovery is likely to have been the real reason for swings from failure to success rather than the approach taken by the industry. Predicting the future, especially the facts and figures is therefore a dangerous game! A number of factors have become apparent in the recent past that will change our world in ways which we probably could not have guessed at 5 years ago. The belief that drug discovery could be industrialized is clearly a mistaken one. Access to larger numbers of molecular targets, larger numbers of drug like compounds and faster screening technology has not led to more registered drugs. Similarly our knowledge of human genome has not yet paid off. We are learning more about disease processes day by day, but much of this knowledge is difficult to translate into drug discovery. More and more senior figures in the pharmaceutical industry are standing up in public and saying we need to reinvent the industry (Bennani, 2011; Paul et al., 2010). It seems inevitable (as mentioned above) that if we cannot close the gap between drugs losing patent protection and new product introductions then the industry will shrink. We have seen for the first time in living memory a reduction in the R&D spending of the industry driven by the realization that spending more on R&D year on year did not work (Hirschler, 2011). The driver now is to reduce costs where possible, get the investment right and only invest where probability of success is high (Kola and Landis, 2004; Paul et al., 2010). This is coupled with a need to streamline development (FDA, 2011) and kill drugs that are not clearly an improvement over what we already have as early as is feasible (Paul et al., 2010; Figure 22.10). Some companies are seeing the need to empower creative talent and admit that drug discovery is as much an art as a science (Bennani, 2011; Douglas et al., 2010; Paul et al., 2010). The crucial reorganization may already have happened with much of the creative part of drug discovery moving over to the biotech sector or to academic centres for drug discovery (Kotz, 2011; Stephens et al., 2011). This in turn is leading to more partnerships between different pharmaceutical companies, and between pharmaceutical companies, biotech and academia. It is interesting to note that the academic contribution to drug discovery may have been underestimated in the past (Stephens et al., 2011).
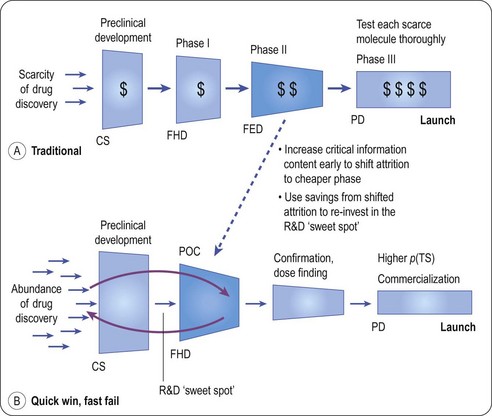
Fig. 22.10 The quick win/fast fail model for drug development.
Reproduced, with permission, from Paul et al., 2010.
The economics of our business will have shifted geographically by 2015 (IMS, 2011) with the US share of the global market declining from 41% in 2010 to 31% in 2015. At that time the US and EU combined are likely to reflect only 44% of global spending on medicines. This in turn is driving where investment in R&D and manufacturing facilities is being made. It is already evident that cuts in R&D spending in the UK and USA are paralled by an increase in spending in Asia, especially in China (see Zang, 2011). The other important shift that is happening is from proprietary medicines to generics and in 2015 it is likely that a major growth area will be generics which will account for 39% of the total drug spend compared with 27% in 2010 (IMS, 2011). We are thus victims of our own success as the blockbusters of 2005 become the generics of 2015. Around 50% of the new drugs that will drive profitability in 2015 will be biologicals and the majority of these will be monoclonal antibodies (IMS, 2011).
Our world will look very different 5 years from now with an increasingly complex social, legal, scientific and political environment. The pharmaceutical industry will continue to be important and governments will have to ensure that a fair reward for innovation (see Aronson et al., 2012) is still achievable but how this will be done is at present unclear.
Abbott A. The drug deadlock. Nature. 2010;468:178–179.
Arthur Andersen Consultants. Report on innovation and productivity; 1997.
Aronson JK, Ferner RE, Hughes DA. Defining rewardable innovation in drug therapy. Nature Rev Drug Discov. 2012;11:253–254.
Arrowsmith J. Phase III and submission failures: 2007–10. Nature Reviews. Drug Discovery. 2011;10:1.
. Association of the British Pharmaceutical Industry. website www.abpi.org.uk
Austin DH. Research and development in the pharmaceutical industry. Congressional Budget Office Study; 2006. p. 55.
Bennani YL. Drug discovery in the next decade: innovation needed ASAP. Drug Discovery Today – in press; 2011.
Berkrot B. Global drug sales to top $1 trillion in 2014: IMS. Reuters Business and Financial News Apr 20th 2010; 2010.
Carroll J. Top 15 Pharma R&D budgets. FiercePharma 12th August 2010 www.fiercepharma.com/node/35385/print, 2010.
DiMasi JA, Hansen RW, Grabowski HG. The price of innovation: new estimates of drug development costs. Journal of Health Economics. 2003;22:151–185.
DiMasi JA, Faden LB. Competitiveness in follow-on drug R&D: a race or imitation? Nature Reviews. Drug Discovery. 2011;10:23–27.
Douglas FL, Narayanan VK, Mitchell L, et al. The case for entrepreneurship in R&D in the pharmaceutical industry. Nature Reviews. Drug Discovery. 2010;9:683–689.
Drews J. Strategic trends in the drug industry. Drug Discovery Today. 2003;8:411–420.
Drews J. In quest of tomorrow’s medicines, 2nd ed. New York: Springer-Verlag; 2003.
EFPIA. The pharmaceutical industry in figures. Brussels: European Federation of Pharmaceutical Industries and Associations; 2010. p. 40
Eichler H-G, Bioechl-Daum B, Abadie E, et al. Relative efficacy of drugs: an emerging issue between regulatory agencies and third-party payers. Nature Reviews. Drug Discovery. 2010;9:277–291.
FDA. Report. Challenge and opportunity on the critical path to new medical products. www.fda.gov/oc/initiatives/criticalpath/whitepaper.html, 2004.
FDA. Advancing regulatory science at FDA: a strategic plan, 2011. p. 34
Gilbert J, Hnaske P, Singh A. Rebuilding big pharma’s business model. InVivo, the Business & Medicine Report, 21(10). Norwalk, Conn: Windhover Information; 2003. 21(10)
Goodman M. Pharmaceutical industry financial performance. Nature Reviews. Drug Discovery. 2009;8:927–928.
Grabowski H, Vernon J, DiMasi JA. Returns on research and development for 1990s new drug introductions. Pharmacoeconomics. 2002;20:11–29.
Harrison C. The patent cliff steepens. Nature Rev Drug Discov. 2011;10:12–13.
Hirschler B. Drug R&D spending fell in 2010 and heading lower. Reuters Business and Financial News 30th June 2011 www.reuters.com/assets/print?aid=USL6E7HO1BL20110626, 2011.
Hirschler B. Abbott drug tops sales as Lipitor, Plavix era ends. Reuters Business and Financial News. April 11th 2012 www.reuters.com/assets/print?aid=USL6E8FA3WO20120411, 2012.
Hunter D, Wilson J. Hyper-expensive treatments. Background paper for Forward Look 2011. London: Nuffield Council on Bioethics; 2011. p. 23
IMS. The global use of medicines: outlook through 2015. IMS Institute for Healthcare Informatics. 2011. p27
Kaitin K, Milne CP. A dearth of new meds. Scientific American. 16, 2011. August
Kneller R. The importance of new companies for drug discovery: origins of a decade of new drugs. Nature Reviews. Drug Discovery. 2010;9:867–882.
Kola I, Landis J. Can the pharmaceutical industry reduce attrition rates? Nature Reviews. Drug Discovery. 2004;3:711–716.
Kotz J. Small (molecule) thinking in academia. SciBX. 4, 2011. doi:10,1038/scibx.2011.617
LaMattina JL. The impact of mergers on pharmaceutical R&D. Nature Reviews. Drug Discovery. 2011;10:559–560.
McKinsey. Report. Raising innovation to new heights in pharmaceutical R&D; 1997.
Maggon K. Global Pharmaceutical Market Intelligence Monograph. http://knol.google.com/k/global-pharmaceutical-market-intelligence-monograph, 2009.
Mullard A. Learning lessons from Pfizer’s $800 million failure. Nature Reviews. Drug Discovery. 2011;10:163–164.
Munos B. Lessons from 60 years of pharmaceutical innovation. Nature Reviews. Drug Discovery. 2009;8:959–968.
Nelson AL, Dhimolea E, Reichert JM. Development trends for human monoclonal antibody therapeutics. Nature Reviews. Drug Discovery. 2010;9:767–774.
Pammolli F, Magazzini L, Riccaboni M. The productivity crisis in pharmaceutical R&D. Nature Reviews. Drug Discovery. 2011;10:428–438.
Paul SM, Mytelka DS, Dunwiddie CT, et al. How to improve R&D productivity: the pharmaceutical industry’s grand challenge. Nature Reviews. Drug Discovery. 2010;9:203–214.
PhRMA Survey. Biotechnology medicines in development. www.phrma.org/newmedicines/surveys.cfm, 2002.
Pharmaceutical Research and Manufacturers of America. www.phrma.com, 2011.
Reichert JM. Trends in development and approval times for new therapeutics in the United States. Nature Reviews. Drug Discovery. 2003;2:695–702.
Stephens AJ, Jensen JJ, Wyller K, et al. The role of public sector research in the discovery of drugs and vaccines. New England Journal of Medicine. 2011;364:535–541.
Swinney DC, Anthony J. How were new medicines discovered? Nature Reviews. Drug Discovery. 2011;10:507–519.
Von Schaper E, Kresge N. Novartis $48,000 pill spurs price increases for MS drugs. Bloomberg Business Week March 23rd 2011. www.businessweek.com/news/2011-03-21/novartis-s-48-000-pill-spurs-u-s-price, 2011.
Zang J. Moving from made in China to discovered in China. Lecture at Academy of Medical Sciences 2011, May 2011.