Chapter 9 Recognizing Adult Heart Disease
We’ll begin with an assessment of heart size, then describe the normal and abnormal contours of the heart on the frontal radiograph, and finally illustrate some imaging findings in common cardiac diseases.
Recognizing an Enlarged Cardiac Silhouette
 The cardiac silhouette can appear enlarged for three main reasons:
 You can estimate the size of the cardiac silhouette on the frontal chest radiograph using the cardiothoracic ratio, which is a measurement of the widest transverse diameter of the heart compared to the widest internal diameter of the rib cage (from inside of rib to inside of rib at the level of the diaphragm) (Fig. 9-1).
In most normal adults at full inspiration, the cardiothoracic ratio is less than 50%. That is, the size of the heart is usually less than half of the internal diameter of the thoracic rib cage.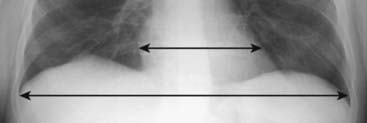
Figure 9-1 The cardiothoracic ratio.
To estimate the cardiothoracic ratio, the widest diameter of the heart (upper double arrow) is compared to the widest internal diameter of the thoracic cage from the inside of rib to the inside of rib (lower double arrow). The widest internal diameter of the thorax is usually at the level of the diaphragm. The cardiothoracic ratio should be less than 50% in most normal adults on a standard PA frontal radiograph taken with an adequate inspiration (about nine posterior ribs showing).
Pericardial Effusion
Normally, there are 15-50 mL of fluid in the pericardial space between the parietal and visceral pericardial layers. Abnormal accumulations of fluid begin in the dependent portions of the pericardial space, which, in the supine position, is posterior to the left ventricle (Fig. 9-2A). As the pericardial effusion increases in size, it tends to accumulate more along the right heart border until it fills the pericardial space and encircles the heart (Fig. 9-2B). CT scans can demonstrate small pericardial effusions, although pericardial ultrasonography is usually the imaging study of first choice. Conventional radiographs are poor at defining a pericardial effusion.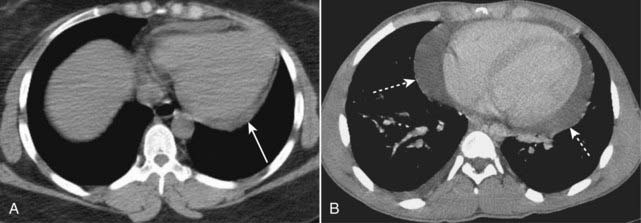
Figure 9-2 Pericardial effusions, small and large.
A, Fluid first begins to accumulate in the dependent portions of the pericardial space which is posterior to the left ventricle in the supine position (solid white arrow). B, As the effusion increases in size, it fills the pericardial space and encircles the heart (dotted white arrows). Conventional chest radiographs may show an enlarged cardiac silhouette but cannot differentiate the density of the heart from the effusion.
Extracardiac Causes of Apparent Cardiac Enlargement
 Although the cardiothoracic ratio provides a handy way of assessing heart size, it does have its pitfalls.
Sometimes, there is an extracardiac cause of apparent cardiac enlargement that may cause the cardiothoracic ratio to appear greater than 50%, while the heart itself may actually be normal in size. The extracardiac causes of apparent cardiomegaly are outlined in Table 9-1. Magnification of the heart produced by projection, usually on a supine, portable chest examination, is the most common cause of apparent cardiomegaly.TABLE 9-1 EXTRACARDIAC CAUSES OF APPARENT CARDIOMEGALY
| Cause | Reason for Enlarged Appearance |
|---|---|
| AP portable supine chest—most common cause | Magnification due to AP projection |
| Suboptimal inspiration | In expiration, the diaphragm moves upward and compresses the heart, making the heart appear larger than it would in full inspiration If there are 8 or 9 posterior ribs visible on the frontal chest radiograph, then the inspiration is adequate (see Fig. 2-13) |
| Obesity, pregnancy, ascites | These conditions prevent an adequate inspiration |
| Pectus excavatum deformity, a congenital deformity of the lowermost section of the sternum, causes it to bow inward and compress the heart | The heart is compressed between the sternum and the spine |
| Rotation | Especially when it occurs to the patient’s left, rotation may make the heart appear larger |
| Pericardial effusion | Other imaging modalities (most commonly ultrasound) or electrocardiographic findings will help to identify pericardial fluid |
Effect of Projection on Perception of Heart Size
Because the heart resides anteriorly in the chest, on a posteroanterior (PA) chest radiograph (the standard frontal chest study in which the x-ray beam enters posteriorly and exits anteriorly where the imaging cassette is positioned), the heart appears truer to its actual size because it is nearer the imaging surface. On an anteroposterior (AP) chest radiograph (the usual bedside, portable chest radiograph in which the x-ray beam enters anteriorly and exits posteriorly where the cassette is positioned), the heart is slightly magnified because it is farther from the imaging surface. Therefore, the heart will appear slightly larger on an AP chest radiograph like a portable chest radiograph than will the same heart on a PA chest radiograph (see Fig. 2-17).Identifying Cardiac Enlargement on an Anteroposterior Chest Radiograph
So is it possible to estimate the size of the heart on a portable chest radiograph? Glad you asked, because the answer is “yes.” If the heart is borderline enlarged on a portable AP radiograph, it is probably normal in size (Table 9-2). A good rule of thumb: If the heart appears enlarged on a well-inspired, portable chest radiograph, it probably is enlarged.TABLE 9-2 RECOGNIZING CARDIOMEGALY ON AN AP CHEST RADIOGRAPH
| Appearance of Heart on AP Study | Likely Heart Size |
|---|---|
| Borderline enlarged | Normal size |
| Significantly enlarged | Enlarged |
| Touching, or almost touching, the left lateral chest wall | Definitely enlarged |
Recognizing Cardiomegaly on the Lateral Chest Radiograph
To evaluate for the presence of enlargement of the cardiac silhouette in the lateral projection, look at the space posterior to the heart and anterior to the spine at the level of the diaphragm. In a normal person, the cardiac silhouette will usually not extend posteriorly and project over the spine (see Fig. 2-2). As the heart enlarges, whether that enlargement is due to cardiomegaly or pericardial effusion, the posterior border of the heart may extend to, or overlap, the anterior border of the thoracic spine. This can be useful as a confirmatory sign of cardiac enlargement first suspected on the frontal projection (Fig. 9-3).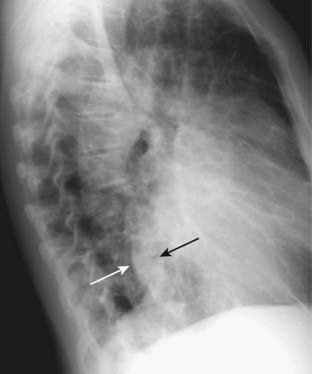
Figure 9-3 Enlargement of the cardiac silhouette in the lateral projection.
In most normal patients, the posterior border of the heart does not overlap the thoracic spine. In this patient with cardiomegaly, the posterior border of the heart (solid white arrow) overlaps the anterior border of the thoracic spine (solid black arrow). Estimation of cardiac size is best made on the frontal projection, but the lateral projection can be used for a confirmatory sign of enlargement of the cardiac silhouette.
Recognizing Cardiomegaly in Infants
Although this chapter focuses primarily on adult cardiac disease, in newborns and infants it is important to remember that the heart will normally appear larger relative to the size of the thorax than it does in adults. Whereas a cardiothoracic ratio greater than 50% is considered abnormal in adults, the cardiothoracic ratio may reach up to 65% in infants and still be normal because newborns cannot take as deep an inspiration as adults can and the relative proportions in the size of their abdomen to chest are not the same as for adults (Fig. 9-4). Any assessment of cardiac enlargement in an infant should take into account other factors such as the appearance of the pulmonary vasculature and any associated clinical signs or symptoms (e.g., a murmur, tachycardia, or cyanosis).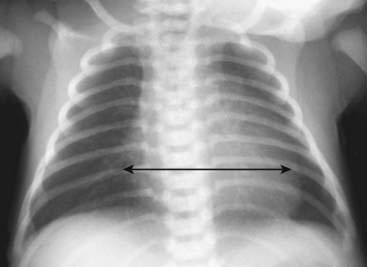
Figure 9-4 Normal infant chest.
In the normal infant, the cardiothoracic ratio may be as large as 65% (compared to 50% in adults) (double arrow). Any assessment of cardiac enlargement in an infant should also take into account other factors such as the appearance of the pulmonary vasculature and any associated clinical signs or symptoms (such as a murmur, tachycardia, or cyanosis).
Also, in a child the thymus gland may overlap portions of the heart and sometimes mimic cardiomegaly. The normal thymus may be seen on conventional chest radiographs up to 3 years of age and sometimes may be seen as late as 8 years of age. The normal thymus gland has a somewhat lobulated appearance, especially where the ribs indent it (Fig. 9-5).
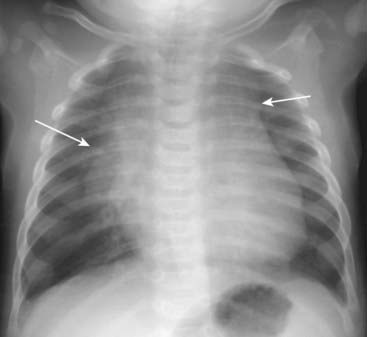
Figure 9-5 Normal thymus gland.
The thymus gland may overlap the upper portion of the cardiac silhouette and can be mistaken for cardiomegaly in a child. One aid in identifying the thymus gland is that it is frequently lobulated in appearance (solid white arrows). Although the thymus gland will usually involute by age 3, it may still be normally visible in children as old as 8 years of age.
Normal Cardiac Contours
The normal cardiac contours comprise a series of bumps and indentations visible on the frontal chest radiograph. They are demonstrated in Figure 9-6.
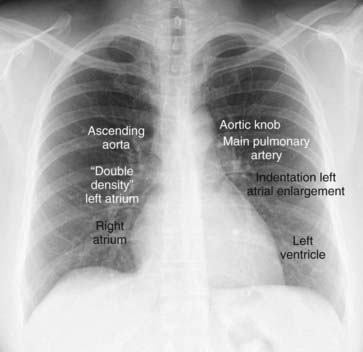
Figure 9-6 Normal cardiac contours seen in the frontal projection.
There are seven identifiable cardiac contours on the frontal chest radiograph. On the right side of the heart, the first contour is a low-density, almost straight edge visible just lateral to the trachea reflecting the size of the ascending aorta. Where the contour of the ascending aorta meets the contour of the right atrium, there is usually a slight indentation where the left atrium may appear when it enlarges. The right heart border is formed by the right atrium. On the left, the first contour is the aortic knob, a radiographic structure formed by the foreshortened aortic arch superimposed on a portion of the proximal descending aorta. The next contour below the aortic knob is the main pulmonary artery before it divides into a right and left pulmonary artery. Just below the main pulmonary artery segment there is normally a slight indentation where an enlarged left atrium may appear on the left side of the heart. The left ventricle forms the last contour of the heart on the left. The descending aorta almost disappears with the shadow of the spine.
Key points about the cardiac contours:
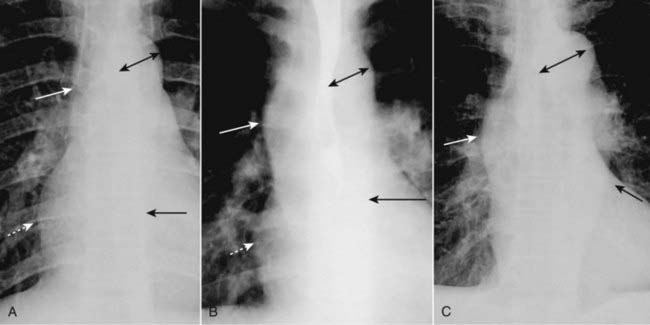
Figure 9-7 Appearances of the aorta.
A, Normal. The ascending aorta is a low-density, almost straight edge (solid white arrow) and does not project beyond the right heart border (dotted white arrow). The aortic knob is not enlarged (double arrow), and the descending aorta (solid black arrow) almost disappears with the shadow of the thoracic spine. B, Aortic stenosis. The ascending aorta is abnormal as it projects convex outward (solid white arrow) almost as far as the right heart border (dotted white arrow). This is due to poststenotic dilatation. The aortic knob (double arrow) and descending aorta (solid black arrow) remain normal. C, Hypertension. Both the ascending (solid white arrow) and descending aorta (solid black arrow) project too far to the right and left, respectively. The aortic knob is enlarged (double arrow).
Normal Pulmonary Vasculature
The main pulmonary artery segment is usually concave or flat. In younger females it may normally be convex outward.
In the upright position, the blood flow to the bases is normally greater than the flow to the apices because of the effect of gravity. Therefore, the size of the vessels at the base is normally larger than the size of the vessels at the apex of the lung.
Normally, blood vessels branch and taper gradually from central (the hila) to peripheral (near the chest wall) (Fig. 9-8). Changes in pressure or flow can alter the normal dynamics of the pulmonary vasculature, some of which are described later in this chapter under “Recognizing Common Cardiac Disorders.”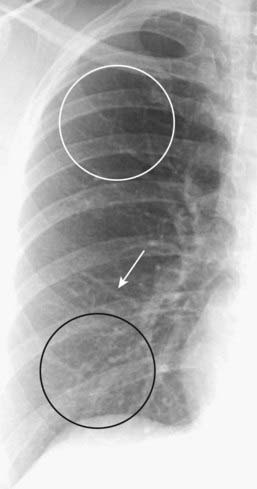
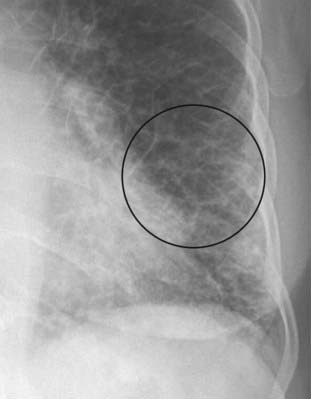
Figure 9-8 Normal pulmonary vasculature.
The right lung is shown. The lower lobe vessels (black circle) are larger in size than the upper lobe vessels (white circle) in the upright position, and all vessels taper gradually from central to peripheral (white arrow). Alterations in pulmonary flow or pressure may change these relationships.
General Principles of Cardiac Imaging
As you interpret cardiac abnormalities, no matter what modality is being used, the following principles hold true:
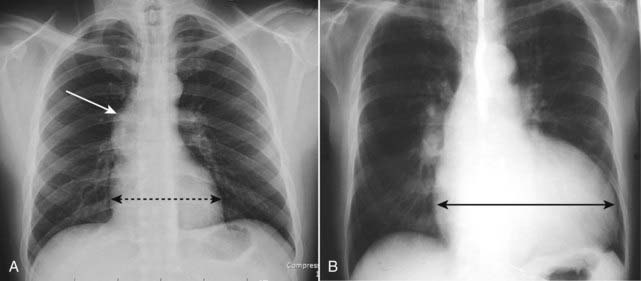
Figure 9-9 Heart size with stenotic versus regurgitant valve.
A, Poststenotic dilatation of the ascending aorta (white arrow) is present in this patient with aortic stenosis. Notice that the heart is not enlarged because this lesion produces left ventricular hypertrophy (dotted black double arrow). B, This patient has aortic regurgitation. Note the extremely large heart due to an enlarged left ventricle (solid black double arrow). Volume overload will cause a greater increase in chamber size than will increased pressure.
Recognizing Common Cardiac Diseases
Congestive Heart Failure
The incidence of congestive heart failure (CHF) has grown rapidly over the last two decades so that CHF is the most common diagnosis in hospitalized patients over the age of 65.Pulmonary Interstitial Edema
Pulmonary interstitial edema has four key radiographic signs.
Thickening of the interlobular septa: The Kerley B line
Peribronchial cuffing
Fluid in the fissures
Pleural effusion
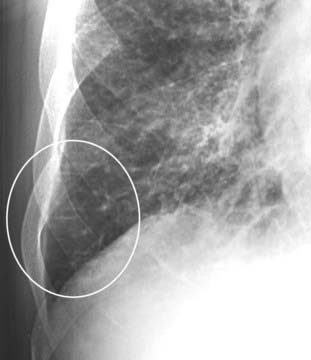
Interlobular septae are not visible on a normal chest radiograph but can become visible if they accumulate excessive fluid. First described by neurologist/radiologist Peter James Kerley, they are very short (1-2 cm long), very thin (about 1 mm) horizontal lines perpendicular to and abutting the pleural surface (white oval).
The A lines (circle) appear when connective tissue near the bronchoarterial bundle distends with fluid. They extend from the hila for several centimeters in the midlung and do not reach the periphery of the lung like Kerley B lines do. A network of Kerley lines is produced in the lungs in patients with congestive heart failure producing the “prominence of the pulmonary interstitial markings” seen in that disease.
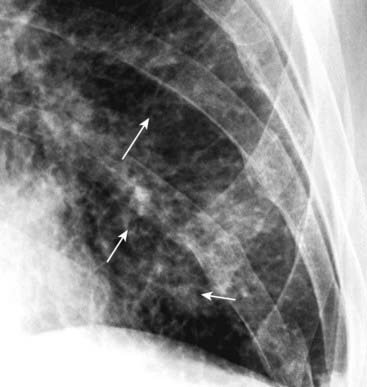
Figure 9-12 Peribronchial cuffing.
Normally the bronchus is invisible when seen on-end in the periphery of the lung. When fluid accumulates in the interstitial tissue around and in the wall of a bronchus as it does in CHF, the bronchial walls become thicker and can appear as ringlike densities when seen on-end (solid white arrows). Peribronchial cuffing may not always produce perfectly round circles.
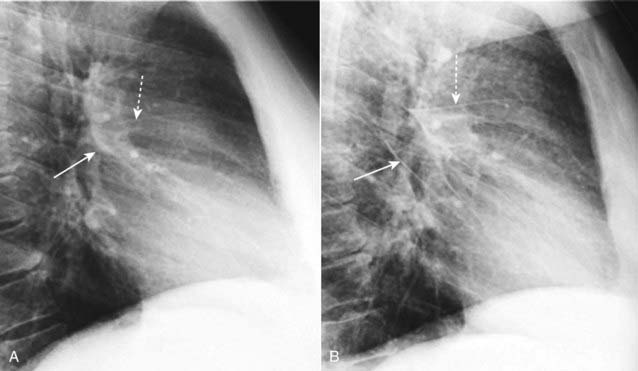
Figure 9-13 Normal fissures and fluid in the fissures.
A, The major (solid white arrow) and minor fissures (dashed white arrow) may be barely visible normally but are almost never thicker than a line you could draw with the point of a sharpened pencil. B, Fluid can collect in the fissures in CHF and distend them, making them appear thicker and more irregular in contour and more visible than normal. The major fissure is more prominent (solid white arrow) as is the minor fissure (dashed white arrow). When the patient’s heart failure clears, the fissures will return to normal appearance, but after repeated and prolonged bouts of failure, fibrosis may result in permanent thickening of the fissures.
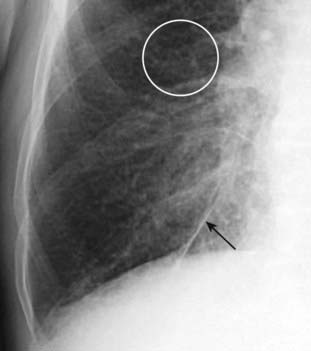
Figure 9-14 Fluid in inferior accessory fissure.
In addition to thickening the major and minor fissures, fluid may also distend accessory fissures in the lung. Here, the inferior accessory fissure that separates the medial from the other basilar segments of the lower lobe and is usually barely visible when present is markedly thickened (solid black arrow). Peribronchial thickening (white circle) is also seen.
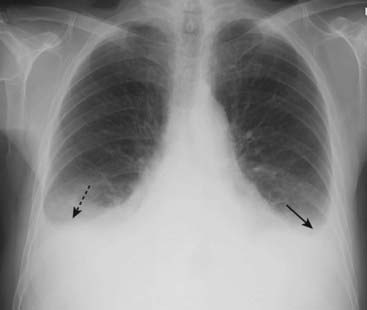
Figure 9-15 Pleural effusions in congestive heart failure.
Bilateral pleural effusions (dotted and solid black arrows) are present in this patient with CHF. Effusions in CHF are most often bilateral but may be asymmetrical, the right side invariably being slightly larger. While a unilateral, left pleural effusion may occur with CHF, a large left effusion should draw suspicion to another possible cause, such as metastatic disease.
Pulmonary Alveolar Edema
When the pulmonary venous pressure is sufficiently elevated (about 25 mm Hg), fluid spills out of the interstitial tissues of the lung into the airspaces. This results in pulmonary alveolar edema (most often shortened to pulmonary edema without including “alveolar”).
The radiographic findings of pulmonary alveolar edema:
What happened to cardiomegaly and cephalization?
How pulmonary edema resolves
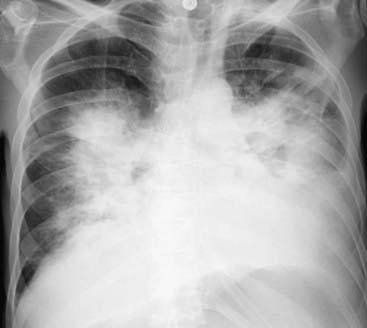
Figure 9-16 Bat-wing pattern of pulmonary edema.
The radiographic findings of pulmonary alveolar edema include fluffy, indistinct, patchy airspace densities frequently centrally located and sparing the outer third of the lung. This is called the bat-wing (angel-wing) or butterfly pattern, and it suggests pulmonary edema versus other airspace diseases such as pneumonia. The patterns of cardiogenic and noncardiogenic pulmonary edema overlap considerably, but the absence of pleural effusions, absence of fluid in the fissures, and the normal-sized heart favor a noncardiogenic cause in this case. The patient was in septic shock from an overwhelming urinary tract infection.
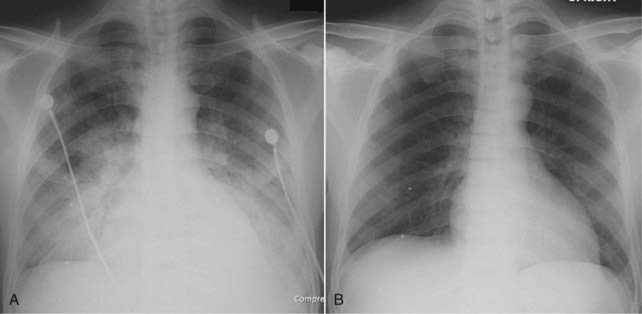
Figure 9-17 Rapidly clearing pulmonary edema.
Pulmonary edema generally is both abrupt in its onset and quick to clear. A, This patient demonstrates bilateral, perihilar airspace disease with diffuse prominence of the interstitial markings characteristic of pulmonary edema. B, Four days later, the lungs are clear. Patients with adult respiratory distress syndrome are not likely to clear this quickly, nor are patients who have coexisting diseases such as renal or hepatic failure or superimposed pneumonia.
Noncardiogenic Pulmonary Edema: General Considerations
Although CHF accounts for the majority of the cases of pulmonary edema (i.e., cardiogenic pulmonary edema), there are other noncardiogenic causes of pulmonary edema. Among the causes of noncardiogenic pulmonary edema is a diverse group of diseases:
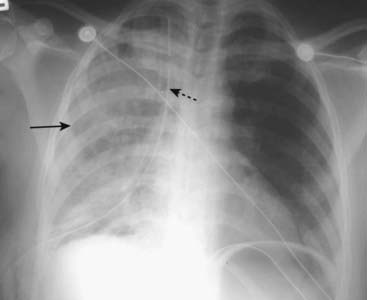
Figure 9-18 Reexpansion pulmonary edema.
Unilateral airspace disease affects the entire right lung (solid black arrow). In addition, a chest tube (dotted black arrow) is seen on the same side. The chest tube was inserted for a large, right-sided, tension pneumothorax that was rapidly reexpanded. Reexpansion pulmonary edema results from the overly rapid expansion of a lung that has typically been chronically collapsed by pneumothorax or a large pleural effusion. Its exact cause is unknown. In general, unilateral pulmonary edema can occur either because of an abnormality on the same side as the pulmonary edema (e.g., prolonged positioning with the affected side dependent) or an abnormality on the opposite side (e.g., large pulmonary embolus occluding flow to the opposite lung).
Noncardiogenic Pulmonary Edema: Imaging Findings
Adult respiratory distress syndrome (ARDS) represents one form of noncardiogenic pulmonary edema.
Differentiating Cardiac from Noncardiac Pulmonary Edema
The patterns of cardiac (cardiogenic) and noncardiac (noncardiogenic) pulmonary edema overlap considerably; the patient’s history and clinical picture are key to establishing the most likely cause of pulmonary edema.
In general, noncardiogenic pulmonary edema is:
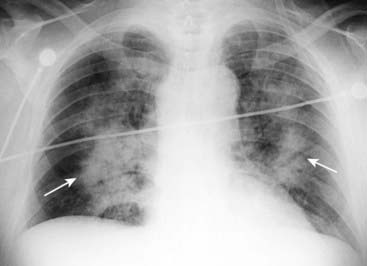
Figure 9-19 Noncardiogenic pulmonary edema.
Even though this airspace disease has a perihilar distribution similar to cardiogenic pulmonary edema (solid white arrows), there is no pleural fluid, fluid in the fissures or cardiomegaly. In general, noncardiogenic pulmonary edema is less likely to demonstrate pleural effusions and Kerley B lines, more likely to demonstrate a normal pulmonary capillary wedge pressure (PCWP) of less than 12 mm Hg, and more likely to be associated with a normal-sized heart than cardiogenic pulmonary edema.
TABLE 9-3 CARDIOGENIC VERSUS NONCARDIOGENIC PULMONARY EDEMA
| Imaging Finding | Cardiogenic | Noncardiogenic |
|---|---|---|
| Pleural effusions | Common | Infrequent |
| Kerley B lines | Common | Infrequent |
| Heart size | Frequently enlarged | May be normal |
| Pulmonary capillary wedge pressure | Elevated | Normal |
Hypertensive Cardiovascular Disease
Chronic elevation of systemic blood pressure leads to left ventricular hypertrophy in about 20% of patients, double that incidence if the patient is obese. Most of the time (90%) the hypertension is essential hypertension with no identifiable cause. Heart failure, coronary artery disease, and cardiac arrhythmias are common complications of hypertension. Systemic hypertension can lead to left ventricular hypertrophy. Left ventricular hypertrophy occurs at the expense of the lumen, the wall becoming thicker while the lumen becomes smaller. Therefore, the heart is usually normal or slightly increased in size early in the disease. It is not until the muscle begins to decompensate that the heart increases dramatically in size. The aorta, under increased systemic pressure, pivots outward around the aortic valve and the aortic hiatus in the diaphragm and gradually uncoils, becoming more prominent in both its ascending and descending portions (Fig. 9-20).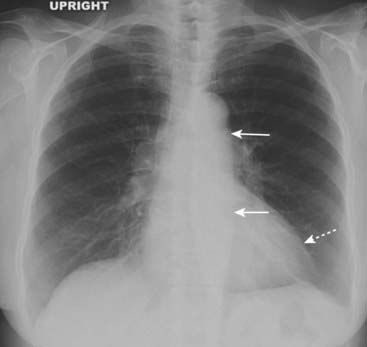
Figure 9-20 Hypertensive cardiovascular disease.
Systemic hypertension can lead to hypertrophic cardiomyopathy. The left ventricle (dotted white arrow) is only slightly enlarged, but other modalities would demonstrate marked concentric hypertrophy of the left ventricular wall that has occurred at the expense of the lumen. The aorta itself is uncoiled (solid white arrows) due to increased systemic blood pressure (see also Fig. 9-7C).
Mitral Stenosis
In developed nations, the incidence of mitral stenosis from rheumatic heart disease has declined markedly, but it is still seen in the elderly and in younger individuals from developing countries. The most common symptoms are from left heart failure: dyspnea on exertion, orthopnea, and paroxysmal nocturnal dyspnea. Mitral stenosis leads to obstruction to the outflow of blood from the left atrium and usually becomes symptomatic when the valve area falls below one-third of its normal size. As the left atrial pressure builds, the left atrium enlarges and the increased pulmonary venous pressure (pulmonary venous hypertension) is reflected retrograde into the pulmonary circulation. Upper lobe vessels become as large as or more prominent than lower lobe vessels (cephalization). Pulmonary venous hypertension eventually leads to CHF. With prolonged elevation of pulmonary venous pressure, physical changes in the pulmonary vasculature may lead to escalating pulmonary vascular resistance requiring ever increasing levels of pulmonary arterial pressure.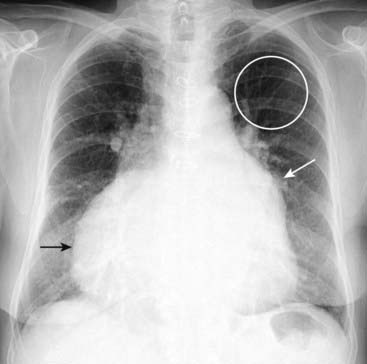
Figure 9-21 Chronic mitral stenosis with tricuspid regurgitation.
The left atrium is enlarged (solid white arrow). Pulmonary venous hypertension has produced a redistribution of flow in the lungs so that the upper lobe vessels have become more prominent than the lower lobe (cephalization) (white circle). Due to increased pulmonary vascular resistance and subsequent pulmonary arterial hypertension, the right heart also undergoes changes, eventually including tricuspid regurgitation with enlargement of the right atrium (solid black arrow).
Pulmonary Arterial Hypertension
The normal mean pulmonary artery pressure is about 15 mm Hg. Pulmonary arterial hypertension may be idiopathic (primary) or secondary to another disease, usually emphysema. Mitral stenosis is another cause of pulmonary arterial hypertension. With primary pulmonary hypertension, the leading cause of death is progressive right heart failure. Secondary pulmonary hypertension shares co-morbidities with the diseases that cause it: emphysema, recurrent pulmonary thromboembolic disease, mitral stenosis, CHF. The hallmark of pulmonary arterial hypertension is a discrepancy in size between the central pulmonary vasculature (i.e., the main, right, and left pulmonary arteries are large) and the peripheral pulmonary vasculature. This discrepancy is called pruning. On CT scans, the main pulmonary artery is normally about the same diameter as the ascending aorta, but in pulmonary arterial hypertension the main pulmonary artery is usually 3 cm or larger in size (Fig. 9-22).
Figure 9-22 Pulmonary arterial hypertension.
Normally, the main pulmonary artery (MPA) is about the same diameter as the ascending aorta (A). In this patient, with pulmonary arterial hypertension, the MPA is much larger than the aorta. There is also a rapid attenuation in the size of the pulmonary arteries (solid white arrows) called pruning, which is also seen in pulmonary arterial hypertension.
Aortic Stenosis
Aortic stenosis may be secondary to a congenital bicuspid aortic valve, from degeneration of a tricuspid valve or, less frequently, rheumatic heart disease. Since left ventricular outflow is obstructed and the ventricles respond to obstruction by undergoing hypertrophy of their walls, the heart is usually normal in size early in the course of the disease. The ascending aorta may be unusually prominent because of post-stenotic dilatation, a hallmark of a significantly stenotic lesion in any major artery in which, because of eddy currents and turbulent flow, intraluminal pressure is increased for several centimeters distal to an obstructing lesion (see Fig. 9-9A).Cardiomyopathy
Dilated cardiomyopathy
Hypertrophic cardiomyopathy
Restrictive cardiomyopathy

Figure 9-23 Dilated alcoholic cardiomyopathy.
The cardiac silhouette is markedly enlarged, primarily as a result of biventricular enlargement. The patient had a long history of alcohol abuse. Dilated cardiomyopathy is frequently associated with congestive heart failure.
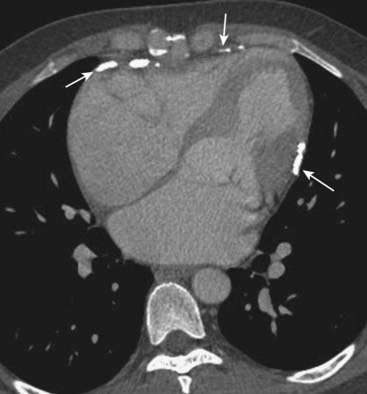
Figure 9-24 Constrictive pericarditis.
There is extensive pericardial calcification (solid white arrows), most likely post-inflammatory in etiology. Although restrictive cardiomyopathy and constrictive pericarditis can have identical clinical findings, the presence of pericardial calcifications excludes restrictive cardiomyopathy. If indicated, pericardiectomy holds the potential for cure for patients with constrictive pericarditis.
Aortic Aneurysms: General Considerations
Atherosclerosis is the most common cause of a descending thoracic aortic aneurysm. The majority of patients with aortic aneurysms are also hypertensive.Recognizing a Thoracic Aortic Aneurysm
The appearance of a thoracic aortic aneurysm will depend, in part, from which portion of the thoracic aorta it arises.
Contrast-enhanced CT is the modality most often used to diagnose a thoracic aortic aneurysm; MRI is also excellent at demonstrating aneurysms but is usually less available and more expensive. Their anatomy will be more readily delineated on CT studies using iodinated contrast material injected intravenously as a bolus, but they may be visible on noncontrast (unenhanced) studies as well. Often, both unenhanced and contrast-enhanced CT studies are obtained to fully evaluate the aneurysm and its contained clot. Frequently calcification is seen in the intima, which may be separated from the contrast-filled lumen by varying amounts of clot (Fig. 9-26).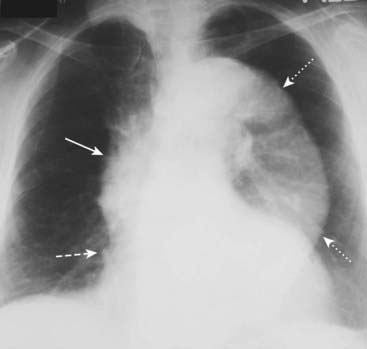
The entire thoracic aorta is enlarged in this 67-year-old man. The ascending aorta (solid white arrow) should normally not project farther to the right than the right heart border (dashed white arrow) on a nonrotated chest radiograph. The descending thoracic aorta should normally parallel and almost disappear with the thoracic spine; as it becomes larger, it swings farther away from the spine (dotted white arrows).
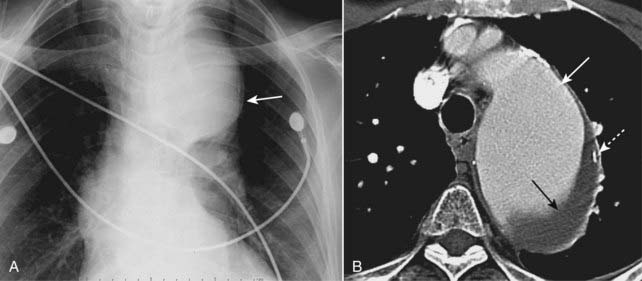
Figure 9-26 Aortic aneurysm, conventional chest radiograph and CT.
Close-up view of a frontal radiograph of the chest (A) demonstrates a large mediastinal soft tissue mass (solid white arrow). This soft tissue density represents a large aneurysm of the proximal descending aorta seen also in the CT scan (B). The aneurysm measured 6.7 cm, which placed it at significant risk for rupture. Calcification in the wall of an aneurysm is common (dotted white arrow). Contrast material mixes with blood flowing in the lumen of the aorta (solid white arrow), but the flowing blood is separated from the intimal calcification by a considerable amount of noncontrast-containing thrombus adherent to the wall (closed black arrow).
Thoracic Aortic Dissection
Aortic dissections most often originate in the ascending aorta (Stanford type A) or may involve only the descending aorta (Stanford type B). They result from a tear that allows blood to dissect in the wall for varying lengths of the aorta, usually along the media. In general, patients with aortic dissection have been hypertensive and may have an underlying condition that can predispose to dissection, such as cystic medial degeneration, atherosclerosis, Marfan syndrome, Ehlers-Danlos syndrome, trauma, syphilis, or crack cocaine abuse. In many patients, abrupt onset of ripping or tearing chest pain, which is maximal at its time of origin, is the characteristic history. Conventional radiographs are not significantly sensitive to be diagnostically reliable, but they may point to the diagnosis when several imaging findings occur together, especially in the proper clinical setting.
MRI is probably more sensitive than CT at detecting a dissection, but CT is usually more readily available. Transesophageal ultrasound is also used to establish the diagnosis.
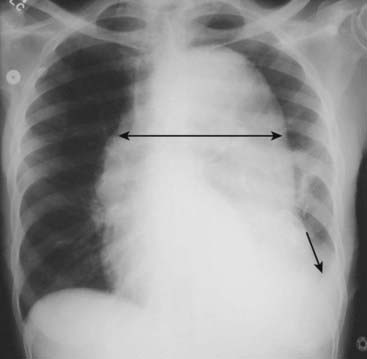
Figure 9-27 Aortic dissection.
Conventional radiographs are not sensitive enough to be diagnostically reliable for aortic dissection, but they may point to the diagnosis when several imaging findings are seen together, especially in the proper clinical setting. “Widening of the mediastinum” is frequently not present and is a poor means of establishing the diagnosis, although in this patient the mediastinum is clearly widened by an enlarged aorta (double black arrow). Also, a left pleural effusion is present (solid black arrow). The combination of a widened mediastinum and a left pleural effusion in a patient with chest pain should alert you to the possibility of an aortic dissection.
On both MRI and CT, the diagnosis rests on identification of the intimal flap that separates the true (original) from the false lumen (canal created by the dissection) (Fig. 9-28).
In general, type A (ascending aortic) dissections are treated surgically, whereas type B (descending aortic dissections) are treated medically.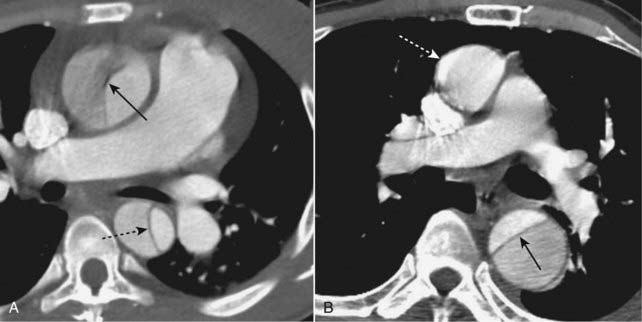
Figure 9-28 Aortic dissections, types A and B.
A, An intimal flap is seen to traverse both the ascending (solid black arrow) and descending aorta (dotted black arrow). This is a Stanford type A dissection. B, There is a normal-appearing ascending aorta (dotted white arrow) while an intimal flap is noted by the black line traversing the descending aorta (solid black arrow). The intimal flap is the characteristic lesion of an aortic dissection. The smaller lumen is usually the true (original) lumen, and the larger, false lumen is actually a channel that has been produced by blood dissecting through the media.
Coronary Artery Disease
Varying amounts of atheromatous plaque narrow the coronary artery lumen. Calcium is deposited in the muscular layers of the artery’s walls. Vulnerable plaque may rupture and there may be vasospasm or emboli which produce enough stenosis to lead to ischemia and possibly infarction of cardiac muscle. MRI can demonstrate postinfarct scar formation and myocardial contractility. Ventricular function can be quantitatively assessed. Some basic terms used in cardiac MRI are listed in Box 9-4 (Figs. 9-29 to 9-32). CT is used for imaging of the coronary arteries. It has a very high negative predictive value—a negative test virtually rules out coronary artery disease. One of the major drawbacks in the use of cardiac CT angiography is the relatively high x-ray dose delivered, but changes in equipment and algorithms are reducing this dose considerably. Cardiac CT angiography requires injection of iodinated contrast material. CT may also be used in asymptomatic patients for calcium scoring in which the calcium found in the coronary arteries is used as a marker for coronary artery disease. The amount of calcium detected on a cardiac CT scan, and calculated by computer, can be a helpful prognostic tool. The findings on cardiac CT are expressed as a calcium score, the higher the score the more extensive the evidence for CAD. Calcium scoring is performed without intravenous contrast (Fig. 9-33). CT can also demonstrate complications of myocardial infarction such as ventricular aneurysms and intracardiac clots. Single photon emission computed tomography (SPECT) is an imaging technique that blends the intravascular injection of a radioactive isotope with acquisition of images using a rotating nuclear gamma camera capable of 3-dimensional localization of disease.
Box 9-4 Basic Cardiac MRI Terms

Figure 9-29 Cardiac MRI, short axis view.
This is a standard view of the heart using MRI called the short axis view. The right ventricle (RV) lies anterior to the left ventricle (LV), separated by the interventricular septum (solid white arrow). Note the wall of the left ventricle (dotted white arrow) is normally thicker than the right ventricle. (A is anterior and P is posterior.)
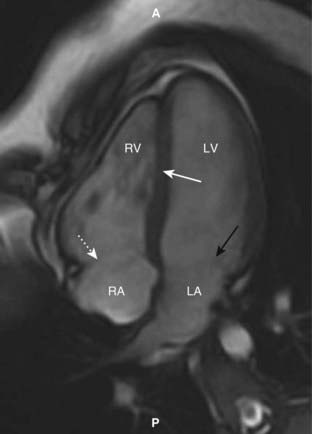
Figure 9-30 Cardiac MRI, horizontal long axis view.
This is another standard view of the heart using MRI called the horizontal long axis or four-chamber view. The right (RV) and left ventricles (LV) are separated by the interventricular septum (solid white arrow). Posterior to each of them are the right atrium (RA) and left atrium (LA) separated by the regions of the tricuspid (dotted white arrow) and mitral valves (solid black arrow), respectively. (A is anterior and P is posterior.)
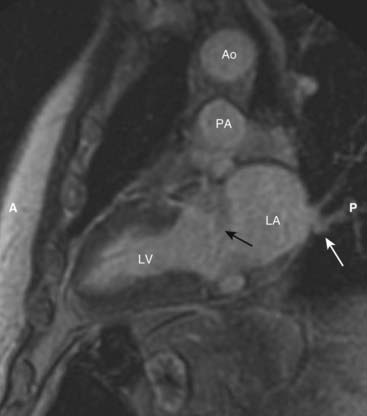
Figure 9-31 Cardiac MRI, vertical long axis view.
The vertical long axis or two-chamber view demonstrates the left ventricle (LV) separated from the more posterior left atrium (LA) by the mitral valve area (solid black arrow). Pulmonary veins drain into the left atrium (solid white arrow). The aorta (Ao) sits atop the pulmonary artery (PA). (A is anterior and P is posterior.)
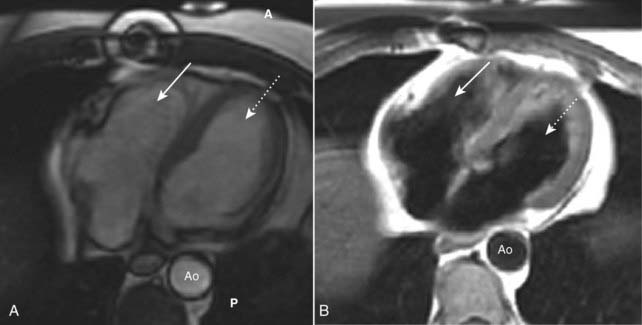
Figure 9-32 Cardiac MRI, bright blood and black blood images.
Using different imaging algorithms, MRI is capable of displaying the same tissues with differing appearances. (A) and (B) are both axial sections through the heart, showing the right ventricle (solid white arrows), the left ventricle (dotted white arrows) and the aorta (Ao). The bright blood technique (A) is utilized to assess cardiac function while the black blood technique (B) is usually better at depicting cardiac morphology. (A is anterior and P is posterior.)
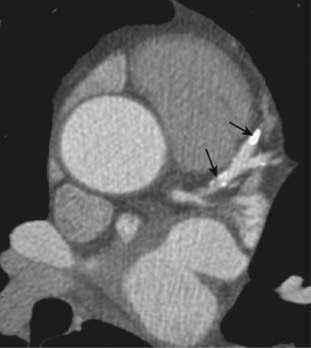
Figure 9-33 Cardiac CT, coronary artery calcification.
CT scan through the heart without intravenous contrast demonstrates calcified plaque in the left anterior descending coronary artery (solid black arrows). The amount of calcium detected on a cardiac CT scan and calculated by computer can be a helpful prognostic tool for coronary artery disease.
 Weblink
Registered users may obtain more information on Recognizing Adult Heart Disease on StudentConsult.com.
 Take-Home Points
Recognizing Adult Heart Disease
In adults, a quick assessment of heart size can be made using the cardiothoracic ratio, which is the ratio of the widest transverse diameter of the heart compared to the widest internal diameter of the rib cage. In normal adults, the cardiothoracic ratio is usually <50%.
There are extracardiac causes which can make the heart appear to be enlarged, even if it is actually normal, including AP portable studies, factors which inhibit a deep inspiration, abnormalities of the bony thorax, and the presence of a pericardial effusion.
The heart will appear slightly larger on an AP projection than a PA projection of the chest because the heart is closer to the imaging surface on a PA exposure.
On the lateral projection, the heart usually does not extend posteriorly to overlap the spine unless it is enlarged or there is a pericardial effusion.
In an infant, the heart may normally be up to 65% of the cardiothoracic ratio; other factors should be assessed in an infant with apparent cardiomegaly such as the pulmonary vasculature and the clinical signs and symptoms.
The thymus gland is usually seen in infants superimposed on the upper portion of the cardiac silhouette and could mimic cardiac enlargement.
The normal contours of the heart and the normal appearance of the pulmonary vasculature are reviewed.
Two major patterns of congestive heart failure are pulmonary interstitial and pulmonary alveolar edema.
The four key findings of pulmonary interstitial edema are thickening of the interlobular septa, peribronchial cuffing, fluid in the fissures, and pleural effusions.
The key findings in pulmonary alveolar edema are fluffy, indistinct, patchy airspace densities; bat-wing or butterfly configuration frequently sparing the outer third of lungs; and pleural effusions, especially with cardiogenic pulmonary edema.
Causes of pulmonary edema can be divided into two major categories: cardiogenic and noncardiogenic causes.
Cardiogenic pulmonary edema is more likely to have pleural effusions and Kerley B lines, cardiomegaly, and an elevated pulmonary capillary wedge pressure than noncardiogenic pulmonary edema.
The noncardiogenic causes of pulmonary edema are a diverse group of diseases, including uremia, disseminated intravascular coagulopathy, smoke inhalation, near-drowning, volume overload, and lymphangitic spread of malignancy.
Adult respiratory distress syndrome (ARDS) can be considered a subset of noncardiogenic pulmonary edema in which the clinical picture is one of severe hypoxia, cyanosis, tachypnea, and dyspnea.
Essential hypertension is a common disease that can lead to congestive heart failure and coronary artery disease as well as secondary hypertrophic cardiomyopathy.
Mitral stenosis has become less common with antibiotic treatment of rheumatic fever but can lead to left and then right heart failure through chronic elevation of the pulmonary venous and arterial pressures with increased pulmonary vascular resistance.
Pulmonary arterial hypertension may either be idiopathic (primary) or secondary to emphysema or recurrent thromboembolic disease. It produces pruning of the pulmonary vasculature and might be suspected when the main pulmonary artery achieves a diameter of 3 cm or more on CT or MRI.
Aortic stenosis in the elderly is most often secondary to degeneration of a tricuspid aortic valve and can lead to angina, syncope, or congestive heart failure. The ascending aorta may be prominent from post-stenotic dilatation.
Cardiomyopathies are divided into dilated, hypertrophic, and restrictive forms. Restrictive cardiomyopathy must be differentiated from constrictive pericarditis with which it shares its clinical findings.
Aortic aneurysms can be saccular or fusiform or can dissect. Most thoracic aortic dissections begin in the ascending aorta (Stanford type A) and are treated surgically.
Coronary artery disease is the leading cause of death worldwide. It or its sequelae can be imaged using a variety of techniques, including CT, MRI, and single photon emission computed tomography (SPECT).