Chapter 22 The Systemic and Pulmonary Circulations
1. Blood pressure represents a potential energy that propels blood through the circulation.
2. Vascular resistance is defined as perfusion pressure divided by flow.
3. The net resistance of the systemic circulation is called the total peripheral resistance.
4. Arterial pressure is determined by the cardiac output and the total peripheral resistance.
5. The blood flow to each organ is determined by the perfusion pressure and the vascular resistance.
6. The pulmonary circulation offers much less resistance to blood flow than does the systemic circulation.
7. Arterial pressures are measured in terms of systolic, diastolic, and mean levels.
8. Pulse pressure increases when the stroke volume increases, heart rate decreases, aortic compliance decreases, or total peripheral resistance increases.
Blood Pressure Represents a Potential Energy That Propels Blood Through the Circulation
The systemic circulation has the aorta as its inlet point and the venae cavae as its outlet. The remainder of the circulation (i.e., right heart, pulmonary circuit, and left heart) is, by definition, the central circulation. Blood enters the central circulation from the venae cavae and leaves the central circulation through the aorta.
Figure 22-1 shows the normal pressure profile in the systemic circulation. This figure portrays the pressures that would be measured if a miniature pressure gauge were inserted into the various vessels that blood encounters in its passage through the systemic circulation. The blood pressure is highest in the aorta (typically, mean aortic pressure is 98 mm Hg) and lowest in the venae cavae (typically, 3 mm Hg). It is this pressure difference that forces blood to move (via bulk flow) through the systemic vessels; that is, 98 minus 3 mm Hg is the perfusion pressure (difference) that drives systemic blood flow (the concept of perfusion pressure is described in Chapter 18).
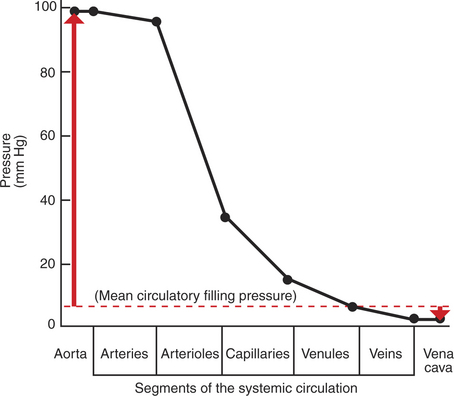
FIGURE 22-1 Graph of the blood pressures (hydrostatic pressures) that typically exist in the systemic circulation of a dog at rest (solid black line). The actual blood pressure in the aorta and arteries is pulsatile, increasing with each cardiac ejection and falling between ejections. The values plotted here are the average (mean) values of those pulsatile pressures. Mean circulatory filling pressure (dashed red line) is the pressure that would exist if the heart were stopped. Red arrows show the contrasting directions and magnitudes of the pressure changes that would occur in the aorta and vena cavae if a stopped heart were restarted and cardiac output returned to normal (see text). All pressures are measured at heart level, with reference to atmospheric pressure (taken as zero).
Aortic blood pressure can be thought of as the potential energy available to move blood; the decrease in pressure in the sequential segments of the systemic circuit represents the amount of this potential energy that is “used up” in moving blood through each segment. Pressure energy is used up through friction, which is generated as the molecules and cells of blood rub against each other and against the walls of the blood vessels. The energy used up through friction is actually converted to heat, although the increase in the temperature of the blood and blood vessels as a result of friction is very small.
The amount of the blood pressure energy used up in each of the sequential segments of the systemic circulation depends on the amount of friction or resistance that the blood encounters. The aorta and large arteries offer very little resistance to blood flow (very little friction), so the blood pressure decreases only a little in these vessels (from 98 to about 95 mm Hg). The greatest pressure decrease (greatest loss of pressure energy through friction) occurs as blood flows through arterioles; that is, the resistance to blood flow is greater in the arterioles than in any other segment of the systemic circulation. The capillaries and the venules offer a substantial resistance to blood flow, but the resistance (and therefore the pressure decrease) is not as great in these vessels as it is in the arterioles. The large veins and the venae cavae are low-resistance vessels, so little pressure energy is expended in driving the blood flow through these vessels.
The pumping of blood by the heart maintains the pressure difference between the aorta and the venae cavae. If the heart stops, blood continues to flow for a few moments from the aorta toward the venae cavae. As this blood leaves the aorta, the aortic walls become less distended, and the blood pressure inside the aorta decreases. As extra blood accumulates in the venae cavae, they become more distended than before, and the blood pressure inside the venae cavae increases. Soon, there is no pressure difference between the aorta and the venae cavae. Blood flow in the systemic circuit ceases, and the pressure everywhere in the systemic circulation is the same. It has been demonstrated experimentally that this eventual pressure is about 7 mm Hg. This pressure, in a static circulation, is called the mean circulatory filling pressure. The mean circulatory filling pressure is above zero, because there is a “fullness” to the circulation; that is, even if the heart stops, blood still distends the vessels that contain it. The vessel walls, being elastic, recoil (“push back”) against this distention, which accounts for the persistence of pressure in the circulation even if the heart stops. If a transfusion of blood is administered to an animal with the heart stopped, the vessels become more distended, and the mean circulating filling pressure rises above 7 mm Hg. Conversely, if blood is removed from an animal with the heart stopped, the pressure everywhere falls to a level below 7 mm Hg.
Consider what happens if the heart is restarted in an animal after the pressure has equalized everywhere at 7 mm Hg. With each heartbeat, the heart takes some blood out of the venae cavae and moves it into the aorta. The volume of blood in the venae cavae decreases, so the venae cavae become less distended and vena caval pressure drops below 7 mm Hg. The volume of blood in the aorta increases, so the aorta becomes more distended and aortic pressure rises above 7 mm Hg. The vena caval pressure drops about 4 mm Hg (from 7 to 3 mm Hg), and the aortic pressure rises about 91 mm Hg (from 7 to 98 mm Hg). It is important to understand why the pressure decreases only a little in the venae cavae and why it increases so much in the aorta, even though the volume of blood removed from the venae cavae with each heartbeat is the same as the volume of blood added to the aorta. The reason is that the veins are much more compliant (distensible) than the arteries; one can add or remove blood from veins without changing the venous pressure very much, whereas the addition or removal of blood from arteries changes the arterial pressure a great deal.
A compliant vessel readily distends when pressure or volume is added. It yields to pressure. By definition, compliance is the change in the volume within a vessel or a chamber divided by the associated change in distending (transmural) pressure, as follows:

Compliance corresponds to the slope of a volume-versus-pressure graph. Veins are about 20 times more compliant than arteries (as illustrated in Figure 22-2). Therefore, veins can accept or give up a large volume of blood without incurring much of a change in pressure. Veins readily expand or contract to accommodate the changes in blood volume that occur with fluid intake (e.g., drinking) or fluid loss (e.g., sweating). Veins thus function as the major blood volume reservoirs of the body. In contrast, arteries function as pressure reservoirs, providing the temporary storage site for the surge of pressure energy that is created with each cardiac ejection. Arteries are tough vessels, with low compliance. Therefore, arteries can accept a large increase in pressure during a cardiac ejection and then sustain the pressure high enough between cardiac ejections to provide a continuous flow of blood through the systemic circulation.
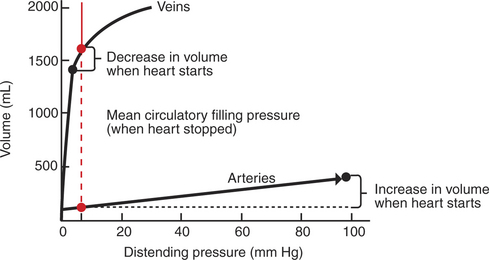
FIGURE 22-2 Typical relationships between volume (of blood) and distending pressure for veins and arteries. Veins are more compliant (easier to distend) than arteries, so they hold a greater volume of blood for a given distending pressure. This concept is illustrated for a distending pressure of 7 mm Hg (vertical dashed red line), which is a normal value for the mean circulatory filling pressure (the pressure that would exist in the circulation if the heart were stopped, as shown in Figure 22-1). For a distending pressure of 7 mm Hg, the veins contain about 1600mL of blood and the arteries only 125mL (red circles). When the heart is restarted, the venous volume decreases, and the arterial volume increases (black circles). Because the veins are much more compliant than the arteries, the venous pressure changes very little (decreases from 7 to 3 mm Hg), whereas the arterial pressure changes greatly (increases from 7 to 98 mm Hg).
Vascular Resistance Is Defined as Perfusion Pressure Divided by Flow
Everyday experience tells us that it is easier to force fluid through a large tube than through a small tube. For example, it is easier to drink a milk shake through a large-diameter straw than through a small-diameter straw. For a given driving force (perfusion pressure difference), the flow is higher in the large tube because it offers less resistance to flow (less friction) than the small tube. The precise definition of resistance follows:
ΔPressure (perfusion pressure difference, or simply perfusion pressure) is the pressure at the tube inlet minus the pressure at its outlet. Figure 22-3 presents these concepts in pictorial and graphic form. The dashed lines in Figure 22-3 indicate that a perfusion pressure of 60 mm Hg causes a flow of 1600 milliliters per minute (mL/min) through the large tube. Thus the resistance of the large tube is 37.5 mm Hg/liter per minute (L/min). The same perfusion pressure (60 mm Hg) causes a flow of only 100mL/min through the small tube. The resistance of the small tube is therefore 600 mm Hg/L/min. The resistance of the small tube is 16 times greater than the resistance of the large tube.
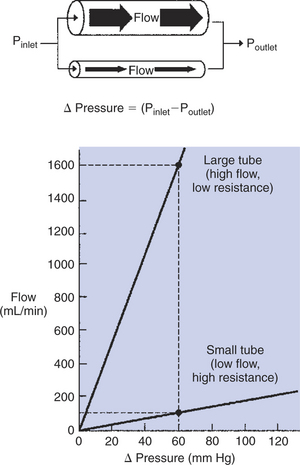
FIGURE 22-3 Relationship between fluid flow and perfusion pressure (ΔPressure) for two tubes. The perfusion pressure is the pressure at the inlet (Pinlet) of the tube minus the pressure at the outlet (Poutlet). In this example, the larger tube has twice the radius of the smaller tube. For a given perfusion pressure, the flow through the larger tube is 16 times greater than the flow through the smaller tube. That is, the resistance of the larger tube is one-sixteenth the resistance of the smaller tube.
In the late 1800s the French physician J.L.M. Poiseuille demonstrated the dominant effect of radius on the resistance of a tube. He showed the following:
where l is the length of the tube, r is the radius, η is the viscosity of the fluid flowing through the tube, and π has its usual meaning.
This equation (Poiseuille’s law) states that the resistance of a tube varies inversely with the fourth power of the radius, so that doubling the radius (r) of the tube decreases its resistance by a factor of 16 (24). Resistance is also influenced by the length (l) of the tube. This makes intuitive sense; it is harder to force fluid through a long tube than through a short tube of the same radius. The final determinant of resistance is the viscosity (η) of the fluid. The higher the viscosity of the fluid, the higher is the resistance to its flow through a tube. For example, honey is more viscous than water, so a tube would offer a higher resistance to the flow of honey than to the flow of water.
As already described, the arterioles are the segment of the systemic circulation with the highest resistance to blood flow (see Figure 22-1). It may seem paradoxical that the arterioles are the site of highest resistance when the capillaries are smaller vessels. After all, a smaller tube has a much higher resistance than a larger tube (see Figure 22-3). The resolution of this paradox is presented in Figure 22-4. It is true that each capillary has a smaller radius and therefore a greater resistance than each arteriole. However, each arteriole in the body distributes blood to many capillaries, and the net resistance of all those capillaries is less than the resistance of the single arteriole that delivers blood to them. It is only because each arteriole delivers blood to so many capillaries that the net resistance of the capillaries is less than the resistance of the arteriole.
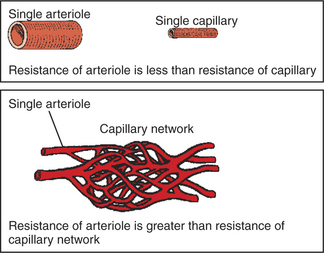
FIGURE 22-4 The resistance of a single arteriole is less than the resistance of a single capillary, because arterioles are larger in diameter. However, each arteriole supplies blood to a whole network of capillaries, and the resistance of an arteriole is greater than the resistance of the capillary network that it supplies with blood (see text).
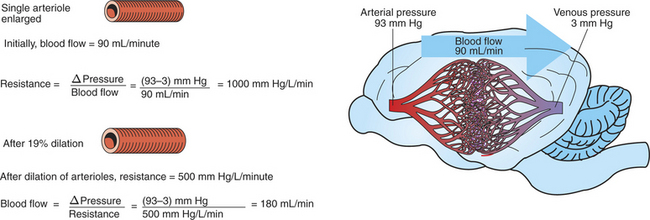
Arterioles are the site not only of the highest resistance in the circulation, but also of adjustable resistance. Variation in arteriolar resistance is the main factor that determines how much blood flows through each organ in the body; an increase in arteriolar resistance in an organ decreases the blood flow through that organ, and vice versa. Arterioles change their resistance, moment to moment, by changing their radius. (The length of an arteriole does not change, at least not over the short term.) The walls of arterioles are relatively thick and muscular. Contraction of the arteriolar smooth muscle decreases the radius of arterioles, and this vasoconstriction substantially increases resistance to blood flow. Relaxation of the smooth muscle allows the radius of the vessels to increase, and this vasodilation substantially reduces the resistance to blood flow.
Figure 22-5 illustrates that a small change in the radius of arterioles in an organ brings about a large change in resistance and therefore in blood flow. In this example the arterial pressure is 93 mm Hg and the venous pressure is 3 mm Hg, so the perfusion pressure is 90 mm Hg. The brain blood flow is initially observed to be 90mL/min. Based on the mathematical definition of resistance, the resistance of the brain blood vessels is 1000 mm Hg/L/min. Most of this resistance is provided by the brain arterioles. Next, consider the consequence of a slight vasodilation, such that the radius of the arterioles increases by 19% (e.g., from a radius of 1.00 to a radius of 1.19). Recall from Poiseuille’s law that the resistance varies inversely as the fourth power of the radius. Because 1.194 equals 2.00, a 19% increase in radius cuts the resistance in half! Decreasing the brain’s resistance by half (to 500 mm Hg/L/min) would double the brain blood flow (to 180mL/min).
The Net Resistance of the Systemic Circulation Is Called the Total Peripheral Resistance
As with any other resistance, total peripheral resistance (TPR) is defined as a pressure difference (perfusion pressure) divided by a flow. In a calculation of the resistance of the systemic circulation, the perfusion pressure is the pressure in the aorta minus the pressure in the venae cavae. The flow is the total amount of blood that flows through the systemic circuit, which is equal to the cardiac output, as follows:

For a typical dog at rest, the mean aortic pressure is 98 mm Hg, the mean vena caval pressure is 3 mm Hg, and the cardiac output is 2.5 L/min. Under these conditions, TPR is 38 mm Hg/L/min, which means that it takes a driving pressure of 38 mm Hg to force 1 L/min of blood through the systemic circuit.
Because the pressure in the venae cavae is usually close to zero, it is sometimes ignored in the calculation of TPR. The resultant simplified equation states that TPR is approximately equal to the aortic pressure divided by the cardiac output. Usually, this equation is rearranged to form the statement that the mean aortic blood pressure (Pa) is approximately equal to the cardiac output (CO) multiplied by TPR:

This equation expresses one of the central concepts in cardiovascular physiology: the mean aortic blood pressure is determined by two, and only two, factors. Thus, if the aortic pressure is increased, it must be because the cardiac output increased, the TPR increased, or both. There are no other possibilities.
Arterial Pressure Is Determined by the Cardiac Output and the Total Peripheral Resistance
Three examples illustrate the application of the concept that the mean aortic blood pressure is determined by cardiac output and TPR. First, in the most common form of human essential hypertension, the cardiac output is normal. The blood pressure is elevated because of excessively constricted systemic arterioles, which increases TPR above normal. What remains unclear about human essential hypertension is why the arterioles are constricted and why the body does not compensate for the elevated TPR by lowering the cardiac output below normal (which would keep the arterial pressure close to normal). High blood pressure is a serious health problem in human medicine, because patients with uncontrolled hypertension often develop cardiac hypertrophy, and they are at high risk for cardiac arrhythmias, myocardial infarction, renal failure, and stroke. Naturally occurring hypertension is rare in veterinary species, although several techniques have been developed to induce hypertension in laboratory animals for research purposes.
Severe hemorrhage or dehydration is another condition in which the arterial pressure becomes abnormal, and it provides several distinct contrasts to chronic hypertension. For example, hemorrhage and dehydration are often encountered in veterinary medicine. Also, the arterial pressure is reduced in these conditions, not elevated. The cause of the decreased pressure is a decreased cardiac output. Hemorrhage or dehydration characteristically reduces the cardiac preload, which reduces the stroke volume and cardiac output. TPR is actually increased above normal because the body constricts the arterioles in the kidneys, splanchnic circulation, and resting skeletal muscle. Vasoconstriction in these organs minimizes the fall in arterial pressure and diverts the available cardiac output to the “more critical” organs, which include the brain, heart, and any exercising skeletal muscle.
The response to vigorous exercise provides a third application of the concept that the mean aortic blood pressure is determined by the cardiac output and TPR. As in hemorrhage, exercise causes the cardiac output and TPR to change in opposite directions. In exercise, however, the cardiac output is elevated, and TPR is decreased. TPR decreases because the arterioles in the working skeletal muscle dilate, which increases the skeletal muscle blood flow. During vigorous exercise, TPR decreases to about one fourth of its resting value. The cardiac output increases about fourfold. The result is that the aortic pressure is negligibly changed. Figure 22-6 depicts the cardiovascular adjustments to vigorous exercise.
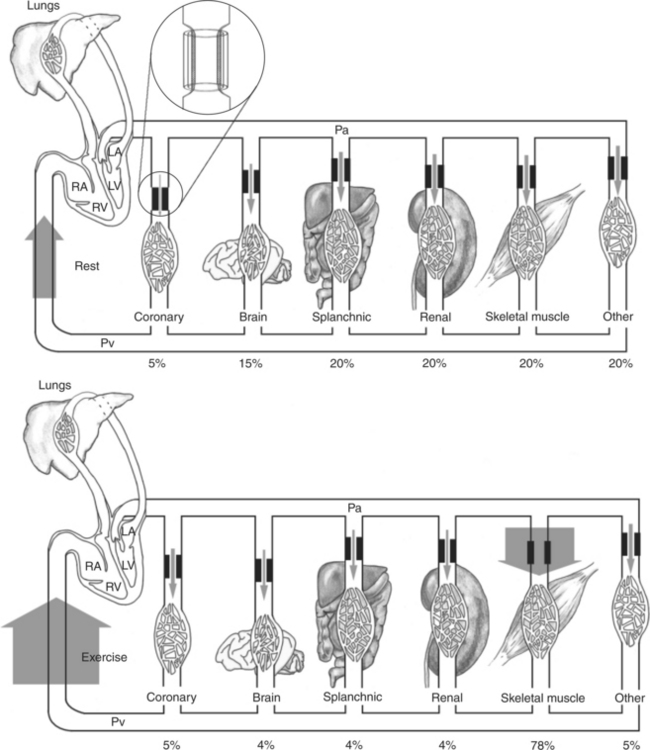
FIGURE 22-6 Cardiac output and its distribution compared during rest (top) and vigorous exercise (bottom) in a typical large dog. The width of the shaded arrows denotes the amount of blood flow. The flow of blood into the right side of the heart (which is equal to the cardiac output) is represented by the very wide arrows on the left. The cardiac output is 2.5 L/min at rest and increases to 10.0 L/min during exercise (fourfold increase). The entire cardiac output passes through the lungs and then is pumped by the left ventricle (LV) into the systemic arterial system (horizontal tube across top). The systemic arteries deliver blood to each of the systemic vascular beds, which are grouped here into coronary, brain, splanchnic, renal, skeletal muscle, and other. In each systemic organ, blood must pass through high-resistance arterioles (heavy bars) before reaching the capillaries. The arterioles act as adjustable cuffs or constrictors (see magnified view, top). The proportion of the total cardiac output that goes to each organ is indicated by a percentage at the bottom. Because each organ is exposed to the same arterial pressure (Pa) and venous pressure (Pv), the proportion of cardiac output that each organ receives is determined by its resistance. Resistance is determined primarily by the arteriolar diameter, which is indicated by the size of the opening between the heavy bars. During vigorous exercise, skeletal muscle arterioles dilate maximally, and the blood flow to the exercising muscles increases 16-fold (from 0.5 L/min at rest to 7.8 L/min). Coronary arterioles also dilate, and the coronary blood flow increases about fourfold, which meets the increased demand by the heart muscle for oxygen. Vasoconstriction causes a small decrease in blood flow to the splanchnic and renal circulations. Blood flow to the brain is basically unchanged. Of course, the percentage of total cardiac output received by the brain decreases. RV, Right ventricle; LA, left atrium; RA, right atrium.
The Blood Flow to Each Organ Is Determined by the Perfusion Pressure and the Vascular Resistance
If the equation that defines resistance is solved for flow, the result is:
As applied to the blood flow through any organ, this equation points out that the blood flow is determined by the perfusion pressure (arterial pressure minus venous pressure) and by the resistance of the blood vessels of the organ. There are no other factors. All the organs of the systemic circulation are exposed to the same perfusion pressure. Therefore the differences in blood flow to the various organs result solely from their different vascular resistances. As explained earlier, the vascular resistance of an organ is determined primarily by the diameter of its arterioles. Thus, arteriolar vasodilation and vasoconstriction are the primary mechanisms that increase or decrease the blood flow in one organ relative to another organ.
This point is illustrated in Figure 22-6. In a typical dog at rest, the arteriolar resistances are similar (diameters are the same) in the splanchnic, renal, and skeletal vascular beds. Therefore, each of these beds receives about the same blood flow (shown in Figure 22-6 by arrows of equal width). During exercise, skeletal muscle arterioles dilate greatly, almost doubling in diameter, which decreases their resistance to blood flow by a factor of almost 16. Therefore the skeletal muscle blood flow increases almost 16-fold (from 0.5 to 7.8L/min). Also during exercise, coronary arterioles dilate, so the coronary blood flow increases. Brain arterioles remain the same, so the brain blood flow is unchanged. By contrast, the arterioles in the splanchnic and renal circulations constrict slightly during exercise, which causes splanchnic and renal resistance to increase by about 20%. Therefore the splanchnic and renal blood flows decrease by about 20% (from 0.5 to 0.4L/min).
This discussion of blood flow during exercise describes the responses of a normal dog with a healthy heart. Such a dog can readily increase its cardiac output enough to meet the increased blood flow needs of the skeletal and cardiac muscle. As a consequence, the arterial pressure and the perfusion pressure are very similar during rest and exercise. By contrast, a dog with heart failure cannot increase the cardiac output much above its resting level. Therefore the arterial pressure (and perfusion pressure) declines during exercise, and none of the organs receives the blood flow that it requires. This is why animals with heart failure exhibit weakness, fatigue, and exercise intolerance. (Additional complications of heart failure are discussed in Chapter 26.) The point for now is that the equation that relates blood flow, perfusion pressure, and vascular resistance is fundamental and inescapable; this relationship is profoundly important to an understanding of cardiovascular function and dysfunction.
The Pulmonary Circulation Offers Much Less Resistance to Blood Flow Than Does the Systemic Circulation
As with any other resistance, pulmonary resistance is calculated as a pressure difference (perfusion pressure) divided by a flow. The perfusion pressure that forces blood through the pulmonary circuit is the pressure in the pulmonary artery minus the pressure in the pulmonary veins. The flow that traverses the pulmonary circuit is equal to the cardiac output. Therefore:
For a typical dog at rest, the mean pulmonary arterial pressure is 13 mm Hg, the mean pulmonary venous pressure is 5 mm Hg, and the cardiac output is 2.5L/min. Thus, pulmonary resistance is 3.2 mm Hg/L/min. Note that this is only about one-twelfth the resistance of the systemic circulation.
The entire cardiac output passes through the lungs, so a fourfold increase in cardiac output during exercise also necessitates a fourfold increase in pulmonary blood flow. Pulmonary blood vessels are quite compliant, and they readily distend to accept the increase in blood flow. Because even a small increase in vessel radius greatly decreases resistance (in accordance with Poiseuille’s law, as mentioned earlier), the resistance of the pulmonary blood vessels drops greatly during exercise. The decreased pulmonary resistance during exercise is advantageous because it allows the pulmonary flow to increase greatly without necessitating a large increase in the pulmonary arterial pressure.
In other circumstances the high compliance of pulmonary vessels can lead to adverse consequences. An example is the effect of gravity on pulmonary blood flow. Gravity pulls downward on the blood within lung blood vessels, which increases the blood pressure in vessels low in the lungs compared with vessels that are higher (Figure 22-7). The greater pressure distends the vessels low in the lungs, which decreases their resistance to blood flow. As a consequence, more of the pulmonary blood flow traverses the lower (dependent) regions of a lung than the higher regions. For reasons explained later (see Chapter 46), gravity also causes more air to be delivered to the dependent regions of the lungs than to the higher regions. However, gravity has a greater effect on blood flow than on air delivery, so blood flow tends to be excessive (relative to air delivery) in the dependent region of a lung. Any such imbalance in the lungs between air delivery and blood flow is called a ventilation-perfusion mismatch. This inherent problem is most severe in large animals, in which the large size of the lungs leads to substantial gravitational effects.
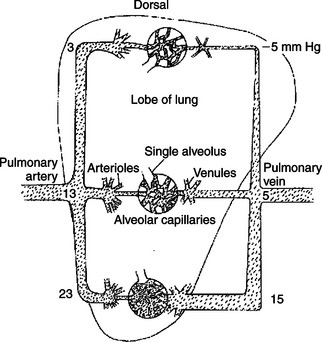
FIGURE 22-7 Gravity pulls downward on the blood within the lungs, which increases the pressure within blood vessels low in the lungs (see mm Hg values in the figure). The pressure outside the blood vessels (intrapleural pressure) is not affected much by gravity (because air is so much lighter than blood). Therefore the low-lying blood vessels become distended, which decreases their resistance to blood flow. As a result, more blood flows through the lower parts of the lungs than through the upper parts.
Hypoxic vasoconstriction is an important mechanism that helps offset ventilation-perfusion mismatches in the lungs regardless of whether these mismatches result from gravitational effects or from any other cause. The pulmonary blood vessels are sensitive to the local concentration of oxygen (measured as oxygen partial pressure, Po2). A low Po2 (hypoxia) causes pulmonary vessels to constrict. Hypoxic vasoconstriction takes place in any region of the lung where ventilation (the delivery of fresh air and oxygen) is reduced relative to blood flow. The vasoconstriction increases the resistance of blood vessels in that lung region and thereby reduces blood flow (perfusion). In this way, hypoxic vasoconstriction brings about a better match between ventilation and perfusion.
As with many compensatory mechanisms, hypoxic vasoconstriction can have undesirable consequences. For example, consider what happens if ventilation becomes depressed throughout the lungs. This may occur during an allergic constriction of the airways (asthma) or as the result of chronic obstructive pulmonary disease, which is common in horses. Depressed ventilation causes hypoxic vasoconstriction throughout the lungs. Pulmonary vascular resistance increases greatly, which necessitates a substantial increase in pulmonary arterial pressure to maintain pulmonary blood flow. The condition of elevated pulmonary arterial pressure is called pulmonary hypertension. Pulmonary hypertension greatly increases the workload of the right ventricle. In extreme cases, it leads to right ventricular failure.
Arterial Pressures Are Measured in Terms of Systolic, Diastolic, and Mean Levels
The pressures in the pulmonary artery and aorta are not constant but rather are pulsatile, as shown in Figure 21-1 and repeated in Figure 22-8. With each cardiac ejection, the pulmonary artery and aorta become distended with blood, which causes the pressures within these vessels to increase to peak values, called systolic pressures. Between cardiac ejections (i.e., during ventricular diastole), blood continues to flow out of the pulmonary artery and aorta into the pulmonary and systemic circulations, respectively. As the volume of blood in these large arteries decreases, the arteries become less distended, so arterial pressure decreases. Pressure continues to decrease until the next cardiac ejection begins. The minimal pressure reached before each new ejection is called the diastolic pressure. Figure 22-8 provides typical values for systolic and diastolic pressures.
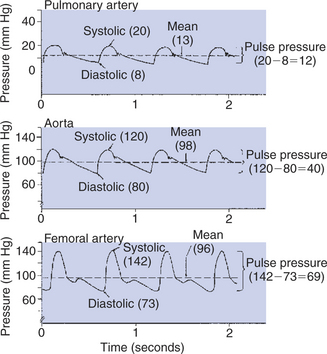
FIGURE 22-8 Blood pressure in the large arteries is pulsatile. The pressure patterns typical of the pulmonary artery, aorta, and femoral artery of the dog are shown.
The amplitude of the pressure pulsations in an artery is called the pulse pressure, specifically:

and
Typical values for pulse pressure are given in Figure 22-8. Note how much lower the systolic, diastolic, and pulse pressures are in the pulmonary artery than in the aorta. These differences illustrate why the pulmonary circulation is called the “low-pressure circulation” and the systemic circulation is called the “high-pressure circulation.”
It is important to distinguish among systolic pressure, diastolic pressure, and pulse pressure and to distinguish all of them from mean pressure. Mean aortic pressure is the average pressure in the aorta over the course of one or more complete cardiac cycles. Likewise, mean pulmonary artery pressure is the average pressure in that vessel. Obviously, the mean pressure in an artery is somewhere between the systolic (maximal) and diastolic (minimal) pressure levels. However, because the pressure wave forms in arteries are not symmetric, the mean pressure is generally not exactly midway between the systolic and diastolic pressures.
A popular rule is that mean pressure is about one third of the way up from diastolic toward systolic pressure; that is:
Figure 22-8 reveals that this is not a valid approximation for the determination of mean pressure in the aorta. However, the approximation is a good one for pressures measured in the femoral artery or in most other major arteries distal to the aorta. The reason that the rule applies in the distal arteries but not in the aorta is that the waveform of the arterial pressure pulsations changes as the pulses move out, away from the heart. The pressure pulses become narrower and more sharply peaked. This pronounced asymmetry of the pressure pulses causes the mean level in distal arteries to be closer to the diastolic pressure than to the systolic pressure (see Figure 22-8).
For complex reasons, the pulse pressure typically increases as blood flows from the aorta into the distal arteries. However, the mean pressure necessarily decreases in accordance with the principle of the conservation of energy. As stated earlier, mean arterial pressure is a measure of the potential energy in the bloodstream, and this potential energy is used up (converted into heat by friction) as blood flows from the aorta through the systemic circulation. The aorta and large arteries offer only a small resistance to blood flow; mean arterial pressure decreases only 1 to 3 mm Hg between the aorta and the femoral artery (see Figure 22-8). Most of the resistance to blood flow is found in the arterioles and capillaries. Therefore the largest decrements in mean pressure occur in these segments of the systemic circulation (see Figure 22-1).
Mean pressures are the pressures that must be used when calculating vascular resistance from the following equation:

Thus:
and
Unfortunately, the only way to measure mean vascular pressures is by inserting a needle or catheter into the vessel of interest. The first direct measurement of mean arterial blood pressure was carried out by Stephen Hales, an English clergyman. In about 1730, Hales inserted a tube (catheter) into the femoral artery of a conscious horse and found that blood rose in the tube to a height of more than 8feet. An 8-foot column of blood represents a pressure of more than 180 mm Hg, almost twice the mean arterial pressure expected in a normal resting animal. The high pressure undoubtedly reflected the physical and emotional distress of the horse, which was restrained upside down during the episode. Currently, arterial catheterization (with anesthetic agent to reduce pain) is routine in human medicine (e.g., in cardiac catheterization laboratories) and is becoming more common in veterinary medicine. However, the lesson that physical or emotional distress can dramatically increase blood pressure is as relevant today as it was in Hales’ time.
In human medicine, systolic and diastolic arterial pressures can be measured quite accurately with a blood pressure cuff and stethoscope. Blood pressure cuffs are less frequently used on veterinary species, but the pulse is often palpated by placing the fingertips over a major artery, such as the femoral artery. Palpation of an artery allows the clinician to sense the pulse pressure on the basis of the magnitude of the pulsations felt in the artery. A low pulse pressure is referred to as a “thready,” or weak, pulse. A high pulse pressure may be called a “bounding,” or strong, pulse.
Pulse Pressure Increases When the Stroke Volume Increases, Heart Rate Decreases, Aortic Compliance Decreases, or Total Peripheral Resistance Increases
Because the arterial pulse is so frequently palpated in patients, it is important for the veterinary clinician to understand the factors that typically influence pulse pressure. First, an increase in stroke volume tends to increase pulse pressure. Because cardiac ejections create the arterial pulsations in the first place, it is not surprising that larger ejections create larger pulsations. Figure 22-9, A, depicts this effect and shows that an increase in stroke volume also increases mean arterial pressure. Mean pressure increases because an increased stroke volume increases cardiac output.
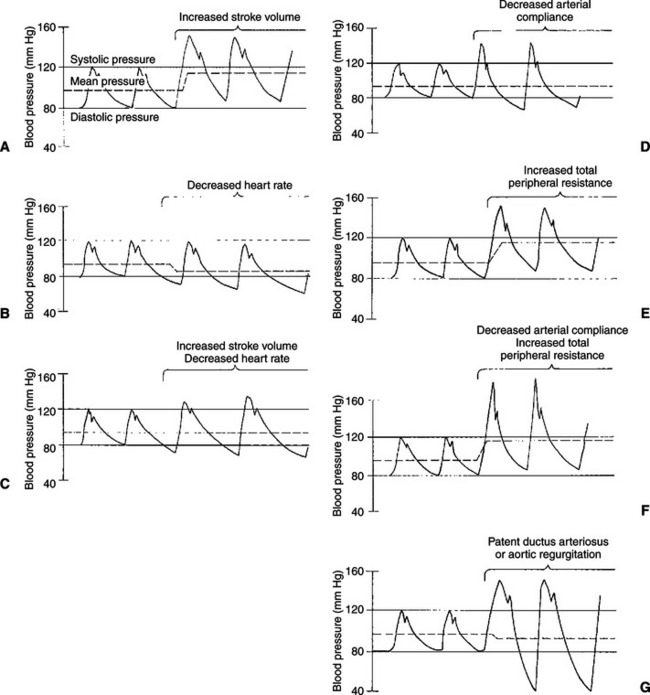
FIGURE 22-9 Various conditions that increase arterial pulse pressure are compared with regard to their effects on systolic pressure, diastolic pressure, and mean pressure (see text).
A second factor that tends to increase pulse pressure is a decrease in heart rate. Between cardiac ejections, blood continues to run out of the aorta and through the systemic circulation, and aortic pressure decreases. It falls to a minimal (diastolic) level before being boosted again by the next cardiac ejection. When heart rate decreases, there is a longer time between ejections and therefore a longer time for blood to run out of the aorta and into the systemic circulation. The blood pressure in the aorta falls to a lower level before the next cardiac ejection, and pulse pressure is increased (Figure 22-9, B). A decrease in heart rate decreases the mean arterial pressure because a decreased heart rate results in a decreased cardiac output.
Figure 22-9, C, shows the effect of a simultaneous increase in stroke volume and decrease in heart rate. In this example, cardiac output, which is stroke volume multiplied by heart rate, remains unchanged. Therefore, mean arterial pressure remains unchanged. However, pulse pressure is greatly increased as a result of the combined effects of an increase in stroke volume and a decrease in heart rate. Aerobic conditioning in humans, and in some animals, leads to increased stroke volume and decreased heart rate at rest. Therefore, in a well-trained athlete, mean arterial pressure is typically normal, but pulse pressure is greater than normal. Palpation of the arteries of an athlete at rest reveals a strong, slow pulse.
A decrease in arterial compliance (stiffening of the arteries) is a third factor that tends to increase pulse pressure (see Figure 22-9, D). With each ventricular systole, the heart ejects blood into the aorta and large arteries, which distends these vessels. If these vessels become stiff, a greater increase in pressure is required to distend them. Arterial stiffening also decreases diastolic arterial pressure. This effect is more difficult to grasp intuitively but should not be surprising. Just as aortic pressure rises to higher-than-normal levels when the heart ejects blood into a stiff aorta, so does aortic pressure fall to lower-than-normal levels when blood runs out of the stiff aorta between cardiac ejections. The higher systolic pressure and lower diastolic pressure are simply two direct consequences of the same phenomenon: decreased arterial compliance. The major arteries tend to become stiffer as a result of the normal aging process, which accounts for the increase in pulse pressure that is typical in older humans and some animals.
In general, cardiac output is not affected by arterial stiffening. A healthy ventricle is able to generate the higher systolic pressures needed to eject blood into a stiff arterial system, although ventricular hypertrophy is sometimes triggered. Moreover, arterial stiffening generally has very little effect on TPR because the arterioles remain normal. The arteries, although stiff, retain their large diameters and therefore low resistance. Mean arterial pressure, the product of cardiac output and TPR, is therefore generally unchanged by arterial stiffening.
Arteriolar vasoconstriction is a fourth factor that typically increases pulse pressure (Figure 22-9, E). In actuality, vasoconstriction does not affect pulse pressure directly but acts through a stiffening of the arteries. Vasoconstriction increases TPR, and blood backs up or accumulates in the large arteries. Mean arterial pressure increases, and the arteries become more distended than normal. Distention forces the arteries toward their elastic limit; they become stiffer than arteries under normal pressurization (Figure 22-10). This stiffening of the arteries causes pulse pressure to increase. Because TPR is elevated, mean arterial pressure also increases.
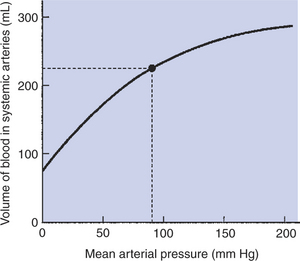
FIGURE 22-10 This volume-pressure graph shows that normal systemic arteries become stiffer (less compliant) when mean arterial pressure increases above its normal value (dot). (Recall that compliance is equal to the slope of a volume-pressure curve.)
Many human patients develop both stiffening of arteries (as a consequence of aging) and essential hypertension (caused by increased TPR). This combination produces dramatic increases in pulse pressure (Figure 22-9, F). An older person with severe hypertension might have a pulse pressure of 110 mm Hg (200 mm Hg systolic minus 90 mm Hg diastolic). Arterial hypertension and arterial stiffening both are less common in veterinary species.
In summary, pulse pressure tends to be increased by increased stroke volume, decreased heart rate, decreased arterial compliance, or vasoconstriction.
Some of the cardiac defects that produce murmurs also cause characteristic changes in a pulse pressure. For example, a patient with patent ductus arteriosus has a large left ventricular stroke volume, which elevates aortic systolic pressure. Aortic diastolic pressure is much lower than normal because, between cardiac ejections, blood runs out of the aorta by two pathways: into the systemic circuit and through the open ductus. Pulse pressure is dramatically increased. Aortic regurgitation causes a similar, characteristic increase in pulse pressure (Figure 22-9, G). During diastole, blood leaves the aorta through two pathways: forward into the systemic circuit and backward (through the incompetent valve) into the left ventricle. Stroke volume is elevated because, with each systole, the left ventricle ejects both the blood that has returned to it through the normal pathway and the regurgitant blood.
CLINICAL CORRELATIONS
Canine Heartworm Disease with Pulmonary Embolism
History.
You examine a 6-year-old male beagle that has been a hunting companion of his owner for several years. The owner reports that the dog tires more easily than usual and has developed a cough that is worse during exercise. You had treated this dog for a laceration when he was 3 years old, and your records indicate that the dog was otherwise in excellent health at that time. The owner acknowledges that the dog has not been given any immunizations or heartworm prophylactic medication for the past 2 years.
Clinical Examination.
On physical examination of the dog, you notice the cough reported by the owner and an apparent, modest accumulation of fluid in the abdominal cavity (ascites). You also note a systolic murmur that is heard the loudest over the left third and fourth intercostal spaces. The chest radiograph and electrocardiogram show evidence of right ventricular enlargement. In addition, the pulmonary vessels are more prominent than normal on the radiograph and are tortuous (twisted). You suspect canine heartworm disease. You obtain a blood sample, some of which you submit for an enzyme-linked immunosorbent assay (ELISA) to test for heartworm antigen. Additionally, you use a pipette to apply a sample of the buffy coat (from the centrifuge tube) onto a glass slide for microscopic examination. You see microfilaria of the type shed by adult canine heartworms (Dirofilaria immitis), and the ELISA is positive for the presence of D. immitis antigen. You diagnose canine heartworm parasitism.
Comment.
Mosquitoes transfer the microfilaria from the bloodstream of an infected dog to the bloodstream of a noninfected dog. The microfilaria develop into adult worms, which grow to a length of 10 to 20 cm while clinging to the walls of the pulmonary artery and its major branches. Heartworm infestation typically causes pulmonary arterial vessels to become enlarged and tortuous. In heavily infested dogs, adult worms also reside in the right ventricle and right ventricular outflow tract, where they cause pulmonic stenosis. The resulting turbulence during right ventricular ejection accounts for the murmur heard in this dog. The pulmonic stenosis and the increased pulmonary resistance created by the worms also lead to right ventricular hypertrophy, exercise intolerance, and ascites (review the Clinical Correlations in Chapter 21 for an explanation of why these complications develop). An additional problem is that the adult worms release vasoactive substances into the circulation, which disrupt some of the normal mechanisms that adjust arteriolar diameter, control blood flow, and regulate arterial pressure. Heavily infested dogs become very ill.
Treatment.
You advise the owner that the dog should be treated with an arsenic-containing medication that kills adult worms over several days. You also warn the owner that the treatment of severely infested dogs is risky. Dead adult worms break away from the right ventricle and pulmonary artery and lodge in smaller pulmonary vessels. These vascular occlusions (pulmonary emboli) restrict pulmonary blood flow and reduce cardiac output. Therefore, it is necessary to keep the dog in a quiet, unstressed state for 8 to 10 days after beginning treatment. In addition to restricting pulmonary blood flow, the emboli are likely to cause inflammation and blood clots in the lungs. Pulmonary edema is expected. Pulmonary blood vessels may break down, allowing blood to enter the airways of the lungs. Respiratory failure is possible. Antiinflammatory drugs are sometimes administered to reduce these complications.
With the owner’s consent, you keep the dog at your clinic for 2 days (to allow him to become accustomed to the surroundings) and then begin treatment. During the next week, the dog becomes even more lethargic than before and begins to cough up blood. The dog has a low-grade fever (102°-103° F), and his ascites becomes worse. However, his systolic murmur begins to fade. After 1 week, all the clinical signs have greatly improved. The dog is sent home for a prolonged period of recuperation. The long-term prognosis is good.
Dummy Foal: Hypoxemic Ischemic Encephalopathy
History.
A 14-year-old Thoroughbred mare is presented for dystocia (difficult birth). The foal (a filly) was pulled with some difficulty. The filly was slow to stand and did not nurse voluntarily for several hours. The mare was stripped (milked) of colostrum, which was fed to the foal by nasogastric tube.
Clinical Examination.
The foal has a slightly low temperature and increased pulse and respiratory rates. The mucous membranes are tacky to the touch (dehydrated) and dark pink in color (indicating poor perfusion and/or poor oxygenation). Capillary refill time is prolonged. The foal has a marked murmur similar to that heard with a patent ductus arteriosus. Peripheral pulses are decreased, and distal extremities are cool. Gastrointestinal motility is decreased. The foal appears mature physically, but she is acting dysmature when she attempts to stand, nurse, or lie down. Blood analysis reveals that the foal is not septic, but she is hypoxemic, has evidence of poor kidney function, and is acidotic.
Comment.
Hypoxemic ischemic encephalopathy (HIE) occurs when a foal receives decreased oxygen for some time. This can occur before, during, or after foaling. With a dystocia, after the water breaks and while the foal is being pulled, the oxygen supply to the foal is decreased. The foal must rely on anaerobic metabolism during the period of low oxygen, which results in acidosis. Decreased oxygen elevates pulmonary vascular resistance (hypoxic vasoconstriction). The resulting accumulation (backup) of blood in the pulmonary artery, right ventricle, and right atrium raises the pressures there. If pressures in the right side of the heart exceed those in the left side, blood flow persists (from right to left) through the foramen ovale. (When a normal foal begins to breathe, pressures in the right side fall below those in the left side of the heart, so the foramen ovale closes.) The blood that flows through the foramen ovale in this foal reaches the aorta without passing through the lungs, and therefore without being oxygenated at all (right-to-left shunt).
Treatment.
The foal needs oxygen to reverse the hypoxic pulmonary vasoconstriction and therefore the hypoxemia. This can be provided by nasal insufflation (tube placed in nasal cavity for delivery of oxygen). Additionally, the foal will be given drugs, such as dopamine, to increase cardiac contractility, cardiac output, and blood pressure. This treatment, in addition to intravenous fluids, will likely improve blood flow to the vital organs, including the brain and kidneys. Improved renal and respiratory function will reverse the acidosis. Foals with HIE often develop other complications, which need to be addressed as they arise.
Atkins C. Canine heartworm disease. Ettinger SJ, Feldman EC. Textbook of veterinary internal medicine: diseases of the dog and cat, ed 6, St Louis: Saunders, 2005.
Berne RM, Levy MN. Cardiovascular physiology, ed 8. St Louis: Mosby, 2001.
Boulpaep EL. Organization of the cardiovascular system. In: Boron WF, Boulpaep EL. Medical physiology: a cellular and molecular approach. Philadelphia: Saunders, 2005.
Boulpaep EL. Arteries and veins. In: Boron WF, Boulpaep EL. Medical physiology: a cellular and molecular approach. Philadelphia: Saunders, 2005.
Butler J. The circulation of the lung. Patton HD, Fuchs AF, Hille B, et al, eds. Textbook of physiology, vol 2. Philadelphia: Saunders, 1989.
Knottenbelt D, Holdstock N, Madigan JE. Equine neonatology: medicine and surgery. New York: Saunders, 2004.
Milnor WR. Cardiovascular physiology. New York: Oxford University Press, 1990.
Mohrman DE, Heller LJ. Cardiovascular physiology, ed 6. New York: Lange Medical Books/McGraw-Hill, 2006.
PRACTICE QUESTIONS
1. A change from breathing normal air (21% O2 and 0.04% CO2) to breathing a gas mixture of 10% O2 and 5% CO2 would cause pulmonary blood vessels to ______________ and pulmonary resistance to ______________.
2. If aortic compliance decreases while heart rate, cardiac output, and total peripheral resistance (TPR) remain unchanged:
3. Which of the following would cause mean aortic pressure to increase?
4. The following measurements are made on a dog: heart rate, 80beats/min; stroke volume, 30mL; mean aortic pressure, 96 mm Hg; mean pulmonary artery pressure, 30 mm Hg; left atrial pressure, 5 mm Hg; and right atrial pressure, 12 mm Hg. TPR (taking into account both arterial and atrial pressures) is exactly:
5. Which of the following would cause the largest decrease in coronary blood flow?