CHAPTER 3 Urodynamic procedures
INTRODUCTION
Symptomatic evaluation of urinary tract dysfunction is difficult since the bladder often proves to be an ‘unreliable witness’, not only because of subjective bias from both the patient and the clinician; but also because there is considerable overlap between the symptoms from different disorders. Urodynamic techniques are objective investigations developed to clarify these symptoms. The term urodynamics encompasses a variety of complementary techniques of varying complexity (Table 3.1).
Table 3.1 Urodynamic techniques.
| Urodynamic techniques | |
|---|---|
| Complexity of technique | Technique |
| Simple – voiding diary | |
| Simple – investigation | |
| Pressure/flow studies (Chapter 4) | |
| Complex – investigation | |
In this chapter the indications and methodology for these various techniques will be discussed along with introducing common clinical findings. The majority of invasive urodynamic investigations are pressure/flow studies and these will be discussed in detail in the next chapter (Chapter 4). More detailed discussion of common lower urinary tract disorders and associated urodynamic findings will occur in later chapters.
INDICATIONS FOR URODYNAMIC ASSESSMENTS
Only a good understanding of the various techniques including methodology, limitations and specific indications will allow the clinician to choose an appropriate test. In many cases a number of investigations may be necessary to answer all the clinical questions or further investigations may be required if the first investigation was unhelpful or presents a new avenue for investigation.
Before embarking on any urodynamic investigation the following should be considered:

STANDARDIZATION AND QUALITY CONTROL
All urodynamics should be performed in a standardized manner; this not only maintains the quality of the data, but also allows for comparison of the results if a patient has a repeat investigation. In addition a standardized technique and recording of the data using recognized terminology allows the accurate exchange and comparison of information for both clinical and experimental purposes. The official terminology suggested by the International Continence Society (ICS) is used throughout this book. However investigations must still be tailored for individual patients so that the clinical questions are answered thoroughly without undue time spent on obtaining clinically irrelevant data.
Maintaining the quality of any study also requires that all equipment is appropriately set up and regularly calibrated with sufficient working knowledge to ‘troubleshoot’ any problems encountered during an investigation.
In all cases precise measurement and complete documentation must be coupled with accurate analysis and critical reporting of the results. However, it must be borne in mind that whilst these are objective tests that can be standardized to a high degree, there remains a significant subjective element in the interpretation of the results. Urodynamics is not an exact science!
AIMS OF URODYNAMIC INVESTIGATIONS
The principal aim of any urodynamic assessment is to reproduce the symptoms whilst obtaining physiological measurements, so as to determine the pathophysiology underlying the symptoms.
Both the precise nature of the condition and the severity can be established, thus allowing the clinician to understand the clinical implications and plan further appropriate management.
In most cases the indications for urodynamic investigation are clear and its appropriate application is essential to the modern practice of urology, gynaecology, and any specialties dealing with the management of lower urinary tract dysfunction.
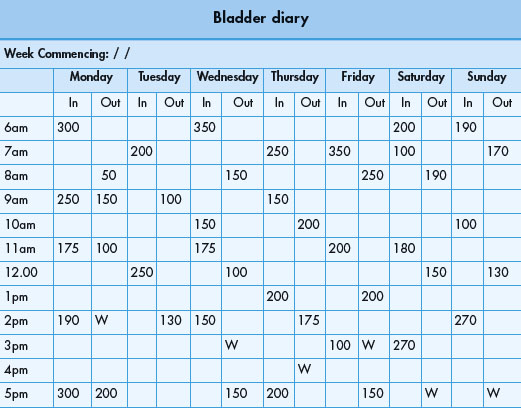
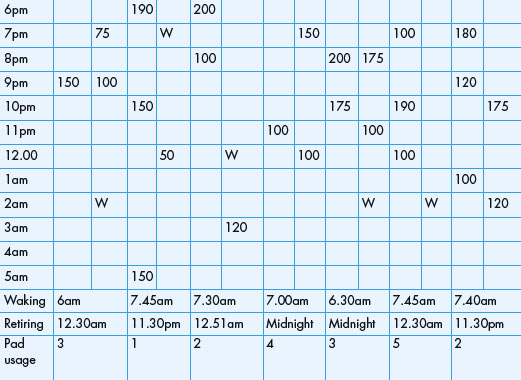
VOIDING DIARIES
Voiding diaries are the simplest of all urodynamic assessments, yet their value is often overlooked. They provide an important natural urodynamic record of bladder function.
Indications and aims
Voiding diaries are simple, non-invasive tools that are frequently part of the initial evaluation of patients complaining of LUTS, particularly those who have storage symptoms such as increased urinary frequency and incontinence.
They give an indication of the voiding pattern, the severity of symptoms and they add objectivity to the history. They may also give an indication of the impact on the patient’s life and may highlight ‘coping strategies’ that the patient has adopted to help manage their symptoms. Voiding diaries are also useful in identifying pathophysiology of renal origin such as abnormal production of urine related to the circadian rhythm.
A number of different diaries have been defined by the ICS:
Method and standardization
The patient is asked to record as accurately as possible the time of events such as voids and incontinent episodes on the chart and to measure the volume voided using a graduated container (jug). They are also asked to record the time they are awake and asleep. Patients must be instructed to continue their normal activities during the course of the assessment, so as to obtain an accurate representation of their normal lower urinary tract function. The ICS has recommended that voiding diaries are performed for at least 24 hours, although in practice a period of 3–7 days is usually chosen. Most patients find them acceptable for use over short periods.
Frequent findings
Voiding diaries must not be over-interpreted, but should be used in combination with other forms of urodynamic and urological assessment (Table 3.3).
Table 3.3 Urodynamic parameters measured by voiding diaries.
| Urodynamic parameters measured by voiding diaries | |
|---|---|
| Daytime frequency | Number of voids recorded in waking hours |
| Nocturia | Number of voids recorded during sleep hours with each void preceded and followed by sleep |
| 24-hour frequency | Total number of awake and sleep voids during a specified 24-hour period |
| 24-hour production | Total volume of urine voided during a specified 24-hour period |
| Polyuria | Voiding of more than 2.8 litres in 24 hours |
| Nocturnal urine volume | Total volume of urine voided during sleep hours, excluding the last void before sleeping but including the first void on waking |
| Nocturnal polyuria | When an increased proportion of the 24-hour production occurs at night, usually >33% (but age-dependent) |
| Maximum voided volume (replaces the term ‘functional volume’) | |
| Pad usage | Number of pads used during a specified period |
| Frequency of incontinence episodes | Number of incontinence episodes during a specified period |
| Frequency of urgency episodes | Number of urgency episodes during a specified period |
| Fluid intake | Volume of fluid ingested during a specified period |
Example of bladder retraining programme
In order to bring your bladder problem under control you must re-educate your bladder and learn to resist early false sensations of bladder fullness. Retraining (or ‘stretching’) your bladder will help to control leakage and you can do this by trying to hold on for as long as possible before passing water.
Remember:
You are trying to re-educate your bladder so that it will hold more urine. Although you may find this difficult at first, with practice it will get easier.
Bladder retraining
In addition to having diagnostic benefit, voiding diaries have therapeutic value and can provide important information that is helpful in treating bladder dysfunction. It is particularly useful for providing biofeedback during bladder retraining drills commonly used in patients with small volume frequency and urgency incontinence. They also often provide important feedback to the practitioner and patient so that they can objectively evaluate the effectiveness of any therapy.
Pad testing
Pad testing is a simple, non-invasive and objective method for detecting and quantifying urinary incontinence. It is easy to perform and interpret and provides a great deal of useful information.
Indications and aims
The principal aim is to determine the amount of urine leaked during a specified period, e.g. one hour, thus quantifying the severity of incontinence to both clinician and patient, as frequently the degree of incontinence is unclear from the history. In addition, the test is particularly useful to confirm the presence of incontinence when other tests, e.g. pressure/flow urodynamics, have failed to demonstrate any urinary leakage.
Method and standardization
To obtain a representative result, especially for those who have variable or intermittent urinary incontinence, the test period should be as long as possible in circumstances that approximate to those of everyday life; yet it must be practical. The pad test should be conducted in a standardized fashion and the ICS have provided guidelines on performing a ‘1-hour pad test’.
URODYNAMICS IN PRACTICE: 1-HOUR PAD TEST
The International Continence Society has suggested the following guidelines:
Typical test schedule
Practical points
Urodynamic parameters measured by pad testing
Pad testing determines the volume of leakage during a specified period. One gram is equal to one millilitre, therefore an increase in weight of the collection device (pad) by for example 10 g is equal to urinary incontinence of 10 ml.
Normal values
The hourly pad weight increase in continent women varies from 0.0 to 2.1 g/hour, averaging 0.26 g/hour. With the 1-hour International Continence Society pad test, the upper limit (99% confidence limit) has been found to be 1.4 g/hour.
URODYNAMICS IN PRACTICE: VARIATIONS TO THE PAD TEST
UROFLOWMETRY
This is the simplest and often most useful investigation in the assessment of patients with predominantly voiding symptoms.
Indications and aims
This is a non-invasive and inexpensive test that gives a great deal of information regarding voiding function by measuring the rate of flow of voided urine.
Uroflowmetry is an adequate investigation for uncomplicated BOO in over 60% of patients. More detailed investigations are only indicated in limited situations, such as when the findings are at variance with the symptoms, if there are significant storage symptoms or if initial treatment has been unsuccessful.
Method and standardization
Uroflowmetry is performed using a flowmeter, a device that measures the quantity of fluid (volume or mass) voided per unit time (Figure 3.1). The measurement is expressed in millilitres per second (ml/s). Patients are instructed to void normally, either sitting or standing, with a comfortably full bladder and should be provided with as much privacy as possible and comfortable surroundings, so as to remove the inhibitory effects of the test environment. Uroflowmetry can be carried out either by itself or in combination with other techniques such as the measurement of post-void residual (PVR) urine. The patient should be asked if the void was representative of their usual voiding. (It is important that the flowmeter is regularly calibrated as per the manufacturer’s instructions to maintain the accuracy of the readings.)
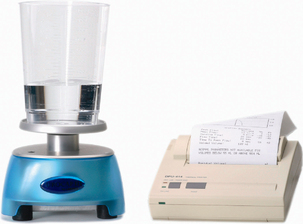
Figure 3.1 Flowmeter. Photograph of a typical flowmeter which is usually placed below a large funnel for the patient to void into. The funnel is normally placed under a commode for females; men can void directly into the funnel whilst standing. Photograph also shows results printersterm.
URODYNAMICS IN PRACTICE: TYPES OF FLOWMETER
Normal values
Males under 40 years of age generally have maximum flow rates over 25 ml/s. Flow rates decrease with age and men over 60 years of age with no bladder outlet obstruction usually have maximum flow rates over 15 ml/s.
Females have higher flow rates than males, usually of the order of 5–10 ml/s more for a given bladder volume. Exaggerated maximum flow rates are typical in women who have stress incontinence, where the outlet resistance is minimal and also in patients who have marked detrusor overactivity – the so-called ‘fast bladder’.
Interpretation
Uroflowmetry is invaluable in the assessment of voiding function for a wide range of urological conditions. Reliance should be placed on the observed flow pattern as well as any absolute values obtained (Figures 3.2 and 3.3). The results must always be interpreted within the context of the clinical situation, recognizing the limitations of the study.
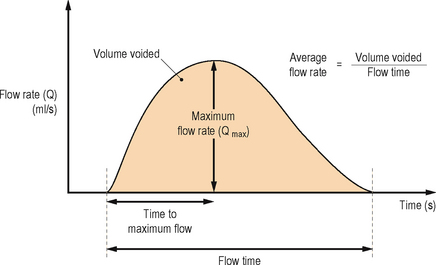
Figure 3.2 Flow rate recording. Illustrating the International Continence Society nomenclature.
(Reproduced with permission from Neurourology and Urodynamics 1988; 7:403–426.)
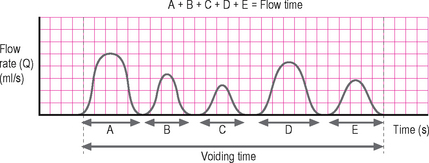
Figure 3.3 Intermittent void. Showing the relationship between flow time and voiding time in an intermittent voiding pattern.
The measured flow rate is dependent upon a number of factors including:
The flow rate and pattern give important clues as to the underlying dysfunction, however the major limitation of uroflowmetry is that the flow rate is a composite of both the function of the detrusor and the function of the bladder outlet/urethra. It is therefore impossible to determine from a flow rate alone if voiding dysfunction is due to a detrusor pathology or bladder outlet/urethral pathology or from a combination of problems; only pressure/flow urodynamics can differentiate between such conditions. For example, prolonged flow time with an abnormally low Qmax may be due to bladder outlet/urethral obstruction or a poorly contractile detrusor muscle (detrusor underactivity). However, a number of characteristic uroflowmetry patterns have been described, and whilst these may not be specific, in the majority of patients they give an acceptable indication of the most likely pathology and allow empirical therapy to be instigated (Table 3.4).
Table 3.4 Urodynamic parameters measured by uroflowmetry.
| Urodynamic parameters measured by uroflowmetry | ||
|---|---|---|
| Parameter | Definition | Notes |
| Voided volume | Total volume expelled via the urethra | |
| Maximum flow rate (Qmax) | Maximum measured flow rate | The flow curve should be assessed visually and the Qmax must not be taken at the peak of an artefact but at the peak of the line of best fit for the curve |
| Average flow rate | Voided volume divided by flow time | Calculation of average flow rate is only meaningful if flow is continuous and without terminal dribbling |
| Flow time | Time over which measurable flow actually occurs (i.e. excluding interruptions) | The flow pattern must be described when flow time and average flow rate are measured |
| Voiding time | Total duration of micturition (i.e. including interruptions) | When voiding is completed without interruption, voiding time is equal to flow time |
| Time to maximum flow | Elapsed time from onset of flow to maximum flow rate | |
Characteristic flow patterns
Normal
An easily distensible bladder outlet with a normal detrusor contraction results in a smooth bell-shaped curve with a rapid rise to a high amplitude peak (Qmax). The time to Qmax should not exceed one-third of the flow time. Any other patterns (flat, multiple peaks, asymmetric, prolonged) indicate abnormal voiding (Figure 3.4a).
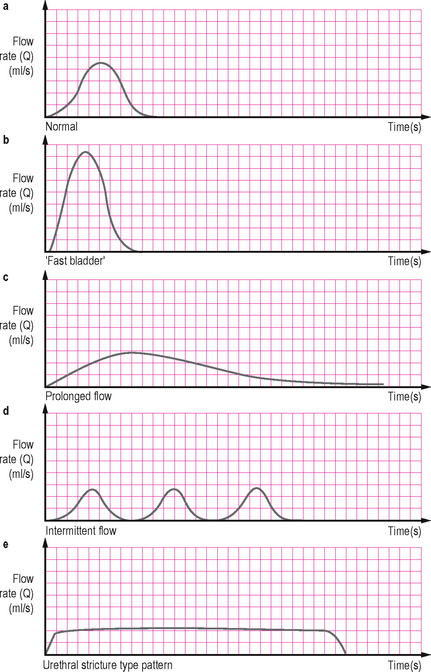
Figure 3.4 Characteristic flow patterns. (a) Normal – there is rapid change before and after the peak flow. (b) ‘Fast bladder’ – an exaggeration of normal associated with high pre-micturition pressure and seen in cases of detrusor overactivity. (c) Prolonged flow – associated with outflow obstruction. (d) Intermittent flow – resulting from abdominal straining to compensate for poor detrusor contractility; a similar picture may be seen with urethral overactivity (detrusor sphincter dyssynergia or dysfunctional voiding). (e) Classical pattern of a urethral stricture with a long plateau.
‘Fast bladder’
This is an exaggeration of the normal curve and may be due to a raised end fill bladder pressure associated with detrusor overactivity or may be due to a significant decrease in outflow resistance as can occur with stress urinary incontinence (Figure 3.4b).
Prolonged flow
This is a flow with a prolonged time to reach a low maximum amplitude and an extended flow time; often it is an asymmetric curve with a prolonged declining terminal end. This is frequently seen with bladder outlet obstruction (BOO), although a similar pattern may be seen with a poorly contractile detrusor muscle (Figure 3.4c).
Intermittent flow
This irregular spiking pattern is frequently due to abdominal straining to overcome the poor flow associated with BOO or a poorly contractile detrusor, although more complex outlet conditions such as sporadic sphincter activity may also cause an intermittent pattern (Figure 3.4d).
Flat plateau
A low maximum flow rate which plateaus for a prolonged time in a ‘box-like’ fashion is characteristic of a constrictive obstruction from a urethral stricture. A urethral stricture in the presence of a normally functioning bladder usually does not cause voiding symptoms until the urethral calibre is reduced below 11 F (Figure 3.4e).
To provide more detailed information a simple flow rate can be combined with a measurement of the post-voiding residual (PVR) volume. If there is doubt about the diagnosis after uroflowmetry, more complex urodynamic (usually pressure/flow) studies may be required. For instance, it may be ill-advised to perform a prostatectomy in men with lower urinary tract symptoms (LUTS) who have a normal flow pattern, a ‘fast bladder’, or very intermittent flow and a high PVR, without first performing pressure/flow urodynamics.
Practical points
There are a number of important factors to consider when interpreting flow rates including:
Note: normal flow rate does not rule out bladder outlet obstruction (BOO)
Frequently uroflowmetry is performed to detect the presence and severity of BOO. However, particularly in the early stages of obstruction there may be a compensatory increase in the voiding pressure generated by the detrusor muscle, thus overcoming the obstruction. Uroflowmetry may therefore be normal in the presence of BOO. Pressure/flow urodynamics can detect the BOO in such a situation. This high pressure, normal flow voiding (>15 ml/s) occurs in approximately 7–15% of patients with bladder outflow obstruction.
A Qmax of <12 mL/s is generally considered abnormal in men >60 years; data suggest that approximately 90% of men with LUTS and a Qmax <10 mL/s are obstructed on pressure/flow studies.
Artefacts
The maximum flow rate recorded by the uroflowmetry machine is frequently misleading. Common artefacts are shown in Figure 3.5 and include:
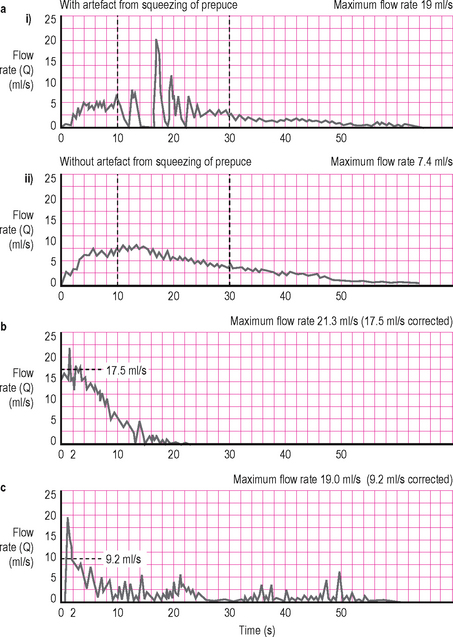
Figure 3.5 Artefacts. (a) The artefact (a spurious maximum flow rate of 19 ml/s) results from squeezing the prepuce of the penis during voiding. (b) It is eliminated revealing a true maximum flow rate of 7.4 ml/s when the patient stops squeezing the penis. (c and d) Both these flow curves show artefactual spikes, but an experienced urologist has corrected the traces (dotted line) so that the true maximum flow rates are 17.5 and 9.2 ml/s, as shown. Frequently an artefactual spike occurs at the start of the recorded flow due to the initial flow of urine registering on the flowmeter; or during the flow pattern due to abdominal straining.
Due to the kinetics of smooth muscle contraction the detrusor is unable to generate short lived changes in amplitude (spikes). Therefore these artefacts need to be removed by the clinician by examining the pattern and ‘smoothing’ the curve with a line of best fit to determine the actual Qmax. It is incorrect to blindly assume that the electronically reported Qmax is accurate.
It must also be remembered that any alteration in the urinary stream after the urine leaves the meatus may alter the flow and introduce artefacts. The funnel/collecting device will invariably cause such modifications. There is also a lag in the flowmeter registering the flow from when the urine left the meatus; this is unimportant in free flow uroflowmetry but is a consideration when uroflowmetry is combined with pressure/flow urodynamics (see Chapter 4).
The pattern of the flow is also altered by the speed of the recording and the ICS have recommended that:
POST-VOID RESIDUAL (PVR) DETERMINATION
Frequently uroflowmetry is combined with simple post-void residual (PVR) estimation using a handheld ultrasonic ‘bladder scanner’ to estimate the completeness of bladder emptying. When more information on bladder anatomy and function is needed an ultrasound cystodynamogram can be performed (see next section).
An elevated post-void residual (PVR) may represent obstruction; or more commonly is a surrogate marker for detrusor failure which may be due to a number of causes, including chronic BOO, neurogenic bladder or myogenic failure. An elevated PVR is an indication for pressure/flow urodynamics.
There are a number of clinical implications of an elevated PVR:
ULTRASOUND CYSTODYNAMOGRAM
The ultrasound cystodynamogram (USCD) combines ultrasound examination of the bladder with uroflowmetry to provide more detailed information on bladder structure and function than uroflowmetry alone.
Indications and aims
Additional information obtained during an USCD includes the structure of the bladder (shape, presence of diverticulia), distal ureteric anatomy (presence of hydroureteronephrosis), completeness of bladder emptying and the prostate size (Figure 3.6).
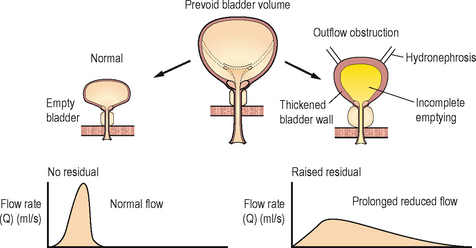
Figure 3.6 Ultrasound cystodynamogram. The additional ultrasonic data, on the right showing incomplete emptying, thickened bladder wall and bilateral hydronephrosis associated with chronic poor voiding.
An USCD is of particular value for assessing patients who may have a raised PVR (e.g. patients with suspected outflow obstruction, a poorly functioning detrusor or if there is suspected compromised voiding after a repair procedure for stress incontinence).
The addition of ultrasound assessment is easy, requiring little specialized equipment and is non-invasive with no ionizing radiation, yet it provides a more thorough assessment of the lower urinary tract.
Method and standardization
Ensure that the patient has a subjectively full bladder before carrying out the study to provide a representative result.
URODYNAMICS IN PRACTICE: ULTRASOUND CYSTODYNAMOGRAM
INTRAVENOUS URODYNAMOGRAM
The intravenous urodynamogram (IVUD) combines a conventional intravenous urogram (IVU) with uroflowmetry thus providing markedly more information than either investigation alone.
Indications and aims
This test is of value in patients who are to undergo imaging of the upper urinary tracts using an IVU. The addition of uroflowmetry also provides a comprehensive assessment of the lower urinary tract including an estimation of the pre-void bladder volume and the post-void residual (PVR). It is of particular value because it can be easily integrated into the routine of the radiology department and involves little additional equipment or staff training.
Method and standardization
Ensure that the patient has a subjectively full bladder before carrying out the study, to provide a representative result.
URETHRAL PRESSURE MEASUREMENT
Originally urethral pressure measurement and in particular urethral pressure profilometry (UPP) enjoyed a disproportionate amount of attention. However the techniques for the investigation of urethral sphincteric function are far from satisfactory and their clinical utility has been questioned; therefore, most experts consider them as research tools and not suitable for widespread clinical usage.
New developments in technology such as air charged technology with true circumferential recording and ease of recording are leading to a resurgence of interest in urethral pressure measurements and may lead to an increasing understanding of the clinical utility of these tests and the clinical significance of the results. However, at present it must be concluded that these techniques remain research tools and the various techniques need to be standardized before urethral pressure measurements can be recommended in routine practice.
The main concerns with urethral pressure measurements are:
A detailed discussion of the various techniques is therefore outside the scope of this book; however a summary of the techniques is provided below.
Methods
Point pressure measurement
The intraluminal pressure within the urethra may be measured at a single point over a period of time:
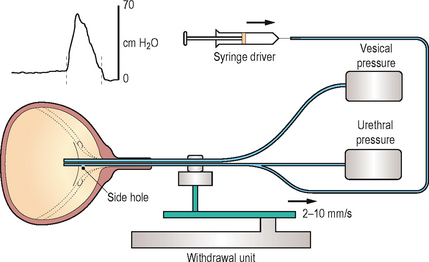
Urethral pressure profilometry
The intraluminal pressure can also be measured along the length of the entire urethra to produce a urethral pressure profile (UPP). This is performed by withdrawing the measuring catheter mechanically at a constant speed (Figure 3.7). The resulting profile indicates the pressures within the urethra from the bladder neck to the meatus. Several techniques have been described including:
Fluid bridge test
A related but different test of bladder neck competence has been described. The test can detect the entry of fluid into the proximal urethra because a continuity of fluid (fluid bridge) between the bladder and urethra occurs in such a situation. The pressure transmission is measured down the infusion channel of a standard Brown–Wickham perfusion catheter (see below) but with the perfusion switched off.
URODYNAMICS IN PRACTICE – URETHRAL PRESSURE MEASUREMENT TECHNIQUES
Perfusion method
Catheter-mounted (microtip) transducers
Air charged technology (see Chapter 4)
Practical points
When measuring the urethral pressures all systems should be zeroed to atmospheric pressure; the reference point should be taken as the superior edge of the symphysis pubis for external transducers or the transducer itself for catheter-mounted transducers. Intra-vesical pressure should be simultaneously measured to exclude a detrusor contraction and subtraction of the intra-vesical pressure from the urethral pressure produces the urethral closure pressure profile.
The following information is essential when reporting and interpreting the results of urethral pressure studies:
Urodynamic parameters measured by urethral profilometry
TERMINOLOGY: URETHRAL PRESSURE PROFILES (Figure 3.8)
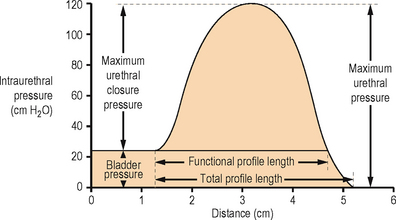
Figure 3.8 Diagram of a female urethral pressure profile in storage phase with the nomenclature recommended by the International Continence Society.
(Reproduced with permission from Neurourology and Urodynamics 1988; 7:403–426.)

Figure 3.9 Pressure ‘transmission’ ratio. (a) Urethral pressure profiles in a normal female at rest (on the left) and while coughing (on the right). During coughing there is transmission of intra-abdominal pressure (represented by the bladder trace) to the urethra in all except the distal portion of the profile. (b) Urethral pressure profiles in a patient who has urodynamic stress incontinence at rest (on the left) and while coughing (on the right). At rest the bladder pressure trace is flattened compared with normal and during coughing there is a lack of the normal transmission of intra-abdominal pressure to the urethra, resulting in negative deflections in the urethral closure pressure trace. This abnormal response results from a prolapse of the urethra within a cystourethrocoele.
(Reproduced from Abrams P, Feneley R, and Torrens M, Urodynamics. Berlin: Springer; 1983.)
NEUROPHYSIOLOGICAL INVESTIGATION
As with urethral pressure measurements, neurophysiological urodynamic investigations have failed to achieve widespread clinical usage. Neurophysiological testing allows the researcher to develop a greater understanding of lower urinary tract function but it is uncertain what added value they provide to a clinician. A particular concern is that these tests tend to only be abnormal in the presence of a clinically detectable neurological condition; therefore there is very little additional new information provided by such testing that cannot be obtained by conventional pressure/flow urodynamics and a thorough neurological assessment.
Methods
A number of different neurophysiological methods have been described including:
UPPER URINARY TRACT URODYNAMICS
The upper urinary tract is a highly distensible system that is normally protected from the intermittent high pressure generated by the bladder by the competent vesico-ureteric junctions.
The following occurs in the upper tracts under normal circumstances:
The normal response of the upper urinary tract to obstruction at or above the vesico-ureteric junction is to increase the rate of ureteric and pelvic peristalsis; however if the obstruction remains unresolved, ureteric dilatation may occur.
Ureteric dilatation causes uncoordinated peristalsis and inefficient urine transport. As flow is reduced down the ureter, pressure rises are transmitted:
If there is no parallel increase in the glomerular hydrostatic pressure, filtration will eventually decrease and renal function will become impaired.
The Whitaker test
The Whitaker test is an upper tract urodynamic study combined with antegrade pyelography (Figure 3.11). The principal indication for the investigation is to determine if upper urinary tract obstruction exists, as a dilated upper tract neither confirms nor excludes obstruction.
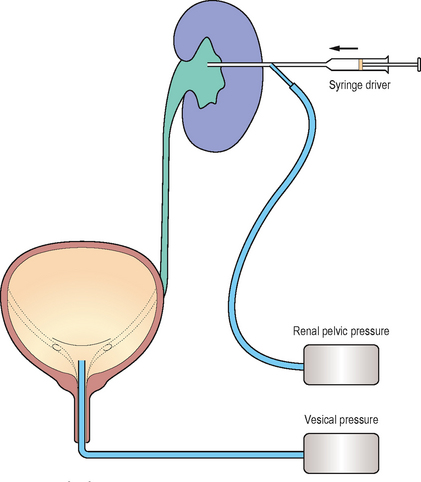
The principle of the test is to perfuse the upper tract with a constant flow of contrast in an antegrade manner whilst simultaneously measuring renal pelvic and intra-vesical pressures. The test will differentiate patients with continuing obstruction from those with upper tract dilation secondary to permanent alterations in the musculature/tissues of the upper tract. It may also be of utility in evaluating patients with questionable uretero-pelvic or vesico-ureteric junction obstruction or those with primary defects of the ureteric musculature (e.g. prune-belly syndrome).
Urodynamics in practice: The Whitaker test
Practical points
Upper urinary tract urodynamics is an invasive procedure because a percutaneous nephrostomy tract is required and so it should be reserved for cases where other investigations such as excretory urography and isotope renography have produced equivocal results. The main value of the Whitaker test is in providing an accurate objective assessment of obstruction to renal drainage. Significant rises in pressure are indicative of obstruction whereas free drainage of contrast at low pressure excludes obstruction.
Using this technique a pressure difference between the upper and lower urinary tract of:
An additional indication is in patients with urinary diversion (e.g. an ileal loop). Loin pain can occur because of the high pressures generated by bowel peristalsis causing reflux up the re-implanted ureters; the extent of this can be easily assessed by upper urinary tract urodynamics.