2 Normal gait
In order to understand pathological gait, it is necessary first to understand normal gait, since this provides the standard against which the gait of a patient can be judged. However, there are two pitfalls which need to be borne in mind when using this approach. Firstly, the term ‘normal’ covers both sexes, a wide range of ages and an even wider range of extremes of body geometry, so that an appropriate ‘normal’ standard needs to be chosen for the individual who is being studied. If results from an elderly female patient are compared with normal data obtained from physically fit young men, there will undoubtedly be large differences, whereas comparison with data from healthy elderly women may show the patient's gait to be well within normal limits which are appropriate to her sex and age. The second pitfall is that even though a patient's gait differs in some way from normal, it does not follow that this is in any way undesirable or that efforts should be made to turn it into a ‘normal’ gait. Many gait abnormalities are a compensation for some problem experienced by the patient and, although abnormal, they are nonetheless useful.
Having said all that, it is very important to understand normal gait and the terminology which is used to describe it, before going on to look at pathological gait. The chapter starts with a very brief historical review and then gives an overview of the gait cycle, before going on to study in detail how the different parts of the locomotor system are used in walking.
Walking and gait
As walking is such a familiar activity, it is difficult to define it without sounding pompous. However, it would be remiss not to attempt a definition. Normal human walking and running can be defined as ‘a method of locomotion involving the use of the two legs, alternately, to provide both support and propulsion’. In order to exclude running, we must add ‘at least one foot being in contact with the ground at all times’. Unfortunately, this definition excludes some forms of pathological gait which are generally regarded as being forms of walking, such as the ‘three-point step-through gait’ (see Fig. 3.21), in which there is an alternate use of two crutches and either one or two legs. It is probably both unreasonable and pointless to attempt a definition of walking which will apply to all cases – at least in a single sentence!
Gait is no easier to define than walking, many dictionaries regarding it as a word primarily for use in connection with horses! This is understandable, since quadruped animals have a repertoire of natural gaits (walking, trotting, cantering, galloping, etc.), as well as some artificial ones, such as that learned by ‘Tennessee Walking Horses’ in the area where one of the authors lives. Most people tend to use the words gait and walking interchangeably. However, there is a difference: the word gait describes ‘the manner or style of walking’, rather than the walking process itself. It thus makes more sense to talk about a difference in gait between two individuals than about a difference in walking.
History
The history of gait analysis has shown a steady progression from early descriptive studies, through increasingly sophisticated methods of measurement, to mathematical analysis and mathematical modelling. Only a brief account of the development of the discipline will be given here. Good reviews of the early years of gait analysis have been given by Garrison (1929), Bresler and Frankel (1950) and Steindler (1953). The more recent history of gait analysis, and of clinical gait analysis in particular, was covered in three excellent review papers by Sutherland (2001, 2002, 2005).
Descriptive studies
Walking has undoubtedly been observed ever since the time of the first men, but the systematic study of gait appears to date from the Renaissance when Leonardo da Vinci, Galileo and Newton all gave useful descriptions of walking. The earliest account using a truly scientific approach was in the classic De Motu Animalum, published in 1682 by Borelli, who worked in Italy and was a student of Galileo. Borelli measured the centre of gravity of the body and described how balance is maintained in walking by constant forward movement of the supporting area provided by the feet. The Weber brothers in Germany gave the first clear description of the gait cycle in 1836. They made accurate measurements of the timing of gait and of the pendulum-like swinging of the leg of a cadaver.
Kinematics
Two pioneers of kinematic measurement worked on opposite sides of the Atlantic in the 1870s. Marey, working in Paris, published a study of human limb movements in 1873. He made multiple photographic exposures, on a single plate, of a subject who was dressed in black, except for brightly illuminated stripes on the limbs. He also investigated the path of the centre of gravity of the body and the pressure beneath the foot. Eadweard Muybridge (born in England as Edward Muggeridge) became famous in California in 1878 by demonstrating that, when a horse is trotting, there are times when it has all four of its feet off the ground at once. The measurements were made using 24 cameras, triggered in quick succession as the horse ran into thin wires stretched across the track. In the next few years, Muybridge made a further series of studies, of naked human beings walking, running and performing a surprising variety of other activities!
The most serious application of the science of mechanics to human gait during the nineteenth century was the publication in Germany, in 1895, of Der Gang des Menschen, by Braune and Fischer. They employed a technique similar to Marey's, but using fluorescent strip-lights on the limbs instead of white stripes. The resulting photographs were used to determine the three-dimensional trajectories, velocities and accelerations of the body segments. Knowing the masses and accelerations of the body segments, they were then able to estimate the forces involved at all stages during the walking cycle.
Further valuable work on the dynamics of locomotion was done by Bernstein in Moscow in the 1930s. He developed a variety of photographic techniques for kinematic measurement and studied over 150 subjects. Particular attention was paid to the centre of gravity of the individual limb segments and of the body as a whole.
Force platforms
Further progress followed the development of the force platform (also called the forceplate). This instrument has contributed greatly to the scientific study of gait and is now standard equipment in gait laboratories. It measures the direction and magnitude of the ground reaction force beneath the foot. An early design was described by Amar in 1924 and an improved one by Elftman in 1938. Both were purely mechanical, the force applied to the platform causing the movement of a pointer. In Elftman's design the pointers were photographed by a high-speed movie camera.
Muscle activity
For a full understanding of normal gait, it is necessary to know which muscles are active during the different parts of the gait cycle. The role of the muscles was studied by Scherb, in Switzerland, during the 1940s, initially by palpating the muscles as his subject walked on a treadmill, then later by the use of electromyography (EMG). Further advances in the understanding of muscle activity and many other aspects of normal gait were made during the 1940s and 1950s by a very active group working in the University of California at San Francisco and Berkeley, notable among whom was Verne Inman. This group later went on to write Human Walking (Inman et al., 1981), published just after Inman's death, which to many people is the definitive textbook on normal gait. This has now gone through several editions, the latest edition of this being Rose and Gamble (2005). Another classic text on EMG is Muscles Alive: Their Functions Revealed by Electromyography by John Basmajian, which unfortunately has not been updated since 1985.
The use of EMG in gait analysis has received much attention but perhaps the most influential paper published was ‘The use of surface electromyography in biomechanics’ by Carlo De Luca in 1997, which gave a summary of recommendations but perhaps more importantly a summary of problems which at the time needed resolution. Further standardisation was achieved through the SENIAM (Surface ElectroMyoGraphy for the Non-Invasive Assessment of Muscles) project coordinated and managed by Hermie Hermens and Bart Freriks from Enschede, which is now considered by many as the definitive recommendations for electrode configuration and sensor positioning on specific muscles.
Mechanical analysis
A major contribution to the mechanical analysis of walking, also from the Californian group, was made by Bresler and Frankel (1950). They performed free-body calculations for the hip, knee and ankle joints, allowing for ground reaction forces, the effects of gravity on the limb segments and the inertial forces. The analytical techniques developed by these workers formed the basis of many current methods of modelling and analysis.
An important paper describing the possible mechanisms which the body uses to minimise energy consumption in walking, again from California, was published by Saunders et al. (1953). Further important work on energy consumption and in particular the energy transfers between the body segments in walking, was published by Cavagna and Margaria (1966), working in Italy. By 1960, research began to concentrate on the variability of walking, the development of gait in children and the deterioration of gait in old age. Patricia Murray, working in Milwaukee, Wisconsin, published a series of papers on these subjects, including a detailed review (Murray, 1967).
Mathematical modelling
Once the motions of the body segments and the actions of the different muscles had been examined and documented, attention passed to the forces generated across the joints. Although limited calculations of this type had been made previously, the study by Paul (1965) was the first detailed analysis of hip joint forces during walking. A subsequent paper by the same author also included an analysis of the forces in the knee (Paul, 1966). Since then there have been many mathematical studies of force generation and transmission across the hip, knee and ankle.
The 1970s and 1980s saw great improvements in methods of measurement. The development of more convenient kinematic systems, based on electronics rather than photography, meant that results could be produced in minutes rather than days. Reliable force platforms with a high-frequency response became available, as well as convenient and reliable EMG systems. The availability of high-quality three-dimensional data on the kinetics and kinematics of walking, and the ease of access to powerful computers, made it possible to develop increasingly sophisticated mathematical models. Gait laboratories now routinely measure joint moments and powers for the hip, knee and ankle. Somewhat less reliably, estimates can also be made of muscle, ligament and joint contact forces.
The 1990s and 2000s have seen the emergence of increasingly powerful systems, higher speed cameras, greater portability, smaller markers and a wide variety of marker sets, and larger volumes of area that data can be attained from.
Clinical application
From the earliest days, it has been the hope of most of those working in this field that gait measurements would be found useful in the management of patients with walking disorders. Many of the early workers made studies of people who walked with abnormal gait patterns and some (notably Amar, Scherb and the Californian group) attempted to use the results for the benefit of individual patients. However, the results were not particularly impressive.
Since 1960, there has been a more serious attempt to take gait analysis out of the research laboratory and into the clinic. With the improvements in measurement and analytical techniques, the major limitation now is not the ability to produce high-quality data but knowing how best to use these data for the benefit of patients. It is fair to say that in the early days, far more progress was made in scientific gait analysis, particularly as applied to normal subjects, than in the application of these techniques for the benefit of those with gait disorders. However, since about 1980, there has been a steady increase in the effective use of gait analysis in the clinical management of patients.
As well as a gradual increase in the clinical use of scientific gait analysis, there has also been a growing interest in the use of observational or visual gait analysis. This has become much easier to perform since digital video cameras have become widely available, which is reviewed in more detail by Sutherland (2001, 2002, 2005).
Terminology used in gait analysis
The gait cycle is defined as the time interval between two successive occurrences of one of the repetitive events of walking. Although any event could be chosen to define the gait cycle, it is generally convenient to use the instant at which one foot contacts the ground (‘initial contact’). If it is decided to start with initial contact of the right foot, as shown in Figure 2.1, then the cycle will continue until the right foot contacts the ground again. The left foot, of course, goes through exactly the same series of events as the right, but displaced in time by half a cycle.
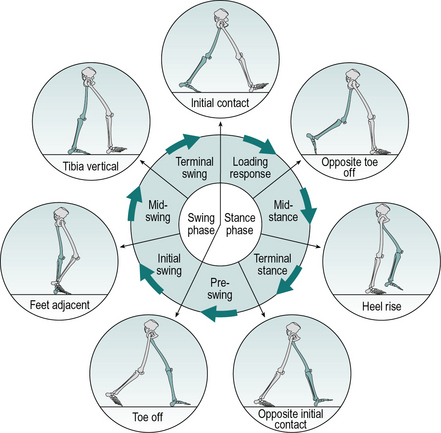
The following terms are used to identify major events during the gait cycle:
These seven events subdivide the gait cycle into seven periods, four of which occur in the stance phase, when the foot is on the ground, and three in the swing phase, when the foot is moving forward through the air (Fig. 2.1). The stance phase, which is also called the ‘support phase’ or ‘contact phase’, lasts from initial contact to toe off. It is subdivided into:
The swing phase lasts from toe off to the next initial contact. It is subdivided into:
The duration of a complete gait cycle is known as the cycle time, which is divided into stance time and swing time. Unfortunately, the nomenclature used to describe the gait cycle varies considerably from one publication to another. The present text attempts to use terms which will be understood by most people working in the field; alternative terminology will be given where appropriate. Wall et al. (1987) pointed out that the usual terminology is inadequate to describe some severely pathological gaits.
Gait cycle timing
Figure 2.2 shows the timings of initial contact and toe off for both feet during a little more than one gait cycle. Right initial contact occurs while the left foot is still on the ground and there is a period of double support (also known as ‘double limb stance’) between initial contact on the right and toe off on the left. During the swing phase on the left side, only the right foot is on the ground, giving a period of right single support (or ‘single limb stance’), which ends with initial contact by the left foot. There is then another period of double support, until toe off on the right side. Left single support corresponds to the right swing phase and the cycle ends with the next initial contact on the right.
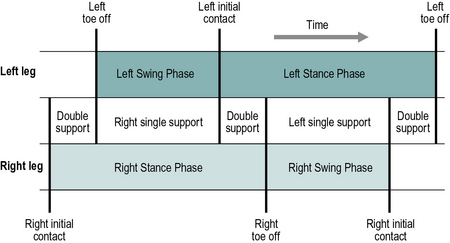
Fig. 2.2 • Timing of single and double support during a little more than one gait cycle, starting with right initial contact.
In each double support phase, one foot is forward, having just landed on the ground, and the other one is backward, being just about to leave the ground. When it is necessary to distinguish between the two legs in the double support phase, the leg in front is usually known as the ‘leading’ leg and the leg behind as the ‘trailing’ leg. The leading leg is in ‘loading response’, sometimes referred to as ‘braking double support’, ‘initial double support’ or ‘weight acceptance’. The trailing leg is in ‘pre-swing’, also known as ‘second’, ‘terminal’ or ‘thrusting’ double support or ‘weight release’.
In each gait cycle, there are thus two periods of double support and two periods of single support. The stance phase usually lasts about 60% of the cycle, the swing phase about 40% and each period of double support about 10%. However, this varies with the speed of walking, the swing phase becoming proportionately longer and the stance phase and double support phases shorter, as the speed increases (Murray, 1967). The final disappearance of the double support phase marks the transition from walking to running. Between successive steps in running there is a flight phase, also known as the ‘float’, ‘double-float’ or ‘non-support’ phase, when neither foot is on the ground. A detailed study of gait cycle timing was published by Blanc et al. (1999).
Foot placement
The terms used to describe the placement of the feet on the ground are shown in Figure 2.3. The stride length is the distance between two successive placements of the same foot. It consists of two step lengths, left and right, each of which is the distance by which the named foot moves forward in front of the other one. In pathological gait, it is common for the two step lengths to be different. If the left foot is moved forward to take a step and the right one is brought up beside it, rather than in front of it, the right step length will be zero. It is even possible for the step length on one side to be negative, for example, if the left foot never catches up with the right foot, the distance between the left and right feet will be negative. However, the stride length starting with the left heel strike must always be the same as the stride length starting with the right heelstrike, unless the subject is walking around a curve where the inside leg will have a shorter stride length than the outside leg. This definition of a ‘stride’, consisting of one ‘step’ by each foot, breaks down in some pathological gaits, in which one foot makes a series of ‘hopping’ movements while the other is in the air (Wall et al., 1987). There is no satisfactory nomenclature to deal with this situation.
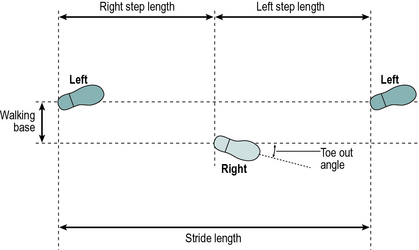
The walking base (also known as the ‘stride width’ or ‘base of support’) is the side-to-side distance between the line of the two feet, usually measured at the midpoint of the back of the heel but sometimes below the centre of the ankle joint. The preferred unit for stride length and step length is the metre and for the walking base, millimetres. The pattern of walking known as ‘tandem gait’ involves walking with the heel of one foot placed directly in front of the toes of the other, i.e. with a walking base close to zero. Although this pattern is not typically seen, even as a pathological gait, it requires good balance and coordination and it is often used by the police as a test for intoxication!
The toe out (or, less commonly, toe in) is the angle in degrees between the direction of progression and a reference line on the sole of the foot. The reference line varies from one study to another; it may be defined anatomically but is commonly the midline of the foot, as judged by eye.
It is common experience that you need to walk more carefully on ice than on asphalt. Whether or not the foot slips during walking depends on two things: the coefficient of friction between the foot and the ground, and the relationship between the vertical force and the forces parallel to the walking surface (front-to-back and side-to-side). The ratio of the horizontal to the vertical force is known as the ‘utilised coefficient of friction’ and slippage will occur if this exceeds the actual coefficient of friction between the foot and the ground. In normal walking, a coefficient of friction of 0.35–0.40 is generally sufficient to prevent slippage; the most hazardous part of the gait cycle for slippage is initial contact. There is a fairly extensive literature on foot-to-ground friction and slippage, e.g. Cham and Redfern (2002) and Burnfield et al. (2005).
Cadence, cycle time and speed
The cadence is the number of steps taken in a given time, the usual unit being steps per minute. In most other types of scientific measurement, complete cycles are counted, but as there are two steps in a single gait cycle, the cadence is a measure of half-cycles. The normal ranges for both cadence and cycle time in both sexes at different ages are showed in Table 1 at the end of this chapter, where we consider the effect of age in more detail.
Table 1 Normal ranges for gait parameters
Approximate range (95% limits) for general gait parameters in free-speed walking by normal FEMALE subjects of different ages
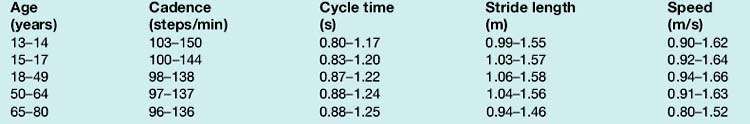
Approximate range (95% limits) for general gait parameters in free-speed walking by normal MALE subjects of different ages
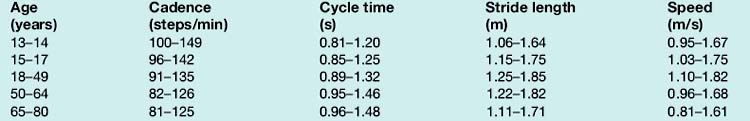
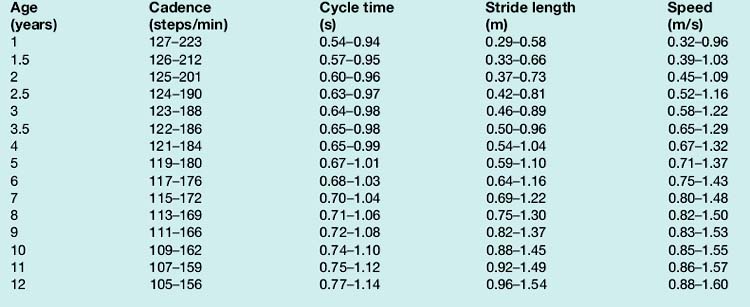
Approximate range (95% limits) for general gait parameters in free-speed walking by normal CHILDREN of different ages (ages 1–7 years based on Sutherland et al. (1988))
The speed of walking is the distance covered by the whole body in a given time. It should be measured in metres per second. Many authors use the term ‘velocity’ in place of ‘speed’ but this is an incorrect usage of the term, unless the direction of walking is also stated, since velocity is a vector. The instantaneous speed varies from one instant to another during the walking cycle, but the average speed is the product of the cadence and the stride length, providing appropriate units are used. The cadence, in steps per minute, corresponds to half-strides per 60 seconds or full strides per 120 seconds. The speed can thus be calculated from cadence and stride length using the formula:

If cycle time is used in place of cadence, the calculation becomes much more straightforward:

The walking speed thus depends on the two step lengths, which in turn depend to a large extent on the duration of the swing phase on each side. The step length is the amount by which the foot can be moved forwards during the swing phase, so that a short swing phase on one side will generally reduce the step length on that side. If the foot catches on the ground, this may terminate the swing phase and thereby further reduce both step length and walking speed. In pathological gait, the step length is often shortened, but it behaves in a way which is counterintuitive. When pathology affects one foot more than the other, an individual will usually try to spend a shorter time on the ‘bad’ foot and correspondingly longer on the ‘good’ one. Shortening the stance phase on the ‘bad’ foot means bringing the ‘good’ foot to the ground sooner, thereby shortening both the duration of the swing phase and the step length on that side. Thus, a short step length on one side generally means problems with single support on the other side.
When making comparisons between individuals, particularly with children, it is useful to allow for differences in size. This is done by dividing a measurement by some aspect of body size, such as height (stature) or leg length, a procedure generally known as ‘normalisation’. It is thus fairly common to see walking speed expressed in ‘statures per second’ or to see measures such as ‘step factor’, which is step length divided by leg length (Sutherland, 1997).
Since walking speed depends on both cadence and stride length, it follows that speed may be changed by altering only one of these variables, for instance by increasing the cadence while keeping the stride length constant. In practice, however, people normally change their walking speed by adjusting both cadence and stride length. Sekiya and Nagasaki (1998) defined the ‘walk ratio’ as step length (m) divided by step rate (steps/min) and found that it was fairly constant in both males and females over a range of walking speeds from very slow to very fast. Macellari et al. (1999) made a detailed study of the relationships between gender, body size, walking speed, gait timing and foot placement.
Outline of the gait cycle
The purpose of this section is to provide the reader with an overview of the gait cycle, to make the detailed description which follows a little easier to follow. The cycle is illustrated by Figures 2.4 and 2.10–2.18, all of which are taken from a single walk by a 22-year-old normal female, weight 540 N (55 kg, 121 lb), walking barefoot with a cycle time of 0.88 s (cadence 136 steps/min), a stride length of 1.50 m and a speed of 1.70 m/s. The individual measurements from this subject do not always correspond to ‘average’ values, because of the normal variability between individuals, although they are all close to the normal range. The measurements were all made in the plane of progression, which is a vertical plane aligned to the direction of the walk; in normal walking it closely corresponds to the sagittal plane of the body. The data were obtained using a Vicon motion system and a Bertec force platform. It should be noted that different laboratories use different methods of measurement, so that other publications may quote different values for some of the measured variables. The reader should thus concentrate on the changes in the variables during the gait cycle, rather than on their absolute values.
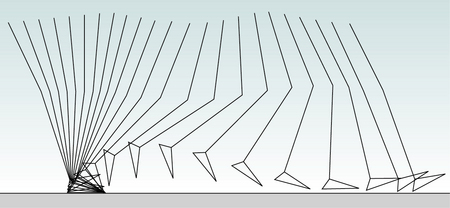
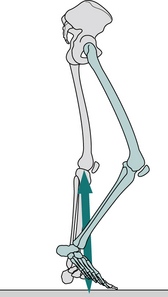
Fig. 2.4 • Position of the right leg in the sagittal plane at 40 ms intervals during a single gait cycle.
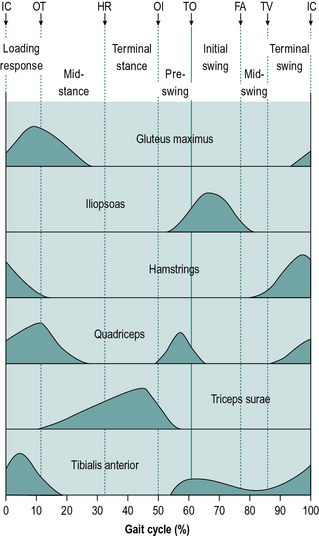
Fig. 2.10 • Typical activity of major muscle groups during the gait cycle. Abbreviations as in Figure 2.5. The timings of the events of the gait cycle are typical and not derived from a single subject.
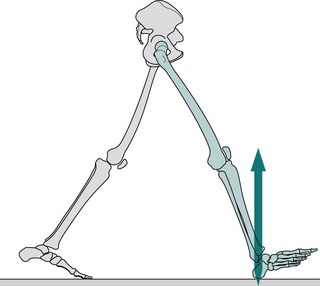
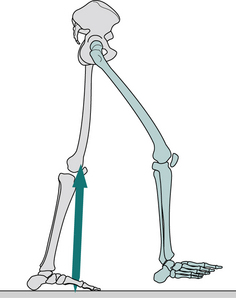
Fig. 2.11 • Initial contact: position of right leg (green), left leg (grey) and ground reaction force vector during the heelstrike transient. This illustration also applies to terminal foot contact.
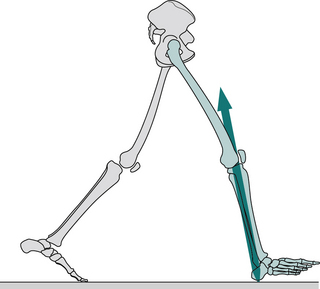
Fig. 2.12 • Loading response: position of right leg (green), left leg (grey) and ground reaction force vector 20 ms after initial contact.
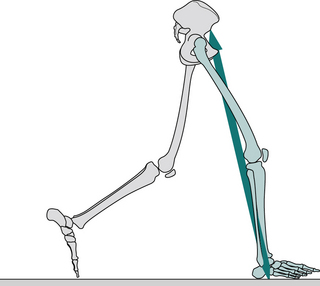
Fig. 2.13 • Opposite toe off: position of right leg (green), left leg (grey) and ground reaction force vector.
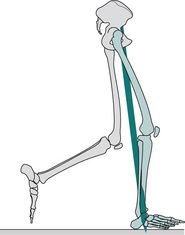
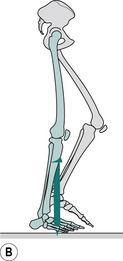
Fig. 2.14 • (A) Mid-stance: position of right leg (green), left leg (grey) and ground reaction force vector 100 ms after opposite toe off. (B) Mid-stance event when the anterior posterior component of the ground reaction force is zero.
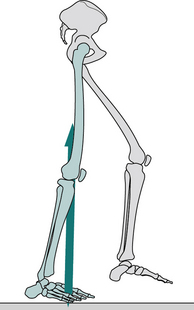
Fig. 2.15 • Heel rise: position of right leg (green), left leg (grey) and ground reaction force vector.
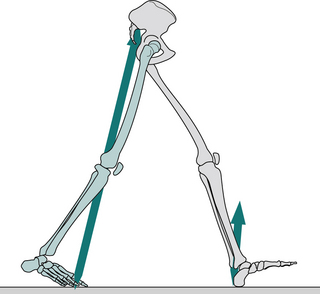
Fig. 2.16 • Opposite initial contact: position of right leg (green), left leg (grey) and ground reaction force vector.
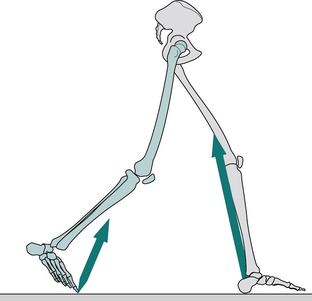
Fig. 2.17 • Toe off: position of right leg (green), left leg (grey) and ground reaction force vector.
When examining diagrams of the joint angles through the gait cycle, it is essential to understand how the angles are defined. Generally speaking, the knee angle is defined as the angle between the femur and the tibia and there is usually no ambiguity. The ankle angle is usually defined as the angle between the tibia and an arbitrary line in the foot. Although this angle is normally around 90°, it is conventional to define it as 0°, dorsiflexion and plantarflexion being movements in the positive and negative directions. In this book, dorsiflexion is a positive angle, but in some other publications it is negative. The ‘hip’ angle may be measured in two different ways: the angle between the vertical and the femur, and the angle between the pelvis and the femur. The latter is the ‘true’ hip angle and is usually defined so that 0° is close to the hip angle in the standing position. Forward flexion of the trunk appears as hip flexion when the hip angle is defined with reference to the pelvis, but not when it is defined with reference to the vertical.
The descriptions which follow assume that symmetry is present between the two sides of the body. This is approximately true for normal individuals, although detailed examination shows that everyone has some degree of asymmetry (Sadeghi, 2003). Such subtle asymmetries are negligible, however, when contrasted with the majority of pathological gaits.
Some gait studies are performed barefoot and some with the subject wearing shoes. Oeffinger et al. (1999) found small differences in some of the gait parameters between these two conditions in children, but did not consider them to be clinically significant. It is usually at the discretion of the investigator whether or not shoes are worn, although in some cases (e.g. when an ankle–foot orthosis or an orthotic insole is used) this may be dictated by the subject's condition.
During gait, important movements occur in all three planes – sagittal, frontal and transverse. However, this introductory text will concentrate on the sagittal plane, in which the largest movements occur. For information on the motion in other planes, the reader is referred to more detailed texts, such as Perry (1992), Inman et al. (1981) or Rose and Gamble (1994). Figure 2.4 shows the successive positions of the right leg at 40 ms intervals, measured over a single gait cycle. Figure 2.5 shows the corresponding sagittal plane angles at the hip, knee and ankle joints and Figure 2.6 shows the sagittal plane angular velocity of the hip, knee and ankle joints.
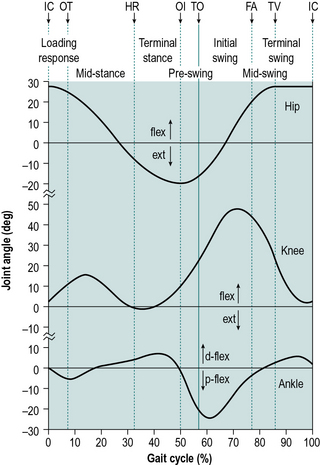
Fig. 2.5 • Sagittal plane joint angles (degrees) during a single gait cycle of right hip (flexion positive), knee (flexion positive) and ankle (dorsiflexion positive). IC = initial contact; OT = opposite toe off; HR = heel rise; OI = opposite initial contact; TO = toe off; FA = feet adjacent; TV = tibia vertical.
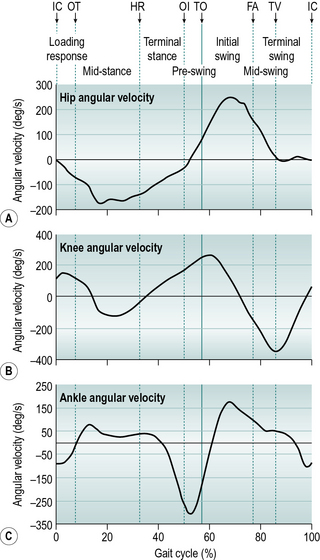
Figure 2.7 shows the internal joint moments (in newton-metres per kilogram body mass) and Figure 2.8 the joint powers (in watts per kilogram body mass). Different authors have used different units for the measurement of moments and powers; those used here are scaled for body mass, but not for the length of the limb segments. In Figure 2.8, the annotations H1–H3, K1–K4 and A1–A2 refer to the peaks of power absorption and generation described by Winter (1991).
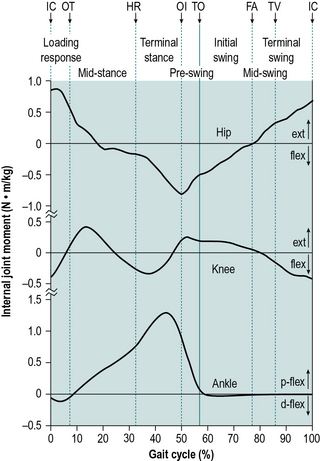
Fig. 2.7 • Sagittal plane internal joint moments (newton-metres per kilogram body mass) during a single gait cycle of right hip (extensor moment positive), knee (extensor moment positive) and ankle (plantarflexor moment positive). Abbreviations as in Figure 2.5.
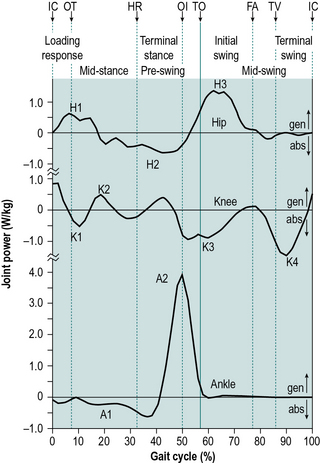
Fig. 2.8 • Sagittal plane joint powers (watts per kilogram body mass) during a single gait cycle of right hip, knee and ankle. Power generation is positive, absorption is negative. See text for meaning of H1, H2, etc. Other abbreviations as in Figure 2.5.
Figure 2.9 shows a ‘butterfly diagram’, described by Pedotti (1977). This is a plot of the ground reaction vectors and is made up of successive representations, at 10 ms intervals, of the magnitude, direction and point of application of the ground reaction force vector. The vectors move across the diagram from left to right and create a shape that resembles the wings of a butterfly.
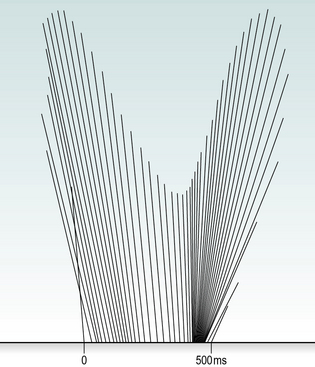
Fig. 2.9 • ‘Butterfly diagram’ representation of ground reaction force vector at 10 ms intervals. Progression is from left to right.
Figure 2.10 gives the typical activity of a number of key muscles or muscle groups during the gait cycle. It is based largely on data from Perry (1992), Inman et al. (1981) and Rose and Gamble (1994). Similar, though not identical, data for these and other muscles were given by Sutherland (1984) and Winter (1991). Although Figure 2.10 shows a typical pattern, it is not the only possible one. One of the interesting things about gait is the way in which the same movement may be achieved in a number of different ways and this particularly applies to the use of muscles, so that two people may walk with the same ‘normal’ gait pattern but using different combinations of muscles. The pattern of muscle usage not only varies from one subject to another but it is also affected by fatigue and varies with walking speed, in a single person. The muscular system is said to possess ‘redundancy’, which means that if a particular muscle cannot be used, its functions may be taken over another muscle or group of muscles. A good review of muscle activity in gait was provided by Shiavi (1985).
Figures 2.11–2.19 show the positions of the two legs and the ground reaction force vector beneath the right foot (where present), at the seven major events of the gait cycle and at two additional points – near the beginning of the loading response (Fig. 2.12) and halfway through mid-stance (Fig. 2.14). The description is based on a gait cycle from right initial contact to the next right initial contact. However, the gait cycle could just as easily have been defined using the left leg.
Throughout the text, references will be made to the position of the ground reaction force vector relative to the axis of a joint and to the resulting joint moments. This approach, known as ‘vector projection’, is an approximation at best, since it neglects the mass of the leg below the joint in question (especially important at the hip) and also ignores the acceleration and deceleration of the limb segments (which primarily lead to errors in the swing phase). However, the author has used this approach since it makes it much easier to understand joint moments. The graphs for joint moments (Fig. 2.7) and joint powers (Fig. 2.8) were calculated ‘correctly’, using a method known as ‘inverse dynamics’, which is based on the kinematics, the ground reaction force and the subject's anthropometry. Wells (1981) discussed the relative merits of these two methods for estimating joint moments.
Upper body
The upper body moves forwards throughout the gait cycle. Its speed varies a little, being fastest during the double support phases and slowest in the middle of the stance and swing phases. The trunk twists about a vertical axis, the shoulder girdle rotating in the opposite direction to the pelvis. The arms swing out of phase with the legs, so that the left leg and the left side of the pelvis move forwards at the same time as the right arm and the right side of the shoulder girdle. Lamoth et al. (2002) made a detailed study of the relative motion between the pelvis and the trunk at different walking speeds. Murray (1967) found average total excursions of 7° for the shoulder girdle and 12° for the pelvis, in adult males walking at free speed. The fluidity and efficiency of walking depend to some extent on the motions of the trunk and arms, but these movements are commonly ignored in clinical gait analysis and have been relatively neglected in gait research. The whole trunk rises and falls twice during the cycle, through a total range of about 46 mm (Perry, 1992), being lowest during double support and highest in the middle of the stance and swing phases. An approximation to this vertical motion can be seen in the position of the hip joint in Figure 2.4. The trunk also moves from side to side, once in each cycle, the trunk being over each leg during its stance phase, as might be expected from the need for support. The total range of side-to-side movement is also about 46 mm (Perry, 1992). The pelvis, as well as twisting about a vertical axis, also tips slightly, both backwards and forwards (with an associated change in lumbar lordosis) and from side to side. The spinal muscles are selectively activated so that the head moves less than the pelvis, which is important for providing a stable platform for vision (Prince et al., 1994).
Hip
The hip flexes and extends once during the cycle (Fig. 2.5). The limit of flexion is reached around the middle of the swing phase and the hip is then kept flexed until initial contact. The peak extension is reached before the end of the stance phase, after which the hip begins to flex again.
Knee
The knee shows two flexion and two extension peaks during each gait cycle. It is more or less fully extended before initial contact, flexes during the loading response and the early part of mid-stance (‘stance phase knee flexion’), extends again during the later part of mid-stance, then starts flexing again, reaching a peak during initial swing (‘swing phase knee flexion’). It extends again prior to the next initial contact.
Ankle and foot
The ankle is usually within a few degrees of the neutral position for dorsiflexion/plantarflexion at the time of initial contact. After initial contact, the ankle plantarflexes, bringing the forefoot down onto the ground. During mid-stance, the tibia moves forward over the foot, and the ankle joint becomes dorsiflexed. Before opposite initial contact, the ankle angle again changes, a major plantarflexion taking place until just after toe off. During the swing phase, the ankle moves back into dorsiflexion until the forefoot has cleared the ground (around feet adjacent), after which something close to the neutral position is maintained until the next initial contact. In the frontal plane, the foot is slightly inverted (supinated, adducted or varus) at initial contact. The foot pronates as it contacts the ground, then moves back into supination as the ankle angle changes from plantarflexion to dorsiflexion, this supinated attitude being maintained as the heel rises and the ankle plantarflexes prior to toe off. Some degree of supination is retained throughout the swing phase.
The gait cycle in detail
Each of the following sections begins with some general remarks about the events surrounding a particular event in the gait cycle and then describes what is happening in the upper body, hips, knees, ankles and feet, with particular reference to the activity of the muscles. These sections are very detailed and may be too much to comprehend in one ‘pass’. It is suggested that the reader should skip the moments and powers on the first reading, but should go back to them later, to gain a deeper understanding of the mechanical processes underlying the gait cycle. The figures shown in this section represent the normal positions of the lower limbs and pelvis at different events during gait and the ground reaction force vector expected.
More detailed descriptions of the events of normal gait are given by Murray (1967), Perry (1992), Inman et al. (1981) and Rose and Gamble (1994).
Initial contact (Fig. 2.11)
1 General:
Initial contact is the beginning of the loading response, which is the first period of the stance phase. Initial contact is frequently called ‘heelstrike’, since in normal individuals there is often a distinct impact between the heel and the ground, known as the ‘heelstrike transient’. Other names for this event are ‘heel contact’, ‘footstrike’ or ‘foot contact’. The direction of the ground reaction force changes from generally upwards during the heelstrike transient (Fig. 2.11) to upwards and backwards in the loading response, immediately afterwards (Fig. 2.12). This change in direction can also be seen in the butterfly diagram (Fig. 2.9), where the force vector changes direction immediately after initial contact.
2 Upper body:
The trunk is about half a stride length behind the leading (right) foot at the time of initial contact. In the side-to-side direction, the trunk is crossing the midline in its range of travel, moving towards the right, as the foot on that side makes contact. The trunk is twisted, the left shoulder and the right side of the pelvis each being at their furthest forwards and the left arm at its most advanced. The amount of arm swinging varies greatly from one person to another and it also increases with the speed of walking. At the time of initial contact, Murray (1967) found the mean elbow flexion was 8° and the shoulder flexion 45°.
3 Hip:
The attitude of the legs at the time of initial contact is shown in Fig. 2.11. The maximum flexion of the hip (generally around 30°) is reached around the middle of the swing phase, after which it changes little until initial contact. The hamstrings are active during the latter part of the swing phase (since they act to prevent knee hyperextension); gluteus maximus begins to contract around the time of initial contact and together these muscles start the extension of the hip, which will be complete around the time of opposite initial contact (Fig. 2.5).
4 Knee:
The knee extends rapidly at the end of the swing phase, becoming more or less straight just before initial contact and then starting to flex again (Figs 2.5 and 2.11). This extension is generally thought to be passive, although Perry (1992) states that it involves quadriceps contraction. Except in very slow walking, the hamstrings contract eccentrically at the end of the swing phase, to act as a braking mechanism to prevent knee hyperextension. This contraction continues into the beginning of the stance phase.
5 Ankle and foot:
The ankle is generally close to its neutral position in plantarflexion/dorsiflexion at the time of initial contact. Since the tibia is sloping backwards, the foot slopes upwards and only the heel contacts the ground (Fig. 2.11). The foot is usually slightly supinated (inverted, adducted or varus) at this time and most people show a wear pattern on the lateral side of the heel of the shoe. Tibialis anterior is active throughout swing and in early stance, having maintained dorsiflexion during the swing phase and in preparation for the controlled movement into plantarflexion which occurs following initial contact.
6 Moments and powers:
At the time of initial contact, there is an internal extensor moment at the hip (Fig. 2.7), produced by contraction of the hip extensors (gluteus maximus and the hamstrings, Fig. 2.10). As the hip joint moves in the direction of extension, these muscles contract concentrically and generate power (H1 in Fig. 2.8). The knee shows an internal flexor moment, due to contraction of the hamstrings (Fig. 2.10) as they prevent hyperextension at the end of the swing phase. As the knee starts to flex, concentric contraction of the hamstrings, as well as the release of energy stored in the ligaments of the extended knee, results in a short-lived power generation (unnamed peak in Fig. 2.8). Little moment or power exchange occurs at the ankle until just after initial contact. The ‘heelstrike’ involves an absorption of energy by the elastic tissues of the heel and by compliant materials in footwear, very little of which could be recovered later in the stance phase. The amount of energy lost to the environment as sound and heat in this way is probably fairly small.
Loading response (Fig. 2.12)
1 General:
The loading response is the double support period between initial contact and opposite toe off. During this period, the foot is lowered to the ground by plantarflexion of the ankle. The ground reaction force increases rapidly in magnitude, its direction being upwards and backwards. In the subject used for illustration, loading response occupied the period from 0% to 7% of the cycle; this is unusually short, loading response typically occupying the first 10–12% of the cycle. Figure 2.12 represents 2% of the cycle.
2 Upper body:
During loading response, the trunk is at its lowest vertical position, about 20 mm below its average level for the whole cycle; its instantaneous forward speed is at its greatest, around 10% higher than the average speed for the whole cycle. It continues to move laterally towards the right foot. The arms, having reached their maximum forward (left) and backward (right) positions, begin to return.
3 Hip:
During loading response, the hip begins to extend (Fig. 2.5), through concentric contraction of the hip extensors, gluteus maximus and the hamstrings (Fig. 2.10).
4 Knee:
From its nearly fully extended position at initial contact, the knee flexes during loading response (Fig. 2.5), initiating the ‘stance phase flexion’. This is accompanied by eccentric contraction of the quadriceps (Fig. 2.10), to limit the speed and magnitude of flexion.
5 Ankle and foot:
The loading response period of the gait cycle, also called the ‘initial rocker’, ‘heel rocker’ or ‘heel pivot’, involves plantarflexion at the ankle (Fig. 2.5). The plantarflexion is controlled by eccentric contraction of the tibialis anterior muscle. The movement into plantarflexion is accompanied by pronation of the foot and internal rotation of the tibia, there being an automatic coupling between pronation/supination of the foot and internal/external rotation of the tibia (Inman et al., 1981; Rose and Gamble, 1994). The direction of the force vector changes from that shown in Figure 2.10 to that shown in Figure 2.12, within 10–20 ms.
6 Moments and powers:
As described above (p. 46, Initial contact, section 6), the hip shows an internal extensor moment with power generation during the loading response and the knee shows an internal flexor moment with power generation. At the ankle, the posterior placement of the force vector (Fig. 2.12) produces an external plantarflexor moment. In the normal individual, this is resisted by an internal dorsiflexor moment (Fig. 2.7) produced by tibialis anterior (Fig. 2.10), which contracts eccentrically, absorbing power (Fig. 2.8) and permitting the foot to be lowered gently to the ground. Should tibialis anterior fail to generate sufficient moment, the foot plantarflexes too rapidly, producing an audible ‘foot slap’.
Opposite toe off (Fig. 2.13)
1 General:
Opposite toe off, also known as ‘opposite foot off’, is the end of the double support period known as loading response and the beginning of mid-stance, the first period of single support. The forefoot, which was being lowered by plantarflexion of the ankle, contacts the ground at ‘foot flat’, also known as ‘forefoot contact’, which generally occurs around the time of opposite toe off. On the opposite (left) side, it marks the end of the stance phase and the beginning of the swing phase. In the subject used for illustration, opposite toe off (Fig. 2.13) occurred at 7% of the cycle and foot flat at 8% of the cycle.
2 Upper body:
At opposite toe off, the left shoulder and arm, having reached their most advanced position, are now moving back again. Similarly, the pelvis on the right side now starts to twist back towards the neutral position. The trunk, having reached its lowest position during loading response, now begins to gain height but to lose forward speed, as a result of the backward and upward direction of the ground reaction force, acting on the centre of gravity of the body. This represents a conversion of kinetic energy to potential energy, similar to that seen in a child's swing at its lowest point before it begins to climb up again.
3 Hip:
The hip flexion angle is around 25° at time of opposite toe off (Fig. 2.5). The hip continues to extend, by concentric contraction of the gluteus maximus and hamstrings.
4 Knee:
At opposite toe off, the knee is continuing to flex, reaching the peak of ‘stance phase knee flexion’ early in mid-stance, after which it begins to extend again (Fig. 2.5). The magnitude of the stance phase flexion is very sensitive to walking speed; it disappears in a very slow walk. Quadriceps contraction (eccentric then concentric) permits the knee to act like a spring, preventing the vertical force from building up too rapidly (Perry, 1974).
5 Ankle and foot:
As soon as the foot is flat on the ground, around opposite toe off, the direction of ankle motion changes from plantarflexion to dorsiflexion, as the tibia moves over the now stationary foot (Fig. 2.5). Both foot pronation and internal tibial rotation reach a peak around opposite toe off and begin to reverse. These two motions are ‘coupled’, i.e. they always occur together, due in part to the geometry of the ankle and subtalar joints (Inman et al., 1981; Rose and Gamble, 1994). Tibialis anterior ceases to contract, to be replaced by contraction of the triceps surae (Fig. 2.10).
6 Moments and powers:
At opposite toe off, the hip continues to have an internal extensor moment with power generation, as described above (p. 46, Initial contact, section 6). At the knee, the force vector lies behind the joint (Fig. 2.13), producing an external flexor moment. This is opposed by an internal extensor moment (Fig. 2.7), generated by the quadriceps muscles (Fig. 2.10). These contract eccentrically, absorbing power (K1 in Fig. 2.8). The line of the ground reaction force begins to move forwards along the foot (Fig. 2.13), causing the internal dorsiflexor moment at the ankle to become smaller and then to reverse, to become a plantarflexor moment (Fig. 2.7). Little power exchange occurs at the ankle at this time.
Mid-stance (Fig. 2.14)
1 General:
Mid-stance is the period of the gait cycle between opposite toe off and heel rise, although the term has been used in the past to describe an event in the gait cycle when the swing phase leg passes the stance phase leg, corresponding to the swing phase event of ‘feet adjacent’, or the point in time when the anterior posterior component of the ground reaction force is zero. In the subject used for illustration, mid-stance occupied the period from 7% to 32% of the cycle; Figure 2.14A represents 18% of the cycle and Figure 2.14B the event when the anterior posterior reaction force is zero.
2 Upper body:
The period of mid-stance sees the trunk climbing to its highest point, about 20 mm above the mean level, and slowing its forward speed, as the kinetic energy of forward motion is converted to the potential energy of height. The side-to-side motion of the trunk also reaches its peak during mid-stance, the trunk being displaced about 20 mm from its central position, towards the side of the stance (right) leg. Like the feet, the arms pass each other during mid-stance, as each follows the motion of the opposite leg. The twisting of the trunk has now disappeared, as both the shoulder girdle and pelvis pass through neutral before twisting the other way.
3 Hip:
During the mid-stance period, the hip continues to extend, moving from a flexed attitude to an extended one (Fig. 2.5). Concentric contraction of gluteus maximus and the hamstrings ceases during this period, as hip extension is achieved by inertia and gravity. Throughout mid-stance and terminal stance, significant muscle activity about the hip joint takes place in the frontal plane. As soon as the opposite foot has left the ground, the pelvis is supported only by the stance phase hip. It is permitted to dip down slightly on the side of the swinging leg, but its position is maintained by contraction of the hip abductors, especially gluteus medius and tensor fascia lata.
4 Knee:
During mid-stance, the knee reaches its peak of stance phase flexion and starts to extend again (Fig. 2.5), initially through concentric contraction of the quadriceps. The peak generally occurs between 15% and 20% of the gait cycle. Its magnitude is variable, both from one individual to another and with the speed of walking, but it is commonly between 10° and 20°.
5 Ankle and foot:
The ‘mid-stance rocker’, also called the ‘second rocker’ or ‘ankle rocker’, occurs during mid-stance and terminal stance. It is characterised by forward rotation of the tibia about the ankle joint, as the foot remains flat on the floor, the ankle angle changing from plantarflexion to dorsiflexion, with the triceps surae contracting eccentrically. The actual angles vary with the method of measurement; most authors report larger angles than those seen in Figure 2.5. External rotation of the tibia and coupled supination of the foot occur during mid-stance and terminal stance. The ground reaction force vector moves forward along the foot from the time of foot flat onwards, moving into the forefoot prior to heel rise. The movement of the foot into supination peaks in mid-stance and then begins to reverse towards pronation.
6 Moments and powers:
During mid-stance, the internal extensor moment at the hip, generated by contraction of the extensor muscles, declines and disappears, to be replaced by a moment in the opposite direction (Fig. 2.7). At the knee, the force vector remains behind the joint, producing an external flexor moment, opposed by an internal extensor moment (Fig. 2.7), due to quadriceps contraction (Fig. 2.10). According to Perry (1992), only the vasti, and not the rectus femoris, are active at this time. As the direction of knee motion changes from flexion to extension (Fig. 2.5), power generation takes place (K2 in Fig. 2.8). The ankle shows an increasing internal plantarflexor moment throughout mid-stance and into terminal stance (Fig. 2.7), as the force vector moves into the forefoot. This moment is generated by the triceps surae (Fig. 2.10), contracting eccentrically and absorbing power (A1 in Fig. 2.8).
Heel rise (Fig. 2.15)
1 General:
Heel rise, also called ‘heel off’, marks the transition from mid-stance to terminal stance. It is the time at which the heel begins to lift from the walking surface. Its timing varies considerably, both from one individual to another and with the speed of walking. The subject used for illustration showed heel rise at 32% of the gait cycle.
2 Upper body:
By heel rise, the trunk is falling from its highest point, reached during mid-stance. The lateral displacement over the supporting (right) leg also begins to diminish, in preparation for the transfer of weight back to the left leg. As the right hip extends and the leg moves backwards, the right side of the pelvis twists backwards with it and the arm and shoulder girdle on the right move forwards.
3 Hip:
At heel rise and into terminal stance, the hip continues to extend (Fig. 2.5). Peak hip extension is reached around the time of opposite initial contact. The activity of the hip abductors in the frontal plane is still required to stabilise the pelvis, although this activity ceases prior to initial contact by the other foot.
4 Knee:
The knee has an extension peak close to the time of heel rise (Fig. 2.5). Around this time, active ankle plantarflexion brings the ground reaction force forward, moving it into the forefoot and in front of the knee joint (barely visible in Fig. 2.15). This attempts to extend the knee, an effect known as the ‘plantarflexion/knee extension couple’, which becomes very important in some pathological gaits. Contraction of the gastrocnemius augments the action of the soleus as far as the ankle joint is concerned, but it also acts as a flexor at the knee, preventing hyperextension and subsequently initiating knee flexion.
5 Ankle and foot:
The peak of ankle dorsiflexion is reached some time after heel rise (Fig. 2.5). Triceps surae initially maintains the ankle angle as the knee begins to flex, with movement into plantarflexion only beginning late in terminal stance. The tibia becomes increasingly externally rotated and the foot becomes increasingly supinated, the two being linked through coupled motion at the subtalar joint. As the heel rises, the toes remain flat on the ground and extension occurs at the metatarsophalangeal (MTP) joints, along an oblique line across the foot, known as the ‘metatarsal break’ or ‘toe break’. From the time that the heel rises, hindfoot inversion (adduction or varus angulation) is seen.
6 Moments and powers:
At heel rise there is a small but increasing internal hip flexor moment (Fig. 2.7). The source of this internal flexor moment does not appear to have been fully explained in the literature, although it could be due to a combination of adductor longus and rectus femoris contraction and stretching of ligaments as the hip moves into extension, with a resulting power absorption (H2 in Fig. 2.8). At the knee, quadriceps contraction has ceased prior to heel rise and the internal knee moment has reversed to become flexor. According to Perry (1992), this occurs because the upper body moves forward faster than the tibia. If the ankle joint were totally free, the forward motion of the body would simply dorsiflex the ankle. However, contraction of the triceps surae (Fig. 2.10) slows down the forward motion of the tibia so that as the femur moves forwards, an external extensor moment is generated at the knee, opposed by an internal flexor moment (Fig. 2.7). Only small and variable power exchanges occur at the knee around heel rise. At the ankle, the internal plantarflexor moment continues to increase, as first the soleus and then both soleus and gastrocnemius together (triceps surae in Fig. 2.10) contract increasingly strongly. The contraction is initially eccentric, with power absorption (A1 in Fig. 2.8).
Opposite initial contact (Fig. 2.16)
1 General:
As might be expected, opposite initial contact in symmetrical gait occurs at close to 50% of the cycle. It marks the end of the period of single support and the beginning of pre-swing, which is the second period of double support. At the time of opposite initial contact, also known as ‘opposite foot contact’, the hip begins to flex, the knee is already flexing and the ankle is plantarflexing. The period between heel rise and toe off (terminal stance followed by pre-swing) is sometimes called the ‘terminal rocker’. This is appropriate, since the leg is now rotating forwards about the forefoot, rather than about the ankle joint. Another term for this period is the ‘push off’ phase. Perry (1974) objected to this term, suggesting instead the term ‘roll-off’, because ‘the late floor-reaction peak is the result of leverage by body alignment, rather than an active downward thrust’. However, it is clear that the ‘push off’ is not simply passive, since it is the period during which the generation of power at the ankle is greatest (Winter, 1983). What is not clear is whether this power is used to accelerate the whole body (as suggested by Winter) or merely the leg (as suggested by Perry) or (as seems most likely) some combination of the two. Buczek et al. (2003) showed that power generation at the ankle is necessary to sustain normal walking. Using terms borrowed from the study of posture control, normal walking involves an ‘ankle strategy’ but may be replaced by a ‘hip strategy’ in which subjects ‘decrease their push-off, pulling their leg forward from their hips’ (Mueller et al., 1994).
2 Upper body:
The attitude of the upper body at opposite initial contact resembles that described for initial contact, except that the trunk is now moving towards the left rather than the right, and the trunk is twisted so that the right shoulder and arm and the left side of the pelvis are forward.
3 Hip:
At opposite initial contact, the hip reaches its most extended position (typically between 10° and 20° of extension, depending on how it is measured) and motion reverses in the direction of flexion (Fig. 2.5). With the hip extended, adductor longus acts as the primary hip flexor (Perry, 1992) and probably generates sufficient moment to initiate hip flexion, particularly when combined with tension in the stretched hip ligaments and the effects of gravity.
4 Knee:
The knee is already moving into flexion by the time of opposite initial contact (Fig. 2.5). The force vector has moved behind the knee, aiding its flexion (Fig. 2.16) and rectus femoris begins to contract eccentrically (included with quadriceps in Fig. 2.10), to prevent flexion from occurring too rapidly. The term ‘pull off’ has been used for the hip and knee flexion occurring during pre-swing.
5 Ankle and foot:
From before opposite initial contact until the foot leaves the ground at toe off, the ankle is moving into plantarflexion (Fig. 2.5), due to concentric contraction of the triceps surae (Fig. 2.10). Extension of the toes at the MTP joints continues and causes a tightening of the plantar fascia. The foot reaches its maximal supination, with hindfoot inversion (adduction or varus angulation) and coupled external tibial rotation. These various factors combine to lock the midtarsal joints, resulting in high stability of the foot for loadbearing (Inman et al., 1981; Rose and Gamble, 1994).
6 Moments and powers:
A peak of hip internal flexor moment occurs around opposite initial contact (Fig. 2.7). As stated above (p. 45, Opposite initial contact, section 3), it probably results from a combination of adductor longus contraction, passive tension in the hip ligaments and gravity. As the direction of hip motion reverses from extension to flexion, power absorption (H2 in Fig. 2.8) is replaced by power generation (H3 in Fig. 2.8). During terminal stance, flexion of the knee brings the joint in front of the force vector (Fig. 2.16), reversing the external moment from extensor to flexor and hence changing the internal moment from flexor to extensor (Fig. 2.7). Eccentric contraction of rectus femoris (included with quadriceps in Fig. 2.10) limits the rate of knee flexion and results in power absorption (K3 in Fig. 2.8). At the ankle, the force vector is well in front of the joint at opposite initial contact (Fig. 2.16). The resulting high external dorsiflexor moment is opposed by a correspondingly high internal plantarflexor moment (Fig. 2.7), produced by concentric contraction of the triceps surae (Fig. 2.9). The result is a large generation of power (A2 in Fig. 2.8), which is the highest power generation of the entire gait cycle. The immediate effect of this power generation is to accelerate the limb forward into the swing phase.
Toe off (Fig. 2.17)
1 General:
Toe off generally occurs at about 60% of the gait cycle (57% in the subject used for illustration). It separates pre-swing from initial swing and is the point at which the stance phase ends and the swing phase begins. The name ‘terminal contact’ has been proposed for this event, since in pathological gait the toe may not be the last part of the foot to leave the ground.
2 Upper body:
The extreme rotations of the shoulders, arms and trunk all begin to return towards the neutral position, as the trunk gains height and moves towards the new (left) supporting foot.
3 Hip:
As the foot leaves the ground, the hip continues to flex (Fig. 2.5). This is achieved by gravity and tension in the hip ligaments, as well as by contraction of the rectus femoris (included with quadriceps in Fig. 2.10) and adductor longus.
4 Knee:
By the time of toe off, the knee has flexed to around half of the angle it will achieve at the peak of swing phase flexion. This flexion is aided by the positioning of the ground reaction force vector well behind the knee (Fig. 2.17), although the magnitude of the force declines rapidly, reaching zero as the foot leaves the ground. The major part of knee flexion then results from hip flexion: the leg acts as a jointed ‘double pendulum’ so that as the hip flexes, the shank is ‘left behind’, due to its inertia, resulting in flexion of the knee. At the very beginning of the swing phase, rectus femoris may contract eccentrically to prevent excessive knee flexion, particularly at faster walking speeds (Nene et al., 1999).
5 Ankle and foot:
The peak of ankle plantarflexion occurs just after toe off. The magnitude of plantarflexion depends on the method of measurement; it is 25° in Figure 2.5. Triceps surae contraction ceases prior to toe off and tibialis anterior begins to contract (Fig. 2.10), to bring the ankle up into a neutral or dorsiflexed attitude during the swing phase.
6 Moments and powers:
Around toe off, the hip still shows an internal flexor moment (Fig. 2.7), resulting from gravity, ligament elasticity, adductor longus and iliopsoas contraction. Since the hip is flexing at this time, power generation occurs (H3 in Fig. 2.8). As stated above (p. 46, Toe off, section 4), during pre-swing and initial swing, hip flexion causes the knee to flex, the ‘double pendulum’ resulting in an external flexor moment at the knee, opposed by an internal extensor moment (Fig. 2.7), as rectus femoris contracts eccentrically (included with quadriceps in Fig. 2.10) to limit the speed at which the knee flexes. This eccentric contraction absorbs power (K3 in Fig. 2.8). At the ankle, the internal plantarflexor moment reduces rapidly during pre-swing as the magnitude of the ground reaction force declines, falling to zero as the foot leaves the ground at toe off (Fig. 2.7). The ankle power generation peak also declines to around zero during this period (Fig. 2.8).
Feet adjacent (Fig. 2.18)
1 General:
Feet adjacent separates initial swing from mid-swing. It is the time when the swinging leg passes the stance phase leg and the two feet are side by side. The swing phase occupies about 40% of the gait cycle and the feet become adjacent around the centre of this time; in the subject used for illustration, it occurred at 77% of the gait cycle. Alternative names for feet adjacent are ‘foot clearance’ and ‘mid-swing’; the latter term is now applied to a period of the gait cycle, rather than to a particular event. Initial swing is also known as ‘lift off’.
2 Upper body:
When the feet are adjacent, the trunk is at its highest position and is maximally displaced over the stance phase leg (left). The arms are level with each other, one (left) moving forward and one (right) moving back.
3 Hip:
The hip starts to flex even prior to toe off and by the time the feet are adjacent, it is well flexed (20° in Fig. 2.5). This is achieved by a powerful contraction of iliopsoas (Fig. 2.10), aided by gravity.
4 Knee:
The flexion of the knee during the swing phase results largely from the flexion of the hip. As described above (p. 46, Toe off, section 6), the leg acts as a jointed pendulum and no muscular contraction is necessary around the knee (thus enabling above-knee amputees to achieve swing phase knee flexion in their prosthetic limb). The peak swing phase knee flexion angle is usually between 60° and 70°. It occurs before the feet are adjacent, by which time the knee has started to extend again. In fast walking, swing phase knee flexion is less than when walking at a natural speed, to shorten the swing phase. This is achieved by co-contraction of the rectus femoris and hamstrings (Gage, 2004).
5 Ankle and foot:
At the time the feet are adjacent, the ankle is moving from a plantarflexed attitude around toe off towards a neutral or dorsiflexed attitude in terminal swing. Most of the shortening of the swing phase leg required to achieve toe clearance comes from flexion of the knee, but the ankle also needs to move out of plantarflexion. This movement requires contraction of the anterior tibial muscles, although the force of contraction is much less than that required to control foot lowering following initial contact. The closest approach of the toes to the ground occurs around the time the feet are adjacent. In normal walking, the toes clear the ground by very little; Murray (1967) found a mean clearance of 14 mm with a range of 1–38 mm. The degree of foot supination reduces following toe off, but the foot remains slightly supinated until the following initial contact.
6 Moments and powers:
As the hip moves into flexion, from opposite initial contact, through pre-swing and initial swing until the feet are adjacent, an internal flexor moment is present (Fig. 2.7). This is generated by gravity, rectus femoris and the adductors, with the addition of ligament elasticity at the beginning of the movement and iliopsoas contraction towards its end (Fig. 2.9). Hip flexion, in response to this moment, results in the highest peak of power generation at the hip (H3 in Fig. 2.8), the power being used to accelerate the swinging leg forward. The resulting kinetic energy is later transferred to the trunk, as the swinging leg is decelerated again at the end of the swing phase. Between toe off and feet adjacent, the knee continues to show a small internal extensor moment, as rectus femoris (part of quadriceps in Fig. 2.10) prevents the knee from flexing too rapidly in response to the external flexor moment transferred from the hip (see above). While the knee is still flexing, power absorption occurs (K3 in Fig. 2.8). Only very small moments and power exchanges are seen at the ankle, since only the weight of the foot is involved.
Tibia vertical (Fig. 2.19)
1 General:
The division between the periods of mid-swing and terminal swing is marked by the tibia of the swinging leg becoming vertical, which occurred at 86% of the gait cycle in the subject used for illustration. Terminal swing is also known as ‘reach’.
2 Upper body:
When the tibia is vertical on the swing phase leg (right), the trunk has begun to lose vertical height and to move from its maximum displacement over the supporting (left) leg back towards the midline. The left arm is now in front of the right and the right side of the pelvis is a little in front of the left side (Fig. 2.19).
3 Hip:
Tibia vertical marks approximately the time at which further hip flexion ceases, the subject used for illustration having a hip angle of about 27° of flexion from tibia vertical to the next initial contact (Fig. 2.5). The hamstrings contract increasingly strongly during terminal swing (Fig. 2.10) to limit the rate of knee extension, while maintaining the hip joint in this flexed position.
4 Knee:
Tibia vertical occurs during a period of rapid knee extension, as the knee goes from the peak of swing phase flexion, prior to feet adjacent, to more or less full extension prior to the next initial contact (Fig. 2.5). This extension is largely passive, being the return swing of the lower (shank) segment of the double pendulum referred to above (p. 46, Toe off, section 4). Eccentric contraction of the hamstrings prevents this motion from causing an abrupt hyperextension of the knee at the end of swing (Fig. 2.10).
5 Ankle and foot:
Once toe clearance has occurred, generally before the tibia becomes vertical, the ankle attitude becomes less important: it may be anywhere between a few degrees of plantarflexion and a few degrees of dorsiflexion, prior to the next initial contact (Fig. 2.5). Tibialis anterior continues to contract, to hold the ankle in position, but its activity usually increases prior to initial contact, in anticipation of the greater contraction forces which will be needed during the loading response (Fig. 2.10).
6 Moments and powers:
At the hip, by the time of tibia vertical, an increasing internal extensor moment is seen (Fig. 2.7), largely generated by contraction of the hamstrings, although gluteus maximus also begins to contract prior to the next initial contact (Fig. 2.10). This moment probably permits the transfer of momentum from the swinging leg to the trunk, recovering some of the kinetic energy imparted to the leg in initial swing (H3 in Fig. 2.8). Since the hip angle is essentially static during terminal swing, very little power exchange occurs at the joint itself. The knee demonstrates an increasing internal flexor moment (Fig. 2.7), which is generated by eccentric contraction of the hamstrings (Fig. 2.10), with power absorption (K4 in Fig. 2.8). This occurs in response to an external extensor moment, generated by the inertia of the swinging shank, which would hyperextend the knee if it were not checked. The ankle moment remains negligible (Fig. 2.7), with very little power exchange (Fig. 2.8).
Terminal foot contact (Fig. 2.11)
The gait cycle ends at the next initial contact of the same foot (in this case, the right foot). Because it is confusing to refer to the end of the cycle as ‘initial contact’, it is sometimes known as ‘terminal foot contact’.
Ground reaction forces
The force platform (or forceplate) is an instrument commonly used in gait analysis. It gives the total force applied by the foot to the ground, although it does not show the distribution of different parts of this force (e.g. heel and forefoot) on the walking surface. Some force platforms give only one component of the force (usually vertical), but most give a full three-dimensional description of the ground reaction force vector. The electrical output signals may be processed to produce three components of force (vertical or ‘Fz’, medial-lateral or ‘Fy’, and fore-aft (anterior-posterior), or ‘Fx’). As forceplates can be mounted in multiple directions, it is best to describe the forces as Fv, FA-P, and FM-L to avoid confusion. The forceplate also produces the two coordinates of the centre of pressure, and the moments about the vertical axis. The centre of pressure is the point on the ground through which a single resultant force appears to act, although in reality the total force is made up of innumerable small force vectors, spread out across a finite area on the surface of the platform.
Since the ground reaction force is a three-dimensional vector, it would be preferable to display it as such for the purposes of interpretation. Unfortunately, this is seldom practical. The most common form of display is that shown in Figure 2.20, where the three components of force are plotted against time for the walk shown in the previous figures. The sign convention used in Figure 2.20 is the same as that used by Winter (1991), where the ground reaction force is positive upwards, forwards and to the right. Regrettably there is no general agreement on sign conventions.
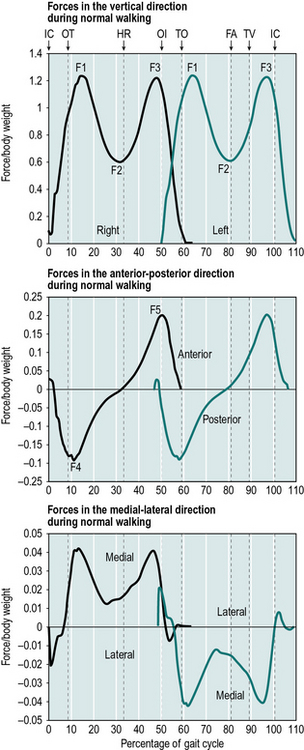
Fig. 2.20 • Vertical, anterior-posterior and medial-lateral components of the ground reaction force, in newtons\body weight, for right foot (green line) and left foot (black line). Abbreviations as in Figure 2.5. See text for sign conventions.
The vertical force shows a characteristic double hump, which results from an upward acceleration of the centre of gravity during early stance (F1), a reduction in downward force as the body ‘flies’ over the leg in mid-stance (F2) and a second peak due to deceleration (F3), as the downward motion is checked in late stance. The fore-aft (or anteroposterior) trace from the right foot shows ‘braking’ during the first half of the stance phase (F4) and ‘propulsion’ during the second half (F5). The left foot shows the same pattern, but with the direction of the lateral force reversed. The lateral component of force is generally very small; for most of the stance phase of the right foot, the ground reaction force accelerates the centre of gravity towards the left side of the body, and during the stance phase of the left foot, the acceleration is towards the right side of the body.
Plots of this type are difficult to interpret and encourage consideration of the force vector as separate components, rather than as a three-dimensional whole. The ‘butterfly diagram’ shown in Figure 2.9 is an improvement on this, since it combines two of the force components (vertical and fore-aft) with the centre of pressure in the fore-aft direction. It also preserves information on timing, since the lines representing the force vector are at regular intervals (10 ms in this case). Butterfly diagrams for the frontal and transverse planes are more difficult to interpret and are seldom used.
The other type of information commonly derived from the force platform is the position of the centre of pressure of the two feet on the ground, as shown in Figure 2.21, again for the same walk. This may be used to identify abnormal patterns of foot contact, including an abnormal toe out or toe in angle. The step length and walking base can also be measured from this type of display, provided there is an identifiable initial contact.
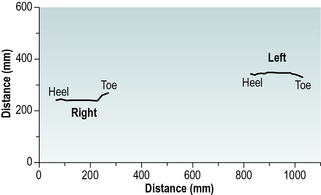
Fig. 2.21 • View of the walking surface from above, showing the centre of pressure beneath the two feet, with the right heel contacting first and the subject walking towards the right of the diagram.
Should the pattern of foot contact be of particular interest, it is preferable to combine the data on the centre of pressure with an outline of the foot, obtained by some other means (such as chalk or ink on the floor). This type of display, with the addition of a sagittal plane representation of the ground reaction force vector, is shown in Figure 2.22 for a normal male subject wearing shoes. The trace shows initial contact at the back of the heel on the lateral side, with progression of the centre of force along the middle of the foot to the metatarsal heads, where it moves medially, ending at the hallux. The spacing of the vectors shows how long the centre of pressure spends in any one area. It is worth noting that there is a cluster of vectors just in front of the edge of the heel, where the shoe is not in contact with the ground, again pointing out the fact that the centre of pressure is merely the average of a number of forces acting beneath the foot.
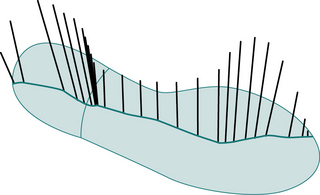
Fig. 2.22 • Foot outline, centre of pressure and sagittal plane representation of ground reaction force vector; right foot of a normal male subject walking in shoes.
There is considerable variation between individuals as to how much force is applied to the ground at initial contact, in some cases this leads to what is known as a heelstrike transient. This is caused by the swinging limb hitting the ground with a backwards velocity, causing a rapid impact peak as the leg decelerates. Figure 2.23 shows the vertical component of the ground reaction force from a fast walk, in hard-heeled shoes, by an individual with a marked heelstrike. The data were recorded at 1000 Hz from a Bertec force platform, which has a particularly high-frequency response. It has been suggested that transient forces in the joints, resulting from the heelstrike, may cause degenerative arthritis (Radin, 1987). The heelstrike transient represents the transfer of momentum from the moving leg to the ground. It is a fairly short event, typically lasting 10–20 ms, and can only be observed using measuring equipment with a fast enough response time. A review article on the heelstrike transient and related topics was published by Whittle (1999).
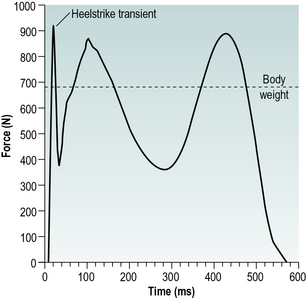
Fig. 2.23 • Plot of vertical ground reaction force against time, showing the heelstrike transient in a particularly ‘vigorous’ walker wearing hard-heeled shoes. Unfiltered data from Bertec force platform, sampled at 1000 Hz.
Moments about the vertical axis are seldom reported. In comparing these moments between normal children with children with clubfeet, Sawatzky et al. (1994) were surprised to find only small, and not statistically significant, differences. However, as will be explained in Chapter 4, these moments largely result from the acceleration and deceleration of the swing phase leg and only minor changes could be expected to be introduced by the foot on the ground.
Support moment
Winter (1980) coined the term ‘support moment’ to describe the sum of the sagittal plane moments about the hip, knee and ankle joints:
 Winter
where MS, MH, MK and MA are the support, hip, knee and ankle moments, respectively.
Winter noted that the support moment was far less variable than its individual components, suggesting that a decreased moment about one joint could be compensated for by an increased moment about one or both of the other joints. However, it was difficult to interpret this in biomechanical terms, since the sign convention was based on flexion and extension, rather than on clockwise and anticlockwise moments, which caused the direction of the knee moment to be opposite to that of the hip and ankle moments. Hof (2000) published a justification for the support moment and suggested that it is responsible for preventing collapse of the knee. Based on his analysis, he suggested the following revised formula for its calculation:
 Hof
HofFigure 2.24 illustrates the support moment calculated from the sagittal plane hip, knee and ankle internal moments from the normal subject used for illustration throughout this chapter, using the formula suggested by Hof (2000).
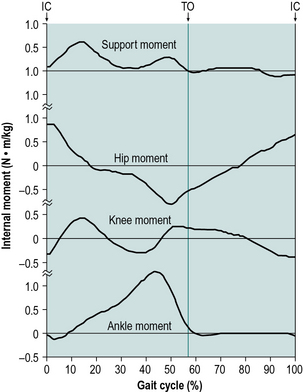
Fig. 2.24 • Support moment, calculated using the formula of Hof (2000), from the sagittal plane internal joint moments of right hip, knee and ankle. Abbreviations and sign conventions as in Figure 2.5.
Anderson and Pandy (2003) suggested that a better alternative to the support moment would be the sum of the vertical components of force from individual muscles during walking.
Energy consumption
It is relatively easy to measure the energy consumption of a vehicle, but much more difficult to make equivalent measurements of human walking, for two reasons. Firstly, there is a clear relationship between the fuel level in the tank of a vehicle and how much energy has been used, whereas knowing how much food a person has eaten gives no information on the energy consumed in a particular activity. Secondly, a vehicle which is switched off uses no energy, whereas people use metabolic energy all the time, whether they are walking or not.
The first problem, that of measuring the ‘fuel consumption’, can be solved by measuring not the fuel consumed but the oxygen which is used to oxidise it. Measurements of oxygen uptake, while not particularly pleasant for the subject (who has to wear a face mask or mouthpiece), are nonetheless perfectly practical and are used routinely to measure the metabolic cost of different activities.
The second problem, the lack of a suitable baseline for energy consumption measurements in humans, is not easy to solve and requires a different way of thinking about the topic. The energy used by a person who is walking can be divided into three parts.
1. The muscles used for walking consume energy, as they accelerate and decelerate the trunk and the limb segments in different directions.
2. There is an ‘overhead’ involved in walking, in that the expenditure of energy by the muscles involves increased activity by the heart and the muscles used in breathing, which themselves use energy. Energy is also expended in maintaining the upright posture.
3. The ‘basal metabolism’ is the irreducible minimum energy a person will consume if they are totally at rest. Basal metabolic rate (BMR) is the energy expended by the body at rest to maintain normal body functions. This continual work makes up about 60–70% of the calories we use and includes respiration, cardiovascular function, and the maintenance of body temperature.
The relationship between metabolic energy and physical energy is very complicated. As explained in Chapter 1 (p. 27), if a muscle undergoes an isometric contraction, it still uses energy, although its length does not change and the physical work it does is zero. In an eccentric contraction, when it lengthens under tension, it uses up metabolic energy, when in physical terms one would expect it to gain energy, rather than to lose it.
In the past it has been usual to estimate the mechanical efficiency of walking by looking at the difference in oxygen consumption between the ‘basal’ state and walking at a given speed. This approach neglects the various overheads, however, and makes slow walking appear to be extremely inefficient. Inman et al. (1981) and Rose and Gamble (1994) suggested that it is more realistic to use standing or very slow walking as the baseline for measurements of faster walking. Despite these uncertainties, a figure of 25% is often quoted for the efficiency of the conversion of metabolic energy into mechanical energy in a wide range of activities, including walking. A comprehensive review of the energy expenditure of normal and pathological gait was given by Waters and Mulroy (1999).
The energy requirements of walking can be expressed in two ways: the energy used per unit time and the energy used per unit distance. Since energy expenditure is usually inferred from the oxygen used, these are generally known as ‘oxygen consumption’ and ‘oxygen cost’, respectively.
Energy consumption per unit time (oxygen consumption)
Inman et al. (1981) and Rose and Gamble (1994) quoted an equation, based on a number of studies, for the relationship between the walking speed and the energy consumption per unit time. The energy consumption included both the basal metabolism and the ‘overheads’. They showed, not surprisingly, that energy consumption per unit time is less for slow walking than for fast walking. Translating their equation into SI units, it becomes:
where Ew is the energy consumption in watts per kilogram body mass and v is the speed in m/s.
As an example of the application of this equation, a 70 kg person walking at 1.4 m/s, which is a typical speed for adults, would consume energy at a rate of 330 w. The term v2 in the equation shows that energy consumption increases as the square of the walking speed.
Energy consumption per unit distance (oxygen cost)
The energy consumption per metre walked, also known as ‘energy cost’, has a less straightforward relationship with walking speed, as both very slow and very fast walking speeds use more energy per metre than walking at intermediate speeds. The equation describing this relationship, again converted into SI units, is:
where Em is the energy consumption in joules per metre per kilogram body mass and v is the speed in m/s. The energy cost of walking is higher in children and decreases steadily with age up to adulthood.
The minimum energy usage is predicted by this equation at a speed of 1.33 m/s. A 70 kg person walking at this speed would use 235 J/m, or 235 kJ/km. A typical ‘candy’ bar contains around 1000 kJ and would thus supply enough energy to walk 4.26 km, or more than two and a half miles!
The equations quoted above merely give average values for adults, which may be modified by age, sex, walking surface, footwear and so on. Pathological gait is frequently associated with an energy consumption considerably above these ‘average’ values, due to some combination of abnormal movements, muscle spasticity and co-contraction of antagonistic muscles. To provide a baseline for studies of pathological gait, Waters et al. (1988) made a detailed study of the energy consumption of a total of 260 normal children and adults of both sexes, walking at a variety of speeds.
Optimisation of energy usage
If people were fitted with wheels, very little energy would be needed for locomotion on a level surface and some of the energy expended in going uphill would be recovered when coming down again. For this reason, both wheelchairs and bicycles are remarkably efficient forms of transport, although obviously much less versatile than a pair of legs. During walking, each leg in turn has to be started and stopped and the centre of gravity of the body rises and falls and moves from side to side, all of which use energy. Despite this, walking is not as inefficient as it might be, due to two forms of optimisation: those involving transfers of energy and those which minimise the displacement of the centre of gravity.
Energy transfers
Two types of energy transfer occur during walking: an exchange between potential and kinetic energy and the transfer of energy between one limb segment and another. The most obvious exchange between potential and kinetic energy is in the movement of the trunk. During the double support phase, the trunk is at its lowest vertical position, with its highest forward speed. During the first half of the single support phase, the trunk is lifted up by the supporting leg, converting some of its kinetic energy into potential energy, as its speed reduces. During the latter part of the single support phase, the trunk drops down again in front of the supporting leg and reduces its height while picking up speed again. These exchanges between potential and kinetic energy are the same as in a child's swing, in which the potential energy at the highest point in its travel is converted into kinetic energy as it swings downwards, then back into potential energy again as it swings up the other side.
As well as the vertical motion of the trunk, there are other exchanges between potential and kinetic energy in walking. The twisting of the shoulder girdle and pelvis in opposite directions stores potential energy as tension in the elastic structures, which is converted to kinetic energy as the trunk untwists and then back to potential energy again as the trunk twists the other way.
Winter et al. (1976) studied the energy levels of the limb segments and of the quaintly named HAT (Head, Arms and Trunk). These authors criticised some earlier studies that had included the kinetic energy of linear motion but had neglected the kinetic energy due to rotation, which is responsible for about 10% of the total energy of the shank. Winter et al. studied only the sagittal plane, regarding energy exchanges in the other planes as negligible. They confirmed the exchange between potential and kinetic energy, described above, and estimated that roughly half of the energy of the HAT segment was conserved in this way. The thigh conserved about a third of its energy by exchanges of this sort and the shank virtually none. They also noted that the changes in total body energy were less than the changes in energy of the individual segments, indicating a transfer of energy from one segment to another. In one subject, during a single gait cycle, the energy changes were: shank 16 J, thigh 6 J and HAT 10 J, making a total of 32 J. However, the total body energy change was only 22 J, indicating a saving of 10 J by intersegment transfers. Siegel et al. (2004) performed a detailed analysis on the relationship between lower limb joint moments and mechanical energy during gait.
The six determinants of gait
The six optimisations used to minimise the excursions of the centre of gravity were called the ‘determinants of gait’ by Saunders et al. (1953) in a classic paper, the main points of which were reiterated, with slight changes, by Inman et al. (1981) and Rose and Gamble (1994). A brief description is given below, but one of these sources should be consulted for a detailed and well-illustrated account. The fourth and fifth determinants were combined in the original descriptions but for the purposes of clarity, the present author has separated them and made other minor changes.
For more than 40 years after their first publication, the determinants of gait were generally accepted and have been redescribed in numerous publications, including previous editions of the present book. However, it has more recently been suggested, in a series of publications (e.g. Della Croce et al., 2001; Gard and Childress, 1997), that although these motions certainly occur, some of them may play little or no part in reducing energy expenditure. Kerrigan (2003) suggested that only the fifth determinant of gait (foot mechanism) significantly reduces the vertical excursions of the centre of mass. Baker et al. (2004) rejected the notion that energy is conserved by restricting the vertical movements of the centre of gravity and proposed instead that energy is mainly conserved by a backwards-and-forwards exchange between potential energy and kinetic energy, as described above. However, having provided these warnings, I will nonetheless reiterate the original descriptions by Saunders et al. (1953)!
The six ‘determinants of gait’ are as follows.
1 Pelvic rotation
If the knee is kept straight, a movement of the hip from a flexed position to an extended one, such as occurs in the stance phase of gait, will result in the centre of mass of the body moving forwards, but also in its rising and then falling again. The amount of forward movement and the amount of rising and falling both depend on the total angle through which the hip joint moves from flexion to extension (Fig. 2.25A). Since the forward movement is equal to the stride length, it follows that the greater the stride length, the greater will be the angles of flexion and extension of the hip, and the more the centre of mass, will move vertically between its highest and lowest positions. The first ‘determinant of gait’ is the way in which the pelvis twists about a vertical axis during the gait cycle, bringing each hip joint forwards as that hip flexes and backwards as it extends. This means that for a given stride length, the hip joint itself moves forward through a smaller distance than the foot, so that less flexion and extension of the hip is required. A proportion of the stride length thus comes from the forward-and-backward movement of the hip joint. The reduction in the range of hip flexion and extension leads to a reduction in the vertical movement of the hip (Fig. 2.25B).
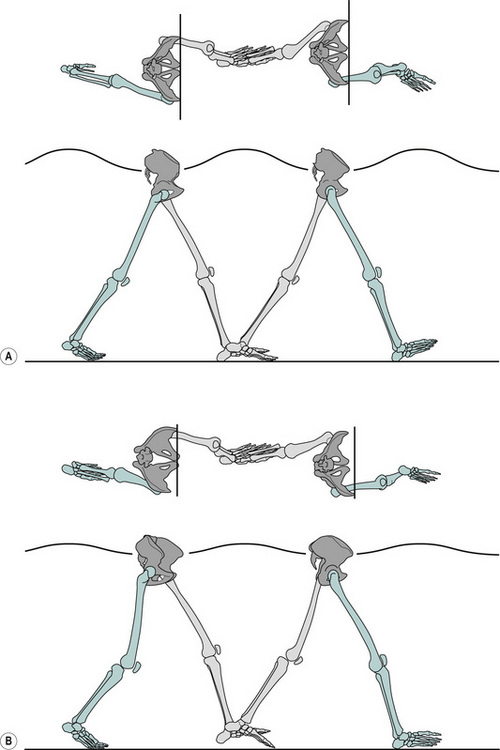
Fig. 2.25 • The first determinant of gait: Pelvic rotation and vertical movement of the centre of mass. If the pelvis did not rotate, the whole of the stride length would come from hip flexion and extension (A). Pelvic rotation about a vertical axis or transverse plane reduces the angle of hip flexion and extension, which in turn reduces the vertical movement of the hip (B).
2 Pelvic obliquity
As described above, flexion and extension of the hip are accompanied by a rise and fall in the height of the hip joint. If the pelvis were to keep level, the trunk would follow this up-and-down movement. However, the second ‘determinant of gait’ is the way in which the pelvis tips about an anteroposterior axis, raising first one side and then the other, so that when the hip of the stance phase leg is at its highest point, the pelvis slopes downwards, so that the hip of the swing phase leg is lower than that of the stance phase leg. Since the height of the trunk does not depend on the height of either hip joint alone but on the average of the two of them, this pelvic obliquity reduces the total vertical excursion of the trunk (Fig. 2.26). However, it can only be achieved if the swing phase leg can be shortened sufficiently to clear the ground (normally by both flexing the knee and dorsiflexing the ankle), when the height of its hip joint is reduced.
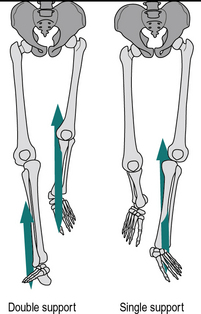
3 Knee flexion in stance phase
The third, fourth and fifth determinants of gait (Fig. 2.27) are all concerned with adjusting the effective length of the leg, by lengthening it at the beginning and end of the stance phase and shortening it in the middle, to keep the hip height as constant as possible. The third ‘determinant’ is the stance phase flexion of the knee. As the femur passes from flexion of the hip into extension, if the leg remained straight, the hip joint would rise and then fall, as described above. However, flexion of the knee shortens the leg in the middle of this movement, reducing the height of the apex of the curve.
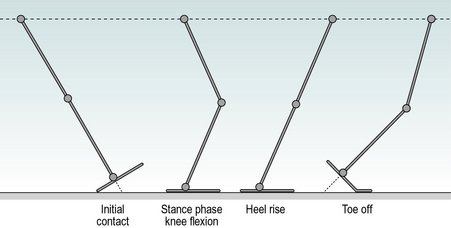
Fig. 2.27 • Third, fourth and fifth determinants of gait: stance phase knee flexion shortens the leg in mid-stance (third determinant); backward projection of the heel at initial contact lengthens the leg (fourth determinant); so does forward projection of the forefoot during pre-swing (fifth determinant).
4 Ankle mechanism
Complementary to the way in which the apex of the curve is lowered by shortening the leg in the middle of the movement from hip flexion to extension, the beginning of the curve is elevated by lengthening the leg at the start of the stance phase – initial contact. This is achieved by the fourth ‘determinant of gait’ – the ankle mechanism. Because the heel sticks out behind the ankle joint, it effectively lengthens the leg during the loading response (Fig. 2.27).
5 Foot mechanism
In the same way that the heel lengthens the leg at the start of the stance phase, the forefoot lengthens it at the end of stance, in the fifth ‘determinant’ – the terminal rocker (Fig. 2.27). From the time of heel rise, the effective length of the lower leg increases as the ankle moves from dorsiflexion into plantarflexion.
6 Lateral displacement of body
The first five determinants of gait are all concerned with reducing the vertical excursions of the centre of gravity. The sixth is concerned with side-to-side movement. If the feet were as far apart as the hips, the body would need to tip from side to side to maintain balance during walking (Fig. 2.28A). By keeping the walking base narrow, little lateral movement is needed to preserve balance (Fig. 2.28B). The reduction in lateral acceleration and deceleration leads to a reduction in the use of muscular energy. The main adaptation which allows the walking base to be narrow is a slight valgus angulation of the knee, which permits the tibia to be vertical while the femur inclines inwards, from a slightly adducted hip.
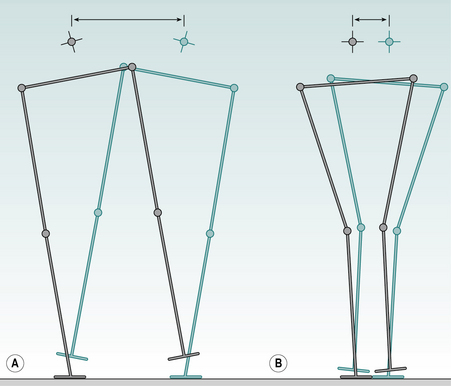
Fig. 2.28 • Sixth determinant of gait: if the feet are placed on the ground far apart (A), large side-to-side movements of the centre of gravity would be necessary to maintain balance; having them closer together (B) reduces the size of these movements.
It should be obvious that although the six determinants of gait have been described separately, they are all integrated together during each gait cycle. The combined effect is a much smoother trajectory for the centre of gravity and (according to the original description) a much lower energy expenditure. According to Perry (1992), the determinants of gait reduce the vertical excursions of the trunk by about 50% and the horizontal excursions by about 40%.
Starting and stopping
To this point, only steady-state continuous walking has been considered. In order to achieve that state, the individual has to start off, and when they reach their destination, they have to stop. Winter (1995), in a review of balance and posture control, gave a good description of gait initiation and gait termination.
In gait initiation, from standing on both feet, the body weight is shifted to one foot, thus permitting the other foot to be lifted off the ground and moved forward. As an example, suppose the left foot was going to move forwards first (swing limb), while the body weight is supported by the right foot (stance limb). The shifting of weight over the right foot is achieved by a brief initial push, backwards and to the left, by the left foot. This (following Newton's second law) moves the centre of gravity of the body forwards and to the right. Once the centre of gravity is over the right foot, it is safe to lift the left foot off the ground and move it forward. At the same time, the trunk has started to move forward. The left foot lands on the ground in front of the subject, with a step that is almost exactly the same as in steady-state gait. Body weight is transferred to the left leg, the right foot leaves the ground with a normal toe off, and the subject is walking. By the time the left foot has contacted the ground, the trunk is moving forward at around 85% of the final walking speed and only one or two more steps are needed before the steady-state speed and pattern are achieved. Probably the slowest adjustment is that of side-to-side balance, which may need several steps to stabilise.
One way gait initiation has been assessed is by considering the mechanical process by which the body's centre of mass decouples, or separates from, the centre of pressure, causing the body to fall forward about the ankle joint (Halliday et al., 1998; Henriksson and Hirschfeld, 2005; Martin et al., 2002; Viton et al., 2000). The process of gait initiation has been generally accepted to consist of two phases, the first of these being the preparatory (postural) phase and second being a stepping (monopodal) phase (Fiolkowski et al., 2002; Mickelborough et al., 2004; Viton et al., 2000). The preparatory phase is when the body begins the decoupling process shifting the centre of pressure initially in the direction of the swinging limb then in the direction of the stance limb (Halliday et al., 1998). The stepping phase is from the point at which the swinging limb is no longer in contact with the floor until its first initial contact (Fig. 2.29). A pathology which causes particular problems for the initiation of gait is parkinsonism; gait initiation in this condition was reviewed by Halliday et al. (1998). Parkinsonian gait will be discussed further in Chapter 6.
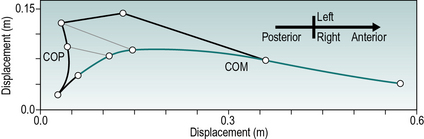
Less research has been done on gait termination, although it appears to present a greater challenge to the neural control system. Gait termination involves a stance phase on one side, which is not followed by a swing phase, and a shortened swing phase on the other, the moving foot being placed beside the stationary one. If the left foot is the swinging one, the forces to terminate gait are provided by the right foot, which directs the ground reaction force forward and to the right, thus applying a backwards and leftwards force to the body's centre of gravity, arresting its forward motion and bringing it to the midpoint between the feet. The left foot is then planted on the ground beside the right one and the walk has terminated.
Other varieties of gait
As well as normal walking, humans walk backwards, skip, run, ascend and descend slopes and stairs, step over obstacles and carry loads in their hands, on their backs or on their heads. Running has an extensive literature of its own, since it is such an important part of sports medicine. The other types of locomotion have all been studied to a greater or lesser extent, particularly because patients with abnormal neuromuscular systems frequently have greater problems with some of these other activities than they do with normal walking. However, such considerations are beyond the scope of the present introductory text.
Changes in gait with age
Gait in the young
Although a number of studies have been made of the development of gait in children, that by Sutherland et al. (1988) is one of the most detailed. The main ways in which the gait of small children differs from that of adults are as follows:
2. The stride length and speed are lower and the cycle time shorter (higher cadence)
3. Small children have no heelstrike, initial contact being made by the flat foot
4. There is very little stance phase knee flexion
5. The whole leg is externally rotated during the swing phase
These differences in gait mature at different rates. The characteristics numbered (3), (4) and (5) in the above list have changed to the adult pattern by the age of 2, and (1) and (6) by the age of 4. The cycle time, stride length and speed continue to change with growth, reaching normal adult values around the age of 15.
Most children commence walking within 3 months of their first birthday. Prior to this, even tiny babies will make reciprocal stepping motions, if they are moved slowly forwards while held in the standing position with their feet on the ground. However, this is not true walking, as there is little attempt to take any weight on the legs.
Figure 2.30, which is based on data from Sutherland et al. (1988), shows the average sagittal plane motion at the hip, knee and ankle joints in 49 children between 11 and 13 months. It should be compared with Figure 2.5, which shows the same parameters for a normal adult female. Sutherland et al. only gave the timing of initial contact and toe off on the two sides and used a different definition of hip angle; the data in Figure 2.30 have been adjusted into extension by 15° to make them comparable with the other figures in this book.
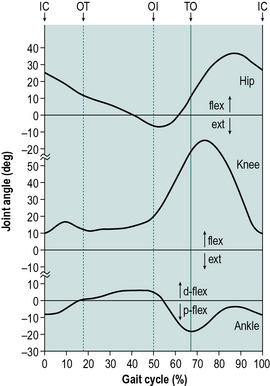
Fig. 2.30 • Sagittal plane hip, knee and ankle angles in 1-year-old children. The hip angle has been moved into extension by 15° to allow for a difference in measurement methods. Sign conventions and abbreviations as in Figure 2.5
(based on data from Sutherland et al., 1988).
The pattern of hip flexion and extension differs from that in adults in that the degree of extension is reduced and the hip does not remain flexed for so long at the end of the swing phase. The knee never fully extends, but this is seen at all ages in Sutherland's data and may reflect the method of measurement. There is some stance phase knee flexion in infants, but it is both smaller in magnitude and earlier than in adults. The flexion of the knee in the swing phase is also somewhat reduced at the age of 1 (and most adults have more swing phase flexion than is seen in Fig. 2.5).
Initial contact in small children is by the whole foot, heelstrike being replaced by foot flat. The ankle is plantarflexed at initial contact and remains so into the early stance phase, in contrast to the adult pattern, in which the ankle is approximately neutral at initial contact but moves rapidly into plantarflexion. The pattern of dorsiflexion followed by plantarflexion through the remainder of the stance phase is essentially the same at all ages.
Since children are smaller than adults, it is not surprising that they walk with a shorter stride length and at a slower speed. Sutherland et al. (1988) showed that stride length is closely related to height and that the ratio of stride length to stature is similar to that found in adults. The change in stride length with age mirrors the change in height, showing a rapid increase up to age 4 and a slower increase thereafter. Todd et al. (1989) detailed the relationships between the height of children and their general gait parameters. Small children walk with a short cycle time (rapid cadence), the mean at the age of one being about 0.70 s (171 steps/min). Cycle time increases with age but is still around 0.85 s (141 steps/min) at age 7, which is well below the typical adult values of 1.06 s (113 steps/min) for men and 1.02 s (118 steps/min) for women. The shorter cycle time partly compensates for the short stride length and the speed ranged from 0.64 m/s at age 1 to 1.14 m/s at age 7, compared with the typical adult values of 1.46 m/s for males and 1.30 m/s for females. Sutherland did not report on the gait of children beyond the age of 7 and did not distinguish between the results from boys and girls. Table 1 gives the normal ranges for the general gait parameters in children, derived in part from Sutherland's data. However, values based on age alone may be misleading; stride length depends on both height and walking speed, both of which may be lower in children with a disability than in normal children of the same age.
As can be seen in Figure 2.30, the swing phase occupies a smaller proportion of the gait cycle in very small children than in adults, thus minimising the time spent in the less stable condition of single legged stance. The relative duration of the swing phase increases with age, reaching the adult proportion around the age of 4 years. There is symmetry between the two sides at all ages. Sutherland et al. (1988) related the width of the walking base to the width of the body at the top of the pelvis, using the somewhat confusing ‘pelvic-span/ankle-spread’ ratio. Changing the measurement units for the sake of clarity, the walking base is about 70% of the pelvic width at the age of 1 year, falling to about 45% by the age of 3½, at which level it remains until the age of 7. An average value for adults is not readily available but it is probably less than 30%.
At the very youngest ages, the EMG patterns showed that there is a tendency to activate most muscles for a higher proportion of the gait cycle than in adults. With the exception of the triceps surae, adult patterns are established for most muscles by the age of 2. Sutherland et al. (1988) found that children could be divided into two groups depending on whether the triceps surae was activated in a prolonged (infant) pattern or the normal (adult) pattern. Below the age of 2, over 60% of the children showed the infant pattern; the proportion dropped to below 30% by the age of 7. The authors speculated that this might relate to delayed myelination of the sensory branches of the peripheral nerves.
An excellent review of the main changes in gait occurring during childhood was given by Sutherland (1997). The gait of very small children (under the age of 2) was examined in detail by Grimshaw et al. (1998). The joint moments and powers of this same group were studied by Hallemans et al. (2005).
Gait in the elderly
Cunha (1988) discussed the gait of elderly people and pointed out that many pathological gait disorders are incorrectly thought to be part of the normal ageing process. Identification of an underlying cause, which may be treatable, could result in an improved life for the patient and a reduced risk of falls and fractures. Cunha classified the causes of the gait disorders of old age as follows: neurological, psychological, orthopaedic, endocrinological, general, drugs, senile gait and associated conditions. He described the features of the gait in many conditions affecting the elderly and suggested a plan for the investigation and management of these patients.
A number of investigations have been made of the changes in gait which occur with advancing age, especially by Murray et al. (1969), who studied the gait of men up to the age of 87. The description which follows is confined to the effects of age on free-speed walking, although Murray et al. also examined fast walking. A companion paper (Murray et al., 1970) studied the gait of women up to age 70. It did not provide as much information on the effects of age, but generally confirmed the observations made on males.
The gait of elderly people is subject to two influences: the effects of age itself and the effects of pathological conditions, such as osteoarthritis and parkinsonism, which become more common with advancing age. Provided patients with pathological conditions are carefully excluded, the gait of elderly people appears to be simply a ‘slowed down’ version of the gait of younger adults. Murray et al. (1969) were careful to point out that ‘the walking performance of older men did not resemble a pathological gait’.
Typically, the onset of age-related changes in gait takes place in the decade from 60 to 70 years of age. There is a decreased stride length, a variable but generally increased cycle time (decreased cadence) and an increase in the walking base. Many other changes can also be observed, such as a relative increase in the duration of the stance phase as a percentage of the gait cycle, but most of them are secondary to the changes in stride length, cycle time and walking base. The speed (stride length divided by cycle time) is almost always reduced in elderly people. Table 1 gives normal ranges for the general gait parameters up to the age of 80.
Some of the differences between the gait of the young and the elderly are apparent in Figure 2.31, which is taken from Murray et al. (1969). These authors suggested that the purpose of gait changes in the elderly is to improve the security of walking. Both decreasing the stride length and increasing the walking base make it easier to maintain balance while walking. Increasing the cycle time (reducing the cadence) leads to a reduction in the percentage of the gait cycle for which there is only single limb support, since the increase in cycle length is largely achieved by lengthening the stance phase and hence the double support time.
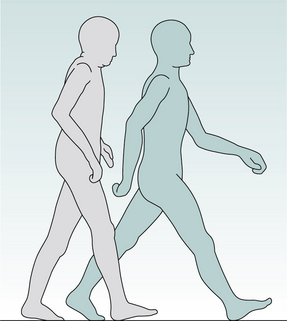
Fig. 2.31 • Body position at right initial contact in older men (left) and younger men (right) (Murray et al., 1969).
Changes in the angular excursions of the joints in the elderly include a reduction in the total range of hip flexion and extension, a reduction in swing phase knee flexion and reduced ankle plantarflexion during the push off. However, all of these depend on both cycle time and stride length and are probably within normal limits if these factors are taken into account. Nigg et al. (1994) confirmed these observations in a detailed study on three-dimensional joint ranges of motion in walking, in male and female subjects from 20 to 79 years of age. The vertical movement of the head is reduced and its lateral movement increased, probably secondary to the changes in stride length and walking base, respectively.
The trajectory of the toe over the ground is modified in old age, giving an improved ground clearance during the first half of the swing phase. This is probably another mechanism for improving security. The heel rises less during pre-swing and the foot attitude is closer to the horizontal at initial contact, both of these changes being related to the reduction in stride length. There is also an increase in the angle of toe out in elderly people and changes in the posture and movements of the arms, the elbows being more flexed and the shoulders more extended. The reasons for these differences are not known.
The dividing line between normal and abnormal may be difficult to define in elderly people. A condition known as ‘idiopathic gait disorder of the elderly’ has been described, which is essentially an exaggeration of the gait changes which normally occur with age and is characterised by a cautious attitude to walking, with a prolonged cycle time (low cadence), a short stride length and an increased step-to-step variability. For a comprehensive review of the changes in gait with advancing age, see Prince et al. (1997).
Anderson F.C., Pandy M.G. Individual muscle contributions to support in normal walking. Gait Posture. 2003;17:159–169.
Baker R., Kirkwood C., Pandy M. Minimizing the vertical excursion of the center of mass is not the primary aim of walking. In: Eighth International Symposium on the 3-D Analysis of Human Movement. Florida, USA: Tampa; 2004:101–104. March 31–April 2
Basmajian J.V. Muscles Alive: Their Functions Revealed by Electromyography. Baltimore, MD: Lippincott Williams & Wilkins; 1985.
Blanc Y., Balmer C., Landis T., Vingerhoets F. Temporal parameters and patterns of foot roll over during walking: normative data for healthy adults. Gait Posture. 1999;10:97–108.
Bresler B., Frankel J.P. The forces and moments in the leg during level walking. American Society of Mechanical Engineers Transactions. 1950;72:27–36.
Buczek F.L., Sanders J.O., Concha M.C., et al. Inadequacy of an inverted pendulum model of human gait, USA: Gait and Clinical Movement Analysis Society. Eighth Annual Meeting, Wilmington, Delaware, 2003:185–186.
Burnfield J.M., Tsai Y.J., Powers C.M. Comparison of utilized coefficient of friction during different walking tasks in persons with and without a disability. Gait Posture. 2005;22:82–88.
Cavagna G.A., Margaria R. Mechanics of walking. J. Appl. Physiol.. 1966;21:271–278.
Cham R., Redfern M.S. Changes in gait when anticipating slippery floors. Gait Posture. 2002;15:159–171.
Cunha U.V. Differential diagnosis of gait disorders in the elderly. Geriatrics. 1988;43:33–42.
De Luca C.J. The use of surface electromyography in biomechanics. J. Appl. Biomech.. 1997;13(2):135–163.
Della Croce U., Riley P.O., Lelas J.L., et al. A refined view of the determinants of gait. Gait Posture. 2001;14:79–84.
Fiolkowski P., Brunt D., Bishop M., Woo R. Does postural instability affect the initiation of human gait? Neurosci. Lett.. 2002;323(3):167–170.
Gage J.R., ed. The Treatment of Gait Problems in Cerebral Palsy. London: MacKeith Press, 2004.
Gard S.A., Childress D.S. The effect of pelvic list on the vertical displacement of the trunk during normal walking. Gait Posture. 1997;5:233–238.
Garrison F.H. An Introduction to the History of Medicine. Philadelphia, PA: WB Saunders; 1929.
Grimshaw P.N., Marques-Bruna P., Salo A., et al. The 3-dimensional kinematics of the walking gait cycle of children aged between 10 and 24 months: cross sectional and repeated measures. Gait Posture. 1998;7:7–15.
Hallemans A., De Clercq D., Otten B., et al. 3D joint dynamics of walking in toddlers. A cross-sectional study spanning the first rapid development phase of walking. Gait Posture. 2005;22:107–118.
Halliday S.E., Winter D.A., Frank J.S., et al. The initiation of gait in young, elderly and Parkinson's disease subjects. Gait Posture. 1998;8:8–14.
Henriksson M., Hirschfeld H. Physically active older adults display alterations in gait initiation. Gait Posture. 2005;21(3):289–296.
Hof A.L. On the interpretation of the support moment. Gait Posture. 2000;12:196–199.
Inman V.T., Ralston H.J., Todd F. Human Walking. Baltimore, MD: Williams & Wilkins; 1981.
Kerrigan C.D. Discoveries from quantitative gait analysis. Gait Posture. 2003;18(Suppl. 1):S13.
Lamoth C.J.C., Beek P.J., Meijer O.G. Pelvis-thorax coordination in the transverse plane during gait. Gait Posture. 2002;16:101–114.
Macellari V., Giacomozzi C., Saggini R. Spatial-temporal parameters of gait: reference data and a statistical method for normality assessment. Gait Posture. 1999;10:171–181.
Martin M., Shinberg M., Kuchibhatla M., Ray L., Carollo J.J., Schenkman M.L. Gait initiation in community-dwelling adults with Parkinson disease: comparison with older and younger adults without the disease. Phys. Ther.. 2002;82(6):566–577.
Mickelborough J., van der Linden M.L., Tallis R.C., Ennos A.R. Muscle activity during gait initiation in normal elderly people. Gait Posture. 2004;19(1):50–57.
Mueller M.J., Sinacore D.R., Hoogstrate S., et al. Hip and ankle walking strategies: effect on peak plantar pressures and implications for neuropathic ulceration. Arch. Phys. Med. Rehabil.. 1994;75:1196–1200.
Murray M.P. Gait as a total pattern of movement. Am. J. Phys. Med.. 1967;46:290–333.
Murray M.P., Kory R.C., Clarkson B.H. Walking patterns in healthy old men. J. Gerontol.. 1969;24:169–178.
Murray M.P., Kory R.C., Sepic S.B. Walking patterns of normal women. Arch. Phys. Med. Rehabil.. 1970;51:637–650.
Nene A., Mayagoitia R., Veltink P. Assessment of rectus femoris function during initial swing phase. Gait Posture. 1999;9:1–9.
Nigg B.M., Fisher V., Ronsky J.L. Gait characteristics as a function of age and gender. Gait Posture. 1994;2:213–220.
Oeffinger D., Brauch B., Cranfill S., et al. Comparison of gait with and without shoes in children. Gait Posture. 1999;9:95–100.
Paul J.P. Bio-engineering studies of the forces transmitted by joints. (II) Engineering analysis. In: Kenedi J.P., ed. Biomechanics and Related Bioengineering Topics. Oxford: Pergamon; 1965:369–380.
Paul J.P. Forces transmitted by joints in the human body. Proceedings of the Institute of Mechanical Engineers. 1966;181:8–15.
Pedotti A. Simple equipment used in clinical practice for the evaluation of locomotion. IEEE Transactions on Biomedical Engineering. 1977:456–461. BME-24
Perry J. Kinesiology of lower extremity bracing. Clin. Orthop. Relat. Res.. 1974;102:18–31.
Perry J. Gait Analysis: Normal and Pathological Function. Thorofare, NJ: Slack Incorporated; 1992.
Prince F., Winter D.A., Stergiou P., et al. Anticipatory control of upper body balance during human locomotion. Gait Posture. 1994;2:19–25.
Prince F., Corriveau H., Hébert R., et al. Gait in the elderly. Gait Posture. 1997;5:128–135.
Radin E.L. Osteoarthrosis: what is known about its prevention. Clin. Orthop. Relat. Res.. 1987;222:60–65.
Rose J., Gamble J.G. Human Walking, second ed. Baltimore, MD: Williams & Wilkins; 1994.
Rose Gamble. Human Walking, third ed. Lippincott Williams and Wilkins, 2005.
Sadeghi H. Local or global asymmetry in gait of people without impairments. Gait Posture. 2003;17:197–204.
Saunders J.B.D.M., Inman V.T., Eberhart H.S. The major determinants in normal and pathological gait. J. Bone Joint Surg. Am.. 1953;35:543–558.
Sawatzky B.J., Sanderson D.J., Beauchamp R.D., et al. Ground reaction forces in gait in children with clubfeet – a preliminary study. Gait Posture. 1994;2:123–127.
Sekiya N., Nagasaki H. Reproducibility of the walking patterns of normal young adults: test-retest reliability of the walk ratio (step-length/step-rate). Gait Posture. 1998;7:225–227.
Shiavi R. Electromyographic patterns in adult locomotion: a comprehensive review. J. Rehabil. Res. Dev.. 1985;22:85–98.
Siegel K.L., Kepple T.M., Stanhope S.J. Joint moment control of mechanical energy flow during normal gait. Gait Posture. 2004;19:69–75.
Steindler A. A historical review of the studies and investigations made in relation to human gait. J. Bone Joint Surg. Am.. 1953;35:540–542.
Sutherland D.H. Gait Disorders in Childhood and Adolescence. Baltimore, MD: Williams & Wilkins; 1984.
Sutherland D.H. The development of mature gait. Gait Posture. 1997;6:163–170.
Sutherland D.H. The evolution of clinical gait analysis. Part I: Kinesiological EMG. Gait Posture. 2001;14:61–70.
Sutherland D.H. The evolution of clinical gait analysis. Part II: Kinematics. Gait Posture. 2002;16:159–1179.
Sutherland D.H. The evolution of clinical gait analysis. Part III: Kinetics and energy assessment. Gait Posture. 2005;21:447–461.
Sutherland D.H., Olshen R.A., Biden E.N., et al. The Development of Mature Walking. London: MacKeith Press; 1988.
Todd F.N., Lamoreux L.W., Skinner S.R., et al. Variations in the gait of normal children. J. Bone Joint Surg. Am.. 1989;71:196–204.
Viton J.M., Timsit M., Mesure S., Massion J., Franceschi J.P., Delarque A. Asymmetry of gait initiation in patients with unilateral knee arthritis. Arch. Phys. Med. Rehabil.. 2000;81(2):194–200.
Wall J.C., Charteris J., Turnbull G.I. Two steps equals one stride equals what? The applicability of normal gait nomenclature to abnormal walking patterns. Clin. Biomech. (Bristol, Avon). 1987;2:119–125.
Waters R.L., Mulroy S. The energy expenditure of normal and pathological gait. Gait Posture. 1999;9:207–231.
Waters R.L., Lunsford B.R., Perry J., et al. Energyspeed relationship of walking: standard tables. J. Orthop. Res.. 1988;6:215–222.
Wells R.P. The projection of the ground reaction force as a predictor of internal joint moments. Bull. Prosthet. Res.. 1981;10–35:15–19.
Whittle M.W. Generation and attenuation of transient impulsive forces beneath the foot: a review. Gait Posture. 1999;10:264–275.
Winter D.A. Overall principle of lower limb support during stance phase of gait. J. Biomech.. 1980;13:923–927.
Winter D.A. Energy generation and absorption at the ankle and knee during fast, natural and slow cadences. Clin. Orthop. Relat. Res.. 1983;175:147–154.
Winter D.A. The Biomechanics and Motor Control of Human Gait, second ed. Waterloo, Ontario: University of Waterloo Press; 1991.
Winter D.A. Human balance and posture control during standing and walking. Gait Posture. 1995;3:193–214.
Winter D.A., Quanbury A.O., Reimer G.D. Analysis of instantaneous energy of normal gait. J. Biomech.. 1976;9:253–257.