Disseminating Research Findings
Imagine that as a nurse researcher you are conducting a study in which you describe a unique phenomenon, detect a previously unrecognized relationship, or determine the effectiveness of an intervention. This information might make a difference in nursing practice; however, you feel unskilled in presenting the information and overwhelmed by the idea of publishing. You place the study in a drawer with the intent to communicate the findings someday. Because of this type of response, many valuable nursing studies are not communicated, and the information is lost. Winslow (1996) believes so strongly in the need to communicate research findings that she views failure to do so as a form of scientific misconduct.
Communicating research findings, the final step in the research process, involves developing a research report and disseminating it through presentations and publications to audiences of nurses, health care professionals, policy makers, and health care consumers. Disseminating study findings provides many advantages for the researcher, the nursing profession, and the consumer of nursing services. By presenting and publishing their findings, researchers advance the knowledge of a discipline, which is essential for providing evidence-based practice. For individual researchers, communicating study findings often leads to professional advancement, personal recognition, and other psychological and financial compensations. These rewards are extremely important for the continuation of research in a discipline. By communicating research findings, the researcher also promotes the critical analysis of previous studies, encourages the replication of studies, and identifies additional research problems. Over time, the findings from many quality studies are synthesized with the ultimate goal of providing evidence-based health care to patients, families, and communities (Craig & Smyth, 2007; Goode, 2000; Melnyk, & Fineout-Overholt, 2005). To facilitate the communication of research findings in nursing, this chapter describes the content of a research report, the audiences for communicating study findings, and the processes for presenting and publishing research reports.
CONTENT OF A RESEARCH REPORT
Both quantitative and qualitative research reports include four major sections or content areas: (1) introduction, (2) methods, (3) results, and (4) discussion of the findings (Boyd & Munhall, 2001; Kerlinger & Lee, 2000; Patton, 2002; Pyrczak & Bruce, 2005; Wolcott, 2001). The type and depth of information included in these sections depend on the study conducted, the intended audiences, and the mechanisms for disseminating the report. For example, theses and dissertations are research reports that are usually developed in depth to demonstrate the student’s understanding of the research problem and process to faculty members. Research reports developed for publication in journals are written to communicate study findings efficiently and effectively to nurses and other health care professionals. The methods, results, and discussion sections of qualitative studies are usually more detailed than those of quantitative studies because of the complex data collection and analysis procedures and the comprehensive findings (Boyd & Munhall, 2001; Knafl & Howard, 1984; Patton, 2002).
Quantitative Research Report
This section provides direction to novice researchers writing their initial quantitative research report. To begin, the title of your research report needs to indicate what you have studied and attract the attention of interested readers. The title should be concise and consistent with the study purpose and the research objectives, questions, or hypotheses. Often a title includes the major study variables and population and indicates the type of study conducted but should not include the results or conclusions of a study (Pyrczak & Bruce, 2005). Heo, Moser, Lennie, Zambroski, and Chung (2007, p. 16) provided the following title for their study: “A Comparison of Health-Related Quality of Life between Older Adults with Heart Failure and Healthy Older Adults.” This title is concise, states the focus of the study (comparative descriptive), identifies a key study variable (health-related quality of life [HRQOL]), and includes the populations studied (older adults with heart failure and healthy older adults). However, this study is also predictive, and this is not indicated in the study title. The researchers studied additional independent variables (health perception, functional status, physical symptom status, emotional symptom status, and social support) to predict the dependent variable HRQOL in older adults with and without heart failure.
Most research reports also include an abstract that summarizes of the key aspects of the study. An abstract is usually about 200 words long and describes the problem, purpose, framework, methods, sample size, key results, and conclusions (Pyrczak & Bruce, 2005). Later in this chapter we provide details for developing an abstract of a study. Heo et al. (2007) included the following abstract for their study.
Heo et al. concisely organized their abstract with headings and clearly indicated the problem (background), sample size (90 older adults with heart failure and 116 healthy older adults), results, and conclusions. The purpose of the study was clearly stated but was listed under the heading “Objective,” which might be confusing to readers. The methods for this study lack clarity in this abstract. As a reader, you might be unclear about the type of study design, variables studied, measurement methods, and the data collection process. This abstract has many strengths, but it would have been improved if the authors had clearly labeled the purpose and expanded the methods section.
Following the abstract are the four major sections of a research report: introduction, methods, results, and discussion. Table 25-1 provides an outline of the content covered in each of these sections of a quantitative research report. Heo et al.’s (2007) research report is used as an example when discussing these sections. The complete research article can be accessed through CINAHL or is available online at www.heartandlung.org for registered users.
TABLE 25-1
Outline for a Quantitative Research Report
Introduction
Presentation of the problem: significance, background, and problem statement
Presentation of literature review, including empirical and theoretical literature
Discussion of the framework, including proposition(s) guiding the study
Identification of research objectives, questions, or hypotheses (if applicable)
Identification of conceptual and operational definitions of variables
Methods
Discussion of the research design
Description of the study intervention, intervention protocol, or the process to promote intervention fidelity if and intervention is implemented in the study
Description of the sample (sampling method, sample criteria, refusal or acceptance rate, sample size, sample attrition or retention, and sample characteristics), consent process, and setting
Results
Description of the data analysis procedures
Organization of results by research objectives, questions, or hypotheses
Discussion
References
Include only references cited in the text
Use format indicated by the journal guidelines, which is often the APA (2001) format
Introduction
The introduction of a research report discusses the background and significance of the problem; identifies the problem statement and purpose; reviews the relevant empirical and theoretical literature; describes the study framework; and identifies the research objectives, questions, or hypotheses (if applicable). You will have developed this content for the research proposal, and then will summarize it in the final report. Depending on the type of research report, the review of literature and framework might be separate sections or even separate chapters as in a thesis or dissertation. Key content from the introduction of the study by Heo et al. (2007) is presented as an example.
Review of Literature: The review of literature section of a research report documents the current knowledge of the problem investigated. The sources included in the literature review are those that you used to develop your study and interpret the findings. A review of literature can be two or three paragraphs or several pages long. In journal articles, the review of literature is concise and usually includes 15 to 30 sources. Theses and dissertations frequently include an extensive literature review to document the student’s knowledge of the research problem. The summary of the literature review clearly identifies what is known, what is not known or the gap in the knowledge base, and the contribution of this study to the current knowledge base. Often the objectives, questions, or hypotheses that were used to direct the study are stated at the end of the literature review. Heo et al. (2007) provided a brief summary of the relevant literature and included what is known and not known about the effects of heart failure on HRQOL. The researchers might have expanded the literature reviewed on the effects of age, health perception, functional status, physical symptom status, emotional symptom status, and social support on HRQOL in individuals with and without heart failure.
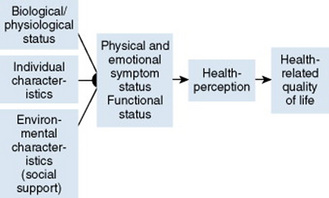
Framework: A research report needs to include an explicitly identified framework. In this section you will identify and define the major concepts in the framework and describe the relationships among the concepts. You can develop a map or model to clarify the logic within the framework. If a particular proposition or relationship is being tested, that proposition should be clearly stated. Developing a framework map and identifying the proposition(s) examined in a study connect the framework and the research purpose to the objectives, questions, or hypotheses. The concepts in the framework need to be linked to the study variables and are used to conceptually define the variables. Heo et al. (2007, p. 17) clearly identified the framework of their study as the Wilson and Cleary’s (1995) HRQOL model that was included in their research report (Figure 25-1). The variables were conceptually and operationally defined and presented in a table that is included later in this chapter.
Methods
The methods section of a research report describes how the study was conducted. This section needs to be concise yet provide sufficient detail for nurses to critically appraise or replicate the study procedures. In this section you will describe the study design, sample, setting, methods of measurement, and data collection process. If the research project included a pilot study, briefly describe the planning, implementation, and results obtained from the pilot study. You will also describe any changes made in the research project based on the pilot study (Pyrczak & Bruce, 2005).
Design: The study design and level of significance (0.05, 0.01, or 0.001) selected are identified in the research report. If your design includes a treatment, your report needs to describe the treatment, including the protocol for implementing the treatment, training of people to implement the protocol or interventionalists, and a discussion of the consistency of administration of the treatment (Santacroce Maccarelli, & Grey, 2004). The reliable and competent implementation of an experimental treatment is referred to in the literature as intervention fidelity. Intervention fidelity includes two core components: (1) adherence to the delivery of the prescribed treatment behaviors, session, or course and (2) competence in the researcher or interventionalist’s skillfulness in delivering the intervention (Stein et al., 2007). Santacroce et al. (2004) and Stein, Sargent, and Rafaels (2007) provided detailed directions to promote intervention fidelity in a variety of quasi-experimental studies and clinical trials.
A complex study design might be presented in a table or figure, such as the examples provided in Chapter 11. Heo et al. (2007, p. 17) implemented a comparative descriptive design to address aim or objective 1 of their study: “(1) compare physical, psychologic, and social variables in older adults with heart failure with those in healthy older adults.” They used a predictive design to address objective 2: “(2) determine the best model predicting HRQOL in each group from among the physical, psychologic, and social variables” (Heo et al., 2007, p. 17). Thus, the researchers implemented a combined comparative descriptive and predictive design to accomplish the aims of their study.
Sample and Setting: The research report usually describes the sampling method, criteria for selecting the sample, the sample size, and sample characteristics. It also addresses the use of power analysis to determine sample size and the subject refusal or acceptance rate. The number of subjects completing the study should be provided if it differs from the initial sample size, and the sample attrition or retention rate needs to be addressed. If your subjects were divided into groups (experimental and comparison or control groups), identify the method for assigning subjects to groups and the number of subjects in each group. The protection of subjects’ rights and the process of informed consent are also covered briefly. In a published study, the setting is often described in one or two sentences, and agencies are not identified by name unless permission has been obtained. Many researchers present the sample and setting for a study in narrative format; however, some researchers present the characteristics of their sample in a table (see Chapter 14 on sampling). Heo et al. (2007) used the heading “Sample and Setting” to introduce the following description of their sampling process:
The researchers identified the inclusion and exclusion sample criteria used to determine the target population for the study, older adults with and without heart failure. They also clearly indicated the sample size of 90 older adults with heart failure and 116 healthy older adults, but the sample size would have been strengthened if the researchers had conducted a power analysis. By identifying the refusal and attrition rates for the study, the researchers would have increased the readers’ understanding about the representativeness of the sample. The sampling method appeared to be a sample of convenience, but it was not clearly identified. This sampling method increases the potential for sampling error and decreases the ability of the researchers to generalize the study findings.
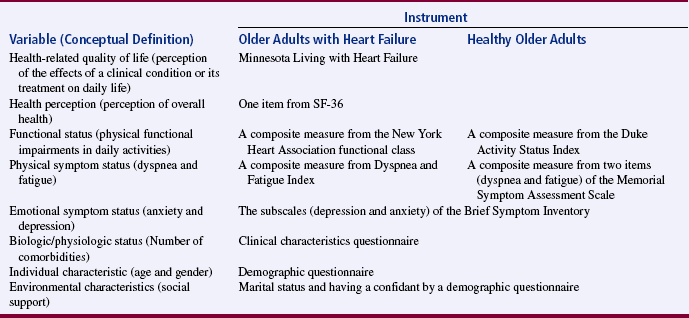
Methods of Measurement: Identifying the methods of measurement operationalizes the variables of a study. Details about the methods of measurement or instruments used in the data collection process are critical if nurses are to critically appraise and replicate a study. Your report needs to describe the information collected by each instrument, the frequency with which the instrument was used in previous research, and any reliability and validity information previously published on the instrument. In addition, your report needs to include the reliability and any further validity development for the current study. If you have used physiological measures, be sure to address their accuracy, precision, selectivity, sensitivity, and sources of error (Kerlinger & Lee, 2000; Pyrczak & Bruce, 2005). In a section titled “Measures,” Heo et al. (2007, pp. 17–19) described all of their measurement methods in detail. Each variable was clearly identified, conceptually defined to link it to the framework, and operationally defined to indicate the measurement methods used. The conceptual and operational definitions (instruments used) were clearly presented in a table (Table 25-2). These researchers provided an excellent link of the framework to the methodology of their study.
Data Collection Process: The description of the data collection process in the research report details who collected the data, the procedure for collecting data, and the type and frequency of measurements obtained. In describing who collected the data, your report needs to specify the experience of the data collector and any training provided. If more than one person collected data, describe the precautions taken to ensure consistency (Pyrczak & Bruce, 2005).
Heo et al. (2007) detailed their data collection process in a section of their report titled “Procedure,” which is presented in the following excerpt. The data collection process is clear and concise and indicates institutional review board approval, subjects’ informed consent, use of trained data collectors, and quality collection of data for each study variable.

Institutional review board approval was obtained for the conduct of this study. Eligible older adults with heart failure were identified by trained nurse research assistants, and those who gave written, informed consent to participate in the study were included. All data on HRQOL, health perception, functional status, physical symptom status, emotional symptom status, biologic/physiologic status, individual characteristics, and environment characteristics (social support) were collected by nurse research assistants after hospital discharge [Table 25-2]. Eligible healthy older adults were identified by investigators among older adults who appeared at three senior centers. Investigators explained the research purpose and procedures, obtained informed consent, and answered participants’ questions. All gave written, informed consent. Questionnaires were completed at the senior centers [Table 25-2].
Completion of instruments required 30 to 45 minutes, and trained research nurses were available to assist both older adults with heart failure and healthy older adults. In addition, the instruments were checked to make sure participants did not inadvertently leave any items unanswered. Participants were free to leave items unanswered. (Heo et al., 2007, p. 20)
Results
The results section reveals what you learned from your study and includes the data analysis procedures, the results generated from these analyses, and sometimes the effect size achieved (Kraemer & Thiemann, 1987). The results section is best organized by the research objectives, questions, or hypotheses if stated in the study and, if not, by the study purpose. Heo et al. (2007) provided an excellent description of the analysis techniques used to obtain their results, and they organized their results by characteristics of the sample and the two research aims or objectives.
Research results can be presented in narrative format and organized into figures and tables. The methods used to present the results depend on the end product of your data analysis and your own preference. When reporting results in a narrative format, include the value of the calculated statistic, the number of degrees of freedom, and probability or p value. When reporting nonsignificant results, include the power level for that analysis so that others will be able to evaluate the risk of a type II error (Kraemer & Thiemann, 1987).
The Publication Manual of the American Psychological Association (American Psychological Association [APA], 2001) provides direction for citing a variety of statistical results in a research report. For example, the format for reporting chi-square results is χ2 (degrees of freedom, sample size) = statistical value, p value. For example, a chi square value might be presented in the following format in the text of a research report: χ2 (4, N = 90) = 11.14, p = 0.025. Statistical values need to be reported with two decimal digits of accuracy; for example, reporting the χ2 value as 11.14 is more accurate than reporting it as 11.1 (APA, 2001). Heo et al. (2007) presented their results in narrative and table formats. Some of these results are represented in the next section as example tables.
Presentation of Results in Figures and Tables: Figures and tables are used to present a large amount of detailed information concisely and clearly. Researchers use figures and tables to demonstrate relationships, document change over time, and reduce the amount of discussion needed in the text of the report (APA, 2001; Nicol & Pexman, 2003). However, figures and tables are useful only if they are appropriate for the results generated and are well constructed (Wainer, 1984). Table 25-3 provides guidelines for developing accurate and clear figures and tables for a research report. More extensive guidelines and examples for the development of tables and figures for research reports can be found in the Publication Manual of the American Psychological Association (APA, 2001) and Nicol and Pexman’s books for creating tables (1999) and figures (2003).
TABLE 25-3
Guidelines for Developing Tables and Figures in Research Reports
1. Examine the results obtained from a study, and determine what results are essential to include in the report. Determine which results are best conveyed in figure and table format.
2. Use figures and tables to explain or support only the major points of the report. Using too many figures and tables can overwhelm the rest of the report, but a few receive attention and are effective in conveying the main results. Statistically nonsignificant findings are not usually presented in tables.
3. Keep the figures and tables simple; do not try to convey too much information in a single table. Two simple tables are better than one complex one.
4. Tables and figures should be complete and clear to the reader without referring to the text.
5. Each table and figure needs a clear, brief title.
6. Tables and figures are numbered separately and sequentially in a report. Thus, a report might have a Table 1 and Table 2 and a Figure 1 and Figure 2.
7. The headings, labels, symbols, and abbreviations used in figures and tables need to be appropriate, clear, and easy to read. Any symbols and abbreviations used need to be explained in a note included with the table or figure.
8. Probability values need to be identified with actual p values or with asterisks. If asterisks are used, a single asterisk is used for the least stringent significance level and two or more asterisks for increased stringent significance, such as *p < 0.05, **p < 0.01, and ***p < 0.001.
9. Figures and tables need to be referred to in the written text, such as “Table 3 presents…” or “(see Figure 1).” Figures and tables also need to be placed as close as possible to the section of the text where they are discussed (APA, 2001; Nicol & Pexman, 1999, 2003; Pyrczak, 1999; Pyrczak & Bruce, 2005; Wainer, 1984).
Figures: Figures or illustrations provide the reader with a picture of the results. Researchers often use computer programs to generate a variety of sophisticated black-and-white and color figures. Some common figures included in nursing research reports are bar graphs and line graphs. Bar graphs can have horizontal or vertical bars that represent the size or amount of the group or variable studied. The bar graph is also a means of comparing one group with another. Jenkins and Ahijevych (2003) conducted a study to describe nursing students’ beliefs about cigarette smoking, their own smoking behaviors, as well as their knowledge and use of evidence-based tobacco treatment interventions for patients. The researchers compared the smoking cessation counseling frequency (all, most, some, and none) by smoking status (smoker and nonsmoker) and presented their results in a vertical bar graph (Figure 25-2). The figure indicates that nonsmokers are more likely to counsel patients all of the time about smoking cessation than smokers.
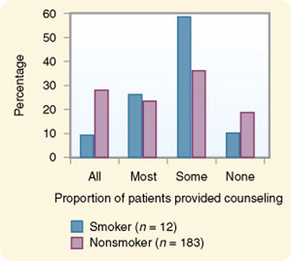
Figure 25-2 Nursing students’ self-reported frequency of smoking cessation counseling in percentage by frequency category and student’s smoking status (n = 195).
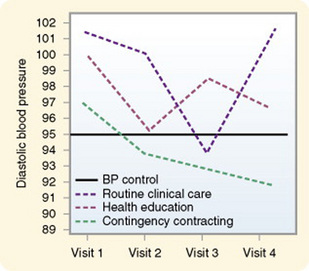
A line graph is developed by joining a series of points with a line and shows how something varies over time. In this type of graph, the horizontal scale is used to measure time, and the vertical scale is used to measure number and quantity (Nicol & Pexman, 2003). A line graph figure needs at least three data points over time on the horizontal axis, and four data points is stronger to show a trend. However, probably no more than 10 data points should be included on a single line on a graph, and there should be no more than four lines per graph. Figure 25-3 is a line graph developed by Swain and Steckel (1981, p. 219) to trend the effects of two treatments (health education and contingency contracting) and standard care (routine clinical care) on patients’ diastolic blood pressure over four home health visits. Figure 25-3 is well constructed because it includes four data points per line (mean diastolic blood pressures at four visits) and three lines representing the study groups (routine clinical care, health education, and contingency contracting) being examined for blood pressure differences. The discussion of this graph indicated that blood pressure for the three groups differed significantly (F = 3.39, p < 0.05), with the contingency contracting group demonstrating the greatest drop in diastolic blood pressure.
Tables: Tables are used more frequently in research reports than figures and can be developed to present results from numerous statistical analyses. In tables, the results are presented in columns and rows so that the reader can review them easily. The sample tables included in this section present means, standard deviations, t values, chi-square values (χ2), Mann-Whitney U values (Z), correlations (r), and regression analysis (R) results. The study variables’ means and standard deviations should be included in the published study because of their importance to future research. A variable’s mean and standard deviation are essential for (1) providing a basis for comparison across studies, (2) calculating the effect size to determine sample size for future studies, and (3) conducting future meta-analyses (Kraemer & Thiemann, 1987).
Heo et al. (2007) presented the results of their study about HRQOL for older adults with and without heart failure in four tables, and three are included in this chapter. Table 25-4 compares the two groups on individual characteristics (demographic variables) and biological/physiological status. The table includes means and standard deviations (SDs) for variables measured at the interval or ratio level (age, education in years, and number of comorbidities) and frequencies and percentages (%) for variables measured at the nominal level (sex, marital status, and living arrangements). The two groups were compared for differences on selected variables using t-test (t) (variables measured at interval or ratio level), Mann-Whitney U (Z) (variables measured at ordinal level), and chi-square (χ2) (variables measured at nominal level). Nonsignificant results (p > 0.05) between the two groups on age, marital status, and living arrangements indicate the groups are comparable in these areas. It is expected that the older adults with heart failure would have significantly more comorbidities (p < 0.001) than the healthy adults; however, the significant differences for education (p < 0.001) and sex (p < 0.001) are unexpected. Researchers desire their groups to be comparable on demographic variables, so any differences found between the groups on study variables are less likely to be due to basic demographic differences.
TABLE 25-4
Comparison between Older Adults with Heart Failure and Healthy Older Adults in Individual Characteristics and Biological/Physiological Status
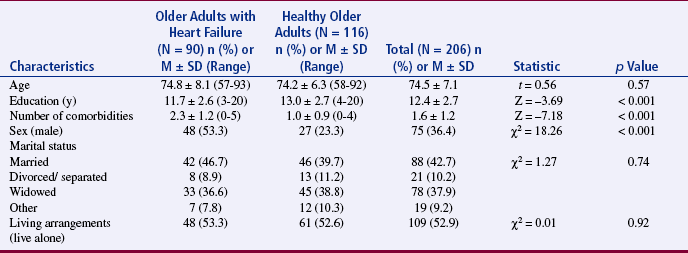
From Heo, S., Moser, D. K., Lennie, T. A., Zambroski, C. H., & Chung, M. L. (2007). A comparison of health-related quality of life between older adults with heart failure and healthy older adults. Heart & Lung, 36(1), 19.
Heo et al. (2007) conducted a Mann-Whitney U (Z) analysis to address aim or objective 1 to determine differences in two groups for HRQOL, health perception, functional status, physical status, emotional symptoms status (anxiety and depression), and social support (Table 25-5). Older adults with heart failure reported significantly poorer HRQOL, health perceptions, functional status, physical symptoms status, anxiety, and depression than healthy older adults, with p < 0.001. Only social support was not significantly different for the two groups (p = 0.661). The results stress the increased needs of individuals with heart failure and the need to develop evidence-based interventions to manage these needs.
TABLE 25-5
Comparison between Older Adults with Heart Failure and Healthy Older Adults in Health-Related Quality of Life, Health Perception, Functional Status, Physical Symptom Status, Emotional Symptoms Status, and Social Support.
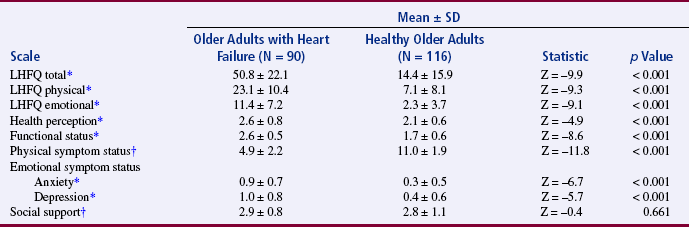
LHFQ, Minnesota Living with Heart Failure; SD, standard deviation.
*Higher scores indicate poor status.
†Higher scores mean better status.
From Heo, S., Moser, D. K., Lennie, T. A., Zambroski, C. H., & Chung, M. L. (2007). A comparison of health-related quality of life between older adults with heart failure and healthy older adults. Heart & Lung, 36(1), 21.
McKenna, Maas, and McEniery (1995) examined coronary risk factors before and after percutaneous transluminal coronary angioplasty (PTCA). Table 25-6 presents the results of this study, including descriptive statistics (means, standard deviations, and frequencies) and inferential statistics (t-test and chi-square). The t-test was used to analyze ratio-level data (serum cholesterol, body mass index, and number of cigarettes per day) and chi-square (χ2) to analyze nominal data (exercising and smoking habits). In this table, the statistical results are followed by an asterisk, with one asterisk (*) representing results that are significant at p < 0.05 and two asterisks (**) representing results significant at p < 0.001 (see the key below Table 25-6). McKenna et al. (1995, p. 219) noted that “at post-PTCA follow-up, significant improvements had occurred in mean serum cholesterol levels, mean body mass index, and the number of subjects engaging in regular exercise (p < 0.001). … But the frequency of patients smoking after PTCA increased significantly (p < 0.001).”
TABLE 25-6
Central Tendency, Variability, and Frequencies with Corresponding Statistics for Risk Factors Pre-Ptca and at Follow-Up
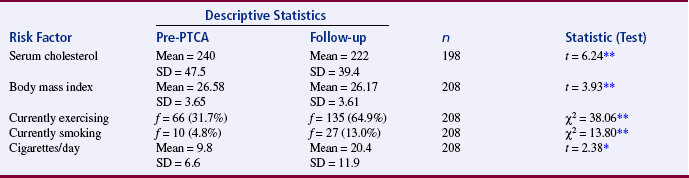
PTCA, Percutaneous transluminal coronary angioplasty; SD, standard deviation.
*p < 0.05.
**p < 0.001.
From McKenna, K. T., Maas, F., & McEniery, P. T. (1995). Coronary risk factor status after percutaneous transluminal coronary angioplasty. Heart & Lung, 24(3), 210.
Tables are used to identify correlations among variables, and often the table presents a correlational matrix generated from the data analysis. The correlational matrix indicates the correlational values obtained when examining the relationships between variables, two variables at a time (bivariate correlations). The table also includes information about the significance of each correlational value. Evangelista, Doering, and Dracup (2003) conducted a study of the sense of meaning and life purpose from the perspective of women recovering from a heart transplant. One of the questions from their study was “What is the relationship between level of meaning, life purpose, and psychological distress in women after heart transplantation?” (Evangelista et al., 2003, p. 250). These researchers presented their results in a correlational matrix, shown in Table 25-7. The five variables (meaning, life purpose, anxiety, depression, and hostility) are listed horizontally across the top of the table and vertically down the left side of the table. The relationship of variable 1 Meaning with itself (Meaning) is 1.000. A variable that is correlated with itself results in a perfect positive relationship (r = 1.000). Variable 1 Meaning is correlated with variable 2 Life Purpose with r = 0.353*. The asterisk (*) indicates that this correlation is significant at p < 0.05. Thus, the table identifies the correlational values between the variables and the significance of each of these values. Evangelista et al. (2003) described their table in the text of their article in the following way.
TABLE 25-7
Correlational Matrix for the Key Variables (N = 33)
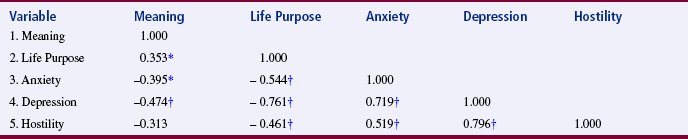
*p < 0.05.
†p < 0.001.
From Evangelista, L. S., Doering, L., & Dracup, K. (2003). Meaning and life purpose: The perspectives of post-transplant women. Heart & Lung, 32(4), 253.
Heo et al. (2007, p. 17) conducted a stepwise regression (R) to address aim or objective 2 in their study “to determine the best model predicting HRQOL in each group from among the physical, psychologic, and social variables.” The researchers found “In older adults with heart failure, physical symptom status, age, and one of the emotional symptom status, anxiety, were associated with HRQOL (F [3, 86] = 25.05, p < 0.001)” (Heo et al., 2007, pp. 20–21). The results from the regression analysis are presented in Table 25-8. The table clearly presents the variables included in the regression analysis, the beta (R) result for each variable (physical symptoms status, age, and anxiety), the unique R2 (percentage of variance of HRQOL explained by each variable), and the accumulated R2 (0.466 or 46.6% variance explained of HRQOL by the three variables). An analysis of variance (ANOVA) was conducted to determine significance and the result and p value are provided (see Table 25-8).
TABLE 25-8
Models Best Associated with Health-Related Quality of Life in Older Adults with Heart Failure (N = 90)
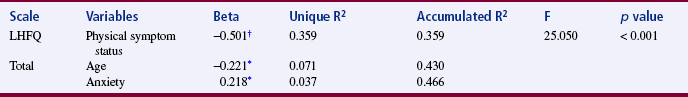
LHFQ, Minnesota Living with Heart Failure Questionnaire.
Beta = standardized slope coefficient.
*p < 0.05.
†p < 0.001.
From Heo, S., Moser, D. K., Lennie, T. A., Zambroski, C. H., & Misook, L. C. (2007). A comparison of health-related quality of life between older adults with heart failure and healthy older adults. Heart & Lung, 36(1), p. 21.
Discussion
The discussion section ties the other sections of your research report together and gives them meaning. It includes your major findings, limitations of the study, conclusions drawn from the findings, implications of the findings for nursing, and recommendations for further research. Your major findings, which are generated through an interpretation of the results, should be discussed in relation to the research problem; purpose; and objectives, questions, or hypotheses (if applicable). Frequently, a study’s findings are compared with the findings from previous research and are linked to the study’s framework and the existing theoretical knowledge base. Discussion of the findings also includes the limitations that you identified in the proposal and while conducting the study. For example, a study might have limitations related to sample size, design, or instruments. These limitations influence the generalizability of the findings (Kerlinger & Lee, 2000; Pyrczak & Bruce, 2005).
The research report includes the conclusions or the knowledge generated from the findings. Conclusions are frequently stated in tentative or speculative terms because one study does not produce conclusive findings (Tornquist, Funk, & Champagne, 1989). You might provide a brief rationale for accepting certain conclusions and rejecting others. The conclusions need to be discussed in terms of their implications for nursing knowledge, theory, and practice. Describe how the findings and conclusions might be implemented in specific practice areas. Conclude your research report with recommendations for further research. Identify specific problems that require investigation, and describe procedures for replicating the study. The discussion section of the research report demonstrates the value of conducting the study and stimulates the reader to conduct additional research that is needed to provide evidence-based practice (Craig & Smyth, 2007; Melnyk & Fineout-Overholt, 2005).
Heo et al. (2007) linked their study findings with those from previous research, identified the limitations of their study, formed conclusions, indicated areas for future research, and made recommendations for practice. The researchers concluded:
Despite marked differences in physical, psychologic, and HRQOL status between the two groups [healthy older adults and older adults with heart failure] physical symptom status was the variable most strongly related to HRQOL in both groups. Both health care providers and patients who often dismiss negative symptomology as normal signs of aging need to be aware that they are not so appropriate intervention can be undertaken. (Heo et al., 2007, p. 23)
The complete research report for this study can be accessed through CINAHL or is available online at www.heartandlung.org for registered users. We recommend you review the study to increase your understanding of the content and organization of a quantitative research report.
The final aspect of the research report is the reference list, which includes all sources that were cited in the report. Most of the sources in the reference list are relevant studies that provided a knowledge base for conducting the study (O’Neill & Duffey, 2000). These sources need to have complete citations that are recorded in a consistent manner, which is APA format for many nursing journals. The Publication Manual of the American Psychological Association (APA, 2001) is in its fifth edition, and Russell and Aud (2002) summarized the key changes that have occurred since the fourth edition. Sources also need to be cited in the text of the report using a consistent format, such as APA (2001). It is also important to follow the format guidelines of the journal the researchers plan to submit their manuscript to for publication.
Qualitative Research Report
Reports for qualitative research are as diverse as the different types of qualitative studies. (The different types of qualitative research are presented in Chapter 4, and results from specific qualitative studies are presented in Chapter 23.) The intent of a qualitative research report is to describe the flexible, dynamic implementation of the research project and the unique, creative findings obtained (Boyd & Munhall, 2001; Marshall & Rossman, 2006; Munhall, 2001; Patton, 2002). Table 25-9 provides guidelines for developing a qualitative research report. Like the quantitative report, a qualitative research report needs a clear, concise title that identifies the focus of the study. A study by Wright (2003, p. 173) titled “A Phenomenological Exploration of Spirituality among African American Women Recovering from Substance Abuse” is used as an example in presenting the aspects of a qualitative research report.
TABLE 25-9
Outline for a Qualitative Research Report
Introduction
Identification of the phenomenon to be studied
Identification of the aim or purpose of the study
Identification of the study questions
Identification of the qualitative approach used to conduct the study
Discussion of the significance of the study to nursing
Evolution of the study (sometimes a subheading under the introduction or a separate section)
Methods
Methods of Inquiry: General
Introduction to the specific method (phenomenology, historical, grounded theory, or ethnographical) used to conduct the study
Discussion of the background, philosophy, and assumptions for this method with documentation
Provision of a rationale for choosing this method
Discussion of the general steps, procedures, and outcomes for this method with documentation
Methods of Inquiry: Applied in this Study
Demonstration of the researcher’s credentials for conducting a particular type of qualitative study
Results or Findings of the Inquiry
Description of the data analysis procedures based on the method selected
Presentation of results or findings based on the method used to conduct the study (e.g., experiential themes and the essence of the lived experience is provided in a phenomenological study, a theory grounded in study data would be developed with grounded theory research, a detailed narrative of a cultural event is developed with ethnographical research, and a detailed description of a historical event evolves with historical research)
Discussion
Discussion of findings and relevant literature
Presentation of conclusions and the meanings and understandings developed by the study
Identification of study limitations
Discussion of the relevance of the study
Discussion of the implications for nursing
Recommendations for further research (Boyd & Munhall, 2001; Marshall & Rossman, 2006; Munhall, 2001; Patton, 2002)
References
Include references cited in the report
Use the format indicated by the journal guidelines, which is often the APA (2001) format
The abstract for a qualitative research report briefly summarizes the key parts of the study and usually includes the following: (1) aim of the study; (2) evolution of the study; (3) general method of inquiry used (such as phenomenology, grounded theory, ethnography, or historical); (4) brief overview of the method of inquiry applied in the study, including sample, setting, and methods of data collection; (5) brief synopsis of findings; and (6) reflection on the findings (Boyd & Munhall, 2001). Detailed guidelines for developing an abstract for a qualitative study are presented later in this chapter. The abstract for Wright’s (2003) study follows.
Wright’s abstract (2003) clearly identifies the aim of the study, the type of study conducted (phenomenological), the method used for the investigation (Giorgi), the population (African-American women), and the sample size (15). The abstract might have been expanded to include more detail about the study results and findings. Following the abstract, qualitative research reports usually include four major sections: introduction, methods, results, and discussion. The content included in each of these sections is identified in Table 25-9 and presented next.
Introduction
The introduction section of the report identifies the phenomenon under investigation and specifies the type of qualitative study that was conducted. The study aim or purpose and specific research questions flow from the phenomenon, clarify the study focus, and identify expected outcomes of the investigation. You will use the introduction to describe the significance of the study topic to nursing knowledge and practice, using documentation from the literature. The evolution of the study is described to provide a context for the phenomenon studied. Provide a rationale for conducting the study, and place the study in a historical and an experiential context. The historical context provides a historical basis for the study and situates the study in a period of time. The experiential context presents your involvement in experiencing and understanding the phenomenon under study (Boyd & Munhall, 2001).
Some qualitative studies include a brief literature review in the introduction or a separate section of the report. Other studies include a review of literature only in the discussion of findings. The following text was abstracted from the introduction of Wright’s (2003) phenomenological study of spirituality and recovery from substance abuse in African-American women. The complete article can be accessed through CINAHL or found online at www.psychiatricnursing.org for registered users.
Reports in the literature indicate that recovery from substance abuse is a complex multidimensional process that occurs both with and without expert assistance. … Although studies conducted with women have increased within the last decade, those conducted may not be generalized to African American women. … Spirituality has often been noted in the healthcare literature to affect recovery. … Spirituality is considered to be the cornerstone of activities with the African American community (Jackson, 1995). … A phenomenological understanding of all that spirituality may represent to African American women is relevant to the recovery process from substance abuse. …
A qualitative phenomenological research study was designed to explore the essential elements of the lived experience of spirituality among African American women recovering from substance abuse, and to describe the meanings made of this phenomenon by the person experiencing it. (Wright, 2003, pp. 173–174)
Methods
The methods section includes two parts: general methods of inquiry and the applied or specific methods of inquiry used in the study (see Table 25-9). The general methods section includes the specific qualitative method (such as phenomenology, grounded theory, ethnography, or historical) used to conduct the study and provides a background of that qualitative method. The philosophical basis for and the assumptions of the qualitative method are provided and documented from the current literature. The methodology steps used to conduct a qualitative study vary based on the philosophical basis of the study, the topic studied, and the experiences of the researcher conducting the study. When developing a report of a qualitative study, you need to discuss the steps of the qualitative method, the procedures, and the outcomes, and provide a rationale for selecting this qualitative method to guide your investigation (Boyd & Munhall, 2001; Marshall & Rossman, 2006). Wright (2003) described the qualitative method used to conduct her investigation in the following way.
Philosophical Perspective. The perspectives of Frankl (1984) provide the conceptual orientation for this study, whereas direction for data analyses was provided by the procedural steps of Giorgi’s (1985) method. … The underpinnings of Frankl’s work stresses individual’s freedom to transcend suffering and find meaning in life regardless of his circumstances. The substance abuser often looks on his existence as meaningless and without purpose. … Frankl’s (1984) work is based on empirical or phenomenological analysis, which was described as the way in which man understands himself, and how he interprets his own existence [philosophical basis and assumptions for method]. …
Phenomenology was chosen as the methodology for this study, in that it describes the world as it is experienced before any theories being devised to explain it. The aim of phenomenology in nursing research is to describe the experience of others so that those who care for these individuals may be more empathetic and understanding of the person’s experience [method chosen and rationale for using this method]. …
This study followed the core processes of phenomenology and the four steps outlined in Giorgi’s (1985) method, which are as follows: (1) The researcher reads the entire description of the learning situation obtained from the participants to get a sense of the whole statement; (2) next, once a sense of the whole has been grasped, the researcher rereads the same description more slowly with specific intent of discriminating “meaning units” from within a psychological perspective and with a focus on the phenomenon of interest; (3) once the “meaning units” have been delineated, the researcher then goes through all of the “meaning units” and expresses the psychological insight contained in them more directly; … (4) finally, the researcher synthesizes the transformed meaning units [steps of the method used to analyze data and determine outcomes]. (Wright, 2003, pp. 174–176)
In the applied methods section, you will document your credentials for conducting the study. This documentation is valuable in determining the worth of the study because the researcher serves as a primary data-gathering instrument and the data analyses occur within the reasoning processes of the researcher (Patton, 2002). In the report of your qualitative study, you will describe the site and participants selected for the study. Your unique role as the researcher is also detailed, including training of project staff, entry into the setting, selection of participants, and ethical considerations extended to the participants during data collection and analysis (see Table 25-9).
The data collection process is time consuming and complex. The research report includes a description of the variety of data collection tools used, such as observation guides, open-ended interviews, direct participation, documents, life histories, audiovisual media (photographs, DVDs, videos, or audiotapes), biographies, and diaries (Knafl & Howard, 1984; Leininger, 1985; Patton, 2002). The flexible, dynamic way in which the researcher collects data is described, including the time spent collecting data, how data were recorded, and the amount of data collected. For example, if your data collection involved participant observation, you must describe the number, length, structure, and focus of the observation and participation periods. In addition, you will identify the tools (such as audiotapes or DVDs) for recording the information gained from these periods of observation and participation. Wright (2003) described the methods applied in her study in the following way.
The number of participants was determined by the number of persons required to permit an in-depth exploration and obtain a clear understanding of the phenomenon of interest from various perspectives. This occurred with 15 participants when data saturation was achieved, with no new themes or essences emerging from the participants and the data were repeating. Participants were recruited from a women’s shelter with the help of a colleague as contact person, from church support groups within the community by the researcher who made church members aware of the study and the search for participants, and through networking, whereby each participant interviewed suggested the name of a potential new participant [participant selection].
Each participant met the following criteria: over 18 years of age; identified herself as an African American woman; substance free status for at least 1 year; … and was able to read and write in the English language.
There were 15 participants who ranged from 29 to 49 years of age. … With respect to abstinence eight participants reported 7–12 years of drug free status, and seven having 15–39 months of substance free status [description of the sample]. …
… The purpose of the study was explained and informed consent obtained. All participants were interviewed in their homes or the shelter with each interview being audiotaped and lasting 45 to 90 minutes. …
Although Giorgi’s (1985) phenomenological analysis does not rely on peer debriefing, to establish qualitative rigor, notes were recorded after each interview regarding the process, feelings, and experiences of the researcher elicited by the interview. In this study during each interview the researcher was genuinely interested in participant’s experience and listened honestly to their descriptions. This journaling ensured bracketing or the suspension of presuppositions on the part of the researcher. (Wright, 2003, pp. 176–177)
Results
The results section of the research report includes data analysis procedures and presentation of the findings. The data, in the form of notes, tapes, and other materials from observations and interviews, must be synthesized into meaningful categories or organized into common themes by the researcher. The data analysis procedures (content, symbolic, structural, interactional, philosophical, ethnographical, phenomenological, semantic, historical, inferential, grounded theory, perceptual, and reflexive) are performed during and after the data collection process (Leininger, 1985; Marshall & Rossman, 2006; Miles & Huberman, 1994; Munhall, 2001; Patton, 2002). These analysis procedures and the process for implementing them are described in Wright’s (2003) research report.
Present your results in a manner that clarifies for the reader the phenomenon under investigation. These results include gestalts, patterns, and theories that are developed to describe life experiences, cultures, and historical events, which are frequently expressed in narrative format. Sometimes, these theoretical ideas are organized into conceptual maps, models, or tables. Researchers often gather additional data or reexamine existing data to verify their theoretical conclusions, and this process is described in the report (Marshall & Rossman, 2006; Miles & Huberman, 1994). Some qualitative study findings lack clarity and quality, which makes it difficult for practitioners to understand and apply them. Some of the problems with qualitative study findings are misuse of quotes and theory, lack of clarity in identifying patterns and themes in the data, and misrepresentation of data and data analysis procedures in the report (Sandelowski & Barroso, 2002). Researchers must clearly and accurately develop their findings and present them in a way that a diverse audience of practitioners and researchers can understand. Wright (2003) presented her study results in tables and narrC
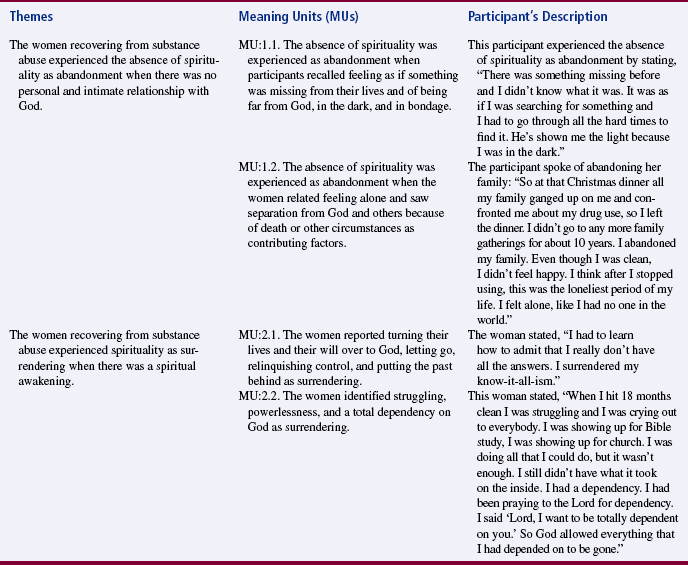
Five major themes were formulated from the narratives [Table 25-10]. Each of these themes has supporting themes that have been extrapolated from the narratives. A typology of the themes and supporting themes [was] created. These themes and supporting theme clusters were not exclusive or isolated experiences but represent aspects of the participants’ experiences, which sometimes are interwoven or overlap. Two examples of the themes and supporting themes, are described in [Table 25-11] to provide the reader with information about activities during the process of formulating naïve-meaning units to main themes, which emerged as the essence or meaning structure. Each of the themes is presented with supporting verbatims to substantiate the researcher’s process in identification of themes and for the reader to grasp a full understanding of the participant’s experience. (Wright, 2003, pp. 177–178)
TABLE 25-10
Major Themes from the Participants’ Narratives
1. The absence of spirituality was experienced as abandonment when there was no personal and intimate relationship with God.
2. Spirituality was experienced as surrendering when there was a spiritual awakening.
3. The women recovering from substance abuse experienced spirituality as reconnecting when there was recognition, a realignment, and engagement with God, self, and community.
4. Spirituality was experienced as transformation when the women were able to transcend substance abuse and other difficulties and focus on restoration and growth toward new horizons.
5. Spirituality was experienced as maturation when there was attainment of newness in life.
From Wright, V. L. (2003). A phenomenological exploration of spirituality among African American women recovering from substance abuse. Archives of Psychiatric Nursing, 17(4), 177.
Discussion
The discussion section includes conclusions, study limitations, implications for nursing, and recommendations for further research. The conclusions are a synthesis of the study findings and the relevant theoretical and empirical literature. Limitations are often identified and their influence on the formulation of the conclusions is addressed. Conclusions include the study aim and the research questions, which were used to guide the conduct of the study. Implications of the findings for nursing practice and theory development are explored, and suggestions are provided for further research (Boyd & Munhall, 2001; Patton, 2002). Wright (2003) formed conclusions with support from the relevant literature, identified study limitations, and provided implications for practice. She provided limited direction for further research.
Theses and Dissertations
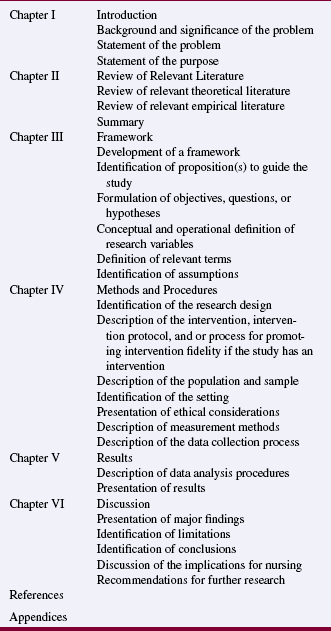
Theses and dissertations are research reports that students develop in depth as part of the requirements for a degree. The content included in a thesis or dissertation depends on the university requirements, the nursing college or school’s research guidelines, and the members of the student’s research committee. Most theses and dissertations are organized by chapters, and the usual chapters and content for quantitative and outcomes studies are presented in Table 25-12. A thesis or dissertation that involves a qualitative study would include sections or chapters similar to those in Table 25-9.
AUDIENCES FOR COMMUNICATION OF RESEARCH FINDINGS
Before developing a research report, you need to determine who will benefit from knowing the findings. The greatest impact on nursing practice can be achieved by communicating nursing research findings to a variety of audiences, including nurses, other health professionals, health care consumers, and policy makers. Nurses, including administrators, educators, practitioners, and researchers, must be aware of research findings for communication in academic programs, for use in practice, and as a basis for conducting additional studies. Other health professionals need to be aware of the knowledge generated by nurse researchers and facilitate the use of that knowledge in the health care system as part of the delivery of evidence-based practice (Craig & Smyth, 2007). Consumers are interested in the outcomes produced by nursing interventions that have been tested through research. Policy makers at the local, state, and federal levels use research findings to generate health policy that will have an impact on consumers, individual practitioners, and the health care system (Brown, 1999).
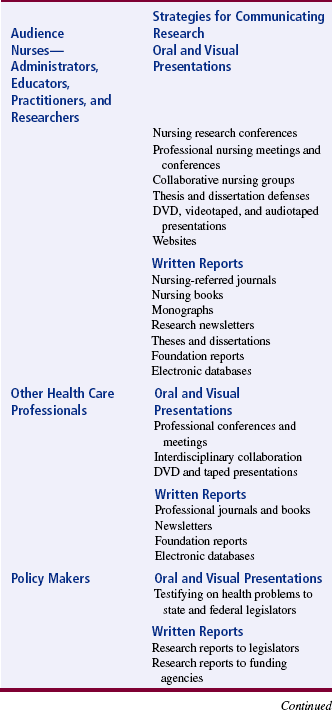
Strategies for Communicating Research to Different Audiences
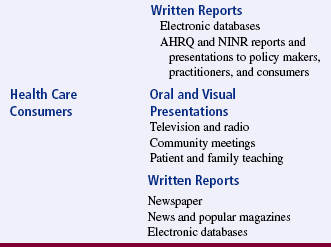
Research findings can be communicated through written reports in hard copy or electronic format and by oral and visual presentations. Table 25-13 outlines various strategies for communicating findings to nurses, health care professionals, policy makers, and consumers.
Audience of Nurses
The most common mechanisms nurses use to communicate research findings to their peers are presentations at conferences and meetings. An increasing number of nursing organizations and institutions are sponsoring research conferences. The American Nurses Association and many of its state associations sponsor annual nursing research conferences. The Western Council of Higher Education for Nursing has sponsored annual research conferences since 1968, and the proceedings from these conferences are published in a volume titled Communicating Nursing Research Findings. The members of Sigma Theta Tau, the international honor society for nursing, sponsor international, national, regional, and local research conferences. Specialty organizations, such as the American Association of Critical Care Nurses, the Oncology Nurses’ Society, and the Maternal-Child Health Nursing Association, sponsor research meetings and conferences. Many universities and some health care agencies sponsor or cosponsor research conferences. For a variety of reasons, many nurses are unable to attend research conferences. To increase the communication of research findings, conference sponsors provide audiotapes or DVDs of the research presentations. Some sponsors publish abstracts of studies with the conference proceedings or in a specialty journal or make them available electronically on their websites.
The publishing opportunities in nursing continue to escalate—the number of nursing journals published in the United States increased from 22 in 1977 (McCloskey, 1977) to 92 in 1991 (Swanson, McCloskey, & Bodensteiner, 1991). Opportunities to publish research have expanded with the growth of research journals (Advances in Nursing Science, Applied Nursing Research, Biological Research for Nursing, Clinical Nursing Research, Nursing Research, Qualitative Health Research, Research in Nursing & Health, Scholarly Inquiry for Nursing Practice: An International Journal, and Western Journal of Nursing Research) and with specialty journals publishing more studies. Heart & Lung is now 70% research publications, Maternal-Child Nursing is 75% research, and Journal of Nursing Education is 80% research (Swanson et al., 1991). The rapidly growing number of peer-reviewed electronic nursing journals also provides opportunities to publish research findings. A number of researchers communicate their findings by publishing books or chapters in books.
Many universities and hospitals publish regular newsletters or monographs that include abstracts or articles about the research conducted by their members. Foundations and federal agencies publish reports of studies that have been conducted or are in progress. The American Nurses’ Foundation publishes a newsletter, Nursing Research Report, which identifies the studies funded and includes abstracts of these studies. The National Institute for Nursing Research (NINR) publishes reports on its grants, including research project titles, names and addresses of researchers, period of support, a brief description of each project, and publication citations (www.nih.gov/ninr).
Audience of Health Care Professionals and Policy Makers
Nurse researchers communicate their research to other health professionals at meetings and conferences sponsored by such organizations as the American Heart Association, American Public Health Association, American Cancer Society, American Lung Association, National Hospice Organization, and National Rural Health Association. Nurses must believe in the value of their research and present their findings at conferences that attract a variety of health care professionals. Nurse researchers and other health professionals conducting research on the same or similar problems might join together to publish a journal article, a series of articles, a book chapter, or even a book. This type of interdisciplinary collaboration might increase the communication of research findings and the synthesis of research knowledge to promote evidence-based practice.
In 1989, the Agency for Health Care Policy and Research (AHCPR) was established to enhance the quality, appropriateness, and effectiveness of health care services and access to these services. In 1999, the AHCPR was renamed the Agency for Healthcare Research and Quality (AHRQ), which was one of the first organizations to develop and distribute evidence-based guidelines for practice. Recently, the AHRQ implemented the “Evidence-based Practice Centers (EPC) Program that includes the awarding of a 5 year contract to institutions in the United States and Canada to serve as an EPC. The EPCs review all relevant scientific literature on clinical, behavioral, and organization and financing topics to produce evidence reports and technology assessments. These reports are used for informing and developing coverage decisions, quality measures, educational materials and tools, guidelines, and research agendas. The EPCs also conduct research on methodology of systematic reviews” (AHRQ, 2007). The institutions with EPCs and the activities of these centers can be viewed online at www.ahrq.gov/clinic/epc.
Audience of Health Care Consumers
An audience that nurse researchers frequently neglect is the health care consumer. The findings from nursing studies can be communicated rapidly to the public through news releases. A nursing research article published in a local paper has the potential of being picked up by the National Wire Service and published in other papers across the United States. Nurse researchers also need to make their findings available through electronic databases. An increasing amount of health care information is being made available electronically on a variety of websites, but often this information is not based on research. There is a need to provide consumers with evidence-based guidelines and educational materials to assist them in making quality health care decisions.
Nursing research findings could be communicated to consumers by being published in news magazines, such as Time and Newsweek, or popular women’s and health magazines, such as American Baby and Health. Health articles published for consumer magazines can reach 20,000 to 24 million readers at a time (Jimenez, 1991). Television and radio are other valuable sources for communicating research findings. Currently, the findings from many medical studies are covered through these media; thus, the study findings are reaching many health care consumers and practitioners. Another important method of communicating research findings to consumers is through patient and family teaching. Nursing interventions and practice protocols based on research are more credible to consumers than are unresearched actions, with the ultimate goal being evidence-based practice (Craig & Smyth, 2007).
PRESENTING RESEARCH FINDINGS
Research findings are communicated at conferences and meetings through verbal and poster presentations. With presentations, researchers have an opportunity to share their findings, answer questions about their studies, interact with other interested researchers, and receive immediate feedback on their study. After completion of the research project, the findings are frequently presented at conferences with little delay, whereas when research findings are published, a 1- to 3-year delay in the communication process is typical.
Verbal Presentations
Researchers communicate their findings through verbal presentations at local, national, and international nursing and health care conferences. Presenting findings at a conference requires receiving acceptance as a presenter, developing a research report, delivering the report, and responding to questions.
Receiving Acceptance as a Presenter
Most research conferences require researchers to submit an abstract, and acceptance as a presenter is based on the quality of the abstract. As noted earlier, an abstract is a clear, concise summary of a study that is usually limited to 100 to 250 words (Crosby, 1990; Pyrczak & Bruce, 2005). Nine months to a year before a research conference, the sponsors circulate a call for abstracts. Many research journals and newsletters publish these calls for abstracts, and they are also available electronically. In addition, conference sponsors will e-mail and mail the calls for abstracts to universities, major health care agencies, and known nurse researchers.
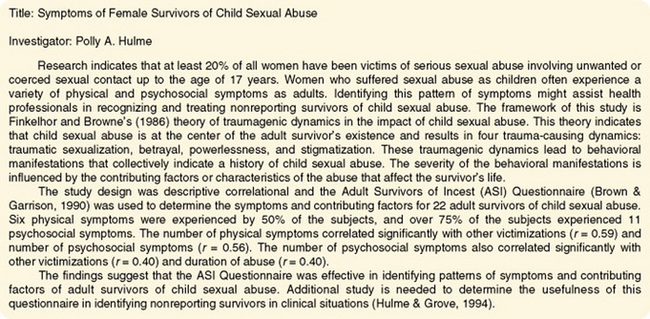
The call for abstracts will stipulate the format for the abstract. Frequently, abstracts are limited to one page, single-spaced, and include the content outlined in Table 25-14 or Table 25-15. Table 25-14 includes an outline of the content included in an abstract of a quantitative study, and Table 25-15 includes abstract content for a qualitative study (Boyd & Munhall, 2001). The title of your abstract must create interest, and the body of your abstract “sells” the study to the reviewers. An example of an abstract is presented in Figure 25-4. Writing an abstract requires practice; frequently, a researcher will rewrite an abstract many times until it meets all the criteria outlined by the conference sponsors. Cason, Cason, and Redland (1988) identified six criteria that are often used to rate the quality of an abstract: (1) acceptability of a study for a specific program; (2) overall quality of the work; (3) contribution to nursing scholarship; (4) contribution to nursing theory and practice; (5) originality of the work; and (6) clarity and completeness of the abstract, according to the content outlined in Tables 25-14 and 25-15. These criteria might assist you in developing and refining your abstract.
TABLE 25-14
Outline for Quantitative Study Abstract
I. Title of the Study
II. Introduction
III. Methodology
IV. Results
TABLE 25-15
Outline for a Qualitative Study Abstract
I. Title of the Study
II. Introduction
Identification of phenomenon to be studied
Statement of the aim of the study
Identification of the qualitative method used to conduct the study
Evolution of the study (rationale for conducting the study, historical context, and experiential context)
III. Methodology
Discussion of the background, philosophy, and assumptions for the method used to conduct the study
Brief description of the sample, setting, and data collection process
IV. Results
Developing a Research Report
The report developed depends on the focus of the conference, the audience, and the time designated for each presentation. Some conferences focus on certain sections of the research report, such as tool development, data collection and analysis, findings, or implications of the findings for nursing practice. However, it is usually important to address the major sections of a research report (introduction, methods, results, and discussion) in a presentation. The content of a presentation varies depending on whether the audience consists of mainly researchers or clinical nurses (Jackle, 1989). If you do not know who your audience is, ask the sponsors of the conference.
Time is probably the most important factor in developing a presentation because many presenters are limited to 12 to 15 minutes, with 5 minutes for questions (Selby, Tornquist, & Finerty, 1989a). As a guideline, you might spend 10% of your time on the introduction, 20% on the methodology, 35% on the results, and 35% on the discussion. Your introduction might include reasons for the study, a brief review of the literature, a simple discussion of the framework, and the research questions or hypotheses. The methodology content includes a brief identification of the design, sampling method, and measurement techniques. The content covered in the results section includes a simple rationale for the analysis methods used and the major statistical results. The presentation concludes with a brief discussion of findings, implications of the findings for nursing practice, and recommendations for future research (Miracle & King, 1994). Most researchers find that the shorter the presentation time, the greater the preparation time needed.
Many researchers develop a typed script of their study for presentation and include visuals such as PowerPoint slides and pictures. The script for the presentation needs to indicate when a visual is to be shown. The information presented on each visual should be limited to eight lines or fewer, with six or fewer words per line. Thus, a single visual should contain information that can be easily read and examined in 30 seconds or a minute (Selby Tornquist, & Finerty, 1989b). Only major points are presented on visuals, so use single words, short phrases, or bulleted points to convey ideas, not complete sentences. Figures such as bar graphs and line graphs usually convey ideas more clearly than tables do for presentations. Slides of the research setting, equipment, and researchers collecting data help the audience to visualize the research project. The use of color on a visual can increase the clarity of the information presented and can be appealing to the audience.
Preparing the script and visuals for a presentation is difficult, so enlist the assistance of an experienced researcher and audiovisual expert. Rehearse your presentation with the experienced researcher, and use his or her comments to refine your script, visuals, and presentation style. If your presentation is too long, synthesize your script and provide handouts for important content. PowerPoint slides provide an excellent format for presenting a research report; they include easy-to-read fonts, color, creative background, and visuals or pictures to clarify points. However, consulting an audiovisual expert will ensure that your materials are clear and properly constructed, with the print large enough and dark enough for the audience to read. Once the PowerPoint slides have been developed, view them from the same vantage point as the audience to ensure the visuals are clear.
Delivering a Research Report and Responding to Questions
A novice researcher might attend conferences and examine the presentation style of other researchers. Even though each researcher needs to develop his or her own presentation style, observing others can promote an effective style. The research report can be read from a script, given from an outline, or delivered with slides or transparencies. An effective presentation requires practice. You need to rehearse your presentation several times, with the script, until you are comfortable with the timing, content, and your presentation style. When practicing, use the visuals so that you are comfortable with the equipment. The presentation must be within the time frame designated by conference sponsors. Mathieson (1996) provided some practical advice for the novice presenter.
Some conferences include a presentation by the researcher, a critical appraisal of the study by another researcher, and a question period. When preparing for a presentation, try to anticipate the questions that members of the audience might ask, and rehearse your answers. You could give your presentation to colleagues and ask them to raise questions. If you practice making clear, concise responses to specific questions, you will be less anxious during the actual presentation. When giving a presentation, make notes of the audience’s questions, suggestions, or comments because they are often useful when preparing a manuscript for publication or developing the next study.
Poster Sessions
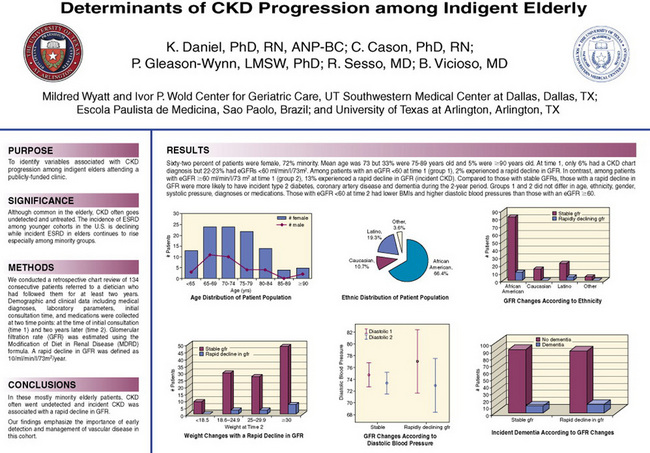
Sometimes, your research will be accepted at a conference not as a presentation but as a poster session. A poster session is a visual presentation of your study. Before developing a poster, contact the conference sponsors regarding (1) the size limitations or format restrictions for the poster, (2) the size of the poster display area, and (3) the background and potential number of conference participants. A poster usually includes the following content: the title of the study; investigator and institution names; brief abstract; purpose; research objectives, questions, or hypotheses (if applicable); framework; design; sample; instruments; essential data collection procedures; results; conclusions; implications for nursing; and recommendations for further research. For clarity and conciseness, a poster often includes pictures, tables, or figures to communicate the study. Figure 25-5 presents a quality poster developed by Dr. Kathy Daniel, a faculty member at The University of Texas at Arlington and an adult and gerontology nurse practitioner. Dr. Daniel conducted a study with other health care professions to describe the determinants of chronic kidney disease (CKD) progression among indigent elderly. This poster, which was presented at the American Nephrology Society meeting in 2007, has a polished, professional look and presents the key aspects of the study using a balance of text, figures, and color. Conference sponsors often provide boards for displaying posters, so the poster can be easily transported in a tube and rapidly displayed.
A quality poster completely presents a study yet can be comprehended in 5 minutes or less. Bold headings are used for the different parts of the research report, followed by concise narratives. The size of the print on a poster needs to be large enough to be read at 4 to 6 feet (approximately 20 to 30 font size) (Nicol & Pexman, 2003). Poster sessions usually last from 1 to 2 hours; you should remain with your poster during this time. Most researchers provide conference participants with copies of their abstract and other relevant handouts and offer to answer any questions. Websites are available to assist you with research poster development, such as http://ublib.buffalo.edu/libraries/asl/guides/bio/posters.html or www.biology.lsa.umich.edu/research/labs/ktosney/file/PostersHome.html. You can also Google “research poster” or “research poster presentation” and view additional websites to assist you in developing a poster.
Conferences include both quantitative and qualitative research posters. Russell, Gregory, and Gates (1996) reported the results of reviewing qualitative posters at conferences. One-fourth of the posters had too little information; however, many of them had too much information. Narrative content does not lend itself to the crisp presentation required on a poster. Moore, Augspurger, King, & Proffitt (2001, p. 102) noted that an effective poster must have quality in “(a) poster design and layout, (b) poster visuals, (c) poster overall aesthetics, and (d) poster content.”
The number of words on a poster of a qualitative study should be kept to a minimum. As stated previously, the size of print should allow viewers to read it easily from 4 to 6 feet. Russell et al. (1996) recommended having color-coordinated sections of the poster with written material provided in matted format. Summary and implications sections are frequently omitted in qualitative posters. This omission is a serious problem, because most viewers search for that content first. Because rich narrative text is so meaningful in qualitative studies, authors are advised to compile a notebook with additional data examples and artwork that viewers can examine. Posters usually take from 10 to 20 hours to develop based on the complexity of the study and the experience of the researcher. Novice researchers usually need more than 20 hours to develop a poster, and posters of qualitative studies often take more time. Some important points in poster development include planning ahead, seeking the assistance of others, and limiting the information on the poster (Moore et al., 2001).
An advantage of a poster session is the opportunity for one-to-one interaction between the researcher and those viewing the poster. At the end of the poster session, individuals interested in a study will frequently stay to speak to the researcher. Have a notepad on hand to record comments and the names and addresses of those conducting similar research. This occasion is an excellent opportunity to begin networking with other researchers involved in the same area of research. Sometimes, conference participants will want study instruments or other items to be mailed, faxed, or e-mailed to them, so it is essential that you keep a record of their names, addresses, fax numbers, e-mail addresses, and requests for information.
PUBLISHING RESEARCH FINDINGS
Presentations are a valuable means of rapidly communicating findings, but their impact is limited. Published research findings are permanently recorded in a journal or book and usually reach a larger audience than presentations do (Winslow, 1996). However, the research report developed for a presentation can provide a basis for writing an article for publication. Regrettably, many researchers present their findings at a conference and never submit the paper for publication. Hicks (1995) studied the publishing activities of 500 randomly selected nurses and found that only 10% submitted their studies for publication. Studies with negative findings, such as no significant differences or relationships, are frequently not submitted for presentation or publication. These negative findings can be as important to the development of knowledge as the positive findings, because they direct future research (Angell, 1989).
Publishing research findings is a rewarding experience, but the process demands a great deal of time and energy. The manuscript rejections or requests for major revisions that most authors receive can be discouraging. However, you can take certain steps to increase the probability of having a manuscript accepted for publication. While you are developing your proposal, outline your plans for publishing your study. At this time, you and other members of your research team should discuss and, if possible, determine authorship credit. This issue becomes complex when the research is a collaborative project among individuals from different disciplines. Some researchers develop the entire manuscript and are then faced with the decision of who will be first, second, or third author. There are many ways to determine authorship credit, but the decision should be acceptable to all investigators involved (Nicol & Pexman, 2003). Authorship credit should be given only to those who made substantial contributions to developing and implementing a study and in writing the final report (Duncan, 1999).
Publishing Journal Articles
Developing a manuscript for publication includes the following steps: (1) selecting a journal, (2) developing a query letter, (3) preparing a manuscript, (4) submitting the manuscript for review, and (5) revising the manuscript.
Selecting a Journal
Selecting a journal for publication of your study requires knowledge of the basic requirements of the journal, the journal’s refereed status (see the next paragraph), and recent articles published in the journal. Swanson et al. (1991) studied publishing opportunities for nurses by surveying 92 U.S. nursing journals. The authors provided, in table format, the following basic information on each journal: circulation; number of issues published each year; article length; number of copies of the manuscript to be submitted; format for the manuscript; query letter; free reprints; and the percentage of staff-written, unsolicited, and research manuscripts published. The article also reported the number of unsolicited manuscripts received, the number of unsolicited manuscripts published, the number of manuscripts rejected, the percentage of manuscripts accepted, the refereed status, the review process, the time for acceptance, and the time until publication (Swanson et al., 1991, p. 35). Table 25-16 presents some essential publishing information for five research journals included in this survey.
TABLE 25-16
Publishing Information for Selected Research Journals
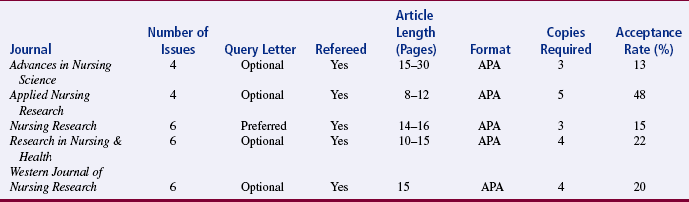
Adapted from Swanson, E. A., McCloskey, J. C., & Bodensteiner, A. (1991). Publishing opportunities for nurses: A comparison of 92 U.S. journals. Image: Journal of Nursing Scholarship, 23(1), 33–38.
A refereed journal uses referees or expert reviewers to determine whether a manuscript is accepted for publication. In nonrefereed journals, the editor makes the decisions to accept or reject manuscripts, but these decisions are usually made after consultation with a nursing expert (Carnegie, 1975). Most refereed journals require manuscripts to be reviewed anonymously by two or three reviewers. The reviewers are asked to determine the strengths and weaknesses of a manuscript, and their comments or a summary of the comments is sent to the author. Most academic institutions support the refereed system and will recognize only publications that appear in refereed journals. The five research journals presented in Table 25-16 are refereed and have the following review process: “Editor receives manuscripts, reviews, and distributes them to experts selected from an established group of reviewers. Decision on the manuscript is based on reviews and mediated by editor” (Swanson et al., 1991, p. 35).
Having a manuscript accepted for publication depends not only on the quality of the manuscript but also on how closely the manuscript matches the goals of the journal (Teijlingen & Hundley, 2002). It is a good idea to review articles recently published in the journal to which you plan to submit a manuscript. This review will let you know whether a research topic has recently been covered and whether the research findings would be of interest to the journal’s readers. This selection process will enable you to identify a few journals that would be appropriate for publishing your findings.
Developing a Query Letter
Develop a query letter to determine an editor’s interest in reviewing your manuscript. This letter should be no more than one or two pages and usually includes the research problem, a brief discussion of the major findings, the significance of the findings, and the researcher’s qualifications for writing the article (Nicol & Pexman, 2003). Address your query letter to the current editor of a journal; frequently, researchers send three or four letters to different journals at the same time. Of the five journals presented in Table 25-16, only Nursing Research prefers a query letter; the other research journals indicated that these letters were optional. Some researchers send query letters because the response (positive or negative) enables them to make the final selection of a journal for submitting their manuscript. An example of a query letter is presented in Figure 25-6.
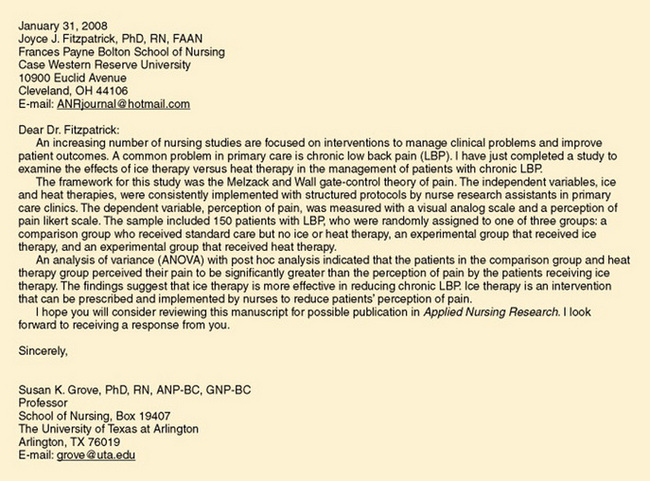
Preparing a Manuscript
A manuscript is written according to the format outlined by the journal. Guidelines for developing a manuscript are usually published in the issue of the journal or on the journal’s website. Follow these guidelines explicitly to increase the probability of your manuscript being published. The information provided for authors includes (1) directions for manuscript preparation, (2) discussion of copyright, and (3) guidelines for submission of the manuscript.
Writing research reports for publication requires skills in technical writing that are not used in other types of publication. Technical writing condenses information and is stylistic. The Publication Manual of the American Psychological Association (APA, 2001); A Manual for Writers of Research Papers, Theses, Dissertations (Turabian, Booth, Colomb, & Williams, 2007); and the Chicago Manual of Style (University of Chicago Press Staff, 2003) are considered useful sources for quality technical writing. Most journals will stipulate the format style required for their journal. A quality research report has no punctuation, spelling, or sentence structure errors; confusing words; clichés; jargon; or wordiness. Computer programs have been developed with the capacity to proofread manuscripts for grammar, punctuation, spelling, and sentence structure errors. However, the writer still needs to respond and correct sentences that the computer has identified as problematic.
Knowledge about the author guidelines provided by the journal and a background in technical writing will help you to develop an outline for a proposed manuscript. The brief outlines presented in Tables 25-1 and 25-9 must be expanded in detail to guide the writing of a manuscript. You can use the outline to develop a rough draft of your article, which you will revise numerous times. Present the content of your article logically and concisely under clear headings, and select a title that creates interest and reflects the content. The Publication Manual of the American Psychological Association (APA, 2001) provides detailed directions for preparing manuscripts.
Developing a well-written manuscript is difficult. Often, universities and other agencies offer writing seminars to assist students and other investigators in preparing a research report for publication. Some faculty members who chair thesis and dissertation committees will also assist their students in developing an article for publication. In this situation, the faculty member is almost always the second author for the article. The fifth edition of the APA manual (APA, 2001) has a section on how to reduce the content of theses and dissertations for publication.
When you are satisfied with your manuscript, ask one or two colleagues to review it for organization, completeness of content, and writing style. Colleagues’ comments can guide you in making any final revisions. The manuscript should be expertly typed according to the journal’s specifications; several nursing research journals require an APA (2001) format. The reference list for the manuscript needs to be in a complete and correct format. Computer programs are available with bibliography systems that enable you to compile a consistently formatted reference list in any style you desire. With these programs you can maintain a permanent collection of reference citations. When you need a reference list for a manuscript, you can select the appropriate references from the collection and use the program to print the list. You can also use computer programs to scan your manuscript and create a reference list based on the citations.
Submitting a Manuscript for Review
Guidelines in each journal indicate the name of the editor and the address for manuscript submission. Submit your manuscript to only one journal at a time. You should submit the number of copies of the manuscript requested and the original manuscript, if required. Most journals now encourage researchers to submit their manuscripts electronically, and the editor provides copies for e-mailing to reviewers. When submitting the manuscript, include your complete mailing address, phone number, fax number, and e-mail address. An author usually receives notification of receipt of the manuscript within 1 to 2 days if sent by e-mail and 1 to 2 weeks if sent by regular mail.
Peer Review
Most journals use some form of peer review process to evaluate the quality of manuscripts submitted for publication. The manuscript is usually sent to two or three reviewers with guidelines from the editor for performing the review. In most cases, the review is “blind,” which means that the reviewers do not know who the author is and the author does not know who is reviewing the paper. For research papers, the reviewers are asked to evaluate the validity of the study. Broadly, of concern is whether the methodology was adequate to address the research objectives, questions, or hypotheses; whether the findings are trustworthy (for example, if the results were nonsignificant, was a power analysis performed?); whether the discussion is appropriate given the findings; and whether the author discusses the clinical implications of the findings.
Responding to Requests to Revise a Manuscript
After reviewing your manuscript, the journal staff will reach one of four possible decisions: (1) acceptance of the manuscript as submitted, (2) acceptance of the manuscript pending minor revisions, (3) tentative acceptance of the manuscript pending major revisions, and (4) rejection of the manuscript. Accepting a manuscript as submitted is extremely rare. The editor will send you a letter that indicates acceptance of the manuscript and a possible issue of publication.
Most manuscripts are returned for minor or major revisions before they are published. It is regrettable that many of these returned manuscripts are never revised. The author incorrectly interprets the request for revision as a rejection and assumes that the revised manuscript will also be rejected. This assumption is not usually true because revising a manuscript based on reviewers’ comments improves the quality of the manuscript. When editors return a manuscript for revision, they include the reviewers’ actual comments or a summary of the comments to direct the revision. The researcher must carefully review the comments and make those revisions that improve the quality of the research report without making inaccurate statements about the study. As you revise your manuscript, follow as carefully as possible the recommendations of the reviewers. When the revision is complete, return it with a cover letter explaining exactly how you responded to each recommendation. List each recommendation, and describe your modification. Indicate the page number of your manuscript for that revision. In some cases, you may disagree with the recommendation. If so, in the cover letter, provide rationale for your disagreement and explain how you have chosen to respond to the comment. Do not ignore a recommendation. Sometimes a revised manuscript is returned to the reviewers, yet further modifications are requested in the paper before it is published. Although these experiences are frustrating, they are also opportunities to improve your writing skills and logical development of ideas. Frequently, editors request that the final manuscript be submitted electronically.
An author who receives a rejection feels devastated, but he or she is not alone. All authors, even famous ones, have had their manuscripts rejected (Gay & Edgil, 1989). Manuscripts are rejected for a variety of reasons. Swanson et al. (1991) asked journal editors to rate the frequency of 14 reasons for manuscript rejection. Table 25-17 identifies these reasons and their mean frequencies. “Poorly written” and “poorly developed idea” were the most frequent reasons for rejecting manuscripts. If you receive a rejection notice, give yourself a cooling-off period and then determine why the manuscript was rejected. Most manuscripts, especially those that are poorly written, can be revised and submitted to another journal.
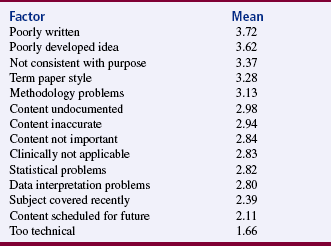
Publishing Research Findings in Online Journals
A number of print journals are moving to the Web. These journals continue to provide their traditional print version but also have a website with access to some or all the articles in the printed journal. The number of Web-only online nursing journals is also growing. These online-only journals have some distinct advantages for authors. E-mail links from author to editor to reviewer allow papers to be submitted and sent from editor to reviewer electronically and allow reviewer comments to be sent back to the editor more quickly than usually occurs in print journals. Reviewer comments are sent back to the author by e-mail, after which the article is revised and resubmitted by e-mail, reviewed again, and, if judged satisfactory, accepted for publication. This process is particularly important for international scientific communications. Online journals use “continuous publication,” which means that there is no wait for approved articles to be published because the editor does not have to wait until the next issue is scheduled for publication. In fact, the notion of an “issue” is becoming antiquated as a result of electronic publishing. Approved articles are placed online almost immediately, which is important for research reports because it provides more rapid access to recent research findings for other researchers and clinicians interested in facilitating evidence-based practice. The possibilities of dialogue with readers, including other researchers in the same field of study, are great. However, additional work needs to be done to ensure that online publications are secure and that each publication is permanently available with a permanent identifier for citation and linking (Fitzpatrick, 2001).
Not all online journals provide peer review. You may wish to check for information on the peer review process at the online journal website. Peer review is essential to scholars in the university tenure track system. Electronic publishing may result in a more open peer review process. Some journals post a submitted paper for peer review on a secure Internet site accessible only by the editor and reviewers. The review occurs by way of a discussion rather than individual comments. This arrangement provides a measure of quality control in the review process that is missing in the traditional process. Bingham (1999) described the changes in peer review likely to occur because of online journals.
Publishing in an online journal has other potential advantages. The constraints on length imposed because of the cost of print publishing do not exist. Multiple tables, figures, graphics, and even streaming audio and video are possibilities with online journals. Animations can be created to assist the reader in visualizing ideas. Links may be established with full-text versions of citations from other online sources. It will be possible to track the number of times that the article has been accessed; this feature will provide the author with additional information, beyond citations of his or her paper, to assess its impact on the scientific community. Forward referencing will allow links to later works, which can be added to the article continuously. The reader will be able to see how the paper influenced later works. Electronic listservs and chat rooms may be available to discuss the paper. All of these capabilities are not currently available with every online journal. The technology to provide them exists, but there is no free lunch. Most online journals in nursing are free. Online journals with some of these advanced technologies may have to cover their costs by charging subscription fees or by obtaining financing through advertisements (Holoviak & Seitter, 1997; Ludwick & Glazer, 2000; Sparks, 1999).
Because online journals are rapidly emerging, providing a list of websites in this text is not feasible. However, a number of websites maintain a current list of online journals such as www.nursefriendly.com/nursing/linksections/nursingjournals.htm. Another website (www.medscape.com/pages/public/publications) provides a list of and electronic access to the medical journals that are online.
Publishing Research Findings in Books
Some qualitative studies and large, complex quantitative studies are published in books or chapters of books. Publishing a book requires extensive commitment on the part of the researcher. In addition, the researcher must select a publisher and convince the publisher to support the book project. A prospectus must be developed that identifies the proposed content of the book, describes the market for the book, and includes a rationale for publishing the book. The publisher and researcher must negotiate a contract that is mutually acceptable regarding (1) the content and length of the book, (2) the time required to complete the book, (3) the percentage of royalties that the author will receive, and (4) the advances she or he will be offered. The researcher must fulfill the obligations of the contract by producing the proposed book within the time frame agreed on. Publishing a book is a significant accomplishment and an effective, but sometimes slow, means of communicating research findings. Be sure and include all presentations and publications on your vita to document your scholarship activities.
Duplicate Publication in the Nursing Literature
Duplicate publication is the practice of publishing the same article or major portions of the article in two or more print or electronic media without notifying the editors or referencing the other publication in the reference list (Blancett, Flanagin, & Young, 1995; Duncan, 1999). Duplicate publication of studies is a poor practice because it limits the opportunities for publishing new knowledge, artificially inflates the importance of a study topic, clutters the literature with redundant information, rewards researchers for publishing the same content twice, and may violate the copyright law. Blancett et al. (1995) studied the incidence of duplicate publications in the nursing literature. In a sample of 642 articles published by 77 authors over 5 years, 181 of the articles were classified as duplicate publications. Forty-one of the 77 authors published at least one form of duplicate article, and 59 of the duplicate articles did not include a reference to the primary article. Thus, duplicate publications are a serious concern in the nursing literature.
Journals require the submission of an original manuscript or one that has not been previously published, so submitting a manuscript that has been previously published without referencing the duplicate work or notifying the editor of the previous publication is unethical and a form of scientific misconduct (see Chapter 9).
In 1994, the International Academy of Nursing Editors developed guidelines for nurse authors and editors regarding duplicate publications. Both authors and editors have the responsibility to inform readers and reviewers of duplicate publications. Authors must avoid unethical duplication by submitting original manuscripts or by providing full disclosure if portions or the entire manuscript has been previously published. Previous publications must be cited in the text of the manuscript and the reference list. Editors have the responsibility of developing a policy on duplicate publications and informing all authors, reviewers, and readers of this policy. In addition, editors must ensure that readers are informed of duplicate materials by adequate citation of the materials in the article’s text and reference list (Yarbro, 1995). Duplicate publications continue to be a problem in the nursing and medical literature. These redundant publications can result in retractions and refusal to accept other manuscripts for publication (Duncan, 1999; International Committee of Medical Journal Editors, 1997).
SUMMARY
• Communicating research findings, the final step in the research process, involves developing a research report and disseminating it through presentations and publications to audiences of nurses, health care professionals, policy makers, and health care consumers.
• Both quantitative and qualitative research reports include four basic sections: (1) introduction, (2) methods, (3) results, and (4) discussion.
• In a quantitative research report, the introduction briefly identifies the problem that was studied and presents an empirical and theoretical basis for the study. The methods section of the report describes how the study was conducted; the results section reveals what was found by conducting the study; and the discussion section includes the study findings, limitations, conclusions, implications for nursing practice, and recommendations for further research.
• In qualitative research, the introduction section identifies the phenomenon under investigation and describes the type of qualitative study that was conducted. The methods section includes both the general and applied methods for the study conducted. The results section of the research report includes the data analysis procedures and presentation of the findings; and the discussion section includes conclusions, limitations, implications for nursing, and recommendations for further research.
• The greatest impact on nursing practice can be achieved by communicating nursing research findings to nurses, other health professionals, policy makers, and health care consumers.
• Research findings are presented at conferences and meetings through verbal and poster presentations of the research report; and the report developed depends on the focus of the conference, the audience, and the time designated for each presentation.
• A poster session is a visual presentation of a study. Conference sponsors guide the development of a poster by providing the following information: (1) size limitations or format restrictions for the poster, (2) the size of the poster display area, and (3) the background and potential number of conference participants.
• Developing a manuscript for publication includes the following steps: (1) selecting a journal, (2) writing a query letter, (3) preparing a manuscript, (4) submitting the manuscript for review, and (5) responding to requests for revision of the manuscript.
• Selecting a journal for publication of a study requires knowledge of the basic requirements of the journal, the journal’s refereed status, and recent articles published in the journal.
• An increasing area of concern in publishing is the practice of duplicate publications where the same article or major portions of the article are published in two or more print or electronic media without notifying the editors or referencing the other publication in the reference list.
REFERENCES
Agency for Healthcare Research and Quality (AHRQ) Evidence-based practice centers: Synthesizing scientific evidence to improve quality and effectiveness in health care, 2007. Retrieved October 30, 2007, from www.ahrq.gov/clinic/epc.
American Psychological Association. Publication manual of the American Psychological Association, (5th ed.). Washington, DC: Author, 2001.
Angell, M. Negative studies. New England Journal of Medicine. 1989;321(7):464–466.
Bingham, C., The future of medical publishing. HMS Beagle, 1999. Retrieved January 22, 1999, from www.biomednet.com/hmsbeagle/46/cutedge/day1.htm.
Blancett, S.S., Flanagin, A., Young, R.K. Duplicate publication in the nursing literature. Image: Journal of Nursing Scholarship. 1995;27(1):51–56.
Boyd, C.O., Munhall, P.L. Qualitative research proposal and report. In: Munhall P.L., ed. Nursing research: A qualitative perspective. 3rd ed. Sudbury, MA: Jones & Bartlett; 2001:613–638.
Brown, S.J. Knowledge for health care practice: A guide to using research evidence. Philadelphia: Saunders, 1999.
Carnegie, M.E. The referee system. Nursing Research. 1975;24(4):243.
Cason, C.L., Cason, G.J., Redland, A.R. Peer review of research abstracts. Image: Journal of Nursing Scholarship. 1988;20(2):102–105.
Craig, J.V., Smyth, R.L. The evidence-base practice manual for nurses, (2nd ed.). Edinburgh: Churchill Livingstone, 2007.
Crosby, L.J. The abstract: An important first impression. Journal of Neuroscience Nursing. 1990;22(3):192–194.
Duncan, A.M. Authorship, dissemination of research findings, and related matters. Applied Nursing Research. 1999;12(2):101–106.
Evangelista, L.S., Doering, L., Dracup, K. Meaning and life purpose: The perspectives of post-transplant women. Heart & Lung. 2003;32(4):250–257.
Fitzpatrick, J.J. Scholarly publishing: Current issues of cost and quality, fueled by the rapid expansion of electronic publishing. Applied Nursing Research. 2001;14(1):1–2.
Frankl, V.E. Man’s search for meaning. New York: Simon & Schuster, 1984.
Gay, J.T., Edgil, A.E. When your manuscript is rejected. Nursing & Healthcare. 1989;10(8):459–461.
Giorgi, A. Phenomenology and psychological research. Pittsburgh, PA: Duquesne University Press, 1985.
Goode, C.J. What constitutes the “evidence” in evidence-based practice? Applied Nursing Research. 2000;13(4):222–225.
Heo, S., Moser, D.K., Lennie, T.A., Zambroski, C.H., Chung, M.L. A comparison of health-related quality of life between older adults with heart failure and healthy older adults. Heart & Lung. 2007;36(1):16–24.
Hicks, C. The shortfall in published research: A study of nurses’ research publication activities. Journal of Advanced Nursing. 1995;21(3):594–604.
Holoviak, J., Seitter, K.L., Transcending the limitations of the printed page. Journal of Electronic Publishing, 1997;3;1. Retrieved March 12, 2000, from www.press.umich.edu/jep/033-01/EI.html.
International Committee of Medical Journal Editors. Uniform requirements for manuscripts submitted to biomedical journals. Annals of Internal Medicine. 1997;126(1):36–47.
Jackle, M. Presenting research to nurses in clinical practice. Applied Nursing Research. 1989;2(4):191–193.
Jackson, M.S. Afrocentric treatment of African American women and their children in a residential chemical dependence program. Journal of Black Studies. 1995;26(1):17–30.
Jenkins, K., Ahijevych, K. Nursing students’ beliefs about smoking, their own smoking behaviors, and use of professional tobacco treatment intervention. Applied Nursing Research. 2003;16(3):164–172.
Jimenez, S.L.M. Consumer journalism: A unique nursing opportunity. Image: Journal of Nursing Scholarship. 1991;23(1):47–49.
Kerlinger, F.N., Lee, H.B. Foundations of behavioral research, (4th ed.). Fort Worth, TX: Harcourt College Publishers, 2000.
Knafl, K.A., Howard, M.J. Interpreting and reporting qualitative research. Research in Nursing & Health. 1984;7(1):17–24.
Kraemer, H.C., Thiemann, S. How many subjects? Statistical power analysis in research. Newbury Park, CA: Sage, 1987.
Leininger, M.M. Qualitative research methods in nursing. New York: Grune & Stratton, 1985.
Ludwick, R., Glazer, G., Electronic publishing. The movement from print to digital publication. Online Journal of Issues in Nursing. 2000, January 31;5;5. Manuscript 2. Retrieved March 12, 2000, from www.nursingworld.org/ojin/topic11/tpe112.htm.
Marshall, C., Rossman, G.B. Designing qualitative research, (4th ed.). Thousand Oaks, CA: Sage, 2006.
Mathieson, A. The principles and practice of oral presentation. Nurse Researcher. 1996;4(2):41–54.
McCloskey, J.C. Publishing opportunities for nurses: A comparison of 65 journals. Nurse Educator. 1977;11(4):4–13.
McKenna, K.T., Maas, F., McEniery, P.T. Coronary risk factor status after percutaneous transluminal coronary angioplasty. Heart & Lung. 1995;24(3):207–212.
Melnyk, B.M., Fineout-Overholt, E. Evidence-based practice in nursing & healthcare: A guide to best practice. Philadelphia: Lippincott Williams & Wilkins, 2005.
Miles, M.B., Huberman, A.M. Qualitative data analysis: A sourcebook of new methods, (2nd ed.). Beverly Hills, CA: Sage, 1994.
Miracle, V.A., King, K.C. Presenting research: Effective paper presentations and impressive poster presentations. Applied Nursing Research. 1994;7(3):147–157.
Moore, L.W., Augspurger, P., King, M.O., Proffitt, C. Insights on the poster preparation and presentation process. Applied Nursing Research. 2001;14(2):100–104.
Munhall, P.L. Nursing research: A qualitative perspective, 3rd ed. Sudbury, MA: Jones & Bartlett, 2001.
Nicol, A.A., Pexman, P.M. Presenting your findings: A practical guide for creating tables. Washington, DC: American Psychological Association, 1999.
Nicol, A.A., Pexman, P.M. Displaying your findings: A practical guide for creating figures, posters, and presentations. Washington, DC: American Psychological Association, 2003.
O’Neill, A.L., Duffey, M.A. Communication of research and practice knowledge in nursing literature. Nursing Research. 2000;49(4):224–230.
Patton, M.Q. Qualitative research & evaluation methods, (3rd ed.). Thousand Oaks, CA: Sage, 2002.
Pyrczak, F. Evaluating research in academic journals: A practical guide to realistic evaluation. Los Angeles: Pyrczak, 1999.
Pyrczak, F., Bruce, R.R. Writing empirical research reports: A basic guide for students of the social and behavioral sciences, (5th ed.). Glendale, CA: Pyrczak, 2005.
Russell, C.L., Aud, M.A. Publication manual of the American Psychological Association—5th edition: A review of additions and changes in style requirements. Nursing Research. 2002;51(5):332–335.
Russell, C.K., Gregory, D.M., Gates, M.F. Aesthetics and substance in qualitative research posters. Qualitative Health Research. 1996;6(4):542–552.
Sandelowski, M., Barroso, J. Finding the findings in qualitative studies. Journal of Nursing Scholarship. 2002;34(3):213–219.
Santacroce, S.J., Maccarelli, L.M., Grey, M. Methods: Intervention fidelity. Nursing Research. 2004;53(1):63–66.
Selby, M.L., Tornquist, E.M., Finerty, E.J. How to present your research. Part I: What they didn’t teach you in nursing school about planning and organizing the content of your speech. Nursing Outlook. 1989;37(4):172–175.
Selby, M.L., Tornquist, E.M., Finerty, E.J. How to present your research. Part II: The ABCs of creating and using visual aids to enhance your research presentation. Nursing Outlook. 1989;37(5):236–238.
Sparks, S.M. Electronic publishing and nursing research. Nursing Research. 1999;48(1):50–54.
Stein, K.F., Sargent, J.T., Rafaels, N. Intervention research: Establishing fidelity of the independent variable in nursing clinical trials. Nursing Research. 2007;56(1):54–62.
Swain, M.A., Steckel, S.B. Influencing adherence among hypertensives. Research in Nursing & Health. 1981;4(1):213–222.
Swanson, E.A., McCloskey, J.C., Bodensteiner, A. Publishing opportunities for nurses: A comparison of 92 U.S. journals. Image: Journal of Nursing Scholarship. 1991;23(1):33–38.
Teijlingen, E.V., Hundley, V. Methodological issues in nursing research. Getting your paper to the right journal: A case study of an academic paper. Journal of Advanced Nursing. 2002;37(6):506–513.
Tornquist, E.M., Funk, S.G., Champagne, M.T. Writing research reports for clinical audiences. Western Journal of Nursing Research. 1989;11(5):576–582.
Turabian, K.L., Booth, W.C., Colomb, G.G., Williams, J.M. A manual for writers of research papers, theses, dissertations: Chicago style for students and researchers, (7th ed.). Chicago: University of Chicago Press, 2007.
University of Chicago Press Staff. The Chicago manual of style, (15th ed.). Chicago: University of Chicago Press, 2003.
Wainer, H. How to display data badly. American Statistician. 1984;38(2):137–147.
Wilson, I.B., Cleary, P.D. Linking clinical variables with health-related quality of life: A conceptual model of patient outcomes. Journal of the American Medical Association. 1995;273(1):59–65.
Winslow, E.H. Failure to publish research: A form of scientific misconduct? Heart & Lung. 1996;25(3):169–171.
Wolcott, H.F. Writing up qualitative research, (2nd ed.). Thousand Oaks, CA: Sage, 2001.
Wright, V.L. A phenomenological exploration of spirituality among African American women recovering from substance abuse. Archives of Psychiatric Nursing. 2003;17(4):173–185.
Yarbro, C.H. Duplicate publication: Guidelines for nurse authors and editors. Image: Journal of Nursing Scholarship. 1995;27(1):57.