Screen-Film Radiographic Technique
At the completion of this chapter, the student should be able to do the following:
1 List the four prime exposure factors.
2 Discuss milliampere seconds (mAs) and kilovolt peak (kVp) in relation to x-ray beam quantity and quality.
3 Describe characteristics of the imaging system that affect x-ray beam quantity and quality.
4 List the four patient factors and explain their effects on radiographic technique.
5 Identify four image-quality factors and explain how they influence the characteristics of a radiograph.
6 Discuss the three types of technique charts.
7 Explain the three types of automatic exposure controls.
8 Discuss the relationship between tomographic angle and section thickness.
EXPOSURE FACTORS are a few of the tools that radiographers use to create high-quality radiographs. The prime exposure factors are kVp, mA, exposure time, and source-to-image receptor distance (SID).
Properties of the x-ray imaging system that influence the selection of exposure factors are reviewed, including focal-spot size, total x-ray beam filtration, and the source of high-voltage generation.
Radiographic technique usually is described as the combination of settings selected on the control panel of the x-ray imaging system to produce a high-quality image. The geometry and position of the x-ray tube, the patient, and the image receptor are included in this description.
Many areas of x-ray diagnosis require special equipment and specialized techniques to obtain the required information. Such procedures are designed to visualize more clearly a given anatomical structure, usually at the expense of nonvisualization of other structures.
The equipment and procedures discussed in this chapter include conventional tomography and magnification radiography. These x-ray examinations are not routine; therefore, radiologic technologists must be specially trained to perform them.
Exposure Factors
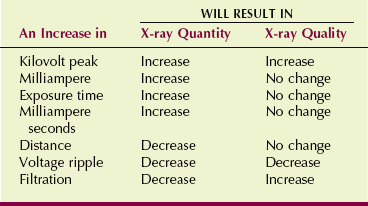
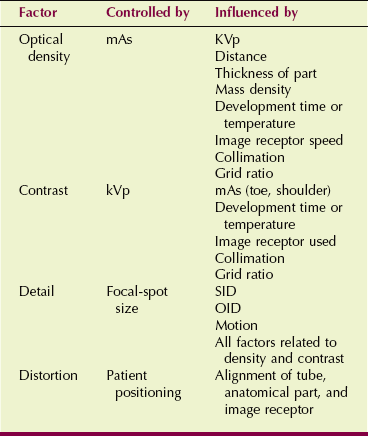
Proper exposure of a patient to x-radiation is necessary to produce a diagnostic radiograph. The factors that influence and determine the quantity and quality of x-radiation to which the patient is exposed are called exposure factors (Table 13-1). Recall from Chapter 8 that radiation quantity refers to radiation intensity measured in mGya or mGya/mAs (mR or mR/mAs), and radiation quality refers to x-ray beam penetrability, best measured by the half-value layer (HVL).
All of these factors, except those fixed by the design of the x-ray imaging system, are under the control of the radiologic technologist. For example, focal-spot size is limited to two selections. Sometimes the added x-ray beam filtration is fixed. The high-voltage generator provides characteristic voltage ripple that cannot be changed.
The four prime exposure factors are kilovolt peak (kVp), current (mA), exposure time (s), and source-to-image receptor distance (SID). Of these, the most important are kVp and mAs, the factors principally responsible for x-ray quality and quantity. Focal-spot size, distance, and filtration are secondary factors that may require manipulation for particular examinations.
Kilovolt Peak
To understand kVp as an exposure technique factor, assume that kVp is the primary control of x-ray beam quality and therefore beam penetrability. A higher quality x-ray beam is one with higher energy that is thus more likely to penetrate the anatomy of interest.
The kVp has more effect than any other factor on image receptor exposure because it affects beam quality and, to a lesser degree, influences beam quantity. With increasing kVp, more x-rays are emitted, and they have higher energy and greater penetrability. Unfortunately, because they have higher energy, they also interact more by Compton effect and produce more scatter radiation, which results in reduced image contrast.
The kVp selected helps to determines the number of x-rays in the image-forming beam, and hence the resulting average optical density (OD). Finally, and perhaps most important, the kVp controls the scale of contrast on the finished radiograph because as kVp increases, less differential absorption occurs. Therefore, high kVp results in reduced image contrast.
Milliamperes
The mA selected determines the number of x-rays produced and therefore the radiation quantity. Recall that the unit of electric current is the ampere (A). One ampere is equal to 1 coulomb (C) of electrostatic charge flowing each second in a conductor, as follows:
Therefore, when the 1000 mA (1 amp) station on the operating console is selected, 6.3 × 10¹⁷ electrons flow through the x-ray tube each second.
| Question: | What is the electron flow from cathode to anode when the 500-mA station is selected? |
| Answer: |
As more electrons flow through the x-ray tube, more x-rays are produced. Assuming a constant exposure time, this relationship is directly proportional. A change from 200 to 400 mA would be a 100% increase or a doubling of the x-ray tube current, a doubling of the x-rays produced, and a doubling of patient radiation dose.
 With a constant exposure time, mA controls the x-ray quantity and therefore the patient radiation dose.
| Question: | At 200 mA, the entrance skin exposure (ESE) is 7.5 mGya (750 mR). What will be the ESE at 500 mA? |
| Answer: | ESE = 7.5 mGya (500 mA/200 mA) = 18.75 mGya |
A change in mA does not change the kinetic energy of electrons flowing from cathode to anode. It simply changes the number of electrons. Consequently, the energy of the x-rays produced is not changed; only the number is changed.
Often, x-ray imaging systems are identified by the maximum x-ray tube current possible. Inexpensive radiographic imaging systems designed for private physicians’ offices normally have a maximum capacity of 600 mA. Interventional radiology imaging systems may have a capacity of 1500 mA.
Exposure Time
Radiographic exposure times usually are kept as short as possible. The purpose is not to minimize patient radiation dose but rather to minimize motion blur that can occur because of patient motion.
Producing a diagnostic image requires a certain radiation exposure of the image receptor. Therefore, when exposure time is reduced, the mA must be increased proportionately to provide the required x-ray intensity.
On older x-ray imaging systems, whereas exposure time is expressed in fractional seconds, current x-ray imaging systems identify exposure time in milliseconds (ms). Table 13-2 shows how the different units of time are related.
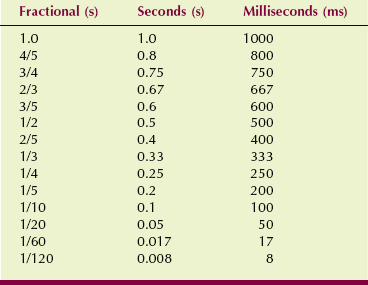
An easy way to identify an x-ray imaging system as single phase, three phase, or high frequency is to note the shortest exposure time possible. Single-phase imaging systems cannot produce an exposure time less than 1/2 cycle or its equivalent 8 ms (10 ms on 50-Hz generators). Three-phase and high-frequency generators normally can provide an exposure as short as 1 ms.
mA and exposure time (in seconds) are usually combined and used as mAs. Indeed, many x-ray consoles do not allow the separate selection of mA and exposure time and permit only mAs selection.
Although the radiologic technologist may be required to select an exposure time, it is always selected with consideration of the mA station. The important parameter is the product of the exposure time and tube current.
The mAs value determines the number of x-rays in the primary beam; therefore, it principally controls radiation quantity in the same way that mA and exposure time, taken separately, do; it does not influence radiation quality. The mAs setting is the key factor in the control of OD on the radiograph.
Time and mA can be used to compensate for each other in an indirect fashion. This is described by the following:
| Question: | A radiograph of the abdomen requires 300 mA and 500 ms. The patient is unable to breath-hold, which results in motion blur. Therefore, the exposure is made with a time of 200 ms. Calculate the new mA that is required. |
| Answer: |
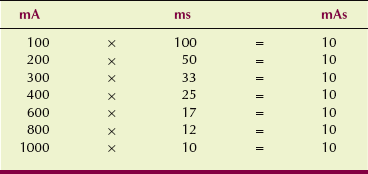
If the high-voltage generator is properly calibrated, the same mAs value and therefore the same OD can be produced with various combinations of mA and exposure time (Table 13-3). Because x-ray tube current is electron flow per unit time, the mAs value is therefore simply a measure of the total number of electrons conducted through the x-ray tube for a particular exposure.
| Question: | How many electrons are involved in x-ray production at 100 mAs? |
| Answer: | 100 mAs = 0.1 As = 0.1 C/s × s = 0.1 C 1 C = 6.3 × 10¹⁸ electrons Therefore, 0.1 C = 6.3 × 10¹⁷ electrons = 100 mAs |
On an x-ray imaging system in which only mAs can be selected, exposure factors are adjusted automatically to the highest mA at the shortest exposure time allowed by the high-voltage generator. Such a design is called a falling-load generator.
| Question: | A radiologic technologist selects a technique of 200 mAs. The operating console is adjusted automatically to the maximum mA station, 1000 mA. What will be the exposure time? |
| Answer: |
(The actual exposure time will be somewhat longer than 200 ms because the tube current falls as the anode heats up.)
Varying the mAs setting changes only the number of electrons conducted during an exposure—not the energy of those electrons. The relationship is directly proportional: Doubling of the mAs doubles the x-ray quantity.
| Question: | A cervical spine examination calls for 68 kVp/30 mAs and results in an ESE of 1.2 mGya (120 mR). The next patient is examined at 68 kVp/25 mAs. What will be the ESE? |
| Answer: | ESE = 1.2 mGya (25 mAs/30 mAs) = 1.0 mGya |
Distance
Distance affects exposure of the image receptor according to the inverse square law, which is discussed in Chapter 3. The SID largely determines the intensity of the x-ray beam at the image receptor.
The following relationship, called the direct square law, is derived from the inverse square law. It allows a radiologic technologist to calculate the required change in mAs after a change in SID to maintain constant OD.
Note that both the original mAs value and the original SID are in the denominator rather than reversed, as in the inverse square law.
| Question: | An examination requires 100 mAs at 180 cm SID. If the distance is changed to 90 cm SID, what should be the new mAs setting? |
| Answer: |
When preparing to make a radiographic exposure, the radiologic technologist selects specific settings for each of the factors described: kVp, mAs, and SID. The control panel selections are based on an evaluation of the patient, the thickness of the anatomical part, and the type of accessories used.
Standard SIDs have been in use for many years. For tabletop radiography, 100 cm is common, but dedicated chest examination usually is conducted at 180 cm. Tabletop radiography at 120 cm and chest radiography at 300 cm are now often used.
The use of a longer SID results in less magnification, less focal spot blur, and improved spatial resolution. However, more mAs must be used because of the effects of the direct square law.
Imaging System Characteristics
Most x-ray tubes are equipped with two focal-spot sizes. On the operating console, these usually are identified as small and large, 0.5 mm/1.0 mm, 0.6 mm/1.2 mm, or 1.0 mm/2.0 mm. X-ray tubes used in interventional radiology procedures or magnification radiography may have 0.3 mm/1.0 mm focal spots.
Mammography x-ray tubes have 0.1 mm/0.3 mm focal spots. These are called microfocus tubes and are designed specifically for imaging very small microcalcifications at relatively short SIDs.
For general imaging, the large focal spot is used. This ensures that sufficient mAs can be used to image thick or dense body parts. The large focal spot also provides for a shorter exposure time, which minimizes motion blur.
One difference between large and small focal spots is the capacity to produce x-rays. Many more x-rays can be produced with the large focal spot because anode heat capacity is higher. With the small focal spot, electron interaction occurs over a much smaller area of the anode, and the resulting heat limits the capacity of x-ray production.
A small focal spot is reserved for fine-detail radiography, in which the quantity of x-rays is relatively low. Small focal spots are always used for magnification radiography. These are normally used during extremity radiography and in examination of other thin body parts in which higher x-ray quantity is not necessary.
Filtration
Three types of x-ray filtration are used: inherent, added, and compensating. All x-ray beams are affected by the inherent filtration properties of the glass or metal envelope of the x-ray tube. For general-purpose tubes, the value of inherent filtration is approximately 0.5 mm Al equivalent.
The variable-aperture light-localizing collimator usually provides an additional 1.0 mm Al equivalent. Most of this is attributable to the reflective surface of the mirror of the collimator. To meet the required total filtration of 2.5 mm Al, an additional 1-mm Al filter is inserted between the x-ray tube housing and the collimator. The radiologic technologist has no control over these sources of filtration but may control stages of added filtration.
Some x-ray imaging systems have selectable added filtration, as shown in Figure 13-1. Usually, the imaging system is placed into service with the lowest allowable added filtration. Radiographic technique charts usually are formulated at the lowest filtration position. If a higher filter position is used, a radiographic technique chart must be developed at that position.
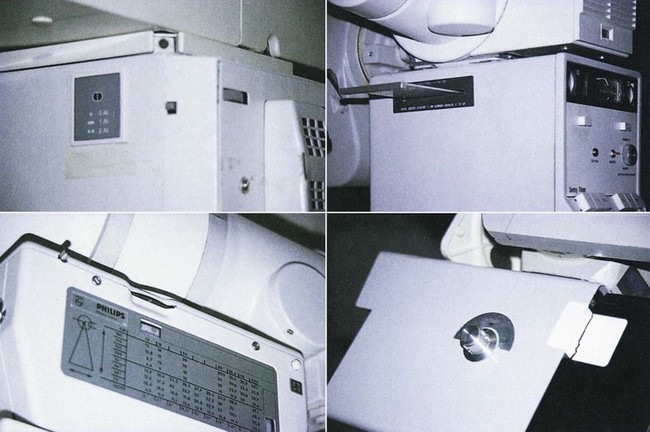
Figure 13-2 shows multiple layers of different filtration materials designed for specialty examinations and patient radiation dose reduction. The two sets of collimator blades are open, showing the filters and the light field mirror.
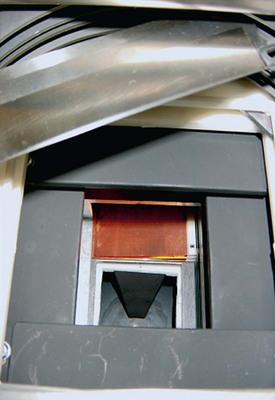
FIGURE 13-2 An open collimator showing the light field mirror and multiple layers of filtration. (Courtesy General Electric Medical Systems.)
Under normal conditions, it is unnecessary to change the filtration. Some facilities may be set for higher filtration during examinations of tissue with high subject contrast, such as the extremities, joints, and chest. When properly used, higher filtration for these examinations results in lower patient radiation dose. When added filtration is changed, be sure to return it to its normal position before beginning the next examination.
Compensating filters are shapes of aluminum mounted onto a transparent panel that slides in grooves beneath the collimator. These filters balance the intensity of the x-ray beam so as to deliver a more uniform exposure to the image receptor. For example, they may be shaped like a wedge for examination of the spine or like a trough for chest examination.
As added filtration is increased, the result is increased x-ray beam quality and penetrability. The result on the image is the same as that for increased kVp, that is, more scatter radiation and reduced image contrast.
High-Voltage Generation
The radiologic technologist cannot select the type of high-voltage generator to be used for a given examination. That choice is fixed by the type of x-ray imaging system that is used. Still, it is important to understand how the various high-voltage generators affect radiographic technique and patient dose.
Three basic types of high-voltage generators are available: single phase, three phase, and high frequency. The radiation quantity and quality produced in the x-ray tube are influenced by the type of high-voltage generator that is used.
Review Figure 5-29 for the shape of the voltage waveform associated with each type of high-voltage generator. Table 13-4 lists the percentage ripple of various types of high-voltage generators, the variation in their output, and the change in radiographic technique used for two common examinations associated with each generator.
TABLE 13-4
Characteristics of the Various Types of High-Voltage Generators
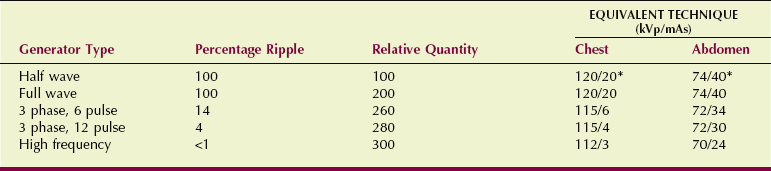
kVp, kilovolt peak; mAs, milliampere seconds.
*The milliampere second value equals that for a full-wave generator; exposure time is doubled.
A half-wave–rectified generator has 100% voltage ripple. During exposure with a half-wave–rectified generator, x-rays are produced and emitted only half the time. During each negative half-cycle, no x-rays are emitted.
Half-wave rectification results in the same radiation quality as is produced by full-wave rectification, but the radiation quantity is halved.
Half-wave rectification is used rarely today. Some mobile and dental x-ray imaging systems are half-wave rectified.
The voltage waveform for full-wave rectification is identical to that for half-wave rectification except there is no dead time. During exposure, x-rays are emitted continually as pulses. Consequently, the required exposure time for full-wave rectification is only half that for half-wave rectification.
Radiation quality does not change when going from half-wave to full-wave rectification; however, radiation quantity doubles.
Three-phase power comes in two principal forms: 6 pulse or 12 pulse. The difference is determined by the manner in which the high-voltage step-up transformer is engineered.
The difference between the two forms is minor but does cause a detectable change in x-ray quantity and quality. Three-phase power is more efficient than single-phase power. More x-rays are produced for a given mAs setting, and the average energy of those x-rays is higher. The x-radiation emitted is nearly constant rather than pulsed.
High-frequency generators were developed in the early 1980s and are increasingly used. The voltage waveform is nearly constant, with less than 1% ripple.
At present, high-frequency generators are used increasingly with dedicated mammography systems, computed tomography (CT) systems, and mobile x-ray imaging systems. It is likely that most high-voltage generators of the future will be of the high-frequency type regardless of the required power levels.
Patient Factors
Radiographic techniques may be described by identifying three groups of factors. The first group includes patient factors, such as anatomical thickness and body composition. The second group consists of image-quality factors, such as OD, contrast, detail, and distortion. Also of importance is how these image-quality factors are influenced by the patient.
The final group includes the exposure technique factors, such as kVp, milliamperage, exposure time, and SID, as well as grids, screens, focal-spot size, and filtration. These factors determine the basic characteristics of radiation exposure of the image receptor and patient dose, and they provide the radiologic technologist with a specific and orderly means of producing, evaluating, and comparing radiographs. An understanding of each of these factors is essential for the production of high-quality images.
Perhaps the most difficult task for radiologic technologists involves evaluation of the patient. The patient’s size, shape, and physical condition greatly influence the required radiographic technique.
The general size and shape of a patient is called body habitus; four such states have been described (Figure 13-3). Sthenic—meaning “strong, active”—patients are average patients. Hyposthenic patients are thin but healthy appearing; these patients require less radiographic technique. Hypersthenic patients are big in frame and usually overweight. Asthenic patients are small, frail, sometimes emaciated, and often elderly.
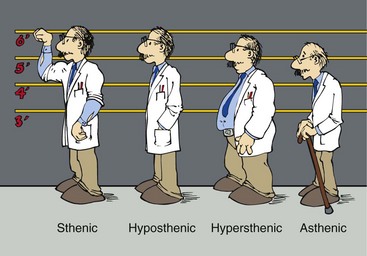
Recognition of body habitus is essential to radiographic technique selection. After this has been established, the thickness and composition of the anatomy being examined must be determined.
Thickness
The thicker the patient, the more x-radiation is required to penetrate the patient to expose the image receptor. For this reason, the radiologic technologist must use calipers to measure the thickness of the anatomy that is being irradiated.
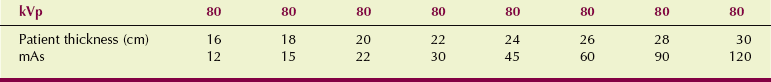
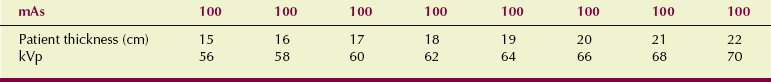
Depending on the type of radiographic technique practiced, the mAs setting or the kVp will be altered as a function of the thickness of the part. Table 13-5 shows an example of how the mAs setting changes when the abdomen is imaged if a fixed-kVp technique is used. Table 13-6 reports the change in radiographic technique factors that occurs as a function of thickness of part when a variable-kVp technique is used.
Composition
Measurement of the thickness of the anatomical part does not release the radiologic technologist from exercising some additional judgment when selecting a proper radiographic technique. The thorax and the abdomen may have the same thickness, but the radiographic technique used for each will be considerably different. The radiologic technologist must estimate the mass density of the anatomical part and the range of mass densities involved.
In general, when only soft tissue is being imaged, low kVp and high mAs are used. With an extremity, however, which consists of soft tissue and bone, low kVp is used because the body part is thin.
When imaging the chest, the radiologic technologist takes advantage of the high subject contrast. Lung tissue has very low mass density, the bony structures have high mass density, and the mediastinal structures have intermediate mass density. Consequently, high kVp and low mAs can be used to good advantage. This results in an image with satisfactory contrast and low patient radiation dose.
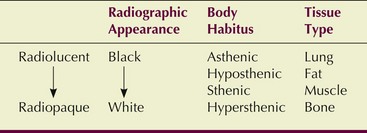
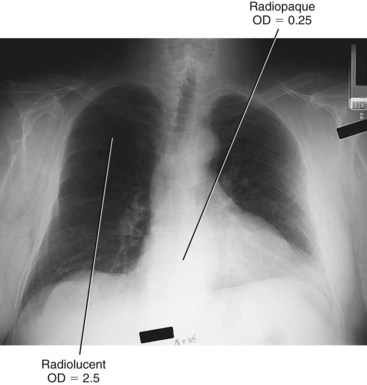
These various tissues often are described by their degree of radiolucency or radiopacity (Figure 13-4). Radiolucent tissue attenuates few x-rays and appears black on the radiograph. Radiopaque tissue absorbs x-rays and appears white on the radiograph. Table 13-7 shows the relative degree of radiolucency for various types of body habitus and tissue.
Pathology
The type of pathology, its size, and its composition influence radiographic technique. In this case, the patient examination request form and previous images may be of some help. The radiologic technologist should not hesitate to seek more information from the referring physician, the radiologist, or the patient regarding the suspected pathology.
Some pathology is destructive, causing the tissue to be more radiolucent. Other pathology can constructively increase mass density or composition, causing the tissue to be more radiopaque. Practice and experience will guide the radiologic technologist’s clinical judgment, but Box 13-1 presents a beginning classification scheme.
Image-Quality Factors
The phrase image-quality factors refers to characteristics of the radiographic image; these include OD, contrast, image detail, and distortion. These factors provide a means for the radiologic technologist to produce, review, and evaluate radiographs. Image-quality factors are considered the “language” of radiography; often, it is difficult to separate one factor from another.
Optical Density
Optical density is the degree of blackening of the finished radiograph. OD has a numeric value (see Chapter 10) and can be present in varying degrees, from completely black, in which no light is transmitted through the radiograph, to almost clear. Whereas black is numerically equivalent to an OD of 3 or greater, clear is less than 0.2 (Figure 13-5). At an OD of 2, only 1% of viewbox light passes through the film.
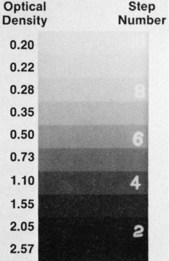
FIGURE 13-5 The amount of light transmitted through a radiograph is determined by the optical density (OD) of a film. The step-wedge radiograph shows a representative range of OD.
In medical imaging, many problems involve an image being “too dark” or “too light.” A radiograph that is too dark has a high OD caused by overexposure. This situation results when too much x-radiation reaches the image receptor. A radiograph that is too light has been exposed to too little x-radiation, resulting in underexposure and a low OD.
Overexposure and underexposure can result in unacceptable image quality, which may require that the examination be repeated. Figure 13-6 shows clinical examples of these two extremes of exposure.
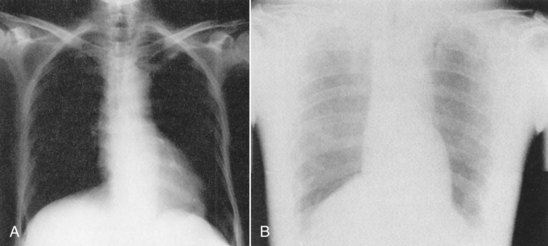
FIGURE 13-6 A, Overexposed radiograph of the chest is too black to be diagnostic. B, Likewise, an underexposed chest radiograph is unacceptable because no detail to the lung fields is apparent. (Courtesy Richard Bayless, University of Montana.)
Optical density can be controlled in radiography by two major factors: mAs and SID. A significant number of problems would arise if the SID were continually changed. Therefore, SID usually is fixed at 90 cm for mobile examinations, 100 cm for table studies, and 180 cm for upright chest examinations. Figure 13-7 illustrates the change in OD that occurs at these SIDs when other exposure technique factors remain constant.
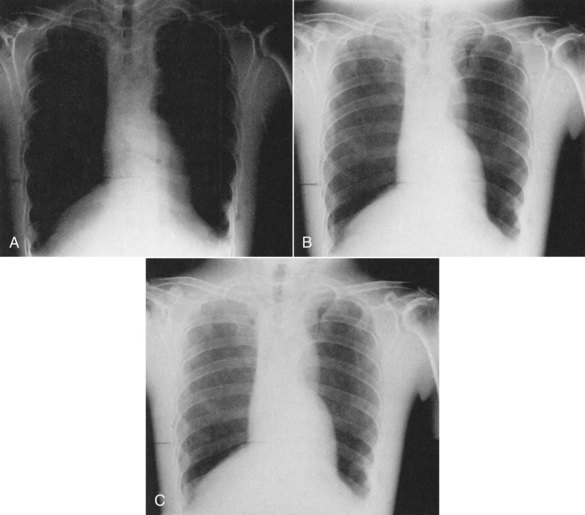
FIGURE 13-7 Normal chest radiograph taken at 100 cm source-to-image receptor distance (SID). B, If the exposure technique factors are not changed, a similar radiograph at 90 cm SID (A) will be overexposed, and at 180 cm SID (C), will be underexposed. (Courtesy Kurt Loveland, Southern Illinois University.)
When distance is fixed, however, as is usually the case, the mAs value becomes the primary variable technique factor used to control OD. OD increases directly with mAs, which means that if the OD is to be increased on a radiograph, the mAs setting must be increased accordingly.
When the OD of the radiograph is the only characteristic that is to be changed, the appropriate factor to adjust would be the mAs.
Optical density can be affected by other factors, but the mAs value becomes the factor of choice for its control (Figure 13-8). A change in mAs of approximately 30% is required to produce a visible change in OD. As a general rule, when only the mAs setting is changed, it should be halved or doubled (Figure 13-9). If a significant change is not required, a repeat examination probably is not required.
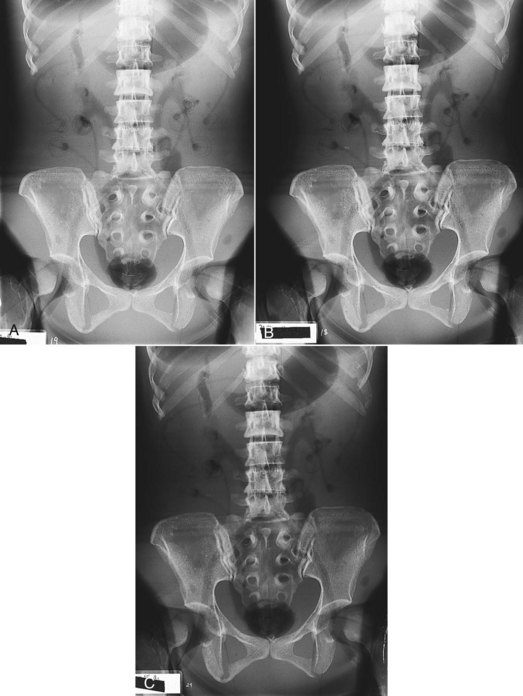
FIGURE 13-8 Optical density is determined principally by the mAs value, as shown by these phantom radiographs of the abdomen taken at 70 kVp. A, 10 mAs. B, Plus 25%, 12.5 mAs. C, Plus 50%, 15 mAs. (Courtesy Nancy Adams, Louisiana State University.)
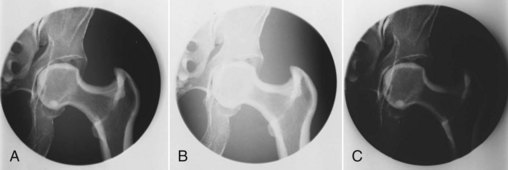
FIGURE 13-9 Changes in mAs value have a direct effect on optical density (OD). A, Original image. B, Decrease in OD when the mAs value is decreased by half. C, Increase in OD when the mAs value is doubled. (Courtesy Euclid Seeram, British Columbia Institute of Technology.)
The mAs value must be changed by approximately 30% to produce a perceptible change in OD. The kVp setting must be changed by approximately 4% to produce a perceptible change in OD.
Because an increase in OD on the finished radiograph is accomplished with a proportionate increase in mAs, is the same true with kilovoltage? Yes, but the increase is not proportionate.
As kVp is increased, the quality of the beam is increased, and more x-rays penetrate the anatomical part. This results in a greater number of image-forming x-rays. As discussed in Chapter 8, x-ray intensity at the patient is proportional to kVp2 and at the image receptor to kVp5.
Image contrast is affected when kVp is changed to adjust OD. This makes it much more difficult to optimize OD with kVp. It takes the eye of an experienced radiologic technologist to determine whether OD is the only factor to be changed or if contrast also should be changed to optimize the radiographic image.
Technique changes involving kVp become complicated. A change in kVp affects penetration, scatter radiation, patient radiation dose, and especially contrast. It is generally accepted that if the OD on the radiograph is to be increased with the use of kVp, an increase in kVp of 15% is equivalent to doubling the mAs. This is known as the 15% rule.
Figure 13-10 illustrates the OD change when the 15% rule is applied. If only OD is to be changed, the 15% rule should not be used because such a large change in kVp would change image contrast.
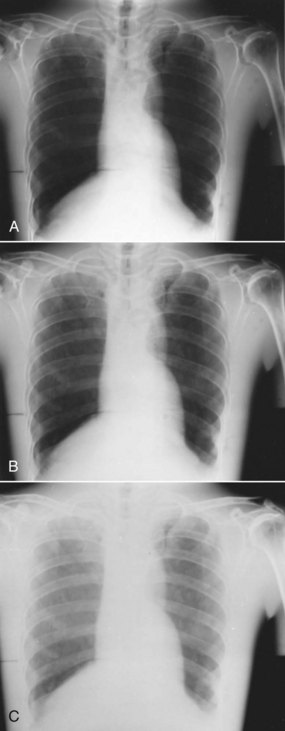
FIGURE 13-10 Normal chest radiograph taken at 70 kVp (B). If the kilovoltage is increased by 15% to 80 kVp (A), overexposure occurs. Similarly, at 15% less, 60 kVp (C), the radiograph is underexposed. (Courtesy Euclid Seeram, British Columbia Institute of Technology.)
The simplest method used to increase or decrease OD on a radiograph is to increase or decrease the mAs. This reduces other possible factors that could affect the finished image. The various factors that affect OD are listed in Table 13-8.
TABLE 13-8
Technique Factors That May Affect Optical Density
| Factor Increased | Effect on Optical Density |
| Milliampere seconds (mAs) | Increase |
| Kilovolt peak (kVp) | Increase |
| Source-to-image receptor distance (SID) | Decrease |
| Thickness of part | Decrease |
| Mass density | Decrease |
| Development time | Increase |
| Image receptor speed | Increase |
| Collimation | Decrease |
| Grid ratio | Decrease |
Contrast
The function of contrast in the image is to make anatomy more visible. Contrast is the difference in OD between adjacent anatomical structures, or the variation in OD on a radiograph. Contrast, therefore, is perhaps the most important factor in radiographic quality.
Contrast on a radiograph is necessary for the outline or border of a structure to be visible. Contrast is the result of differences in attenuation of the x-ray beam as it passes through various tissues of the body.
Figure 13-11 shows an image of the abdomen that illustrates the difference in OD between adjacent structures. High contrast is visible at the bone–soft tissue interface along the spinal column. The soft tissues of the psoas muscle and kidneys exhibit much less contrast, although details of these structures are readily visible. The contrast resolution of the soft tissues can be enhanced with reduced kVp but at the expense of higher patient radiation dose.
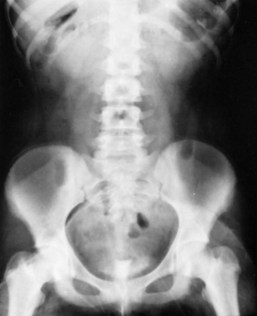
FIGURE 13-11 Radiograph of the abdomen showing the vertebral column with its inherent high contrast. The kidneys, liver, and psoas muscle are low-contrast tissues that are visualized better with low kVp. (Courtesy Euclid Seeram, British Columbia Institute of Technology.)
The penetrability of the x-ray beam is controlled by kVp. Obtaining adequate contrast requires that the anatomical part be adequately penetrated; therefore, penetration becomes the key to understanding image contrast. Compare the radiographs shown in Figure 13-12: Whereas Figure 13-12, A, shows high contrast or “short gray scale,” Figure 13-12, B, shows low contrast or a “long gray scale.”
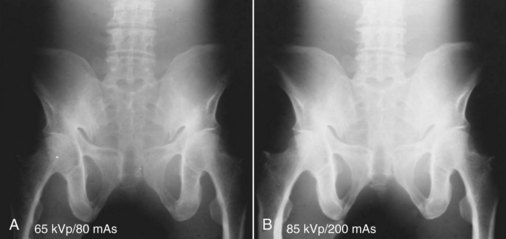
FIGURE 13-12 Radiographs of a pelvis phantom demonstrate a short scale of contrast (A) and a long scale of contrast (B). (Courtesy Kyle Thornton, City College of San Francisco.)
Gray scale of contrast refers to the range of ODs from the whitest to the blackest part of the radiograph. For example, think of using scissors to cut a small patch that represents each OD on the radiograph and then arranging the patches in order from lightest to darkest. The resulting OD range would be the gray scale of contrast.
High-contrast radiographs produce short gray scale. They exhibit black to white in just a few apparent steps. Low-contrast radiographs produce long gray scale and have the appearance of many shades of gray.
Figure 13-13 presents two radiographs of an aluminum step wedge—a penetrometer—that demonstrate scales of contrast. The one taken at 50 kVp shows that only five steps are visible. At 90 kVp, all 13 steps are visible because of the long scale of contrast.
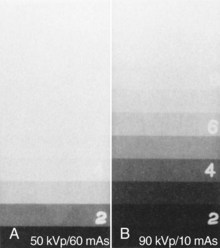
FIGURE 13-13 Images of a step wedge exposed at low kVp (A) and at high kVp (B) illustrate the meaning of short scale and long scale of contrast, respectively. (Courtesy Kyle Thornton, City College of San Francisco.)
To reduce contrast, the radiographer must produce a radiograph with longer gray scale contrast and therefore with more grays. This is done by increasing the kVp. Normally, a change of approximately 4% in kVp is required visually to affect the scale of contrast in the 50- to 90-kVp range. Whereas at lower kVp, a 2-kVp change may be sufficient, at higher kVp, a 10-kVp change may be required (Figure 13-14).
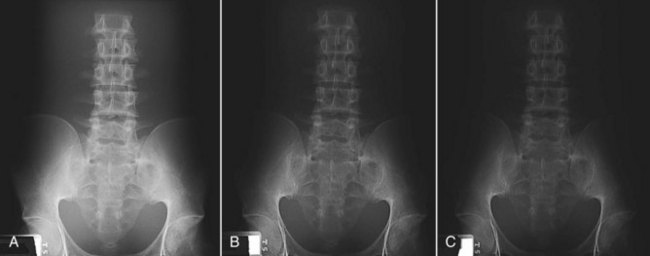
FIGURE 13-14 Radiographs of the pelvis and abdomen show that a 4-kVp increase results in a perceptible change in contrast. A, 75 kVp and 28 mAs. B, 79 kVp and 28 mAs. C, 81 kVp and 28 mAs. (Courtesy Mike Enriquez, Merced Community College.)
High contrast, “a lot of contrast,” or a “short scale of contrast” is obtained by using low-kVp exposure techniques. Low contrast is the same as “long scale of contrast” and results from high-kVp exposure techniques. These relationships in radiographic contrast are summarized in Table 13-9.
TABLE 13-9
Relationship Between Kilovolt Peak and Scale of Contrast
| High Kilovolt Peak Produces | Low Kilovolt Peak Produces |
| Long scale | Short scale |
| Low contrast | High contrast |
| Less contrast | More contrast |
In addition to kilovoltage, many other factors influence radiographic contrast. Although the mAs setting affects only x-ray quantity, not quality, it still influences contrast. If the mAs value is too high or too low, the predominant OD will fall on the shoulder or toe of the characteristic curve, respectively (see Chapter 10).
Radiographic contrast is low on the shoulder and toe regions because the gradient of the characteristic curve is low in these regions. The images of different structures have similar ODs despite differences in subject contrast.
The use of radiographic intensifying screens results in shorter contrast scale compared with nonscreen exposures. Collimation removes some scatter radiation, producing a radiograph of shorter contrast scale. Grids also reduce the amount of scatter that reaches the film, thus also producing radiographs of shorter contrast scale. Grids with a high ratio increase the contrast. The exposure technique factors that affect contrast are summarized in Table 13-10.
TABLE 13-10
Exposure Technique Factors That May Affect Radiographic Contrast*
| An Increase in This Factor | Results in the Following Change in Contrast |
| Kilovoltage | Decrease |
| Grid ratio | Increase |
| Beam restriction | Increase |
| Image receptor used | Variable |
| Development time | Decrease |
| Milliampere seconds | Decrease (toe, shoulder) |
A typical clinical problem faced by radiologic technologists involves adjustment of radiographic contrast. An image is made, but the contrast scale may be too long (too many grays) or too short (too much black and white). To solve such a problem, apply the 15% rule. Change the kVp by 15% while changing the mAs by one half or double.
A smaller technique compensation for a change in contrast scale may be required. An increase of 5% in kVp may be accompanied by a 30% reduction in mAs to produce the same OD at a slightly reduced contrast scale. This is known as the 5% rule.
Proper technique compensation by the radiologic technologist is a judgment call. The anatomical part, body habitus, suspected pathology, and x-ray image receptor characteristics all must be considered by the skillful radiologic technologist. With practice and experience, this will become second nature.
| Question: | A modest reduction in image contrast is required for a knee exposed at 62 kVp/12 mAs. What technique should be tried? |
| Answer: | Apply the 5% rule: 62 kVp × 0.05 = 3.1 kVp 62 + 3 = 65 kVp 12 mAs × 0.30 = 3.6 mAs 12 − 4 = 8 mAs Repeat technique = 65 kVp/8 mAs |
Detail
Detail describes the sharpness of appearance of small structures on the radiograph. With adequate detail, even the smallest parts of the anatomy are visible, and the radiologist can more readily detect tissue abnormalities. Image detail must be evaluated by two means—recorded detail and visibility of image detail.
Sharpness of image detail refers to the structural lines or borders of tissues in the image and the amount of blur of the image. Factors that generally control the sharpness of image detail are the geometric factors discussed in Chapter 10—focal-spot size, SID, and object-to-image receptor distance (OID). Sharpness of image detail also is influenced by the type of intensifying screen used and the presence of motion.
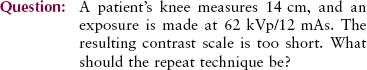
To produce the sharpest image detail, one should use the smallest appropriate focal spot and the longest SID and place the anatomical part as close to the image receptor as possible (i.e., minimize OID). Figure 13-15 shows two radiographs of a foot phantom. One was taken under optimum conditions and the other with poor technique. The difference in sharpness of image detail is obvious.
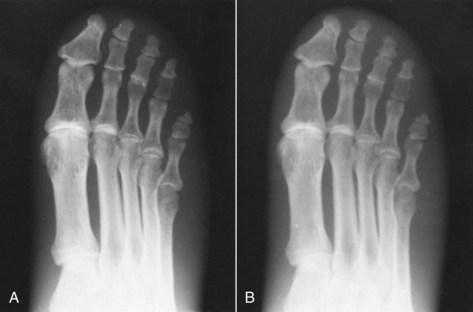
FIGURE 13-15 A radiograph taken with a 1-mm focal-spot x-ray tube (A) exhibits far greater detail than one taken with a 2-mm focal-spot x-ray tube (B). (Courtesy Mike Enriquez, Merced Community College.)
Visibility of image detail describes the ability to see the detail on the radiograph and is best measured by contrast resolution. Loss of visibility refers to any factor that causes deterioration or obscuring of image detail. For example, fog reduces the ability to see structural lines on the image.
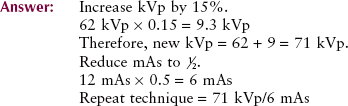
An attempt to produce the best-defined image can be made by using all the correct factors, but if the film is fogged by light or radiation, the detail present will not be fully visible (Figure 13-16). You might conclude that good detail is still present but that its visibility is poor. Because kVp and mAs influence image contrast, these factors must be chosen with care for each examination.
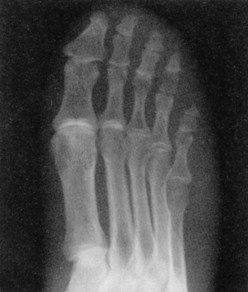
FIGURE 13-16 Same radiograph as shown in 15-15, A, except that visibility of image detail is reduced because of safelight fog. (Courtesy Mike Enriquez, Merced Community College.)
The assumption is that any factor that affects OD and contrast affects the visibility of image detail. Key factors that provide the best visibility of image detail are collimation, use of grids, and other methods that prevent scatter radiation from reaching the image receptor.
Distortion
The fourth image-quality factor is distortion, the misrepresentation of object size and shape on the radiograph. Because of the position of the x-ray tube, the anatomical part, and the image receptor, the final image may misrepresent the object.
Poor alignment of the image receptor or the x-ray tube can result in elongation of the image. Elongation means that the anatomical part of interest appears bigger than normal.
Poor alignment of the anatomical part may result in foreshortening of the image. Foreshortening means that the anatomical part appears smaller than normal. Figure 13-17 provides examples of elongation and foreshortening. Many body parts are naturally foreshortened as a result of their shape (e.g., ribs, facial bones).
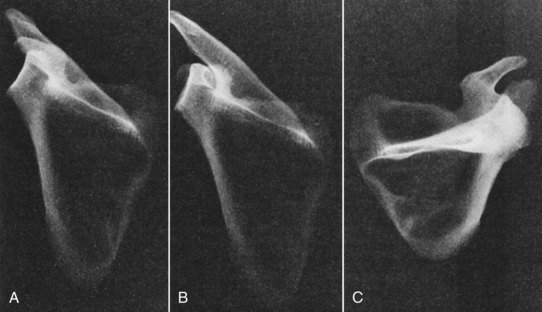
FIGURE 13-17 A, Normal projection of the scapula. B, Elongation of the scapula. C, Foreshortening of the scapula. (Courtesy Lynne Davis, Houston Community College.)
Distortion can be minimized through proper alignment of the tube, the anatomical part, and the image receptor. This alignment is fundamentally important for patient positioning.
Distortion is reduced by positioning the anatomical part of interest in a plane parallel to that of the image receptor.
Table 13-11 summarizes the principal radiographic image-quality factors. The primary controlling technique factor for each image-quality factor is given, as are secondary technique factors that influence each image-quality factor.
Exposure Technique Charts
kVp, mA, exposure time, and SID are the principal exposure technique factors. It is important for radiologic technologists to know how to manipulate these exposure technique factors to produce the desired OD, radiographic contrast, image detail, and distortion on the finished radiograph.
It is not necessary, however, to become creative with each new patient. For each radiographic imaging system, a chart should be available that describes standard methods for consistently producing high-quality images. Such an aid is called a radiographic technique chart. Radiographic technique charts are tables that provide a means for determining the specific technical factors to be used in a given radiographic examination.
For a radiographic technique chart to meet with success, the radiologic technologist must understand its purpose, how it was constructed, and how it is to be used. Most important, the technologist must know how to make adjustments for body habitus and pathologic processes.
Radiographic technique charts can be prepared to accommodate all types of facilities. The four principal types of charts are based on variable kilovoltage, fixed kilovoltage, high kilovoltage, and automatic exposure. Each chart provides the radiologic technologist with a guide to the selection of exposure factors for all patients and all examinations.
Most facilities select a particular type of chart for use and then prepare similar charts for each radiographic examination room. The type of chart selected usually depends on the technical director of radiology in place, the type of imaging systems available, the screen-film combination used, and the accessories available.
Radiographic technique charts and their use become an important issue in patient protection. Radiologic technologists are required to use their skills to produce the best possible image with a single exposure. Repeat examinations serve only to increase patient radiation dose.
A principal advantage of using technique charts is the consistency in exposure that occurs from one technologist to another and in comparison of examinations on the same patient on different dates and with different technologists.
Preparation of a technique chart does not require that it be created completely from scratch. Many authors have guides that can be used in preparation of specific charts. Each radiographic imaging system is unique in terms of its radiation characteristics. Therefore, a specific chart should be prepared and tested for each examination room.
Radiographic technique charts from books, pamphlets, and manufacturers should not be used as printed.
Before preparation of the radiographic technique chart begins, the x-ray equipment must be calibrated by a medical physicist, and the processing system must be thoroughly evaluated. The total filtration should also be determined. Although 2.5 mm Al is the prescribed standard, 3 mm Al total filtration or more may be available on the collimator housing. This significantly alters contrast and makes a considerable difference in any technique chart.
The type of grid to be used should be known and the collimator or beam restrictor checked for accurate light field and x-ray beam coincidence. This is most important so that all variables are reduced to a minimum. When a radiographic technique chart is found to be inadequate, these factors should be checked first.
The variable-kVp radiographic technique chart uses a fixed mAs value and a kVp that varies according to the thickness of the anatomical part. The basic characteristic of the variable-kVp chart is an inherently short scale of contrast. In general, exposures made with this method provide radiographs of shorter contrast scale because of the use of lower kVp.
Exposure directed by the variable-kVp chart usually results in higher patient dose and less exposure latitude. For success, the radiologic technologist must be accurate in measuring the anatomical part before selecting exposure factors from the chart. Without such care and attention, the anatomical part may not be fully penetrated because of the lower kVp.
A kVp can be established by approximate procedures, so a variable-kVp technique chart can be formulated. The beginning kVp depends on the voltage ripple as follows:
To begin preparation of a variable-kVp radiographic technique chart, select the body part for examination. For example, if the knee is chosen, use a knee phantom for test exposures.
First measure the thickness of the knee phantom, using a caliper designed for that purpose. Multiply that thickness by 2 and add 23; this indicates a kVp with which to begin if the high-voltage generator is of high frequency. If the high-voltage generator is single phase or three phase, 30 or 25, respectively, is the additive factor.
| Question: | A phantom knee measures 14 cm thick. What single-phase kVp should be used to begin construction of a variable-kVp technique chart? |
| Answer: | 14 cm × 2 = 28 + 30 = 58 kVp |
The kilovoltage setting for examination of the knee is 58 kVp. The next task is to select the optimal mAs setting at this kVp. This depends on the image receptor characteristics and the effectiveness of scatter radiation control. For example, when using a 400-speed image receptor with an 8 : 1 grid, make test exposures at 58 kVp with 9 mAs, 12 mAs, and 20 mAs (Figure 13-18). Select the radiograph that produces the best OD or make additional exposures at other mAs setting values if necessary.
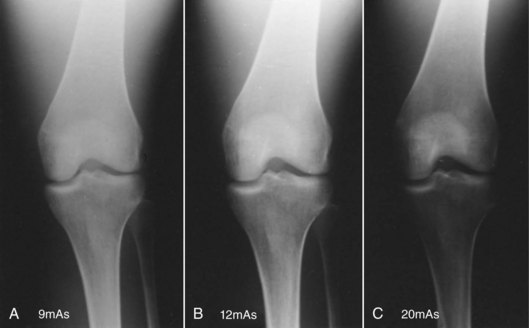
FIGURE 13-18 Radiographs of a knee phantom taken at 58 kVp. That obtained at 12 mAs (B) was selected to begin the variable-kilovoltage chart. (Courtesy Lynne Davis, Houston Community College.)
The result of this exercise is the first line of the variable-kVp technique chart. The kVp and mAs settings to be used when a knee measuring 14 cm is radiographed have been established at 58 kVp and 12 mAs, as shown in Table 13-12.
TABLE 13-12
Variable Kilovolt Peak Chart for Examination of the Knee
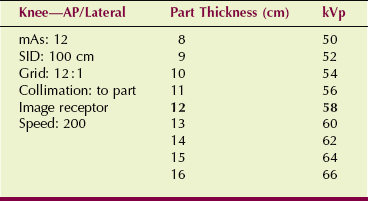
AP, anteroposterior; kVp, kilovolt peak; mAs, milliampere seconds.
To prepare a variable-kVp radiographic technique chart for other anatomical parts, the same procedure is used. Because radiologists prefer similar contrast scales for examination of the same anatomy, the variable-kVp technique chart has been replaced largely by the fixed-kVp technique chart.
The fixed-kVp radiographic technique chart is the one used most often. Developed by Arthur Fuchs, it is a method of selecting exposures that produce radiographs with a longer scale of contrast. The kVp is selected as the optimum required for penetration of the anatomical part. This usually results in somewhat higher kVp values for most examinations than are produced by the variable-kVp technique.
Once selected, the kVp is fixed at that level for each type of examination and does not vary according to different thicknesses of the anatomical part. The mAs value, however, is changed according to the thickness of the anatomical part to provide the proper OD. For example, all examinations of the knee might require 60 kVp with mAs adjusted to accommodate for differences in thickness.
Because the fixed-kVp technique usually requires higher kVp, one benefit is a lower patient dose. There is greater latitude and more consistency with exposures of the same anatomical part.
Measurement of the part is not critical because part size is grouped as small, medium, or large. For most x-ray examinations of the spine and trunk of the body, the optimal kVp is approximately 80 kVp. Approximately 70 kVp is appropriate for the soft tissue of the abdomen. For most extremities, the optimum would be approximately 60 kVp.
To prepare a fixed-kVp radiographic technique chart, the first step is to separate the anatomical part thickness into three groups—small, medium, and large—by identifying the range of thickness that is to be included in each group. With use of the abdomen as an example, small might be 14 to 20 cm; medium, 21 to 25 cm; and large, 26 to 32 cm.
For test exposures, use a medium-sized phantom and begin with 80 kVp. Produce radiographs at mAs increments of 40, 60, 80, and so forth, until the proper OD is attained (Figure 13-19). Again, the OD selected depends on the type of image receptor used and the scatter radiation control devices available.
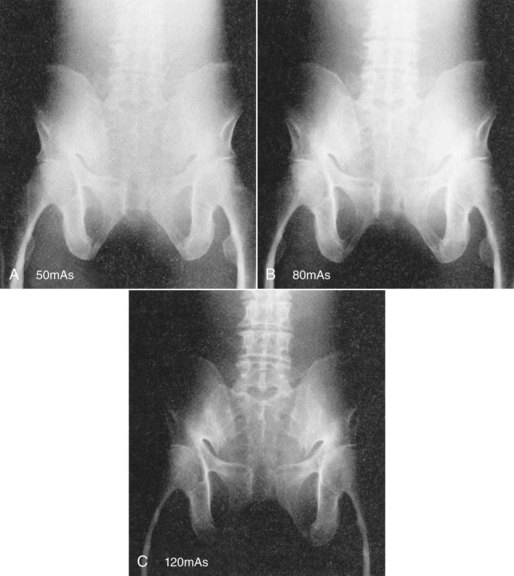
FIGURE 13-19 Radiographs of an abdomen phantom used to construct a fixed-kVp chart. All exposures were taken at 80 kVp. From this series, 80 mAs (B) was selected to begin the chart. (Courtesy Tammy Bauman, Banner Thunderbird Medical Center.)
After the proper OD has been established, the chart then can be expanded to include small and large anatomical parts. For small anatomical parts, reduce the mAs by 30%. For large anatomical parts, increase the mAs by 30%. For a part that is swollen as a result of trauma, a 50% increase may be required. Table 13-13 presents the results of a representative procedure.
TABLE 13-13
Fixed-Kilovolt Peak Chart for Examination of the Abdomen
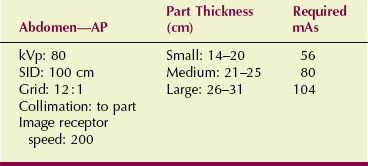
AP, anteroposterior; kVp, kilovolt peak; SID, source-to-image receptor distance.
Fixed-kVp charts also can be calculated with specific mAs values for every 2-cm thickness. This approach is more accurate than is use of subjective small, medium, and large labels.
The kVp selected for high-kVp technique charts is usually greater than 100. For example, overhead radiographs for procedures in which barium contrast medium is used would use 120 kVp for each exposure. High-kVp exposure techniques are ideal for barium work to ensure adequate penetration of the barium.
This type of exposure technique also could be used for routine chest radiography to attain improved visualization of the various tissue mass densities present in the lung fields and the mediastinum. Lower or more conventional kVp settings provide increased subject contrast between bone and soft tissue. When 120 kVp is selected for chest radiography, however, all skeletal tissue is penetrated, and visualization of the different soft tissue mass densities present is enhanced.
To prepare a high-kVp technique chart, the procedure is basically the same as for preparing the fixed-kVp technique chart. All exposures for a particular anatomical part would use the same kVp. Obviously, the mAs value would be much less.
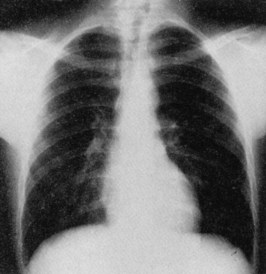
Test exposures are made with the use of a phantom to determine the appropriate mAs setting for adequate OD. Figure 13-20 shows a chest radiograph made at 120 kVp. Note the improved visualization of the tissue markings of the bronchial tree and the mediastinal structures compared with that of the low-kVp radiographs. An additional advantage of the high-kVp exposure technique is reduced patient dose.
Automatic Exposure Techniques
The appearance of the operating console of x-ray imaging systems is changing in response to the ability to incorporate computer-assisted technology. Several automated exposure techniques are now available, but none relieves the radiologic technologist of the responsibility of identifying particular characteristics of the patient and the anatomical part to be imaged.
Computer-assisted automatic exposure systems use an electronic exposure timer, such as those described in Chapter 5. Radiation intensity is measured with a solid state detector or an ionization chamber, and exposure is terminated when the proper radiation exposure to the image receptor has been reached. The principles associated with automatic exposure systems have already been described, but the importance of using radiographic exposure charts with these systems has not.
Automatic control x-ray systems are not completely automatic. It is incorrect to assume that because the radiologic technologist does not have to select kVp and mAs settings and time for each examination, a less qualified or less skilled operator can use the system.
Usually, the radiologic technologist must use a guide for the selection of kVp that is similar to that used in the fixed-kVp method. OD selections are scaled numerically to allow for “tweaking” the calibration of the sensors for changes in field size or anatomy that require OD adjustment.
Patient positioning must be absolutely accurate because the specific body part must be placed over the phototiming device to ensure proper exposure.
The factors shown in Table 13-14 must be considered when one is preparing the radiographic exposure chart for an automatic x-ray system. The kVp is selected according to the specific anatomical part that is being examined.
TABLE 13-14
Factors to Consider When Constructing an Exposure Chart for Automatic Systems
| Factor for Selection | Rationale for Selection |
| Kilovolt peak | To select for each anatomical part |
| Optical density control | To fine tune for differences in field size or anatomical part |
| Collimation | To reduce patient dose and ensure proper response of automatic exposure control |
| Accessory selection | To optimize the radiation dose–image quality ratio |
Radiation exposure in most x-ray imaging systems is determined by an automatic exposure control (AEC) system. AEC incorporates a device that senses the amount of radiation incident on the image receptor. Through an electronic feedback circuit, radiation exposure is terminated when a sufficient number of x-rays has reached the image receptor to produce an acceptable OD.
To image with the use of an AEC, the radiologic technologist selects the appropriate kVp, mA, and backup time, as well as the proper sensors and OD. Exposure is terminated when the image receptor has received the appropriate radiation exposure to correspond with the acceptable OD.
With AEC devices, usually two or more exposure sensors are available for control (Figure 13-21). For instance, three radiation-sensing cells may be available, and the technologist is responsible for selecting which of the sensors should be used for the examination. During a chest examination, if the mediastinum is the region of interest, only the central sensing cell is used. If the lung fields are of principal importance, the two lateral cells are activated.
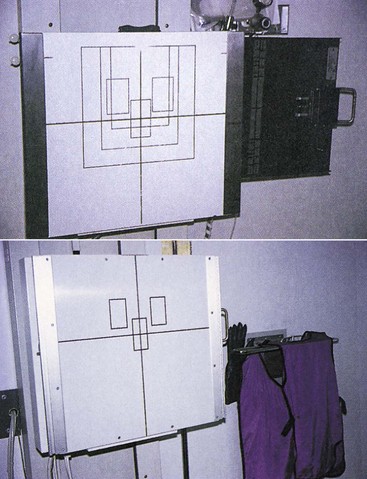
FIGURE 13-21 Vertical chest Bucky shows the position of automatic exposure control (AEC) sensors represented as three rectangles.
Regulations require that AECs have a 600-mAs safety override. If the AEC fails to terminate the exposure, the secondary safety circuit terminates it at 600 mAs, which is equivalent to a few seconds, depending on the mA.
In addition to selecting exposure cells, the radiologic technologist usually has a three- to seven-position dial labeled “OD” with numeric steps. Each step on the dial is calibrated to increase or decrease the preset average OD of the image receptor by 0.1. This control can be used to accommodate any unusual patient characteristics or to overcome the slowly changing calibration or sensitivity of the AEC.
A technique chart for AEC may be helpful. Such a chart would include mA, kVp, backup time, sensor selection, and OD setting.
Microprocessors are incorporated into operating consoles. A microprocessor allows the operator to select digitally any kVp or mAs setting; the microprocessor automatically activates the appropriate mA station and exposure time. With falling-load generators, the microprocessor begins the exposure at a maximum mA setting and then causes the tube current to be reduced during exposure. The overall objective is to minimize exposure time to reduce motion blur.
A widely used electronic technique for patient exposure control is referred to as anatomically programmed radiography (APR). APR also uses microprocessor technology. Rather than have the radiologic technologist select a desired kVp and mAs, graphics on the console or on a video touch screen guide the technologist (Figure 13-22).
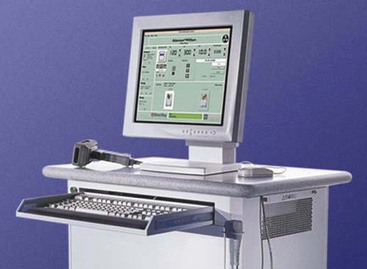
FIGURE 13-22 Anatomically programmed radiography (APR) operating console with lower ribs and automatic exposure control selected.
To produce an image, the radiologic technologist simply touches an icon or a written description of the anatomical part to be imaged and the body habitus. The microprocessor selects the appropriate kVp and mAs settings automatically. The whole process uses AEC, resulting in near-flawless radiographs and fewer repeats. However, precise patient positioning relative to the phototiming sensor is still critical for producing high-quality radiographs.
The principle of APR is similar to that of AEC, with the radiographic technique chart stored in the microprocessor of the control unit. The service engineer loads the controlling programs during installation and calibrates the exposure control circuit for the general conditions of the facility.
The radiologic technologist needs only to select the part and its relative size before each exposure. The programmed instructions, however, must be continuously adjusted by the radiologic technologist until the entire panel of examinations is optimized for best image quality.
Common to all AEC systems is the need for the radiographer to be very conscious of the possibility that scatter radiation may reach the sensing cells. These cells cannot tell the difference between primary beam and scatter radiation, so if a high proportion of scatter radiation reaches the cells, the exposure is terminated prematurely.
A classic example of a situation in which this can occur is the lateral lumbar spine examination. A piece of lead rubber on the tabletop behind the patient on the edge of the illuminated field absorbs scatter radiation, thereby correcting this problem.
Tomography
A conventional radiograph of the chest or abdomen images all structures contained in these parts of the body with approximately equal fidelity. Structures, however, are superimposed on one another, and often this superimposition results in masking of the structure of interest. When this occurs, a procedure called conventional tomography may be necessary.
The tomographic examination is designed to image only that anatomy that lies in a plane of interest while blurring structures on either side of that plane. The radiographic contrast of the tissue of interest is enhanced by blurring of the anatomical structures above and below that tissue.
Most features of a tomographic x-ray imaging system appear similar to those of a conventional radiographic imaging system (Figure 13-23). Note the vertical rod that connects the x-ray tube above the table with the image receptor below the patient to enable both to move in reciprocal fashion about the fulcrum. This feature is unique to tomography.
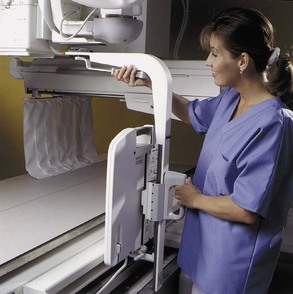
FIGURE 13-23 This tomography system is designed for linear movement with a general-purpose imaging system. (Courtesy General Electric Medical Systems.)
As the top of the rod moves in one direction, the bottom of the rod moves in the opposite direction. At one point, no movement is occurring in either direction. This is the fulcrum; all images at the level of the fulcrum are stationary, thus appearing with less blur and higher contrast.
Since the introduction of CT, magnetic resonance imaging (MRI), and digital radiographic tomosynthesis with their excellent contrast resolution, conventional tomography is used less frequently. Conventional tomography is now applied principally to high-contrast procedures, such as imaging of calcified kidney stones. Table 13-15 lists the more common tomographic examinations and their representative techniques.
TABLE 13-15
Representative Linear Tomography Techniques
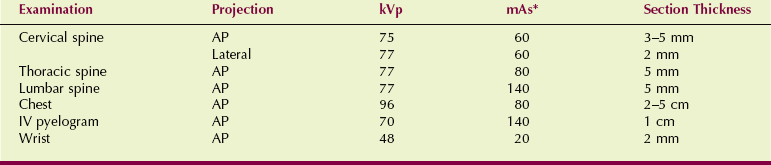
AP, anteroposterior; IV, intravenous; kVp, kilovolt peak; mAs, milliampere seconds.
*Usually automatic exposure control.
The simplest tomographic examination is linear tomography. During linear tomography (Figure 13-24), the x-ray tube is attached mechanically to the image receptor and moves in one direction while the image receptor moves in the opposite direction.
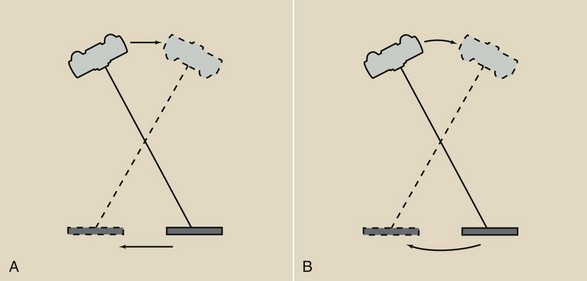
FIGURE 13-24 A, Image receptor and tube head of a general-purpose x-ray imaging system designed to move tomographically within a plane. B, An imaging system designed for tomography to move within an arc.
Other aspects of the linear tomographic examination are shown in Figure 13-25. The fulcrum is the imaginary pivot point about which the x-ray tube and the image receptor move. The position of the fulcrum determines the object plane, and only those anatomical structures lying within this plane are imaged clearly.
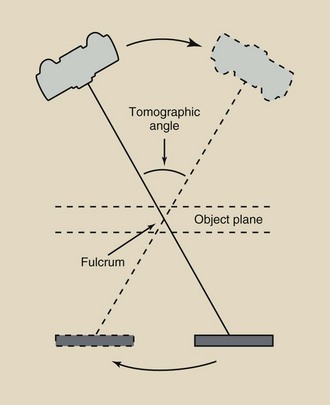
Figure 13-26 illustrates how anatomical structures in the object plane are imaged while structures above and below this plane are not. The examination begins with the x-ray tube and the image receptor positioned on opposite sides of the fulcrum. Exposure begins as the x-ray tube and the image receptor move simultaneously in opposite directions. The image of an anatomical structure lying in the object plane, such as the arrow, will have a fixed position on the image receptor throughout tube travel.
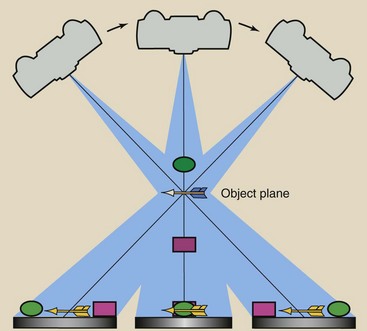
FIGURE 13-26 Only objects lying in the object plane are properly imaged. Objects above and below this plane are blurred because they are imaged across the film.
On the other hand, images of structures lying above or below the object plane, such as the ball and the box, will exhibit varying positions on the image receptor during tomographic movement. Note that not only are the images of the ball and the box blurring because they are moving across the image receptor, but each is moving in an opposite direction.
Consequently, the ball and the box will be blurred. The larger the tomographic angle, the more blurred are the images of structures above and below the object plane.
Objects lying outside the plane of the fulcrum will exhibit increasing motion blur with increasing distance from the object plane. The thickness of tissue that will be imaged is called the tomographic section, and its thickness is controlled by the tomographic angle (Figure 13-27).
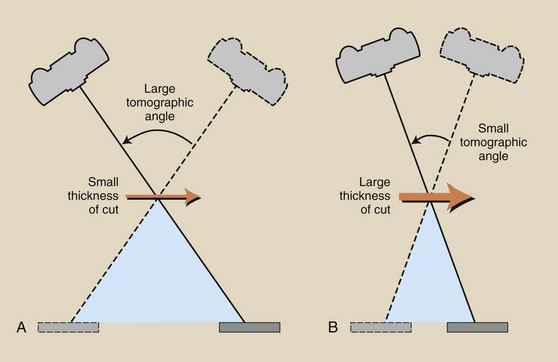
FIGURE 13-27 Section thickness is determined by the tomographic angle. A, A large tomographic angle results in a thin section. B, A small tomographic angle results in a thick section.
Table 13-16 shows the approximate relationship between tomographic angle and tomographic section thickness.
TABLE 13-16
Approximate Values for Section Thickness During Linear Tomography as a Function of Tomographic Angle
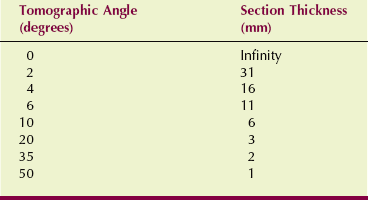
When the tomographic angle is very small (e.g., 0 degrees), the section thickness is the entire anatomical structure, resulting in a conventional radiograph. When the tomographic angle is 10 degrees, the section thickness is approximately 6 mm; structures lying farther than approximately 3 mm from the object plane appear blurred.
A linear anatomical structure can be imaged with less blur if the length of the structure is positioned parallel to the x-ray tube motion. This is illustrated with a tomographic test object (Figure 13-28). Conversely, Figure 13-29 shows how linear structures that lie perpendicular to the x-ray tube motion are blurred more easily.
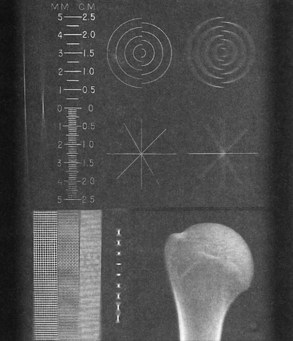
FIGURE 13-28 This test object image shows properly calibrated elevation and increased blur of objects perpendicular to the motion of the x-ray tube. (Courtesy Sharon Glaze, Baylor College of Medicine.)
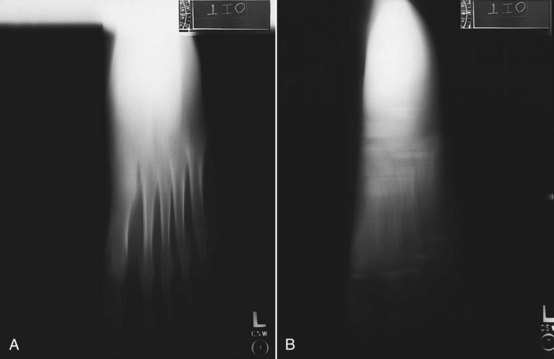
FIGURE 13-29 Foot tomographs obtained with x-ray tube motion. A, Parallel to the body axis. B, Perpendicular to the body axis. (Courtesy Rees Stuteville, Oregon Institute of Technology.)
If the tomographic angle is less than about 10 degrees, the section thickness will be quite large (see Table 13-16). This type of tomography is called zonography because a relatively large zone of tissue is imaged. Zonography is used when the subject contrast is so low that thin-section tomography would result in a poor image. Zonography finds greatest application in chest and renal examination, in which tomographic angles of 5 to 10 degrees usually are used.
Panoramic tomography was first developed for a fast dental survey but finds increasing diagnostic application of the curved bony structures of the head, such as the mandible. For this procedure, the x-ray tube and the image receptor move around the head, as shown in Figure 13-30. The x-ray beam is collimated to a slit as shown. The image receptor is likewise slit collimated. During the examination, the image receptor translates behind the slit collimator, so it is exposed for several seconds along its length. Figure 13-31 is a clinical example.
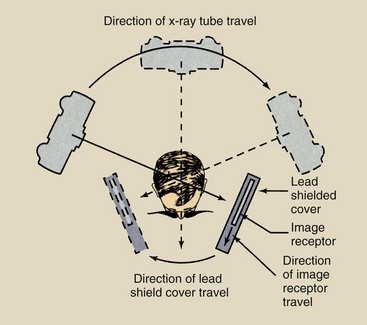
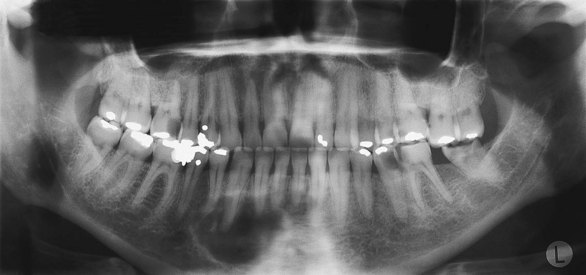
FIGURE 13-31 Panoramic tomogram showing restorations and a right mandibular defect. (Courtesy Kenneth Abramovitch, University of Texas Dental Branch.)
The principal advantage of tomography is its improved radiographic contrast. Through blurring of overlying and underlying tissues, the subject contrast of tissue of the tomographic section is enhanced.
The principal disadvantage of tomography is increased patient dose. The x-ray tube is on during the entire period of tube travel, which can last several seconds. A single nephrotomographic exposure (examination of the kidneys), for example, can result in a patient dose of 10 mGyt (1000 mrad).
Furthermore, most tomographic examinations require several exposures to ensure that the tomographic section of interest is imaged. A 16-film tomographic examination can result in a patient dose of several mGyt (rad).
During tomography, parallel grids must be used, and the grid lines must be oriented in the same direction as the tube movement.
Grids are used during tomography for the same reason that they are used during radiography. For linear tomography, this usually means that the grid will be positioned with its grid lines parallel to the length of the table.
Magnification Radiography
Magnification radiography is a technique that is used principally by interventional radiologists and frequently in mammography. Magnification radiography enhances the visualization of small structures. Conventional radiography strives to minimize the OID. Magnification radiography deliberately increases the OID.
To obtain a magnified radiograph, the OID is increased while the SID is held constant (Figure 13-32). The degree of magnification is given by the magnification factor (MF) as follows:
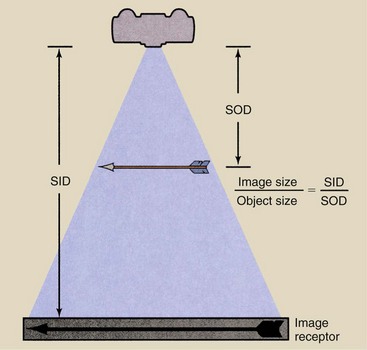
FIGURE 13-32 Principle of magnification radiography. The magnification factor is equal to the ratio of image size to object size.
 Magnification Factor
where SID is the source-to-image receptor distance and SOD is the source-to-object distance.
| Question: | A magnified radiograph of the sella turcica is taken at 100 cm SID with the object positioned 25 cm from the image receptor. If the image of the sella turcica measures 16 mm, what is its actual size? |
| Answer: |
A small focal spot must be used for magnification radiography to help reduce the loss of image detail. The focal-spot blur that results from an unnecessarily large focal spot can destroy the diagnostic value of the magnified radiograph.
Usually, grids are not needed for magnified radiography. The large OID results in a significant air gap so that much of the scatter radiation misses the image receptor. With larger OID, less scatter radiation reaches the image receptor.
The principal disadvantage of magnification radiography, similar to so many specialized techniques, is increased patient radiation dose. To obtain a MF of 2, one must position the patient halfway between the x-ray tube and the image receptor. Recall that radiation intensity is related to the square of the distance, which suggests a fourfold increase in patient radiation dose. In reality, most magnification radiographs result in only three times the normal patient dose because grids are not used.
Summary
Radiographic exposure factors (kVp, mAs, and SID) are manipulated by radiologic technologists to produce high-quality radiographs. Exposure factors influence radiographic quantity (number of x-rays) and quality (penetrability of the x-rays). Proper selection of exposure factors optimizes the spatial resolution and the contrast resolution of the image.
Radiographic technique is the combination of factors used to expose an anatomical part to produce a high-quality radiograph. Radiographic technique is characterized by the following: (1) patient factors, (2) image-quality factors, and (3) exposure technique factors.
Patient factors include anatomical thickness, body composition, and any pathology that is present. Radiographers recognize sthenic, asthenic, hyposthenic, and hypersthenic body habitus types as a way to determine body composition and thus to select proper radiographic technique. Pathology in the body may be destructive and therefore radiolucent, which requires a reduction in technique, or constructive and therefore radiopaque, which requires an increase in technique.
Image-quality factors include OD, contrast, image detail, and distortion. OD, blackening of the radiograph, is defined as the log of the incident light over the transmitted light. Contrast is the difference in OD between adjacent anatomical structures.
Whereas high kVp produces low-contrast images, low kVp produces high-contrast images. Image detail is the sharpness of the image on the radiograph. To produce the sharpest image detail, the smallest focal spot, the longest SID, and the least OID should be used. Distortion refers to misrepresentation of object size or shape on the radiograph.
The two technique charts used most commonly by radiographers to produce consistently high-quality radiographs are the fixed-kVp chart and the high-kVp chart. The high-kVp chart is used for barium studies and chest radiographs with kVp from 120 to 135 kVp. The fixed-kVp chart uses approximately 60 kVp for extremity radiography and approximately 80 kVp for examinations of the trunk of the body.
Even with AEC, radiographic exposure charts are required. APR uses microprocessor technology to program the technique chart into the control unit. The radiographer selects an anatomical display of the part, and the microprocessor selects the appropriate kVp and mAs settings automatically.
Although CT and MRI have replaced many plain-film conventional tomographic examinations, tomography of the chest and kidneys still is performed. The emphasis is generally on linear techniques with thin 1-cm tomographic sections.
The tomographic object plane contains the fulcrum—the imaginary pivot point from which the tube and the image receptor move. The tomographic angle is the angle of movement that determines tomographic section thickness. The principal advantage of tomography is its improved radiographic contrast.
Magnification radiography is a technique that is used mainly for mammography and interventional radiography.
1. Define or otherwise identify the following:
2. Discuss how an increase in kVp changes x-ray quantity, x-ray quality, and contrast scale.
3. List and discuss the four exposure technique factors. How does each affect OD?
4. What is normally the shortest radiographic exposure time on single-phase, three-phase, and high-frequency imaging systems?
5. Describe how a change in SID from 100 cm to 180 cm should be accompanied by a change in mA and exposure time.
6. Why does an x-ray tube have two focal-spot sizes?
7. A radiographic technique calls for 82 kVp at 400mA, 200 ms, and an SID of 90 cm. What is the mAs?
8. Discuss the components of total x-ray beam filtration.
9. A radiographic technique calls for 800 mA at 50 ms. What is the mAs setting?
10. The normal lateral chest technique is 120 kVp, 100 mA, 15 ms. To reduce motion blur, the radiologic technologist shortens exposure time to 5 ms. What is the new mA?
11. Explain the following statement: Changing the mA does not change the kinetic energy of electrons flowing across the x-ray tube.
12. Why is it important to keep exposure time as short as possible?
13. Identify the range of optical densities that are too light, too dark, and within the useful range.
14. An examination requires 78 kVp/150 mAs at 100 cm SID. If the distance is changed to 180 cm, what should be the new mAs setting?
15. Describe the two focal spots available in x-ray tubes. Explain how each is used typically.
16. When a change in OD is required, what exposure technique factors should be changed, and why?
17. Explain how high-voltage generation influences x-ray beam quantity and quality.
18. How does body habitus affect the selection of technical factors?
19. What is the principal advantage of exposure with a large focal spot compared with a small focal spot?
20. Define contrast. Give examples of tissues with high contrast and with low contrast.
The answers to the Challenge Questions can be found by logging on to our website at http://evolve.elsevier.com.