Concepts of Radiographic Image Quality
At the completion of this chapter, the student should be able to do the following:
1 Define radiographic image quality, resolution, noise, and speed.
2 Interpret the shape of the characteristic curve.
3 Identify the toe, shoulder, and straight-line portion of the characteristic curve.
4 Distinguish the geometric factors that affect image quality.
5 Analyze the subject factors that affect image quality.
6 Examine the tools and techniques available to create high-quality images.
RADIOGRAPHIC IMAGE quality is the exactness of representation of the patient’s anatomy on a radiographic image. High-quality images are required so that radiologists can make accurate diagnoses. To produce high-quality images, radiographers apply knowledge of the three major interrelated categories of radiographic quality: film factors, geometric factors, and subject factors. Each of these factors influences the quality of a radiographic image, and each is under the control of radiologic technologists. The selection of radiographic technique factors is discussed in this chapter.
Definitions
The term radiographic image quality refers to the fidelity with which the anatomical structure that is being examined is rendered on the radiograph. A radiograph that faithfully reproduces structure and tissues is identified as a high-quality radiograph.
The quality of a radiographic image is not easy to define, and it cannot be measured precisely. A number of factors affect radiographic image quality, but no precise, universally accepted measures by which to judge it have been identified.
The most important characteristics of radiographic image quality are spatial resolution, contrast resolution, noise, and artifacts. Artifacts are discussed in Chapter 18. Furthermore, this chapter deals with screen-film radiography. Digital radiography is covered in Part IV.
Resolution
Resolution is the ability to image two separate objects and visually distinguish one from the other. Spatial resolution refers to the ability to image small objects that have high subject contrast, such as a bone–soft tissue interface, a breast microcalcification, or a calcified lung nodule. Screen-film radiography has excellent spatial resolution. The measure of spatial resolution is discussed more completely in Chapter 28.
 Spatial resolution improves as screen blur decreases, motion blur decreases, and geometric blur decreases.
Contrast resolution is the ability to distinguish anatomical structures of similar subject contrast such as liver–spleen and gray matter–white matter. The actual size of objects that can be imaged is always smaller under conditions of high subject contrast than under conditions of low subject contrast.
The less precise terms detail and recorded detail sometimes are used instead of spatial resolution and contrast resolution. These terms refer to the degree of sharpness of structural lines on a radiograph. Visibility of detail refers to the ability to visualize recorded detail when image contrast and optical density (OD) are optimized.
Noise
Noise is a term that is borrowed from electrical engineering. The flutter, hum, and whistle heard from an audio system constitute audio noise that is inherent in the design of the system. The “snow” on television screens, especially in weak signal areas, is video noise, and it is also inherent in the system.
Radiographic noise also is inherent in the imaging system (Figure 10-1). A number of factors contribute to radiographic noise, including some that are under the control of radiologic technologists. Lower noise results in a better radiographic image because it improves contrast resolution.
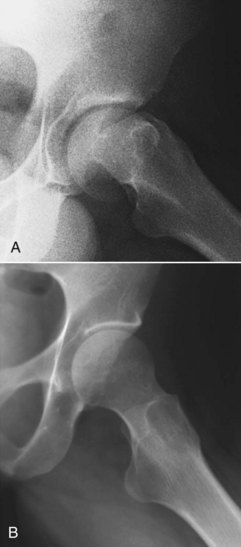
FIGURE 10-1 A, Hip radiograph demonstrating the mottled, grainy appearance associated with quantum mottle that results from the use of a low number of x-rays to produce the image. B, In comparison, an optimal hip image shows greater recorded detail. (Courtesy Tim Gienapp, Apollo College.)
Radiographic noise has four components: film graininess, structure mottle, quantum mottle, and scatter radiation. The principal source of radiographic noise—scatter radiation—is discussed in Chapter 13.
Film graininess refers to the distribution in size and space of silver halide grains in the emulsion. Structure mottle is similar to film graininess but refers to the phosphor of the radiographic intensifying screen. Film graininess and structure mottle are inherent in the screen-film image receptor. They are not under the control of the radiologic technologist, and they contribute very little to radiographic noise, with the exception of mammography.
Quantum mottle is somewhat under the control of the radiologic technologist and is a principal contributor to radiographic noise in many radiographic imaging procedures. Quantum mottle refers to the random nature by which x-rays interact with the image receptor.
If an image is produced with just a few x-rays, the quantum mottle will be higher than if the image is formed from a large number of x-rays. The use of very fast intensifying screens results in increased quantum mottle.
Quantum mottle is similar to the sowing of grass seed. If very little seed is broadcast, the resulting grass will be thin with only a few blades. Likewise, when fewer x-rays are “cast” at the image receptor, the resulting image appears mottled. On the other hand, if a lot of seed is cast, the resulting grass will be thick and smooth. In the same way, when more x-rays interact with the image receptor, the image appears smooth, like a lush lawn.
Speed
Two of the characteristics of radiographic quality, resolution and noise, are intimately connected with a third characteristic—speed. Although the speed of the image receptor is not apparent on the radiographic image, it very much influences resolution and noise. In fact, a variation in any one of these characteristics alters the other two (Figure 10-2). In general, the following rules apply:
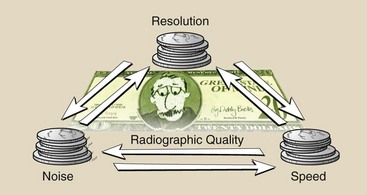
Radiographic Quality Rules
1. Fast image receptors have high noise and low spatial resolution and low contrast resolution.
2. High spatial resolution and high contrast resolution require low noise and slow image receptors.
3. Low noise accompanies slow image receptors with high spatial resolution and high contrast resolution.
Radiologic technologists are provided with all of the physical tools required to produce high-quality radiographs. Skillful radiologic technologists properly manipulate these tools according to each specific clinical situation.
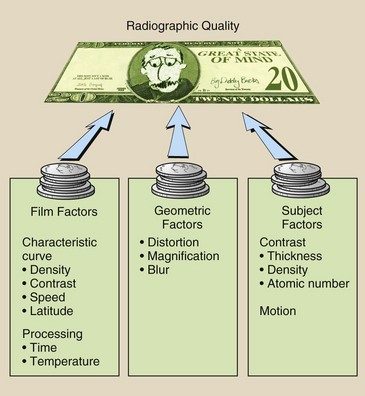
In general, the quality of a radiograph is directly related to an understanding of the basic principles of x-ray physics and the factors that affect radiographic quality. Figure 10-3 is an organizational chart of the principal factors that affect screen-film radiographic quality, most of which are under the control of radiologic technologists. Each is considered in detail in this chapter.
Film Factors
Unexposed x-ray film that has been processed appears quite lucent, like frosted window glass. It easily transmits light but not images. On the other hand, exposed, processed x-ray film can be quite opaque. Properly exposed film appears with various shades of gray, and heavily exposed film appears black.
The study of the relationship between the intensity of exposure of the film and the blackness after processing is called sensitometry. Knowledge of the sensitometric aspects of radiographic film is essential for maintaining adequate quality control.
Characteristic Curve
The two principal measurements involved in sensitometry are the exposure to the film and the percentage of light transmitted through the processed film. Such measurements are used to describe the relationship between OD and radiation exposure. This relationship is called a characteristic curve, or sometimes the H & D curve after Hurter and Driffield, who first described this relationship.
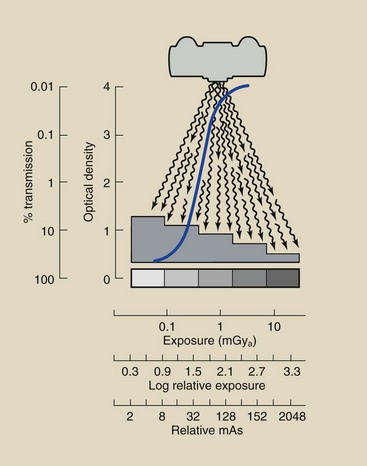
A typical characteristic curve is shown in Figure 10-4.
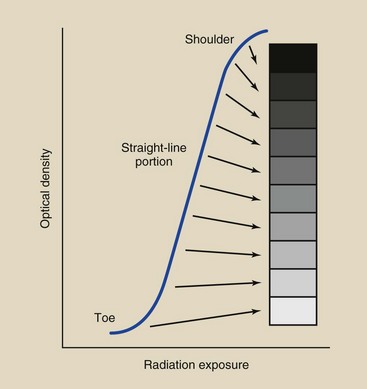
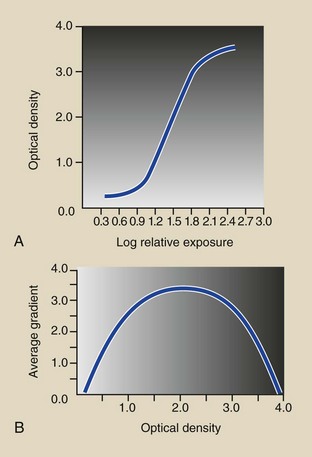
FIGURE 10-4 The characteristic curve of a radiographic screen-film image receptor is the graphic relationship between optical density (OD) and radiation exposure.
At low and high radiation exposure levels, large variations in exposure result in only a small change in OD. These portions of the characteristic curve are called the toe and the shoulder, respectively.
At intermediate radiation exposure levels, small changes in exposure result in large changes in OD. This intermediate region, called the straight-line portion, is the region in which a properly exposed radiograph appears.
Two pieces of apparatus are needed to construct a characteristic curve: an optical step wedge, sometimes called a sensitometer, and a densitometer, a device that measures OD. The steps involved are outlined in Figure 10-5, in which an aluminum step wedge, or penetrometer, is shown as an alternative to the sensitometer. Figure 10-6 shows these quality control devices.
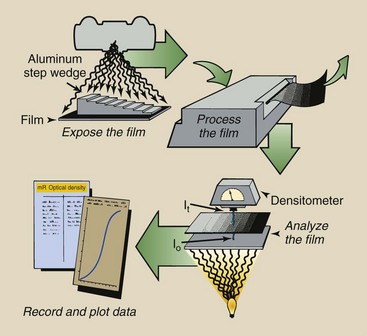
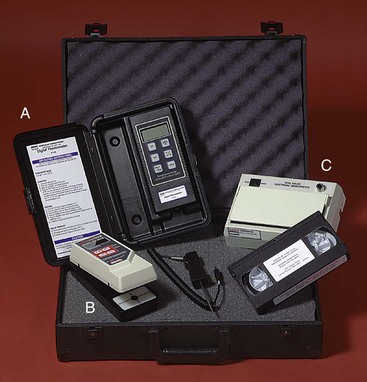
FIGURE 10-6 The digital thermometer (A), the densitometer (B), and the sensitometer (C) are the tools necessary for producing a characteristic curve and for providing routine quality control. (Courtesy Cardinal Health.)
First, the film under investigation is exposed to visible light—flashed—through the sensitometer. When processed, the film will have areas of increasing OD that correspond to optical wedge steps. The sensitometer is fabricated so that the relative intensity of light exposure to the film under each step can be determined.
The processed film is analyzed in the densitometer, a device that has a light source focused through a pinhole. A light-sensing device is positioned on the opposite side of the film. The radiographic film is positioned between the pinhole and the light sensor, and the amount of light transmitted through each step of the radiographic image is measured. These data are recorded and analyzed and, when plotted, result in a characteristic curve.
Radiographic film is sensitive over a wide range of exposures. Screen film, for example, responds to radiation intensities from less than 0.01 to greater than 10 mGya (1–1000 mR). Consequently, the exposure values for a characteristic curve are presented in logarithmic fashion.
Furthermore, it is not the absolute exposure that is of interest but rather the change in OD over each exposure interval. Therefore, log relative exposure (LRE) is used as the scale along the x-axis.
Figure 10-7 shows the exposure in mGya, the LRE, and the relative mAs for a representative film-screen combination. The LRE scale usually is presented in increments of 0.3 because the log of 2, doubling the exposure, is 0.3. Doubling the exposure can be achieved by doubling the mAs, as the x-axis scale in Figure 10-7 shows.
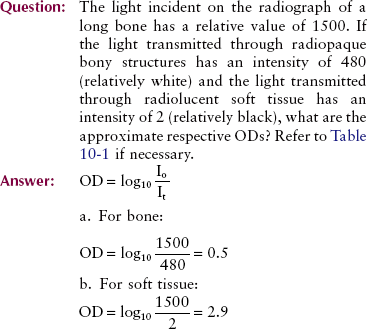
Optical Density
It is not enough to say that OD is the degree of blackening of a radiograph or that a clear area of the radiograph represents low OD and a black area represents high OD. OD has a precise numeric value that can be calculated if the level of light incident on a processed film (Io) and the level of light transmitted through that film (It) are measured. The OD is defined as follows:
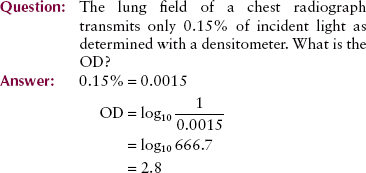
OD is a logarithmic function. Logarithms allow a wide range of values to be expressed by small numbers. Radiographic film contains ODs that range from near 0 to 4. These ODs correspond to clear and black, respectively. An OD of 4 actually means that only one in 10,000 light photons (104) is capable of penetrating the x-ray film. Table 10-1 shows the range of light transmission as it corresponds to various levels of OD.
TABLE 10-1
Relationship of the Optical Density of Radiographic Film to Light Transmission Through the Film
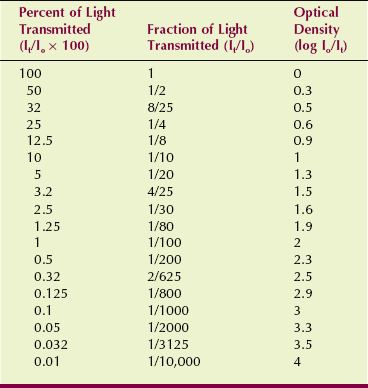
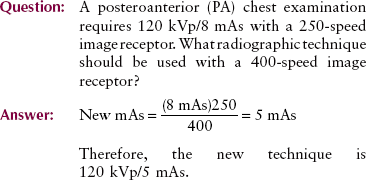
| Question: | The OD of a region of a lung field is 2.5. What percentage of visible light is transmitted through that region of the image? |
| Answer: | Reference to Table 10-1 shows that an OD = 2.5 is equal to 2 of every 625 light photons that are being transmitted, or 0.32%. |
High-quality glass has an OD of zero, which means that all light incident on such glass is transmitted. Unexposed radiographic film allows no more than approximately 80% of incident light photons to be transmitted. Most unexposed and processed radiographic film has an OD in the range of 0.1 to 0.3, corresponding to 79% and 50% transmission, respectively.
These ODs of unexposed film are attributable to base density and fog density (Figure 10-8). Base density is the OD that is inherent in the base of the film. It is attributable to the composition of the base and the tint added to the base to make the radiograph more pleasing to the eye. Base density has a value of approximately 0.1.
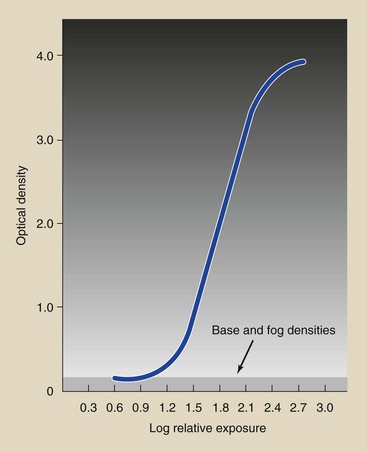
FIGURE 10-8 Base and fog densities reduce radiographic image contrast and should be as low as possible.
Fog density is the development of silver grains that contain no useful information. Fog density results from inadvertent exposure of film during storage, undesirable chemical contamination, improper processing, and a number of other influences. Fog density on a processed radiograph should not exceed 0.1.
The useful range of OD is approximately 0.25 to 2.5. Most radiographs, however, show image patterns in the range of 0.5 to 1.25 OD. Attention to this part of the characteristic curve is essential. However, whereas very low OD may be too light to contain an image, very high OD requires a hot light to view the image.
The most useful range of OD is highly dependent on viewbox illumination, the viewing conditions, and the shape of the characteristic curve. For example, with high-contrast mammography image receptors, high-luminance viewboxes, and good viewing conditions, the most useful OD range is approximately 0.25 to 2.5 with gross features and as high as 3.5 with fine features such as skin lines.
Reciprocity Law
One would think that the OD on a radiograph would depend strictly on the total exposure (mAs) and would be independent of the time of exposure. This, in fact, is the reciprocity law. Whether a radiograph is made with short exposure time or long exposure time, the reciprocity law states that the OD will be the same if the mAs value is constant.
The reciprocity law states that the OD on a radiograph is proportional only to the total energy imparted to the radiographic film and independent of the time of exposure.
The reciprocity law holds for direct exposure with x-rays, but it does not hold for exposure of film by the visible light from radiographic intensifying screens. Consequently, the reciprocity law fails for screen-film exposures at exposure times less than approximately 10 ms or longer than approximately 2 s.
Optical density is somewhat less at such short or long exposure times than exposure times within that range even though radiation exposure is the same. The reciprocity law is important for special procedures that require very short or very long exposure times, such as angiointerventional radiography and mammography, respectively. For these few situations, increasing the mAs setting may be required if automatic exposure control does not compensate for reciprocity law failure.
Contrast
When a high-quality radiograph is placed on an illuminator, the differences in OD are obvious in the image. Such OD variations are called radiographic contrast. A radiograph that has marked differences in OD is a high-contrast radiograph. On the other hand, if the OD differences are small and are not distinct, the radiograph is of low contrast. Figure 10-9 illustrates the difference between high contrast and low contrast with a photograph.
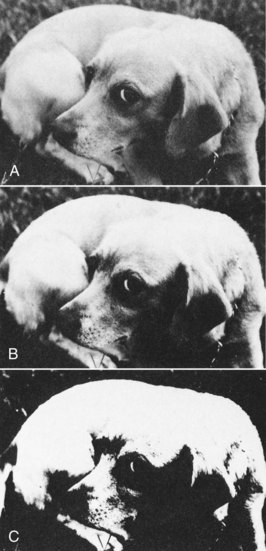
FIGURE 10-9 This vicious guard dog is posed to demonstrate differences in contrast. A, Low contrast. B, Moderate contrast. C, High contrast. (Courtesy Butterscotch.)
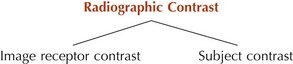
Radiographic contrast is the product of two separate factors:
• Image receptor contrast is inherent in the screen-film combination and is influenced somewhat by processing of the film.
• Subject contrast is determined by the size, shape, and x-ray–attenuating characteristics of the anatomy that is being examined and the energy (kVp) of the x-ray beam.
Radiographic contrast can be greatly affected by changes in image receptor contrast or subject contrast. In the clinical setting, it is usually best to standardize the image receptor contrast and alter the subject contrast according to the needs of the examination. Subject contrast is discussed in greater detail later.
Image receptor contrast is inherent in the type of radiographic film and intensifying screen that is being used. However, it can be influenced by two other factors: the range of ODs and the film processing technique.
Film selection usually is limited and is determined somewhat by the intensifying screen used. Film-screen images always have higher contrast compared with direct film exposure images.
The best control radiologic technologists can exercise involves exposing the image receptor properly so that the ODs lie within the diagnostically useful range of 0.25 to 2.5 and a bit higher in mammography. When exposure of the image receptor results in an OD outside this range, contrast is lost because the image is in the toe or the shoulder of the characteristic curve (Figure 10-10).
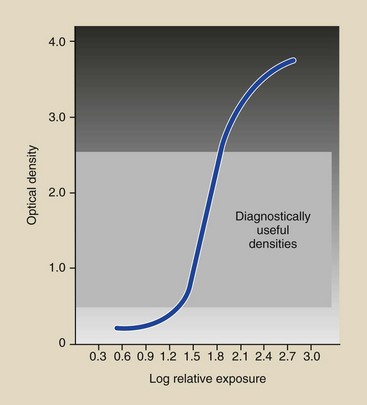
FIGURE 10-10 If exposure of the film results in optical densities (ODs) that lie in the toe or shoulder region, where the slope of the curve is less, contrast is reduced.
Standardized film processing techniques are absolutely necessary for consistent film contrast and good radiographic quality. Deviation from the manufacturer’s recommendations results in reduced contrast.
The characteristic curve of an image receptor allows one to judge at a glance the relative degree of contrast. If the slope or steepness of the straight-line portion of the characteristic curve had a value of 1, then it would be angled at 45 degrees. An increase of 1 unit along the LRE axis would result in an increase of 1 unit along the OD axis. The contrast would be 1.
An image receptor that has a contrast of 1 has very low contrast. Image receptors with a contrast higher than 1 amplify the subject contrast during x-ray examination. An image receptor with a contrast of 3, for instance, would show large OD differences over a small range of x-ray exposure.
In general, it is not necessary for radiologic technologists to have a precise knowledge of image receptor contrast. However, from the appearance of the characteristic curve, technologists should be able to distinguish high-contrast image receptors from low-contrast image receptors.
Figure 10-11 shows the characteristic curves for two different image receptors. Image receptor A has higher contrast than B, as shown by the fact that the slope of the straight-line portion of the characteristic curve is steeper for A than for B.
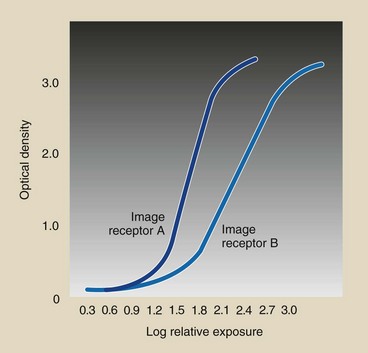
FIGURE 10-11 The slope of the straight-line portion of the characteristic curve is greater for image receptor A than for image receptor B. Image receptor A has greater contrast.
Several methods are used to numerically specify image receptor contrast. The one most often used is the average gradient. The average gradient is the slope of a straight line drawn between two points on the characteristic curve at ODs 0.25 and 2.0 above base and fog densities. This is the approximate useful range of OD on most radiographs.
 Image Receptor Contrast
where OD2 is the optical density of 2.0 plus base and fog densities, OD1 is the optical density of 0.25 plus base and fog densities, and LRE2 and LRE1 are the LREs associated with OD2 and OD1, respectively.
This method is diagrammed in Figure 10-12 for a screen-film image receptor with a combined base and fog density of 0.1.
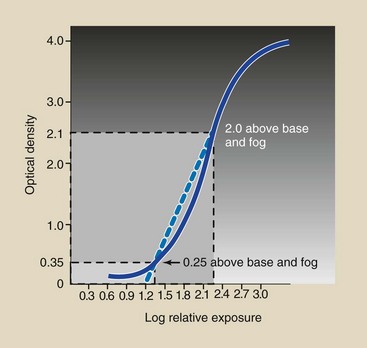
FIGURE 10-12 Average gradient is the slope of the line drawn between the points on the characteristic curve that correspond to optical density (OD) levels 0.25 and 2.0 above base and fog densities.
Most radiographic image receptors have an average gradient in the range of 2.5 to 3.5. Because of this, the image receptor acts as an amplifier of subject contrast. The range of the number of x-rays producing the latent image is effectively expanded, and the subject contrast is enhanced.
| Question: | A radiographic film has a base density of 0.06 and a fog density of 0.11. At what ODs should one evaluate the characteristic curve to determine the film contrast? |
| Answer: | The curve should be evaluated at OD 0.25 and 2.0 above base plus fog densities. Therefore, at OD of OD1 = 0.06 + 0.11 + 0.25 = 0.42 and OD2 = 0.06 + 0.11 + 2.0 = 2.17 |
Image receptor contrast also may be identified by gradient. The gradient is the slope of the tangent at any point on the characteristic curve (Figure 10-13). Toe gradient is probably more important than average gradient for general radiography because many clinical ODs appear in the toe region of the characteristic curve. Midgradient or shoulder gradient is more important for mammography.
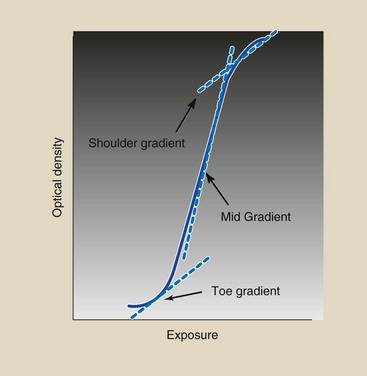
FIGURE 10-13 The gradient is the slope of the tangent at any point on the characteristic curve. Toe gradient is most important clinically.
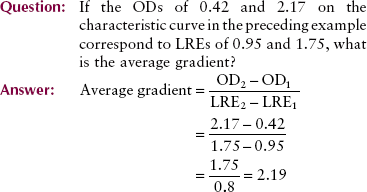
Note that the numerator in the expression for average gradient always equals 1.75.
Another way to evaluate image receptor contrast is to re-plot the data of a characteristic curve (an H & D curve) into an H & H contrast curve, as can be seen in Figure 10-14. H & H stands for Art Haus and Ed Hendrick, the medical physicists who first demonstrated this technique.
Speed
The ability of an image receptor to respond to a low x-ray exposure is a measure of its sensitivity or, more commonly, its speed. Whereas an exposure of less than 0.01 mGya (1 mR) can be detected with a film-screen combination, several mGya are necessary to produce a measurable exposure with direct-exposure film.
The characteristic curve of an image receptor is also useful in identifying speed. Figure 10-15 shows the characteristic curves of two different image receptors. Because image receptor A requires less exposure than B to produce any OD, A is faster than B.
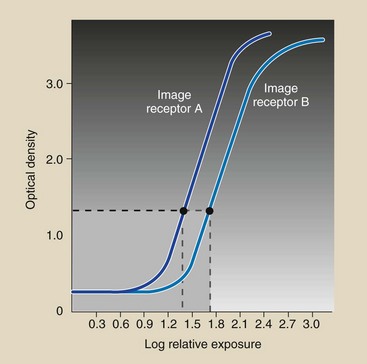
FIGURE 10-15 The speed of a radiographic image receptor is a relative number based on 100 as par speed.
The characteristic curve of a fast image receptor is positioned to the left—closer to the y-axis—of that of a slow image receptor. Radiographic screen-film image receptors are identified as fast or slow according to their sensitivity to x-ray exposure.
Usually, identification of a given image receptor as so many times faster than another is sufficient for radiologic technologists. If A were twice as fast as B, image receptor A would require only half the mAs required by B to produce a given OD. Moreover, the image on image receptor A might be of poor quality because of increased radiographic noise.
When numbers are used to express speed, all are relative to 100; this is called par speed. Numbers higher than 100 refer to fast or high-speed image receptors. Numbers less than 100 refer to “detail” image receptors.
Do not be deceived that slower image receptors are better because they have less noise. Slower image receptors also require more patient radiation dose. A balance is required.
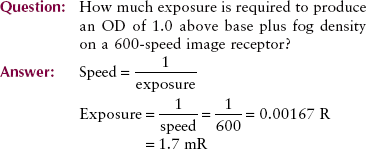
In sensitometry, the OD specified for determining image receptor speed is 1.0 above base plus fog density, and the speed is measured in reciprocal roentgens (1/R) as follows:
When image receptors are replaced, a change in the mAs setting may be necessary to maintain the same OD. For example, if image receptor speed is doubled, the mAs must be halved. No change is required in kVp. This relationship is expressed as follows:
Latitude
An additional image receptor feature easily obtained from the characteristic curve is latitude. Latitude refers to the range of exposures over which the image receptor responds with ODs in the diagnostically useful range.
Latitude also can be thought of as the margin of error in technical factors. With wider latitude, mAs can vary more and still produce a diagnostic image. Figure 10-16 shows two image receptors with different latitudes. Image receptor B responds to a much wider range of exposures than A and therefore has a wider latitude than A.
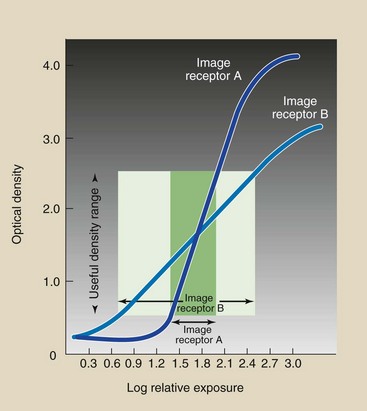
FIGURE 10-16 The latitude of an image receptor is the exposure range over which it responds with diagnostically useful optical density (OD).
Image receptors with wide latitude are said to have long gray scale; those with narrow latitude have short gray scale. When slopes of the curves in Figure 10-16 are compared, it should be clear that a high-contrast image receptor has narrow latitude, and a low-contrast image receptor has wide latitude.
Film Processing
Proper film processing is required for optimal image receptor contrast because the degree of development has a pronounced effect on the level of fog density and on the ODs resulting from a given exposure at a given image receptor speed. Important factors that may affect the degree of development are listed in Box 10-1.
Development Time
Because development time is varied, the characteristic curve for any film changes in shape and position along the LRE axis (Figure 10-17). If characteristic curves were analyzed for contrast, speed, and fog level, each would be shown to be unique, as in Figure 10-18. Speed and fog increase with increasing development time.
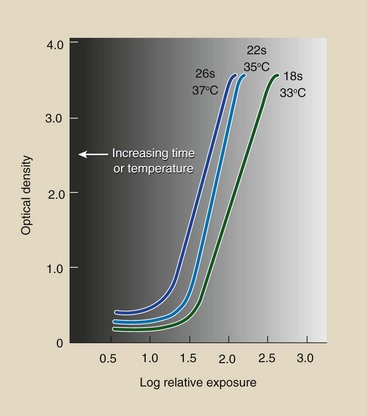
FIGURE 10-17 As development time or temperature increases, changes occur in the shape and relative position of the characteristic curve.
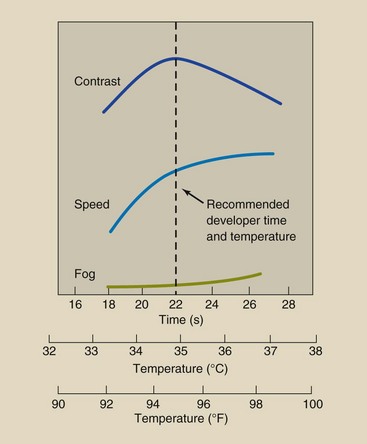
FIGURE 10-18 Analysis of characteristic curves at various development times and temperatures yields relationships for contrast, speed, and fog for 90-second automatically processed film.
The development time recommended by the manufacturer is the time that will result in maximum contrast. When development time extends far beyond the recommended period, the image receptor contrast decreases, the relative speed increases, and the fog level increases.
Development Temperature
The relationships just described for variations in development time apply equally well to variations in development temperature. When the average gradient, speed, and fog level for any film are plotted as a function of development temperature, the results appear as in Figure 10-18.
As with time of development, maximum contrast is attained at the recommended development temperature. Fog level increases with increasing temperature, as does image receptor speed.
Within a small range, a change in time or temperature can be compensated for by a change in the other. However, a small change in time or temperature alone can result in a large change in the sensitometric characteristics of the image receptor.
Geometric Factors
Making a radiograph is similar in many ways to taking a photograph. Proper exposure time and intensity are required for both processes. Images are recorded both ways because x-rays and visible light photons travel in straight lines.
In that regard, an x-ray image may be considered analogous to a shadowgraph. Figure 10-19 shows the familiar shadowgraph that can be made to appear on a wall if light is shone on a properly contorted hand.
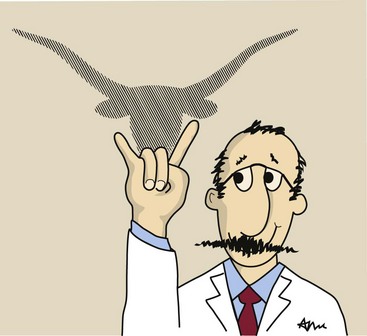
FIGURE 10-19 A shadowgraph is analogous to a radiograph. (Dedicated to Xie Nan Zhu, Guangzhou, People’s Republic of China.)
The sharpness of the shadow image on the wall is a function of a number of geometric factors. For example, the closer to the wall the hand is placed, the sharper is the shadow image. Similarly, as the light source is moved farther from the hand, the shadow becomes sharper.
These geometric conditions also apply to the production of high-quality radiographs. Three principal geometric factors affect radiographic quality: magnification, distortion, and focal-spot blur.
Magnification
All images on the radiograph are larger than the objects they represent, a condition called magnification. For most medical images, the smallest magnification possible should be maintained.
During some examinations, however, magnification is desirable and is carefully planned into the radiographic examination. This type of examination, called magnification radiography, is discussed in Chapter 13.
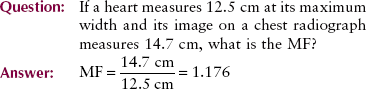
Quantitatively, magnification is expressed by the magnification factor (MF), which is defined as follows:
The MF depends on the geometric conditions of the examination. For most radiographs taken at a source-to-image receptor distance (SID) of 100 cm, the MF is approximately 1.1. For radiographs taken at 180 cm SID, the MF is approximately 1.05.
In the usual radiographic examination, it is not possible to determine the object size. The image size may be measured directly from the radiograph. In such situations, the MF can be determined from the ratio of SID to source-to-object distance (SOD):
Figure 10-20 shows that this method of calculating the MF is based on the geometric relationship between similar triangles. If two right triangles have a common hypotenuse, the ratio of the height of one to its base will be the same as the ratio of the height of the other to its base.
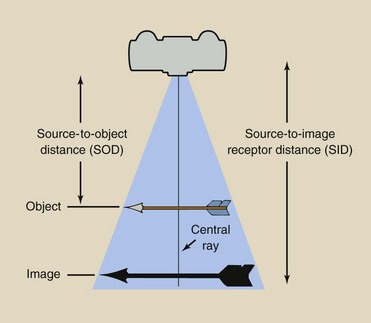
FIGURE 10-20 Magnification is the ratio of image size to object size or of source-to-image receptor distance (SID) to source-to-object distance (SOD).
This is the situation that usually is encountered in radiography. The SID is known and can be measured directly. The SOD can be estimated relatively accurately by a radiologic technologist who has a good foundation in human anatomy. The image size can be measured accurately; therefore, object size can be calculated as follows:
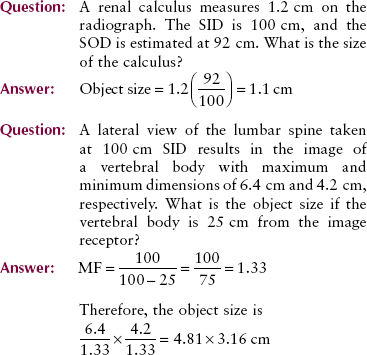
You might ask whether these relationships hold for objects off the central ray (Figure 10-21). The MF will be the same for objects positioned off the central ray as for those lying on the central ray if the object-to-image receptor distance (OID) is the same and if the object is essentially flat.
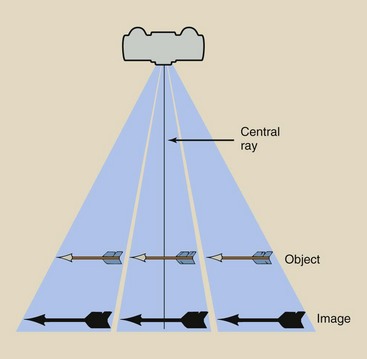
FIGURE 10-21 Magnification of an object positioned off the central ray is the same as that of an object on the central ray if the objects are in the same plane.
In summary, two factors affect image magnification: SID and OID.
Minimizing Magnification
Large SID: Use as large a source-to-image receptor distance as possible.
Small OID: Place the object as close to the image receptor as possible.
The SID is standard in most radiology departments at 180 cm for chest imaging; 100 cm for routine examinations; and 90 cm for some special studies, such as mobile radiography and trauma radiography.
Magnification is minimized routinely in three familiar clinical situations. Most chest radiographs are taken at 180 cm SID from the PA projection. Compared with an examination at 100 cm SID, this projection results in a larger SID-to-SOD ratio, and the OID is constant. Magnification is reduced because of the large SID.
Dedicated mammography imaging systems are designed for 50 to 70 cm SID. This is a relatively short SID, but it is necessary, considering the low kVp and the low radiation intensity of mammography imaging systems. Such systems have a device for vigorous compression of the breast to reduce magnification by reducing OID.
Distortion
The previous discussion assumed a very simple object—an arrow positioned parallel to the image receptor at a fixed OID. If any one of these conditions is changed, as they all are in most radiographic imaging procedures, the magnification will not be the same over the entire object.
Distortion can interfere with diagnosis. Three conditions contribute to image distortion: object thickness, object position, and object shape.
Object Thickness
With a thick object, the OID changes measurably across the object. Consider, for instance, two rectangular structures of different thicknesses (Figure 10-22). Because of the change in OID across the thicker structure, the image of that structure is more distorted than the image of the thinner structure.
FIGURE 10-22 Thick objects result in unequal magnification and thus greater distortion compared with thin objects.
Consider the images produced by a disc and a sphere of the same diameter (Figure 10-23). When positioned on the central axis, the images of both objects appear as circles. The image of the sphere appears less distinct because of its varying thickness, but it does appear circular.
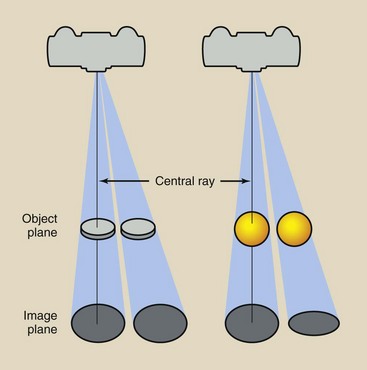
FIGURE 10-23 Object thickness influences distortion. Radiographs of a disc or sphere appear as circles if the object is on the central ray. When lateral to the central axis, the disc appears as a circle and the sphere as an ellipse.
When these objects are positioned laterally to the central ray, the disc still appears circular. The sphere appears not only less distinct but elliptical because of its thickness. This distortion resulting from object thickness is shown more dramatically in Figure 10-24 in the image of an irregular object.
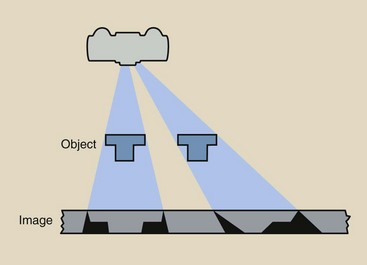
FIGURE 10-24 Irregular anatomy or objects such as these can cause considerable distortion when radiographed off the central ray.
These statements about discs and spheres are clinically insignificant because lateral distances off the central ray are too small. Only irregular objects, such as those shown in Figure 10-24 or the human body, show significant distortion.
Object Position
If the object plane and the image plane are parallel, the image is not distorted. However, distortion is possible in every radiographic examination if the patient is not properly positioned.
Figure 10-25, an example of gross distortion, shows that the image of an inclined object can be smaller than the object itself. In such a condition, the image is said to be foreshortened. The amount of foreshortening, that is, the extent of reduction in image size, increases as the angle of inclination increases.
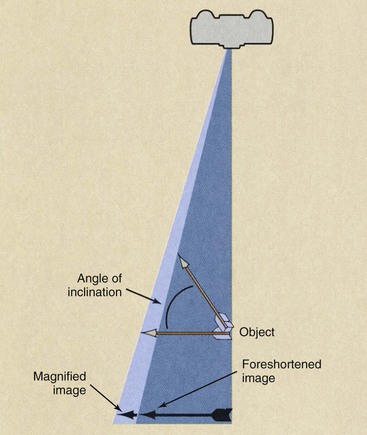
If an inclined object is not located on the central x-ray beam, the degree of distortion is affected by the object’s angle of inclination and its lateral position from the central axis. Figure 10-26 illustrates this situation and shows that the image of an inclined object can be severely foreshortened, or elongated.
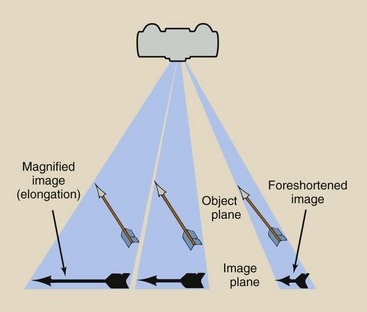
FIGURE 10-26 An inclined object that is positioned lateral to the central ray may be distorted severely by elongation or foreshortening.
With multiple objects positioned at various OIDs, spatial distortion can occur. Spatial distortion is the misrepresentation in the image of the actual spatial relationships among objects. Figure 10-27 demonstrates this condition for two arrows of the same size, one of which lies on top of the other. Because of the position of the arrows, only one image should be seen, representing the superposition of the arrows.
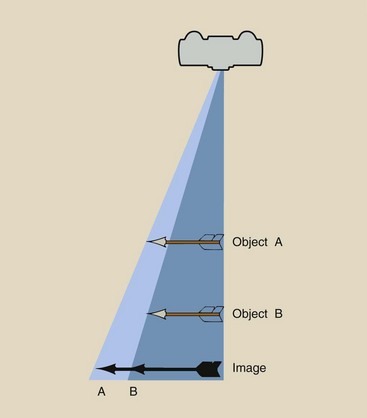
FIGURE 10-27 When objects of the same size are positioned at different distances from the image receptor, spatial distortion occurs.
Unequal magnification, however, of the two objects causes arrow A to appear larger than arrow B and to be positioned more laterally. This distortion is minimal for objects lying along the central ray. As object position is shifted laterally from the central ray, spatial distortion can become more significant.
This illustrates the projection nature of x-ray images. A single image is not enough to define the three-dimensional configuration of a complex object. Therefore, most radiographic examinations are made with two or more projections.
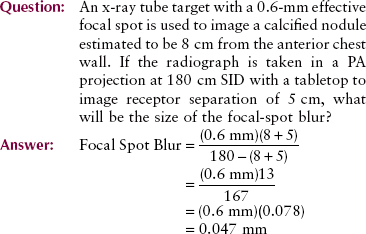
Focal-Spot Blur
Thus far, our discussion of the geometric factors that affect radiographic quality has assumed that x-rays are emitted from a point source. In actual practice, there is no point source of x-radiation but rather a roughly rectangular source that varies in size from approximately 0.1 to 1.5 mm on a side, depending on the type of x-ray tube that is in use.
Figure 10-28 illustrates the result of using x-ray tubes with measurable effective focal spots. The point of the object arrow in Figure 10-28 does not appear as a point in the image plane because the x-rays used to image that point originate throughout the rectangular source.
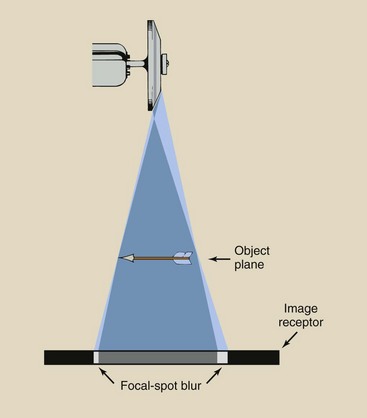
FIGURE 10-28 Focal-spot blur is caused by the effective size of the focal spot, which is larger to the cathode side of the image.
A blurred region on the radiograph over which radiologic technologists have little control results because the effective focal spot has size. This phenomenon is called focal-spot blur, and it is undesirable. As illustrated, it is greater on the cathode side of the image.
The geometric relationships that govern magnification also influence focal-spot blur. As the geometry of the source, object, and image is altered to produce greater magnification, increased focal-spot blur is produced. Consequently, these conditions should be avoided when possible.
The region of focal-spot blur can be calculated with the use of similar triangles. If an arrowhead were positioned near the x-ray tube target, the size of the focal-spot blur would be larger than that of the effective focal spot (Figure 10-29, A). In general, the object is much closer to the image receptor; therefore, the focal-spot blur is much smaller than the effective focal spot (Figure 10-29, B).
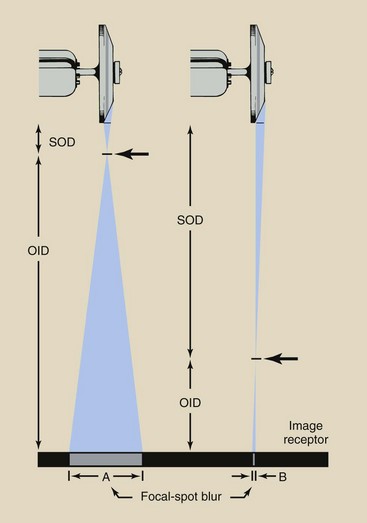
From these drawings, one can see that two similar triangles are described. Therefore, the ratio of SOD to OID is the same as the ratio of the sizes of the effective focal spot and the focal-spot blur.
To minimize focal-spot blur, you should use small focal spots and position the patient so that the anatomical part under examination is close to the image receptor. The SID usually is fixed but should be as large as possible. High-contrast objects that are smaller than the focal-spot blur normally cannot be imaged.
Heel Effect
The heel effect, introduced in Chapter 6, is described as varying radiation intensity across the x-ray field in the anode–cathode direction caused by attenuation of x-rays in the heel of the anode. Another characteristic of the heel effect is unrelated to x-ray intensity but affects focal-spot blur.
The size of the effective focal spot is not constant across the radiograph. An x-ray tube said to have a 1-mm focal spot has a smaller effective focal spot on the anode side and a larger effective focal spot on the cathode side (Figure 10-30).
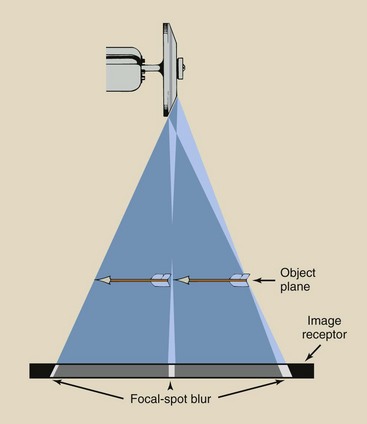
FIGURE 10-30 Effective focal spot size is largest on the cathode side; therefore, focal-spot blur is greatest on the cathode side.
This variation in focal-spot size results in variation in focal-spot blur. Consequently, images toward the cathode side of a radiograph have a higher degree of blur and poorer spatial resolution than those to the anode side. This is clinically significant when x-ray tubes with small target angles are used at short SIDs. Table 10-2 lists radiographic examinations that should be performed with regard for the heel effect.
TABLE 10-2
Patient Positioning for Examinations That Can Take Advantage of the Heel Effect
| Examination | Position Toward the Cathode | Position Toward the Anode |
| PA chest | Abdomen | Neck |
| Abdomen | Abdomen | Pelvis |
| Femur | Hip | Knee |
| Humerus | Shoulder | Elbow |
| AP thoracic spine | Abdomen | Neck |
| AP lumbar spine | Abdomen | Pelvis |
Subject Factors
The third general group of factors that affect radiographic quality involve the patient (Box 10-2). These factors are those associated not so much with the positioning of the patient as with the selection of a radiographic technique that properly compensates for the patient’s size, shape, and tissue composition. Patient positioning is basically a requirement that is associated with the geometric factors that affect radiographic image quality.
Subject Contrast
The contrast of a radiograph viewed on an illuminator is called radiographic contrast. As indicated previously, radiographic contrast is a function of image receptor contrast and subject contrast. In fact, radiographic contrast is simply the product of image receptor contrast and subject contrast.
| Question: | Screen film with an average gradient of 3.1 is used to radiograph a long bone with subject contrast of 4.5. What is the radiographic contrast? |
| Answer: | Radiographic contrast = (3.1)(4.5) = 13.95 |
Several of these subject factors are discussed in Chapter 9 in terms of their relation to the attenuation of an x-ray beam. The effect of each on subject contrast is a direct result of differences in attenuation in body tissues.
Patient Thickness
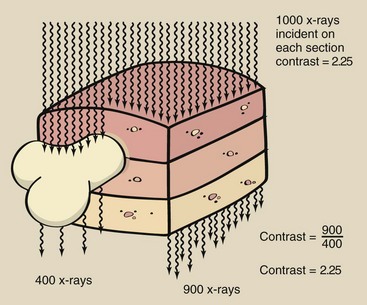
Given a standard composition, a thick body section attenuates a greater number of x-rays than does a thin body section (Figure 10-31). The same number of x-rays is incident on each section; therefore, the contrast of the incident x-ray beam is zero, that is, there is no contrast.
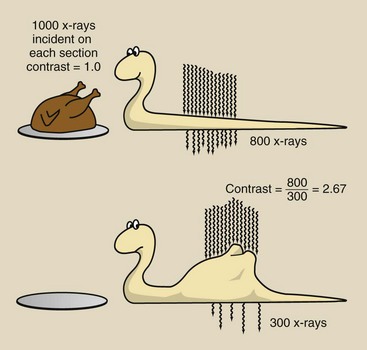
If the same number of x-rays left each section, the subject contrast would be 1.0. Because more x-rays are transmitted through thin body sections than through thick ones, however, subject contrast is greater than 1. The degree of subject contrast is directly proportional to the relative number of x-rays leaving those sections of the body.
Tissue Mass Density
Different sections of the body may have equal thicknesses yet different mass densities. Tissue mass density is an important factor that affects subject contrast. Consider, for example, a radiograph of different salad ingredients (Figure 10-32). These materials have the same thickness and chemical composition. However, they have slightly different mass density from water and therefore will be imaged. The effect of mass density on subject contrast is demonstrated in Figure 10-33.
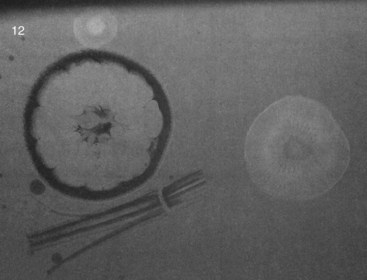
Effective Atomic Number
Another important factor that affects subject contrast is the effective atomic number of the tissue being examined. In Chapter 9, it is shown that Compton scattering is independent of atomic number, but photoelectric effect varies in proportion to the cube of the atomic number.
The effective atomic numbers of tissues of interest are reported in Table 9-3. In the diagnostic range of x-ray energies, the photoelectric effect is of considerable importance; therefore, subject contrast is influenced greatly by the effective atomic number of the tissue that is being radiographed. When the effective atomic number of adjacent tissues is very much different, subject contrast is very high.
Subject contrast can be enhanced greatly by the use of contrast media. The high atomic numbers of iodine (Z = 53) and barium (Z = 56) result in extremely high subject contrast. Contrast media are effective because they accentuate subject contrast through enhanced photoelectric absorption.
Object Shape
The shape of the anatomical structure under investigation influences its radiographic quality, not only through its geometry but also through its contribution to subject contrast. Obviously, a structure that has a form that coincides with the x-ray beam has maximum subject contrast (Figure 10-34, A).
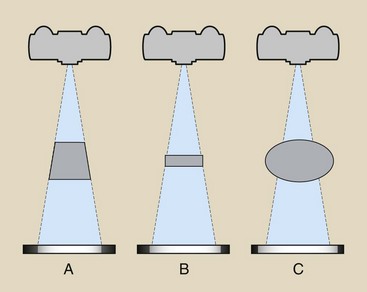
All other anatomical shapes have reduced subject contrast because of the change in thickness that they present across the x-ray beam. Figure 10-34, B and C, illustrates two shapes that result in reduced subject contrast.
This characteristic of the subject that affects subject contrast is sometimes called absorption blur. It reduces the spatial resolution and the contrast resolution of any anatomical structure, but it is most troublesome during interventional procedures in which vessels with small diameters are examined.
kVp
The radiologic technologist has no control over the four previous factors that influence subject contrast. The absolute magnitude of subject contrast, however, is greatly controlled by the kVp of operation. kVp also influences film contrast but not to the extent that it controls subject contrast.
Figure 10-35 shows a composite of a series of radiographs of an aluminum step wedge taken at kVp values ranging from 40 to 100. A low kVp results in high subject contrast, sometimes called short gray scale contrast because the radiographic image appears either black or white with few shades of gray. On the other hand, high kVp results in low subject contrast or long gray scale contrast.
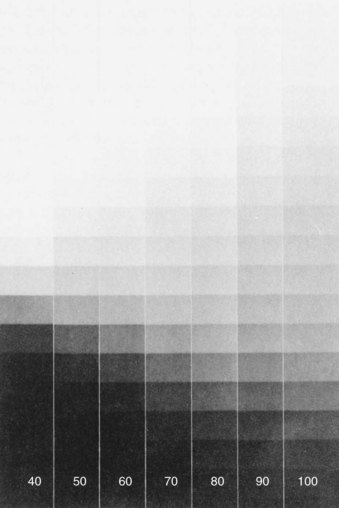
FIGURE 10-35 Radiographs of an aluminum step wedge (penetrometer) demonstrating change in contrast with varying voltage. (Courtesy Carestream Health.)
It would be easy to jump to the conclusion that low-kVp techniques are always more desirable than high-kVp techniques. However, low-kVp radiography has two major disadvantages:
1. As the kVp is lowered for any radiographic examination, the x-ray beam becomes less penetrating, requiring a higher mAs to produce an acceptable range of ODs. The result is higher patient dose.
2. A radiographic technique that produces low subject contrast allows for wide latitude in exposure factors. Optimization of radiographic technique by mAs selection is not so critical when high kVp is used.
Motion Blur
Movement of the patient or the x-ray tube during exposure results in blurring of the radiographic image. This loss of radiographic quality, called motion blur, may result in repeated radiographs and therefore should be avoided.
Normally, motion of the x-ray tube is not a problem. Sometimes, the table or a restraining device is caused to move by auxiliary equipment, such as a moving grid mechanism.
The radiographer can reduce motion blur by carefully instructing the patient, “Take a deep breath and hold it. Don’t move.”
Patient motion of two types may occur. Voluntary motion of the limbs and muscles is controlled by immobilization. Involuntary motion of the heart and lungs is controlled by short exposure time.
Motion blur is affected primarily by four factors. By observing the guidelines listed in Box 10-3, the radiologic technologist can reduce motion blur. Note that the last two items in this list have the same relation to motion blur as to focal-spot blur. With the use of low ripple power and high-speed image receptors, motion has been virtually eliminated as a common clinical problem.
Tools for Improved Radiographic Quality
Radiologic technologists normally have the tools available to produce high-quality radiographic images. Proper patient preparation, the selection of proper image receptors, and proper radiographic technique are complex, related concepts.
For any given radiographic examination, each of these factors must be properly interpreted and applied. A small change in one may require a compensating change in another.
Patient Positioning
The importance of patient positioning should now be clear. Proper patient positioning requires that the anatomical structure under investigation be placed as close to the image receptor as is practical and that the axis of this structure should lie in a plane that is parallel to the plane of the image receptor. The central ray should be incident on the center of the structure. Finally, the patient must be immobilized effectively to minimize motion blur.
To be able to position patients properly, radiologic technologists must have a good knowledge of human anatomy. If multiple structures are being radiographed and are to be imaged with uniform magnification, they must be positioned at the same distance from the image receptor. The various techniques that are applied to radiographic positioning are designed to produce radiographs with minimal image distortion and maximum image resolution.
Image Receptors
Usually, a standard type of screen-film image receptor is used throughout a radiology department for a given type of examination. In general, extremity and soft tissue radiographs are taken with fine-detail screen-film combinations.
Most other radiographs use double-emulsion film with screens. The new, structured-grain x-ray films used with high-resolution intensifying screens produce exquisite images with limited patient dose.
Principles to be considered when planning a particular examination:
1. Use of intensifying screens decreases patient dose by a factor of at least 20.
2. As the speed of the image receptor increases, radiographic noise increases, and spatial resolution is reduced.
3. Low-contrast imaging procedures have wider latitude, or margin of error, in producing an acceptable radiograph.
Selection of Technique Factors
Before each examination, the radiologic technologist must select the optimum radiographic technique factors, that is, kVp, mAs, and exposure time. Many considerations determine the value of each of these factors, and they are complexly interrelated. Few generalizations are possible.
One generalization that can be made for all radiographic exposures is that the time of exposure should be as short as possible. Image quality is improved by short exposure times that cause reduced motion blur. One of the reasons why three-phase and high-frequency generators are better than single-phase generators is that shorter exposure times are possible with the former.
Similar simple statements cannot be made about the selection of kVp or mA. Because time is to be kept to a minimum, the selection of kVp and mA and the resulting mAs value should be considered. The radiographer should strive for optimum radiographic contrast and ODs by exposing the patient to the proper quantity and quality of x-radiation.
As kVp is increased, both the quantity and quality of x-radiation are increased; a greater number of x-rays are transmitted through the patient, so a higher portion of the primary beam reaches the image receptor. Thus, kVp also affects OD. Among x-rays that interact with the patient, the relative number of Compton interactions increases with increasing kVp, resulting in less differential absorption and reduced subject contrast.
Furthermore, with increased kVp, the scatter radiation that reaches the image receptor is greater; therefore, radiographic noise is higher. The result of increased kVp is loss of contrast. When radiographic contrast is low, latitude is high, and the margin for error is increased.
The principal advantages of the use of high kVp include a reduction in patient dose and a wide latitude of exposures allowed in the production of a diagnostic radiograph. Figure 10-36 shows a series of chest radiographs demonstrating increased latitude resulting from a high-kVp technique. The relative technique factors are indicated on each radiograph. To some extent, the use of grids can compensate for the loss of contrast accompanying a high-kVp technique.
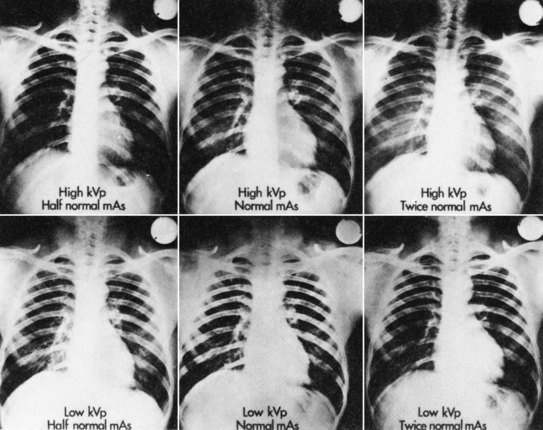
FIGURE 10-36 Chest radiographs demonstrating two advantages of high-voltage technique: greater latitude and margin for error. (Courtesy Carestream Co.)
As the mAs value is increased, the radiation quantity increases; therefore, the number of x-rays arriving at the image receptor increases, resulting in higher OD and lower radiographic noise but higher patient radiation dose.
In a secondary way, the mAs value also influences contrast. Recall that maximum contrast is attained only when the film is exposed over a range that results in OD along the straight-line portion of the characteristic curve. Too low an mAs setting results in low OD and reduced radiographic contrast because the H & D curve has flattened. Too high an mAs value results in high OD and loss of radiographic contrast for the same reason.
A number of other factors influence OD and radiographic contrast and hence radiographic quality. Adding filtration to the x-ray tube reduces x-ray beam intensity but enhances quality. A change in SID results in a change in OD because x-ray intensity varies with distance. Table 10-3 represents an attempt to summarize the principal factors that influence the making of a radiograph.
TABLE 10-3
Principal Factors That May Affect the Making of a Radiograph*
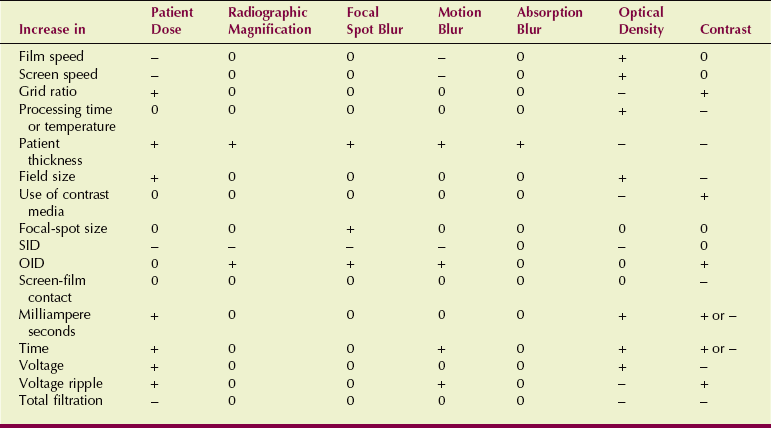
OID, object-to-image receptor distance; SID, source-to-image receptor distance.
*Because the factors in the left-hand column are increased while all other factors remain fixed, cross-referenced conditions are affected as shown: +, increase; −, decrease; 0, no change.
The continuing trend in radiographic technique is to use high kVp with a compensating reduction in mAs to produce a radiograph of satisfactory quality while reducing the patient dose and the likelihood of an ordered reexamination because of an error in technique.
Summary
Radiographic image quality is the exactness of representation of the anatomical structure on the radiographic image. Characteristics that make up radiographic quality are as follows:
• Spatial resolution, or the ability to detect small, high-contrast structures on the radiograph
• Low noise, or elimination of ODs that do not reflect anatomical structures
• Proper speed of the screen-film combination, which limits patient dose but produces a high-quality, low-noise radiograph
These characteristics and three others—film factors, geometric factors, and subject factors—combine to determine radiographic quality. Film factors involve quality control in film processing and characteristics of film.
The graph on semilogarithmic paper that presents sensitometry and densitometry data of film OD is the characteristic curve. The characteristic curve shows film contrast, speed, and latitude.
Geometric factors that affect radiographic quality include magnification and distortion, as well as the advantageous use of object thickness, position, focal-spot blur, and the heel effect.
Subject factors that affect radiographic quality depend on the patient. Radiographers must prevent motion blur by encouraging patient cooperation. Also, by measuring patient thickness, recognizing tissue mass density, examining anatomical shape, and evaluating optimal kVp levels, radiographers can produce high-quality radiographs.
1. Define or otherwise identify the following:
2. What principally determines radiographic spatial resolution?
3. Describe the equipment used in sensitometry.
4. What is the importance of processor quality control in an imaging department?
5. Have the manufacturer’s representative help construct a characteristic curve from the data obtained from sensitometry and densitometry of a screen-film combination used in your department.
6. The intensity of light emitted by a viewbox is 1000. The intensity of light transmitted through the film is 1. What is the optical density of the film? Will it be light, gray, or black?
7. Base and fog densities on a given radiograph are 0.35. At densities 0.25 and 2 above base and fog densities, the characteristic curve shows log relative exposure values of 1.3 and 2. What is the average gradient?
8. List factors related to film processing that may affect the finished radiograph.
9. X-ray image receptors A and B require 0.15 mGya and 0.45 mGya to produce an optical density of 1.0. Which is faster, and what is the speed of each?
10. What three principal geometric factors may affect radiographic quality?
12. List and explain the five factors that affect subject contrast.
13. What is the difference between foreshortening and elongation?
14. Describe the H & H contrast curve.
15. Discuss the factors that influence radiographic optical density and contrast.
16. Construct a characteristic curve for a typical screen-film combination and carefully label the axes.
17. An x-ray examination of the heart taken at 100 cm SID shows a cardiac silhouette measuring 13 cm in width. If the OID distance is estimated at 15 cm, what is the actual width of the heart?
18. The subject contrast of a thorax is 5.3. Image receptor contrast is 3.2. What is the radiographic contrast?
19. State the reciprocity law and explain its influence on radiography.
20. How does image contrast attained with the use of a radiographic intensifying screen compare with direct film exposure?
The answers to the Challenge Questions can be found by logging on to our website at http://evolve.elsevier.com.