Fluoroscopy
At the completion of this chapter, the student should be able to do the following:
1 Discuss the development of fluoroscopy.
2 Explain visual physiology and its relationship to fluoroscopy.
3 Describe the components of an image intensifier.
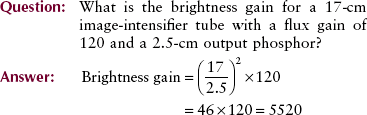
4 Calculate brightness gain and identify its units.
5 List the approximate kilovolt peak levels for common fluoroscopic examinations.
6 Discuss the role of the television monitor and the television image in forming fluoroscopic images.
THE PRIMARY function of the fluoroscope is to provide real-time dynamic viewing of anatomic structures. Dynamic studies are examinations that show the motion of circulation or the motion of internal structures.
During fluoroscopy, the radiologist generally uses contrast media to highlight the anatomy. The radiologist then views a continuous image of the internal structure while the x-ray tube is energized. If the radiologist observes something during the fluoroscopic examination and would like to preserve that image for further study, a radiograph called a spot film can be taken without interruption of the dynamic examination.
The recent introduction of computer technology into fluoroscopy and radiography has enhanced the training and performance demands placed on radiologic technologists. This chapter presents the basic principles of fluoroscopic imaging. The following chapter describes digital fluoroscopic imaging.
An Overview
Since Thomas A. Edison invented the fluoroscope in 1896, it has served as a valuable tool in medical imaging. The fluoroscope is used primarily for dynamic studies. During fluoroscopy, the radiologist views a continuous image of the motion of internal structures while the x-ray tube is energized.
A radiologist may observe something that he or she would like to preserve for later study; in this case, a permanent fixed image can be taken without interruption of the examination. One such method is known as a spot film, that is, a small static image on a small-format image receptor. Cineradiography, video imaging, and digital fluoroscopy (Chapter 26) are other examples.
Fluoroscopy is actually a rather routine type of x-ray examination except for its application in the visualization of vessels, called angiography. The two main areas of angiography are neuroradiology and vascular radiology. As with all fluoroscopic procedures, spot-film radiographs and in many cases digital images can be obtained. These areas of angiography are now referred to as interventional radiology (see Chapter 27).
Figure 25-1 presents the layout of a fluoroscopic imaging system. The x-ray tube is usually hidden under the patient table. The image intensifier or other image receptors are set over the patient table. With some fluoroscopes, the x-ray tube is over the patient table, and the image receptor is under the patient table. Some fluoroscopes are operated remotely from outside the x-ray room. Many different arrangements are provided for fluoroscopy, and the radiologic technologist must become familiar with each.
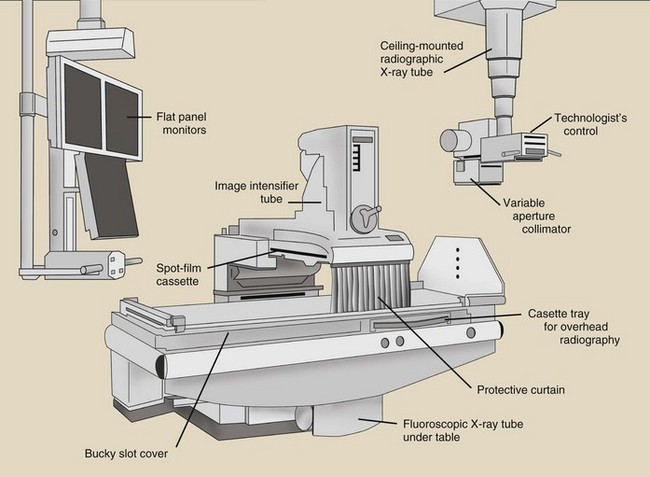
During image-intensified fluoroscopy, the radiologic image is displayed on a television monitor or flat panel monitor. The image-intensifier tube and the television chain are described later in this chapter.
During fluoroscopy, the x-ray tube is operated at less than 5 mA; contrast this with a radiographic examination in which the x-ray tube current is measured in hundreds of mA. Despite the lower mA, however, the patient dose is considerably higher during fluoroscopy than during radiographic examinations because the x-ray beam exposes the patient constantly for a considerably longer time.
The kilovolt peak (kVp) of operation depends entirely on the section of the body that is being examined. Fluoroscopic equipment allows the radiologist to select an image brightness level that is subsequently maintained automatically by varying the kVp, the mA, or sometimes both. This feature of the fluoroscope is called automatic brightness control (ABC).
Special Demands of Fluoroscopy
Fluoroscopy is a dynamic process; thus, the radiologist must adapt to moving images that are sometimes dim. This requires some knowledge of image illumination and visual physiology.
Illumination
The principal advantage of image-intensified fluoroscopy over earlier types of fluoroscopy is increased image brightness. Just as it is much more difficult to read a book in dim illumination than in bright illumination, it is much harder to interpret a dim fluoroscopic image than a bright one.
Illumination levels are measured in units of lumen per square meter or lux. It is not necessary to know the precise definition of a lux; its importance lies in the wide range of illumination levels over which the human eye is sensitive. Figure 25-2 lists approximate illumination levels for familiar objects.
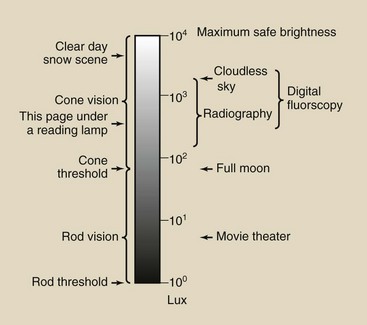
Radiographs are visualized under illumination levels of 100 to 1000 lux; image-intensified fluoroscopy is performed at similar illumination levels. If necessary, return to the discussion of photometric quantities in Chapter 18.
Human Vision
The structures in the eye that are responsible for the sensation of vision are called rods and cones. Figure 25-3 is a cross section of the human eye that reveals its principal parts and its appearance on magnetic resonance imaging. Light incident on the eye must first pass through the cornea, a transparent protective covering, and then through the lens, where the light is focused onto the retina.
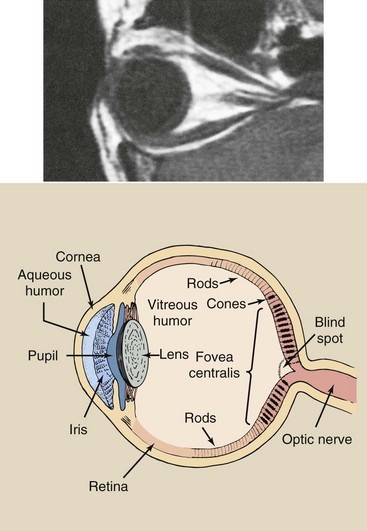
FIGURE 25-3 The appearance of the human eye and the parts responsible for vision on a magnetic resonance image. (Courtesy Helen Schumpert, Kauchak, Ashville MRI.)
Between the cornea and the lens is the iris, which behaves similarly to the diaphragm of a photographic camera in controlling the amount of light that is admitted to the eye. In the presence of bright light, the iris contracts and allows only a small amount of light to enter. During low-light conditions, such as in a dimly lit digital radiography reading area, the iris dilates (i.e., it opens up) and allows more light to enter.
When light arrives at the retina, it is detected by the rods and the cones. Rods and cones are small structures; more than 100,000 of them are found per square millimeter of retina. The cones are concentrated at the center of the retina in an area called the fovea centralis. Rods, on the other hand, are most numerous on the periphery of the retina. No rods are found at the fovea centralis.
The rods are sensitive to low light levels and are stimulated during dim light situations. The threshold for rod vision is approximately 2 lux. Cones, on the other hand, are less sensitive to light; their threshold is only approximately 100 lux, but cones are capable of responding to intense light levels, rods cannot.
Consequently, cones are used primarily for daylight vision, called photopic vision, and rods are used for night vision, called scotopic vision. This aspect of visual physiology explains why dim objects are viewed more readily if they are not looked at directly. Astronomers and radiologists are familiar with the fact that a dim object is best viewed peripherally, where rod vision predominates.
Cones perceive small objects much better than rods do. This ability to perceive fine detail is called visual acuity. Cones are also much better at detecting differences in brightness levels. This property of vision is called contrast perception. Furthermore, cones are sensitive to a wide range of wavelengths of light.
Cones perceive color, but rods are essentially color blind. Under scotopic conditions, the sensitivity of the eye is greatest in the green part of the spectrum at about 555 nm.
Fluoroscopic Technique
During fluoroscopy, maximum image detail is desired; this requires high levels of image brightness. The image intensifier was developed principally to replace the conventional fluorescent screen, which had to be viewed in a darkened room and then only after 15 minutes of dark adaptation (Figure 25-4). The image intensifier raises illumination into the cone vision region, where visual acuity is greatest.
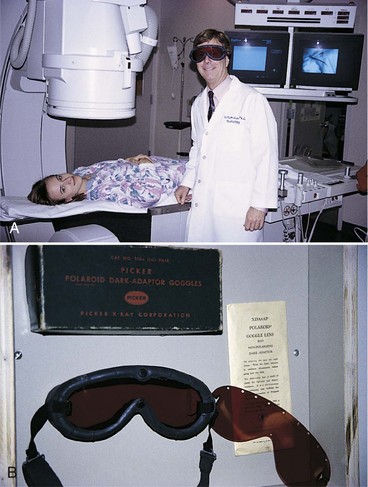
FIGURE 25-4 Red goggles were used to dark adapt for conventional screen fluoroscopy. This radiologist is back to the future. (Courtesy Ben Archer, Baylor College of Medicine.)
The brightness of the fluoroscopic image depends primarily on the anatomy that is being examined, the kVp, and the mA. The patient’s anatomy cannot be controlled by the radiologic technologist; however, fluoroscopic kVp and mA can be controlled.
The influence of kVp and mA on fluoroscopic image quality is similar to their influence on radiographic image quality. Generally, high kVp and low mA are preferred.
The precise fluoroscopic technique that will be used is determined by the training and experience of the radiologist and the radiologic technologist. Table 25-1 presents representative fluoroscopic kVp values for several common examinations. The fluoroscopic mA is not given because this value varies according to patient thickness and the response of the ABC system.
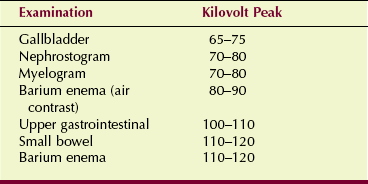
Image Intensification
The image-intensifier tube is a complex electronic device that receives the image-forming x-ray beam and converts it into a visible-light image of high intensity. Figure 25-5 is a rendition of an x-ray image-intensifier tube. The tube components are contained within a glass or metal envelope that provides structural support but more importantly maintains a vacuum. When installed, the tube is mounted inside a metal container to protect it from rough handling and breakage.
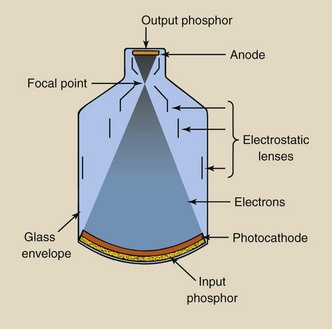
FIGURE 25-5 The image-intensifier tube converts the pattern of the x-ray beam into a bright visible-light image.
X-rays that exit the patient and are incident on the image-intensifier tube are transmitted through the glass envelope and interact with the input phosphor, which is cesium iodide (CsI). When an x-ray interacts with the input phosphor, its energy is converted into visible light; this is similar to the effect of radiographic intensifying screens.
The CsI crystals are grown as tiny needles and are tightly packed in a layer of approximately 300 µm (Figure 25-6). Each crystal is approximately 5 µm in diameter. This results in microlight pipes with little dispersion and improved spatial resolution.
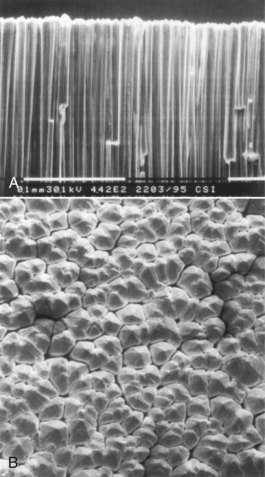
FIGURE 25-6 Cesium iodide crystals are grown as linear filaments and are packed tightly, as shown in these photomicrographs. A, Cross section. B, Face. (Courtesy Brad Mattinson, Philips Medical Systems.)
The next active element of the image-intensifier tube is the photocathode, which is bonded directly to the input phosphor with a thin, transparent adhesive layer. The photocathode is a thin metal layer usually composed of cesium and antimony compounds that respond to stimulation of input phosphor light by the emission of electrons.
This process is known as photoemission. The term is similar to thermionic emission, which refers to electron emission that follows heat stimulation. Photoemission is electron emission that follows light stimulation.
It takes many light photons to cause the emission of one electron. The number of electrons emitted by the photocathode is directly proportional to the intensity of light that reaches it. Consequently, the number of electrons emitted is proportional to the intensity of the incident image-forming x-ray beam.
The image-intensifier tube is approximately 50 cm long. A potential difference of about 25,000 V is maintained across the tube between photocathode and anode so that electrons produced by photoemission will be accelerated to the anode.
The anode is a circular plate with a hole in the middle through which electrons pass to the output phosphor, which is just the other side of the anode and is usually made of zinc cadmium sulfide. The output phosphor is the site where electrons interact and produce light.
For the image pattern to be accurate, the electron path from the photocathode to the output phosphor must be precise. The engineering aspects of maintaining proper electron travel are called electron optics because the pattern of electrons emitted from the large cathode end of the image-intensifier tube must be reduced to the small output phosphor.
The devices responsible for this control, called electrostatic focusing lenses, are located along the length of the image-intensifier tube. The electrons arrive at the output phosphor with high kinetic energy and contain the image of the input phosphor in minified form.
The interaction of these high-energy electrons with the output phosphor produces a considerable amount of light. Each photoelectron that arrives at the output phosphor produces 50 to 75 times as many light photons as were necessary to create it. The entire sequence of events from initial x-ray interaction to output image is summarized in Figure 25-7. This ratio of the number of light photons at the output phosphor to the number of x-rays at the input phosphor is the flux gain.
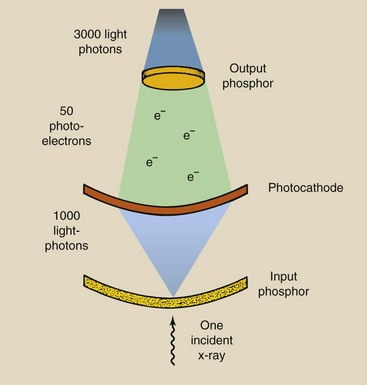
FIGURE 25-7 In an image-intensifier tube, each incident x-ray that interacts with the input phosphor results in a large number of light photons at the output phosphor. The image intensifier shown here has a flux gain of 3000.

The increased illumination of the image is attributable to the multiplication of light photons at the output phosphor compared with x-rays at the input phosphor and the image minification from input phosphor to output phosphor, which is called the minification gain. The ability of the image intensifier to increase the illumination level of the image is called its brightness gain. The brightness gain is simply the product of the minification gain and the flux gain.
The minification gain is the ratio of the square of the diameter of the input phosphor to the square of the diameter of the output phosphor. Output phosphor size is fairly standard at 2.5 or 5 cm. Input phosphor size varies from 10 to 40 cm and is used to identify image-intensifier tubes.
 Minification Gain
where di is the diameter of input phosphor and do is the diameter of output phosphor.
The brightness gain of most image intensifiers is 5000 to 30,000, and it decreases with tube age and use. As an image intensifier ages, patient dose increases as a consequence of maintaining image brightness. Ultimately, the image intensifier must be replaced.
Brightness gain is now defined as the ratio of the illumination intensity at the output phosphor, measured in candela per meter squared (cd/m2) (see Chapter 18), to the radiation intensity incident on the input phosphor, measured in milligray per second (mGya/s). This quantity is called the conversion factor and is approximately 0.01 times the brightness gain. The conversion factor is the proper quantity for expressing image intensification.
Image intensifiers have conversion factors of 50 to 300. These correspond to brightness gains of 5000 to 30,000.
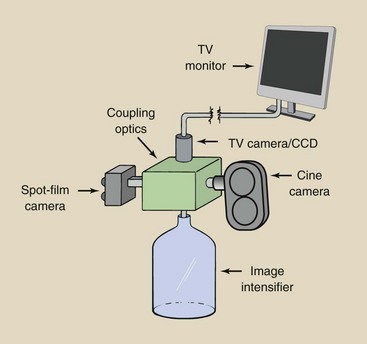
Figure 25-8 shows some of the modes of operation that can be accommodated with the image-intensifier tube. Fluoroscopic images are viewed on a television or flat panel monitor. The spot-film camera uses 105-mm film. The cineradiography camera is used almost exclusively in cardiac catheterization, but that use has been largely replaced by digital imaging.
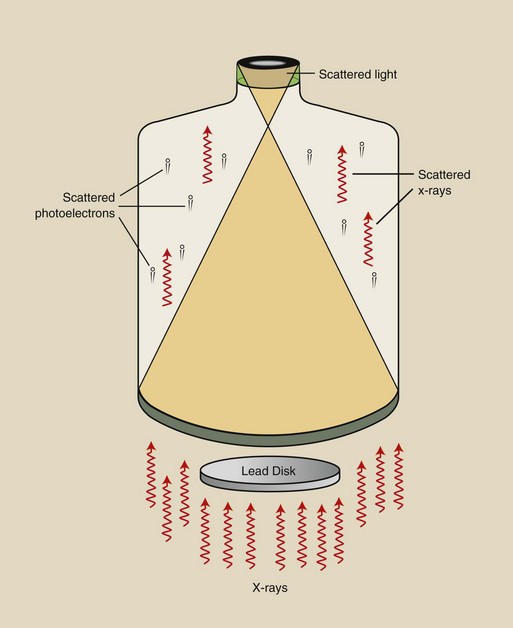
Internal scatter radiation in the form of x-rays, electrons, and particularly light can reduce the contrast of image intensifiers through a process called veiling glare. A veiling glare signal is produced behind a lead disc that is positioned on the input phosphor. Veiling glare is depicted in Figure 25-9. Advanced image intensifiers have output phosphor designs that reduce veiling glare.
Multifield Image Intensification
Most image intensifiers are of the multifield type. Multifield image intensifiers provide considerably greater flexibility in all fluoroscopic examinations. Trifield tubes come in various sizes, but perhaps the most popular is 25/17/12 cm.
These numeric dimensions refer to the diameter of the input phosphor of the image-intensifier tube. The operation of a typical multifield tube is illustrated by the 25/17/12 type shown in Figure 25-10. In the 25-cm mode, photoelectrons from the entire input phosphor are accelerated to the output phosphor.
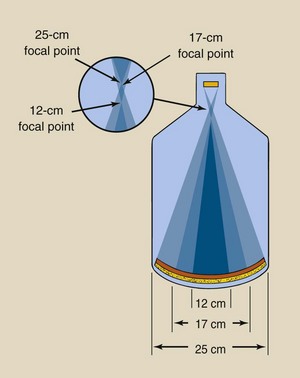
When a switch is made to the 17-cm mode, the voltage on the electrostatic focusing lenses increases; this causes the electron focal point to move farther from the output phosphor. Consequently, only electrons from the center 17-cm diameter of the input phosphor are incident on the output phosphor.
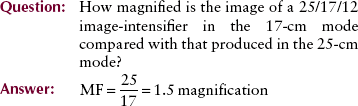
The principal result of this change in focal point is to reduce the field of view. The image now appears magnified because it still fills the entire screen on the monitor. Use of the smaller dimension of a multifield image-intensifier tube always results in a magnified image, with a magnification factor in direct proportion to the ratio of the diameters. A 25/17/12 tube operated in the 12-cm mode produces an image that is  times larger than the image produced in the 25-cm mode.
This magnified image comes at a price. In the magnified mode, the minification gain is reduced, and fewer photoelectrons are incident on the output phosphor. A dimmer image results.
To maintain the same level of brightness, the x-ray tube mA is increased by the ABC, which increases the patient radiation dose. The increase in dose is approximately equal to the ratio of the area of the input phosphor used, or [252 ÷ 122 ≈ 4.4]—the dose obtained in the wide field-of-view mode.
| Question: | A 23/15/10 image-intensifier tube is used in the 10-cm mode. How much higher is the patient dose in this mode compared with the 23-cm mode? |
| Answer: | 232/102 = 5.3 times higher! |
This increase in patient radiation dose results in better image quality. The patient radiation dose is higher because more x-rays per unit area are required to form the image. This results in lower noise and improved contrast resolution.
The portion of any image that results from the periphery of the input phosphor is inherently unfocused and suffers from vignetting, that is, a reduction in brightness at the periphery of the image.
Because only the central region of the input phosphor is used in the magnification mode, spatial resolution is also improved. In the 25-cm mode, a CsI image-intensifier tube can image approximately 0.125-mm objects (4 lp/mm); in the 10-cm mode, the resolution is approximately 0.08 mm (6 lp/mm).
The concept of spatial resolution as measured in line pairs per millimeter is discussed in Chapter 17. At this stage, it is sufficient to know that better spatial resolution is associated with a higher lp/mm value.
Fluoroscopic Image Monitoring
With the television monitoring system of a fluoroscopic image, the output phosphor of the image-intensifier tube is coupled directly to a television camera tube. The vidicon (Figure 25-11) is the television camera tube that is most often used in television fluoroscopy. It has a sensitive input surface that is the same size as the output phosphor of the image-intensifier tube. The television camera tube converts the light image from the output phosphor of the image intensifier into an electrical signal that is sent to the television monitor, where it is reconstructed as an image on the television screen.
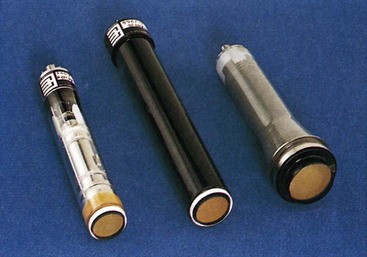
FIGURE 25-11 These three variations of a vidicon television camera tube have a diameter of approximately 2.5 cm and a length of 15 cm. The right tube uses electrostatic rather than electromagnetic electron beam deflection. (Courtesy Brad Mattinson, Philips Medical Systems.)
A significant advantage of television monitoring is that brightness level and contrast can be controlled electronically. With television monitoring, several observers can view the fluoroscopic image at the same time. It is even common to place monitors remote to the examination room for others to observe.
Television monitoring also allows for storage of the image in its electronic form for later playback and image manipulation.
Television Camera
Two methods are used to electronically convert the visible image on the output phosphor of the image intensifier into an electronic signal. These are the thermionic television camera tube and the solid state charge-coupled device (CCD). The CCD is discussed in Chapter 26.
The television camera consists of cylindrical housing, approximately 15 mm in diameter by 25 cm in length, that contains the heart of the television camera tube. It also contains electromagnetic coils that are used to properly steer the electron beam inside the tube. A number of such television camera tubes are available for television fluoroscopy, but the vidicon and its modified version, the Plumbicon, are used most often.
 A television camera tube or CCD converts the light signal from the output phosphor to an electronic signal.
Figure 25-12 shows a typical vidicon. The glass envelope serves the same function that it does for the x-ray tube: to maintain a vacuum and provide mechanical support for the internal elements. These internal elements include the cathode, its electron gun, assorted electrostatic grids, and a target assembly that serves as an anode.
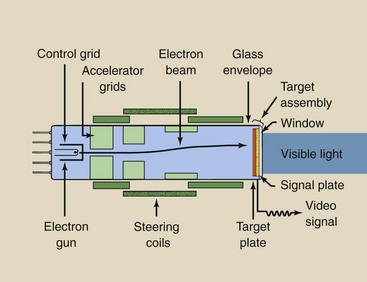
The electron gun is a heated filament that supplies a constant electron current by thermionic emission. The electrons are formed into an electron beam by the control grid, which also helps to accelerate the electrons to the anode.
The electron beam is further accelerated and focused by additional electrostatic grids. The size of the electron beam and its position are controlled by external electromagnetic coils known as deflection coils, focusing coils, and alignment coils.
At the anode end of the tube, the electron beam passes through a wire mesh–like structure and interacts with the target assembly. The target assembly consists of three layers that are sandwiched together. The outside layer is the window, the thin part of the glass envelope. Coated on the inside of the window is a thin layer of metal or graphite, called the signal plate. The signal plate is thin enough to transmit light yet thick enough to efficiently conduct electricity. Its name derives from the fact that it conducts the video signal out of the tube into the external video circuit.
A photoconductive layer of antimony trisulfide is applied to the inside of the signal plate. This layer, called the target, is swept by the electron beam. Antimony trisulfide is photoconductive because, when illuminated, it conducts electrons; when dark, it behaves as an insulator.
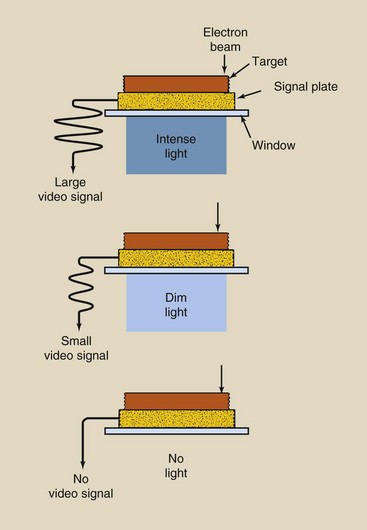
The mechanism of the target is complex but can be described briefly as follows. When light from the output phosphor of the image-intensifier tube strikes the window, it is transmitted through the signal plate to the target.
If the electron beam is incident on the same part of the target at the same time, some of its electrons are conducted through the target to the signal plate and from there out of the tube as the video signal. If that area of the target is dark, no video signal is produced. The magnitude of the video signal is proportional to the intensity of light (Figure 25-13).
Coupling to the Image Intensifier
Image intensifiers and television camera tubes are manufactured so that the output phosphor of the image-intensifier tube is the same diameter as the window of the television camera tube, usually 2.5 or 5 cm. Two methods are commonly used to couple the television camera tube to the image-intensifier tube (Figure 25-14).
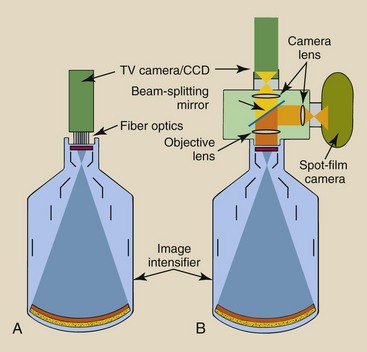
FIGURE 25-14 Television camera tubes and charge-coupled devices (CCDs) are coupled to an image-intensifier tube in two ways. A, Fiberoptics. B, Lens system.
The simplest method is to use a bundle of fiberoptics. The fiberoptics bundle is only a few millimeters thick and contains thousands of glass fibers per square millimeter of cross section. One advantage of this type of coupling is its compact assembly, which makes it easy to move the image-intensifier tower. This coupling is rugged and can withstand relatively rough handling.
The principal disadvantage is that it cannot accommodate the additional optics required for devices such as cine or photospot cameras.
To accept a cine or photospot camera, lens coupling is required. This type of coupling results in a much larger assembly that should be handled with care. It is absolutely essential that the lenses and the mirror remain precisely adjusted because malposition results in a blurred image.
The objective lens accepts light from the output phosphor and converts it into a parallel beam. When an image is recorded on film, this beam is interrupted by a beam-splitting mirror so that only a portion is transmitted to the television camera; the remainder is reflected to a film camera. Such a system allows the fluoroscopist to view the image while it is being recorded.
Usually, the beam-splitting mirror is retracted from the beam when a film camera is not in use. Both the television camera and the film camera are coupled to lenses that focus the parallel light beam onto the film and target of the respective cameras. These camera lenses are the most critical elements in the optical chain in terms of alignment. Although the lenses are shown as simple convex lenses, it should be understood that each is a compound lens system that consists of several separate lens elements.
Television Monitor
The video signal is amplified and is transmitted by cable to the television monitor, where it is transformed back into a visible image. The television monitor forms one end of a closed-circuit television system. The other end is the television camera tube or CCD.
Two differences between closed-circuit television fluoroscopy and home television are immediately obvious: no audio and no channel selection. Usually, the radiologic technologist manipulates only two controls: contrast and brightness.
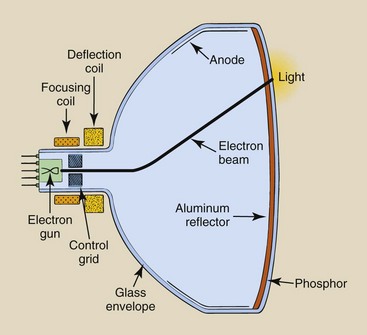
The heart of the television monitor is the television picture tube, or the cathode ray tube (Figure 25-15). It is similar to the television camera tube in many ways: A glass envelope, electron gun, and external coils are used to focus and steer the electron beam. It is different from a television camera tube in that it is much larger and its anode assembly consists of a fluorescent screen and a graphite lining.
The video signal received by the television picture tube is modulated, that is, its magnitude is directly proportional to the light intensity received by the television camera tube. Different from the television camera tube, the electron beam of the television picture tube varies in intensity according to the modulation of the video signal.
Modulation is a change in a quantity or signal in response to another quantity or signal and is widely used in medical imaging.
The intensity of the electron beam is modulated by a control grid, which is attached to the electron gun. This electron beam is focused onto the output fluorescent screen by the external coils. There, the electrons interact with an output phosphor and produce a burst of light.
The phosphor is composed of linear crystals that are aligned perpendicularly to the glass envelope to reduce lateral dispersion. It is usually backed by a thin layer of aluminum, which transmits the electron beam but reflects the light.
Television Image
The image on the television monitor is formed in a complex way, but it can be described rather simply. It involves transforming the visible light image of the output phosphor of the image-intensifier tube into an electrical video signal that is created by a constant electron beam in the television camera tube. The video signal then modulates the electron beam of the television picture tube and transforms that electron beam into a visible image at the fluorescent screen of the picture tube.
Both electron beams—the constant one of the television camera tube and the modulated one of the television picture tube—are finely focused pencil beams that are precisely and synchronously directed by the external electromagnetic coils of each tube. These beams are synchronous because they are always at the same position at the same time and move in precisely the same fashion.
The movement of these electron beams produces a raster pattern on the screen of a television picture tube (Figure 25-16). Although the following discussion relates to a television picture tube, remember that the same electron beam pattern occurs in the television camera tube.
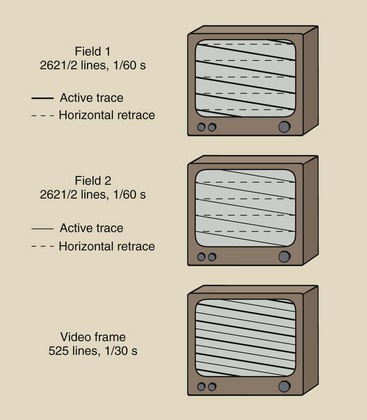
The electron beam begins in the upper left corner of the screen and moves to the upper right corner, creating a line of varying intensity of light as it moves. This is called an active trace. The electron beam then is blanked, or turned off, and it returns to the left side of the screen as shown. This is the horizontal retrace.
A series of active traces then is followed by horizontal retraces until the electron beam is at the bottom of the screen. This is very similar to the action of word processing when one types a line of information (the active trace): The cursor returns (the horizontal retrace) and continues this sequence to the bottom of the page. Whereas one completes a page, the electron beam completes a television field.
The similarity stops there, however, because you would continue word processing. The electron beam is blanked again and undergoes a vertical retrace to the top of the screen.
The electron beam now describes a second television field, which is the same as the first except that each active trace lies between two adjacent active traces of the first field. This movement of the electron beam is called interlace, and two interlaced television fields form a single television frame.
In the United States, power is supplied at 60 Hz, which results in 60 television fields per second and 30 television frames per second. This is fortunate because the flickering of home movies (shown at 16 frames per second) or old-time movies does not appear on the television image. Flickering is not detectable by the human eye at rates above approximately 20 frames per second. At a frame rate of 30 per second, each frame is 33 ms long.
In the television camera tube, as the electron beam reads the optical signal, the signal is erased. In the television picture tube, as the electron beam creates the television optical signal, it immediately fades, hence the term fluorescent screen. Therefore, each new television frame represents 33 ms of new information.
Standard broadcast and closed circuit televisions are called 525-line systems because they use 525 lines of active trace per frame. Actually, only about 480 lines are used per frame because of the time required for retracing. Other special purpose systems have 875 or 1024 lines per frame and therefore have better spatial resolution. These high-resolution systems are particularly important for digital fluoroscopy.
In countries where power is supplied at 50 Hz, 50 television fields and thus 25 television frames are used per second. On a TV monitor, 625 lines are used per frame in two consecutive fields of 312.5 lines.
For a 23-cm image intensifier, a 525-line TV system provides a spatial resolution of approximately 1 lp/mm; a 1024-line system provides spatial resolution of 2 lp/mm.
The vertical resolution is determined by the number of scan lines. The horizontal resolution is determined by bandpass. Bandpass is expressed in frequency (Hz) and describes the number of times per second that the electron beam can be modulated. A 1-MHz bandpass would indicate that the electron beam intensity could be changed a million times each second.
The objective of television designers is to create a television frame that has equal horizontal and vertical resolution. Commercial television systems have a bandpass of about 3.5 MHz. Those used in fluoroscopy are approximately 4.5 MHz; 1000-line high-resolution systems have a bandpass of approximately 20 MHz.
The television monitor remains the weakest link in image-intensified fluoroscopy. A 525-line system has approximately 1-lp/mm spatial resolution, but the image intensifier is good to about 5 lp/mm. Therefore, if the superior resolution of the image intensifier is to be captured, the image must be recorded on film through an optically coupled photographic camera.
Image Recording
The conventional cassette-loaded spot film is one item that is used with image-intensified fluoroscopes. The spot film is positioned between the patient and the image intensifier (Figure 25-17).
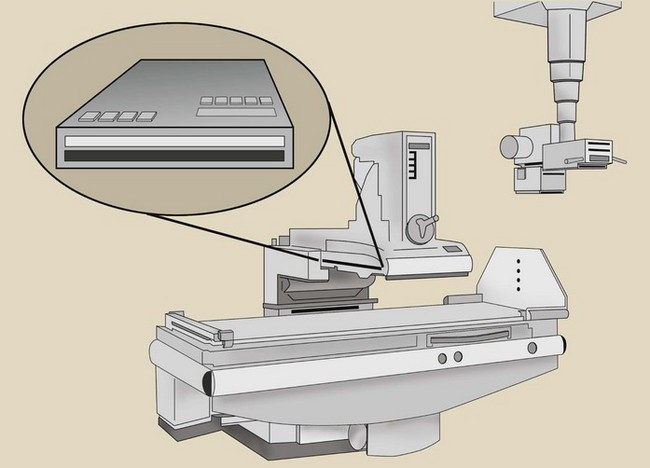
FIGURE 25-17 The cassette-loaded spot film is positioned between the patient and the image intensifier.
During fluoroscopy, the cassette is parked in a lead-lined shroud so it is not unintentionally exposed. When a cassette spot-film exposure is desired, the radiologist must actuate a control that properly positions the cassette in the x-ray beam and changes the operation of the x-ray tube from low fluoroscopic mA to high radiographic mA. Sometimes it takes the rotating anode a second or two to be energized to a higher speed.
The cassette-loaded spot film is masked by a series of lead diaphragms that allow several image formats. When the entire film is exposed at one time, it is called “one-on-one” Mode. When only half of the film is exposed at a time, two images result—“two-on-one” mode. Four-on-one and six-on-one modes are also available, with the images becoming successively smaller.
Use of cassette-loaded spot film requires a higher patient dose, and the pre-exposure delay is sometimes a nuisance. Cassette-loaded spot films, however, do provide a familiar “life-sized” format for the radiologist and produce images of high quality.
The photospot camera is similar to a movie camera except that it exposes only one frame when activated. It receives its image from the output phosphor of the image-intensifier tube and therefore requires less patient exposure than is required by the cassette-loaded spot film. The photospot camera does not require significant interruption of the fluoroscopic examination and avoids the additional heat load on the x-ray tube that is associated with cassette-loaded spot films.
The photospot camera uses film sizes of 70 and 105 mm. As a general rule, larger film format results in better image quality but at increased patient dose. Even with 105-mm spot films, however, the patient dose is only approximately half that used with cassette-loaded spot films.
The trend in spot filming is to use the photospot camera. The photospot camera provides adequate image quality without interruption of the fluoroscopic examination and at a rate of up to 12 images per second (Table 25-2). However, in contrast to the life-sized cassette image, the 105-mm spot film image is minified.
Fluoroscopy Quality Control
Fluoroscopic examination can result in high patient radiation dose. The entrance skin dose (ESD) for an adult averages 30 to 50 mGyt/min (3 to 5 R/min) during fluoroscopy; this can easily result in a skin dose of 100 mGyt (10 rad) for many fluoroscopic examinations. For interventional radiology procedures, a skin dose of 1000 mGyt (100 rad) is common but should be avoided if possible.
Approximate patient radiation dose can be identified through the performance of proper QC measurements. Some measurements may be required more frequently after significant changes have occurred in the operating console, high-voltage generator, or x-ray tube.
Exposure Rate
Federal law and most state statutes require that under normal operation, the ESD rate shall not exceed 100 mGyt/min (10 R/min). For interventional radiology procedures, the fluoroscope may be equipped with a high-level control, which allows an ESD up to 200 mGyt/min. Unlimited exposure rates are permitted for recorded fluoroscopy, such as cineradiography.
Measurements are made with a calibrated radiation dosimeter to ensure that these levels are not exceeded. Lucite, aluminum, copper, and lead filters are used to determine the adequacy of any automatic brightness stabilization (ABS) system.
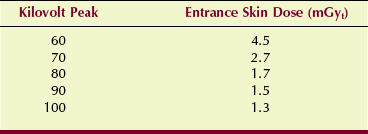
Spot-Film Exposures
Two types of spot-film devices are used; both must be evaluated for radiation exposure and proper collimation. Proper exposure of the cassette spot film depends on the kVp, mAs value, and sensitivity characteristics of the screen-film combination. ESDs for such a spot-film device vary widely (Table 25-3). Values reported in this table were obtained with a 10 : 1 grid and a 400-speed image receptor. Nongrid exposure values are approximately half of the values reported here.
The use of photofluorospot images is routine. These images use less film, require less personnel interaction, and are produced with a lower patient radiation dose. Photofluorospot images are recorded on film from the output phosphor of an image-intensifier tube.
In addition to the factors that affect cassette spot films, photofluorospot images depend on characteristics of the image intensifier, particularly the diameter of the input phosphor. Table 25-4 shows representative ESD for two input phosphor sizes and no grid. These are substantially lower than those attained with cassette spot films.
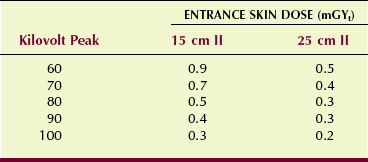
As the active area of the input phosphor of the image-intensifier tube is increased, the patient dose is reduced in approximate proportion to the change in diameter of the input phosphor. Use of a grid during photofluorospot imaging approximately doubles the ESD.
Automatic Exposure Systems
All fluoroscopes are equipped with some sort of ABS. Each system functions in the manner of the phototimer of a radiographic imaging system, producing constant image brightness on the television or flat panel monitor, regardless of the thickness or composition of the anatomy. These systems tend to deteriorate or fail with use.
Performance monitoring of an ABS is conducted by determining that the radiation exposure to the input phosphor of the image-intensifier tube is constant, regardless of patient thickness. With a test object in place, the image brightness on the video monitor should not change perceptibly when various thicknesses of patient-simulating material are inserted into the beam. The input exposure rate to the image-intensifier tube is measured and should be in the range of 0.1 to 0.4 µGya/s (10–40 µR/s).
The test objects used for ACR accreditation is shown in Figure 25-18. These test objects tracks ABS versus tissue thickness and assesses spatial resolution, contrast resolution, and noise.
Summary
The original fluoroscope, invented by Edison, had a zinc–cadmium sulfide screen that was placed in the x-ray beam directly above the patient. The radiologist stared directly into the screen and viewed a faint yellow-green fluoroscopic image. It was not until the 1950s that the image intensifier was developed.
In the past, fluoroscopy required radiologists to adapt their eyes to the dark before the examination was performed. Under dim viewing conditions, the human eye uses rods for vision; these have low visual acuity. The image from today’s fluoroscope is bright nough to be perceived by cone vision. Cone vision provides superior visual acuity and contrast perception. When viewing the fluoroscopic image, the radiologist is able to see fine anatomical detail and differences in brightness levels of anatomical parts.
The image intensifier is a complex device that receives the image-forming x-ray beam, converts it to light, and increases the light intensity for better viewing. The input phosphor converts the x-ray beam into light. When stimulated by light, the photocathode then emits electrons, and the electrons are accelerated to the output phosphor.
The following relationships define several characteristics of image-intensified fluoroscopy:

Brightness gain is also expressed as the conversion factor:
The fluoroscopy television camera is attached to the image intensifier with a lens coupling to accommodate a cine or a spot-film camera. When an image is recorded on film, a beam-splitting mirror separates the beam so that only a portion is transmitted to the television camera and the remainder is reflected to a spot-film camera.
1. Define or otherwise identify the following:
2. Draw a diagram to show the relationship between the x-ray tube, the patient table, and the image intensifier.
3. What is the difference between rod and cone vision? With which is visual acuity greater?
4. What is the approximate kVp for the following fluoroscopic examinations: barium enema, gallbladder, and upper gastrointestinal?
5. Draw a cross section of the human eye and label the cornea, lens, and retina.
6. Explain the difference between photoemission and thermionic emission.
7. Diagram the image-intensifier tube, label its principal parts, and discuss the function of each.
8. A 23-cm image intensifier has an output phosphor size of 2.5 cm and a flux gain of 75. What is its brightness gain?
10. Why is the television monitor considered the weakest link in image-intensified fluoroscopy?
11. What is the primary function of the fluoroscope?
12. Who invented the fluoroscope in 1896? What phosphor was used on that original fluoroscopic screen?
13. What determines the image frame rate in video fluoroscopy?
14. What limits the vertical resolution and horizontal resolution of a video monitor?
15. Does spatial resolution change when one is viewing in the magnification mode versus the normal mode?
16. What is meant by a trifield image intensifier?
17. Draw the approximate raster pattern for a conventional video monitor.
18. When the image intensifier is switched from 15-cm mode to 25-cm mode, what happens to patient radiation dose and contrast resolution?
19. Trace the path of information-carrying elements in a fluoroscopic system from incident x-rays to video image.
20. What is the principal difference between a standard video system for fluoroscopy and a high-resolution system?
The answers to the Challenge Questions can be found by logging on to our website at http://evolve.elsevier.com.