Information needs, asking questions, and some basics of research studies
After reading this chapter, you should be able to:
• Describe the types of clinical information needs that can be answered using research
• Differentiate between ‘just-in-case’ information and ‘just-in-time’ information
• Convert your information needs into answerable, well-structured clinical questions, using the PICO format
• Describe the basic design of some of the common study types that are used in evidence-based practice
• Explain the hierarchy of evidence for questions about the effects of interventions, the hierarchy for diagnostic questions and the hierarchy for prognostic questions
• Explain what is meant by internal validity and external validity
• Describe some of the main types of bias that can occur in studies
• Differentiate between statistical significance and clinical significance and briefly explain how each of them is determined
This chapter provides background information that you need to know for understanding the details of the evidence-based practice process that follow in the subsequent chapters of this book. In that sense, this chapter is a somewhat diverse but important collection of topics. We start by describing the types of clinical information needs that health professionals commonly have and discuss some of the methods that health professionals use to obtain information to answer those needs. As we saw in Chapter 1, converting an information need into an answerable, well-structured question is the first step in the process of evidence-based practice and, in this chapter, we explain how to do this. We then explain the importance of matching the type of question asked with the most appropriate study design. As part of this, we will introduce and explain the concept of ‘hierarchies of evidence’ for each type of question. In the last sections of this chapter, we will explain some concepts that are fundamental to the critical appraisal of research evidence, which is the third step in the evidence-based practice process. The concepts that we will discuss include internal validity, chance, bias, confounding, statistical significance, clinical significance and power.
Clinical information needs
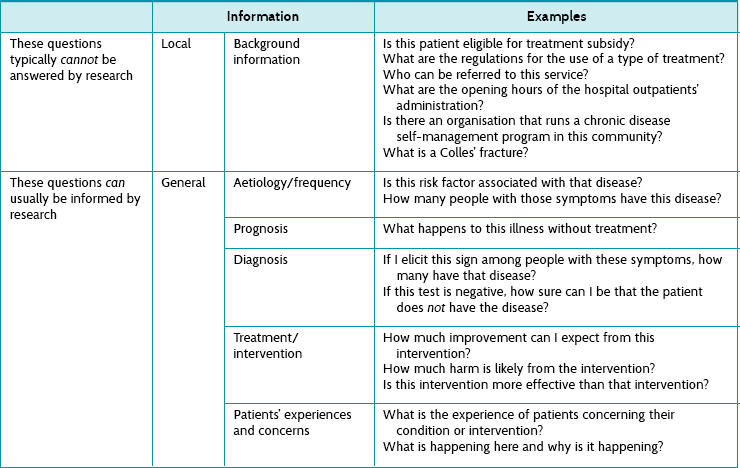
Health professionals need information all the time to help assess patients, make decisions, reassure patients, formulate treatment, make practical arrangements and so on. Some of the necessary information can be usefully assembled from existing research, and some cannot. Table 2.1 provides examples of some of the obvious types of information that can or cannot be gathered from research. This book will help you to learn how to deal with information needs that can be answered to some extent by research. Along the way we will also discuss the types of information that come from patients and the types of information that come from clinical experience. When we consider these together—information from research, patients and experience—we are working within an evidence-based practice framework.
Dealing effectively with information needs
Having established that health professionals have many information needs, this section explains how you can effectively deal with these information needs. A simple overview of one way of doing this is as follows:
• Recognise when we have a question.
• Record the question—do not lose that moment!
• Record the answer so that it can be re-used later.
• Stop and reflect on what you have been looking up and dealing with. Is it helping you to answer your question?
The size of the problem
The clinical literature is big. Just how big is staggering. There are thousands of new studies published every week. For example, there are about 75 randomised controlled trials and 11 systematic reviews (this is where primary studies have been systematically located, appraised and synthesised) published per day.1 That is about one trial published every 19 minutes! Worse than that, randomised controlled trials represent a small proportion (less than 5%) of the research that is indexed in PubMed, which, as you will see in Chapter 3, is just one of several databases available for you to search to find evidence. This means that the accumulated literature is a massive haystack to search for that elusive, yet important, needle of information you need. The information might mean the difference between effective or ineffective (or even harmful) care for your patient. One of the purposes of this book, then, is to help you find evidence needles in research haystacks.
Noting down your clinical question
It is important that we keep track of the questions we ask. If not, it is all too easy to lose track of them and then the opportunity evaporates. If you cannot remember what you wanted to know when in the midst of managing a patient, the chances are you will never go back to answering that question.
How should we do this? One way is to keep a little book in which to write them down in your pocket or handbag. Date and scribble. A more modern way is electronically, of course, using a smart-phone, iPad/tablet or computer (if simultaneously making patient records). Some health professionals tell the patient what they are doing:
Or:
(This second strategy is risky until you have had a lot of practice with the first!)
In Chapter 1, we discussed the general process of looking up, appraising and applying the evidence that we find. Remember also to keep track of the information that you have found (in other words, write it down!), and how you evaluated and applied it. In the end, the information that is found might result in you changing (hopefully improving) your clinical practice. The way it does this is often uncoupled from the processes you undertook, so it takes some time to realise what led you to make the changes—often systematic—to the way you do things. In Chapter 17 there is more information about how this process can occur. Sometimes the research information just reassures us, the health professional, that we are on the right track, but this is important also.
Different ways of obtaining information: push or pull? just-in-case or just-in-time?
Push: just-in-case information
In advertising jargon, the term push means that the information is sent out, or broadcast. This is the traditional means of disseminating information. This is basically the function of journals. After research has been undertaken it is either sent directly to you, or pre-digested in some way (perhaps as an editorial, review article, systematic review or guideline). ‘Just-in-case’ information is made available when it is generated, or when it is thought (by someone other than you, the health professional) that health professionals ought to hear about it.
Figure 2.1 shows some examples of information that can be pushed. Other sources of ‘push’ information include conferences, professional newsletters, textbooks and informal chats to colleagues and other people from other professional groups.
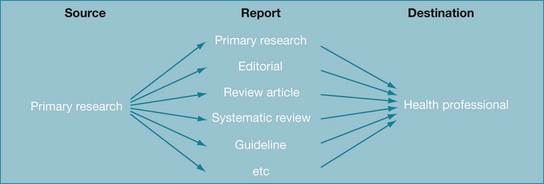
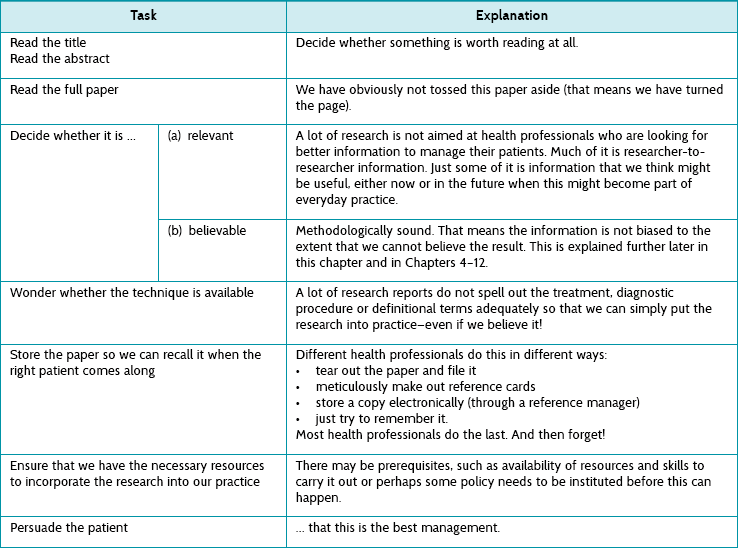
As can be seen, there are many ways in which a piece of research can percolate through to you as a health professional. The picture is actually more complex than this: what is picked up for review, systematic review and so on is determined by several factors, including which journals the primary data were first published in, how relevant readers think the research is and how well it fits into the policy being formulated or already in existence. There are, in fact, different sorts of information that we might consider accessing and this is explained in detail in Chapter 3 (see Figure 3.1). But this is only the start. All these methods rely on the information arriving at your place of work (or home, post box, email inbox, online blog, etc). Then it has to be managed before it is actually put into practice. How does this happen? There are a number of different stages that can be considered, and these are explained in Table 2.2.
TABLE 2.2:
The processes involved in making sure that just-in-case information is used properly to help patients
Clearly this is not an easy process—how do we get just the right article from the thousands published each week? We often feel overloaded by this, but as Clay Shirky has said: ‘It’s not information overload. It’s filter failure.’2 The filtering of research information has many steps where the flow can be distorted or interrupted. All the steps have to happen for the research to run the gauntlet through to the patient. One part of the solution is to use one of the good abstracting services (there are also many poor ones, so check their filtering process first). One example of a good service is the Evidence Based Medicine online journal (see ebm.bmj.com). This type of service is described in depth in Chapter 3 but, in a nutshell, such journals only provide abstractions of previous research (that is, they contain no primary research). Papers are abstracted only if they survive a rigorous selection process that begins with a careful methodological appraisal; and then, if the paper is found to be sufficiently free of bias, it is sent for appraisal by a worldwide network of health professionals who decide whether the research is relevant. The resultant number of papers reported in each discipline is surprisingly small. In other words, only a few papers are not too biased and also relevant!
A word of caution, though: most journal scanning services are insufficient for health professionals to use as a method for keeping up to date with research in their area of practice.3 This is partly due to the problem of research scatter, where trials and systematic reviews are scattered across hundreds of specialty and general journals.3 Personal journal subscriptions (and traditional habits such as scanning a few specialty journals) are insufficient for keeping up to date and need to be supplemented by other methods such as journal scanning systems.3 However, few of the current journal scanning services or systems cover sufficient journals and filter for quality and relevance. Happily for health professionals, however, there is an alternative option to ‘just-in-case’ information.
Pull: just-in-time information
Pull is advertising jargon for information that potential customers look for (rather than simply waiting for it to be pushed to them). This is information that the health professional seeks in relation to a specific question arising from their clinical work, and so this gives it certain characteristics. This is illustrated in Table 2.3 using the five As that were introduced in Chapter 1 as a way of simply describing the steps in the evidence-based practice process.
TABLE 2.3:
Processes involved in just-in-time information: the five as
| Task | Explanation |
| Ask a question: re-format the question into an answerable one | This ensures relevance—by definition! |
| Access the information: searching | Decide whether to look now (in front of the patient) or later. Searching is a special skill, which is described in Chapter 3. |
| Appraise the papers found | We talk about this (in fact, we talk about this a lot) in Chapters 4–12. |
| Apply the information | This means with the patient who is in front of you. |
| Audit | Check whether the evidence-based practice processes that you are engaged in are working well. |
If this looks familiar to you, well, this is the essential core of evidence-based practice. How feasible is it to incorporate this way of finding information ‘just-in-time’? Again, there are several steps which are not easy—they all need mastering and practice (like almost everything in clinical care). For example, asking questions is difficult. It requires health professionals to be open to not knowing everything. Doctors are notorious for having trouble with this—perhaps because society has bestowed some god-like attributes on them that made it potentially too disappointing if they admitted not knowing stuff. The truth is that most people in modern times welcome the honesty that goes with questioning the management you are proposing to give them. It shows how we health professionals are taking extra and meticulous care.
How often do we ask questions? Is this something that we can aspire to realistically? Most health professionals are worried that they do not ask questions enough. Relax. You probably do. Studies have been undertaken in a number of settings (mostly to do with doctors, sadly) to show that they ask questions much more than they realised. For example, a study undertaken in Iowa, USA, examined what questions family doctors working in the community asked during the course of their work. Just over 100 doctors asked >1100 questions over 2.5 days, which is approximately 10 questions each, or 4 per person per day.4
A similar Spanish study to the one above found that doctors had a good chance (nearly 100%) of finding an answer if it took less than 2 minutes, but were much less likely to do so (<40%) if it took 30 minutes.5 A study of doctors found that they are more likely to chase an answer if they believe that an answer exists, or if the information need is urgent.6 Nurses working in a similar setting were more likely to ask someone or look in a book in order to answer their questions.7 Despite advances in electronic access, health professionals do not seem to be doing well at effectively seeking answers to clinical questions,8 even though there is good (randomised controlled trial) evidence to show that getting information this way (that is, just-in-time) improved clinical decision-making.9
If we are not able in the hurly burly of daily clinical practice to look up questions immediately, it is important (as we mentioned earlier in the chapter) to write them down in a questions log book (paper or electronic).
How to convert your information needs into an answerable clinical question
We will now look at how you can take a clinical question and convert it into an answerable clinical question which you can then effectively search to find the answers to. Remember from Chapter 1 that forming an answerable clinical question is the first step of the evidence-based practice process. Asking a good question is central to successful evidence-based practice. Converting our clinical question into an ‘answerable question’ is necessary because it prevents the health professional from forgetting any of the important components of the clinical question. Typically there are four components,10 which can be easily remembered using the PICO mnemonic:
P Patient or problem (or population or person)
I Intervention (or diagnostic test or prognostic factor or issue)
A few questions are only ‘PO’s—population and outcome. For example, ‘What is the chance that an elderly person who falls (P) will have a second fall within 12 months (O)?’ But most questions have three or four PICO elements, so we will now address each in turn.
Patient or problem (or population or person)
This component makes sure that you are clear who the question relates to. It may include information about the patient, their primary problem or disease, or coexisting conditions—for example, ‘In children with autism …’ Sometimes we specify the sex and age of a patient if that is going to be relevant to the diagnosis, prognosis or intervention—for example, ‘In elderly women who have osteoporosis …’
Intervention (or diagnostic test or prognostic factor or issue)
The term ‘intervention’ is used here in a broad sense. It may refer to the intervention (that is, treatment) that you wish to use with your patient—for example, ‘In people who have had a stroke, is home-based rehabilitation as effective as hospital-based rehabilitation in improving ability to perform self-care activities?’ In this case, home-based rehabilitation is the intervention that we are interested in. Or, if you have a diagnostic question, this component of the question may refer to which diagnostic test you are considering using with your patients—for example, ‘Does the Mini-Mental State Examination accurately detect the presence of cognitive impairment in older community-living people?’ In this example, the Mini-Mental State Examination is the diagnostic test that we are interested in. A question about prognosis may specify a particular factor or issue that might influence the prognosis of your patient—for example, in the question ‘What is the likelihood of hip fracture in women who have a family history of hip fracture?’, the family history of hip fracture is the particular factor that we are interested in. If you want to understand more about patients' perspectives, you may want to focus on a particular issue. For example, in the question ‘How do adolescents who are being treated with chemotherapy feel about hospital environments?’, the issue of interest is adolescent perceptions of hospital environments.
Comparison
Your questions may not always include this component, but it is usually useful to consider. It is mainly questions about the effects of intervention (and sometimes diagnosis) that use this component. Add a comparison element to your question if you are interested in comparing the intervention component of your question with another intervention and wish to know if one intervention is more effective than another—which might include nothing. In the example we used above, ‘In people who have had a stroke, is home-based rehabilitation as effective as hospital-based rehabilitation in improving ability to perform self-care activities?’, the comparison is hospital-based rehabilitation. Often, the comparison that you are interested in may be ‘usual’ (or standard) care. While intervention questions sometimes do not include this component, other types of questions that are less likely to include this component include:
• frequency questions (for example, ‘How common is dementia in residents of nursing homes?’—a ‘PO’ question)
• prognosis questions (for example, ‘How long before a runner with an ankle sprain can return to training?’)
• qualitative questions (for example, ‘How do adolescents who are being treated with chemotherapy feel about hospital environments?’).
Outcome(s)
This component of the question should clearly specify what outcome (or outcomes) you are interested in. For some outcomes you may also need to specify whether you are interested in increasing the outcome (such as the score on a functional assessment or chance of recovery) or decreasing it (such as the reduction of pain or the risk of relapse). In the stroke question example above, the outcome of interest was an improvement in the ability to perform self-care activities. As you will see in Chapter 14, shared decision making is an important component of evidence-based practice and it is important, where possible, to involve your patient in choosing the goals of intervention that are most important to them. As such, there will be many circumstances where the outcome component of your question will be guided by your patient's preferences.
The exact way that you structure your clinical question varies a little depending on the type of question. This is explained more in the relevant chapter—Chapter 4 for questions about the effects of intervention, Chapter 6 for diagnostic questions, Chapter 8 for prognostic questions and Chapter 10 for qualitative questions.
Now that the question is formulated, what types of information should be looked for?
Not all types of information are equally useful—some are much more useful than others. This is because useful pieces of information are:
Relevant information
One problem when searching is that there is so much information that deciding what to download and use can be distorted by finding something that nearly answers what you asked, but not quite. It is all too easy to be distracted by interesting-looking (but sadly, not directly relevant) information. Information may be published as researcher-to-researcher communication. For example, research into the most valid and reliable instrument for measuring trial outcomes is unlikely to be directly useful to any question you need answered as a practising health professional.
Deciding how relevant information is can be partly achieved by using the PICO mnemonic explained above. This can help you decide in advance what you need to ask, and then ensure that you are thinking about the relevance of each of the components of your question.
Truthful information
Some information appears to answer your question, but either does not or, worse, cannot. Much published research is unhelpful to health professionals for several reasons:
1. The research (even if attempting to answer your question) used a design that cannot answer the question. This is often because the wrong study type (to provide the best type of evidence for the question being asked) was used. There are many different study designs, and the right one must be used to answer the question at hand. Using the wrong study design may mean either no direct answer or that there is too much bias to rely on the result.
2. The research (even though it does attempt to answer your question) had some flaws in its conduct that also leaves it vulnerable to bias, leaving too much uncertainty to answer the question securely. For example, the research may have failed in a large number of different ways so that we are unsure that the apparent ‘result’ is true.
3. There were insufficient numbers of participants or ‘events’ (that is, things of clinical importance that happen). This may mean that there is not enough statistical power.
We will now look at these reasons in detail.
What are the different study types?
First we need to understand some of the different study types that exist. They are briefly explained in Table 2.4, and illustrated in Figure 2.2.
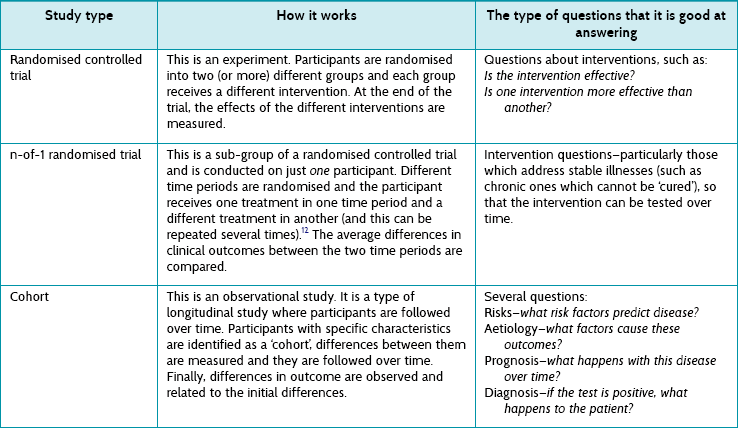
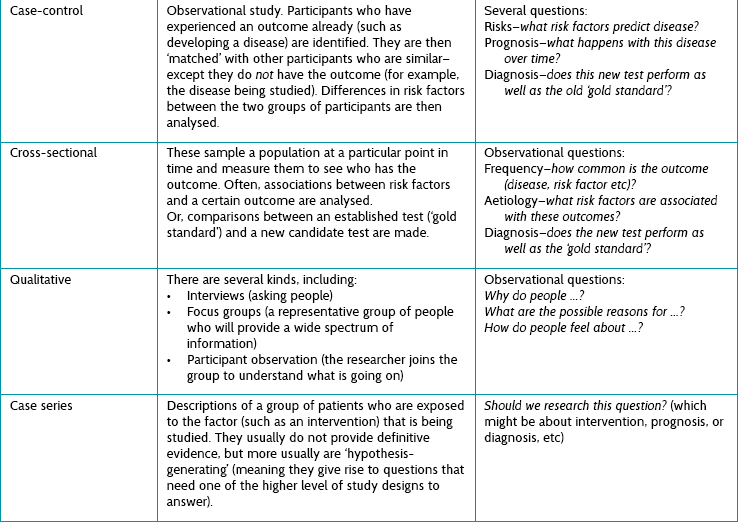
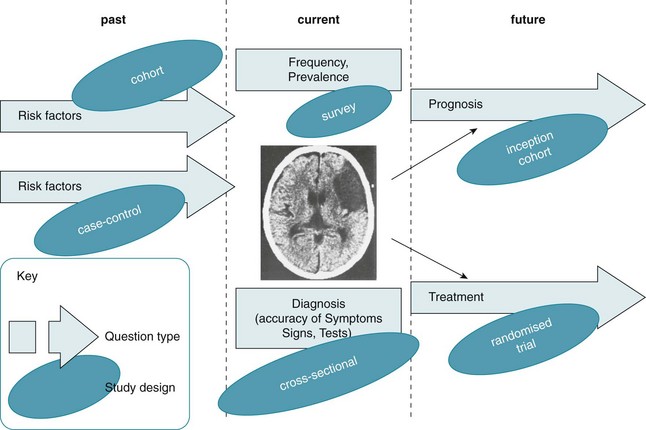
Figure 2.2 Example: how different question types (at different stages of the evolution of stroke) might be posed and the study types that might answer them. CT scan reproduced with permission from Crawford MH et al. Cardiology, 3rd ed. Mosby; 2010, Fig. 11.1A.11
There are some important things to notice about the study types listed in Table 2.4:
1. Only one study type is particularly good at addressing intervention questions—randomised controlled trials. Even better is a pooled analysis of several randomised controlled trials, something called a meta-analysis (a type of systematic review where the results from individual studies are combined). Systematic reviews and meta-analyses are discussed in detail in Chapter 12.
2. A subgroup of randomised controlled trials is the n-of-1 trial, described in Table 2.4. These may represent the best evidence for an individual patient, because they are undertaken in the same individual that the results will be applied to.
3. All the other study types are observational studies. They are not the best at answering questions about the effect of interventions (you will see in Chapter 4 why a randomised controlled trial is best primary study type for answering intervention questions), but they are good at answering other types of questions, including questions about prognosis, diagnosis, frequency and aetiology.
4. Different questions require different study designs; this is explained more fully in the next section. Although randomised controlled trials can sometimes answer questions about prognosis (for example), by examining just the control group (who did not receive any intervention) of a randomised controlled trial, this can be inefficient.
This means that there is no single ‘hierarchy of evidence’ (a rank order of study types from good to bad), as is sometimes claimed. However, hierarchies of evidence do exist for each question type.
Figure 2.2 illustrates the various types of questions that can arise from a particular clinical scenario and how different study types are most appropriate to answer each of the question types. The clinical scenario used in Figure 2.2 is patients with stroke. Starting on the left before the disease has become manifest, you might ask about risk factors that might lead to stroke (for example hypertension, diabetes and so on). There are two principal study types that can be used to answer these questions: a cohort study or a case-control study, and both have their own pros and cons (see Table 2.4).
Or you might ask about the prevalence of stroke—for example, ‘How common is a history of stroke in nursing-home residents who are older than 70 years?’. For this question, a simple cross-sectional survey would be the best way of providing the answer and the type of study you should look for. A similar cross-sectional study design may be best for answering diagnosis questions (although sometimes a cohort design is necessary). For example, ‘Which depression screening instrument is as good at diagnosing post-stroke depression as the “gold standard” assessment of depression?' Another method testing diagnostic alternatives is a cohort study, especially when there is no gold standard and the patient outcome (‘Did the patient become clinically depressed?’) has to be the gold standard instead.
The right-hand side of the figure shows the two types of questions that often occur when looking to the future: (1) prognosis questions (what will happen questions—such as ‘How likely is it that a stroke patient with expressive aphasia will experience full recovery of their speech?’), which are best answered by an inception cohort study (see Table 2.4); and (2) intervention questions (such as ‘Is mirror therapy effective at improving upper limb function in people who have had a stroke’?), which are best answered by a randomised controlled trial.
Hierarchies of evidence for each question type
Hierarchies of evidence tell you what type of study provides the most robust (that is, the most free of bias) evidence, and therefore what you should first look for. There are different hierarchies for each question type. If there are no relevant studies of the type that are at the top of the hierarchy (for example systematic reviews of randomised controlled trials for an intervention question), proceed to search for the type of study next down the hierarchy (for example randomised controlled trials). This ensures that you select from the best available evidence. The higher up the hierarchy, the more likely a study can minimise the impact of bias on its results. We can also think of the hierarchy as representing a continuum of certainty (with higher levels of certainty at the top of the hierarchy). Consider, for example, the hierarchy of evidence for intervention questions—the continuum of certainty represents how certain we are that the effects found in the study are actually due to the intervention and not something else. This introduces two very important concepts in evidence-based practice, bias and confounding, which are explained in the next section of this chapter.
There are a number of published hierarchies of evidence assembled by different organisations. Although these are generally similar, they have subtle differences between them. So if you are a reading a document and it refers to a particular study as being (for example) level III-1 evidence, it is a good idea to check which hierarchy of evidence the document followed, because level III-1 evidence in one hierarchy scheme may differ slightly from that in another. The hierarchies of evidence for the various types of questions shown in Table 2.5 are a simplified version of the hierarchies of evidence that have been developed by the National Health and Medical Research Council (NHMRC) of Australia.13
TABLE 2.5:
Hierarchies and levels of evidence for questions about intervention, diagnosis and prognosis (based on nhmrc levels of evidence)12
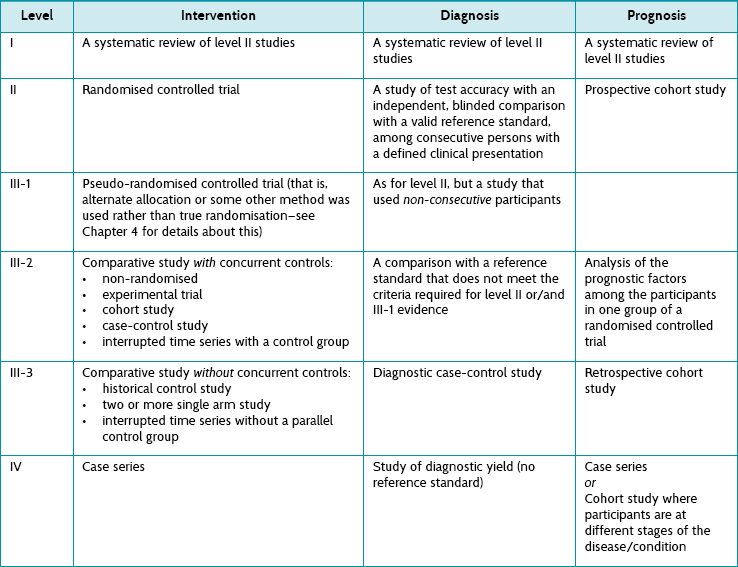
Most of the study types included in Table 2.5 have been explained already in this chapter. The intricate details of the main study types are explained in the relevant chapter that deals with how to appraise evidence for each of the question types. Here we briefly consider study types12 additional to those in Table 2.5 and not already explained elsewhere in this chapter.
• A non-randomised experimental trial is essentially the same as a randomised controlled study except that there is no randomisation (hence it is lower down the hierarchy, as this opens it up to all kinds of bias). Participants are allocated to either an intervention or a control group and the outcomes from each group are compared.
• The basic premise of a case-control study was explained in Table 2.4, but not in relation to how it can be used to answer questions about the effects of intervention. When a case-control study has been used to answer a question about the effect of an intervention, ‘cases’ are participants who have been exposed to an intervention and ‘controls’ are participants who have not.
• Interrupted time series studies attempt to test interventions. Trends in an outcome are measured over multiple time-points before and after the intervention is provided to a group of participants, and these can then be compared with the outcomes at the same time-points for a control group of participants (who did not receive the same intervention). This type of study can also be conducted without a parallel control group being involved, comparing the before to the after data for just the one group, but this is a weaker design (and it lies lower down the hierarchy of evidence).
• In a historical control study the key word is historical, as the control group does not participate in the study at the same time as the intervention group. There are two main forms that this type of study can take. Data about outcomes are prospectively collected for a group of participants who received the intervention of interest. These data are compared with either:
1. data about outcomes from a group of people who were treated at the same institution before the intervention of interest was introduced—this group is, in a sense, considered to be a control group who received standard care; or
2. data about outcomes from a group of people who received the control (or an alternative) intervention but the data comes from a previously published document.
• A two or more single arm study gathers the data from two or more studies and compares the outcomes of a single series of participants (in each study) who received the intervention of interest.
• A case series is simply a report on a series of patients (that is, ‘cases’) who have an outcome of interest (or received the intervention that is being studied). There is no control group involved.
• In a diagnostic (test) accuracy study, the outcomes from the test that is being evaluated (known as the index test) are compared with outcomes from a reference standard test to see how much agreement there is between the two tests. The outcomes are measured in people who are suspected of having the condition of interest. A reference standard test (often called the ‘gold standard’ test) is the test that is considered to be the best available method for establishing the presence or absence of the target condition of interest.
• In a diagnostic case-control study, the results from a reference standard test are used to create two groups of people—those who are known to have the condition of interest (the ‘cases’) and those who do not have it (the ‘controls’). The index test results for the cases are then compared with the index test results for the controls.
• In a study of diagnostic yield, the index test is used to identify people who have the condition of interest. A reference standard test is not used to confirm the accuracy of the diagnosis and, therefore, this study design is at the bottom of the hierarchy of evidence for diagnostic questions.
• The basic idea of a cohort study was explained in Table 2.4, but there are two broad types of cohort studies that can be conducted and, as you can see in the prognosis column of Table 2.5, they sit at very different levels in the hierarchy of evidence for prognostic questions. The reasons for this are explained in Chapter 8, but for now we will just explain the main difference between them.
• In a prospective cohort study, groups of participants are identified as a ‘cohort’ (based on whether they have or have not been exposed to a certain intervention or situation) and then followed prospectively over time to see what happens to them.
• In a retrospective cohort study, the cohorts are defined from a previous point in time and the information is collected (for example, from past records) about the outcome(s) of interest. Participants are not followed up in the future to see what happens to them, as happens in a prospective cohort study.
Hierarchy of evidence for questions about patients' experiences and concerns
Questions about patients' experiences and concerns are answered using qualitative evidence. The various qualitative research methodologies are explained in depth in Chapter 10. There is currently no universally agreed-upon hierarchy of evidence for study types that seek to answer questions about patients' experiences and concerns.
Internal validity: what have bias and confoundinggot to do with evidence-based practice?
Internal validity and external validity
As we saw in Chapter 1 when the process of evidence-based practice was explained, when reading a research study you need to know whether you can believe the results of the study. Internal validity refers to whether the evidence is trustworthy. That is, are the conclusions that the authors have stated for that particular study valid? Can we be sure that the association or effect found is not really due to some other factor? Three common alternative explanations that must be considered for the association or effect that is found in a study are: (1) chance, (2) bias and (3) confounding. We now look at each of these in turn. But first we need to briefly explain what external validity is so that you do not confuse it with internal validity. External validity refers to the generalisability of the results of a study. That is, to what extent can we apply the results of the study to people other than the participants of the study?
Chance
One possible explanation for a study's results is that any findings of differences between two groups are due to random variation. Random variation in data collected during research means that differences occur by chance alone. As we explain later in this chapter, determining whether findings are due to chance is a key feature of statistical analysis (hypothesis testing). Random variation is smaller when the sample size (that is, the number of participants or, more properly, the number of events) of the study is adequate. This is discussed in more detail later in the chapter.
Bias
Bias can be likened to the characteristic of lawn bowls which leads the bowl to roll in a curve. Although this characteristic of lawn bowls to ‘not run true’ (that is, not in a straight line) is useful in the game of bowls, it is a problem in study design. We use the term bias for any effect that prevents the study conclusions from running true. Whereas chance is caused by random variation, bias is caused by systematic variation. Bias is a systematic error in the way that participants are selected for a study, outcomes are measured or data are analysed which, in turn, leads to inaccurate results.
Biases can operate in either direction—to underestimate or overestimate an effect reported in a study. Consider an example of a randomised controlled trial of the effectiveness of a new intervention for back pain. If the participants allocated to the new intervention had more-severe symptoms (that is, had more back pain) at the start of the trial than the participants allocated to the control group, any differences at the end of the study might be the result of that initial difference rather than the effect of the new intervention. This bias is then called ‘allocation bias’—the bias introduced by how participants were allocated to the two groups which creates initial differences that then undermine our confidence in any apparent effect.
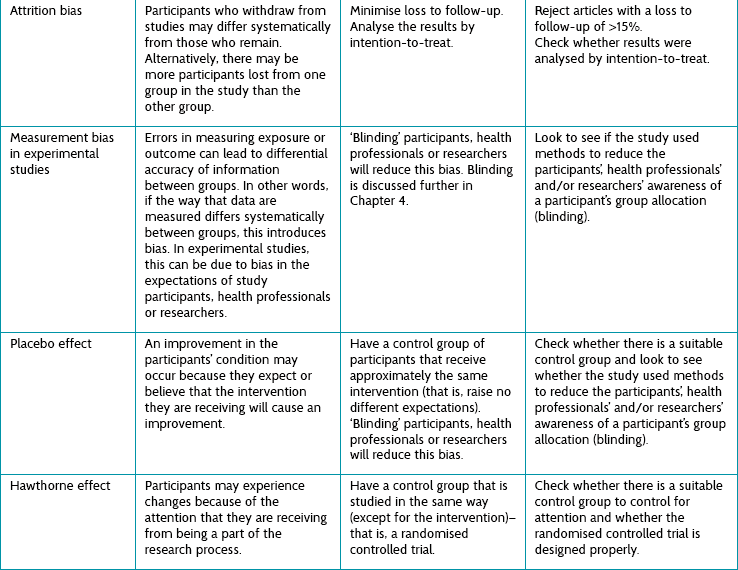
There are dozens of other kinds of bias, and we need to be able to look for and recognise them. Table 2.6 briefly describes some of the common kinds of bias that can occur. Some are relevant to non-randomised studies and some to randomised studies. Chapter 4 discusses the biases that can occur in randomised controlled trials in more detail.
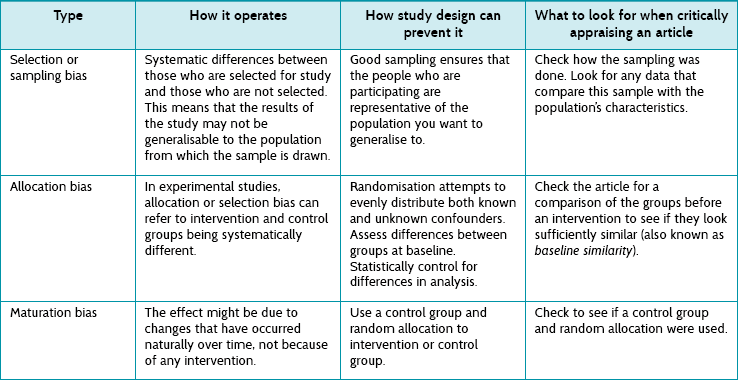
Assessing whether bias has occurred in a study is the main focus of the first step (Is the evidence valid?) in the three-step critical appraisal process that was described in Chapter 1. Being able to assess whether the evidence is valid is a key skill needed by those who wish to practise evidence-based practice. As such, this topic is given a lot of attention in this book, primarily in Chapters 4, 6, 8, 10 and 12.
Confounding
‘Confound’ comes from the Latin confundere [com- (together) + fundere (to pour)], meaning to confuse. Add another liquid to the pure initial one and it loses its purity. So it is with confounding factors. The factor of interest becomes confused with the confounding factor (the ‘confounder’). In other words, confounding variables are generally variables that are causally associated with the outcome variable under investigation and non-causally associated with the explanatory variable of interest. Confounders do not cause error in measurement; rather, they involve error in the interpretation of what may be an accurate measurement.
In research study design, we want to minimise confounders. For randomised controlled trials, the easiest way of doing this is to randomly allocate participants to groups. The intention is to have confounders spread randomly—and hence evenly—between the groups and not stacked up in one group unfairly. Randomisation will ensure this, provided the sample is large enough (see below). In other study designs, a list of possible confounders is drawn up and either accounted for in the analysis (by stratification or statistical adjustment—‘regression analysis’—methods) or restricted to subgroups. In fact, this is the method employed for observational studies (since there is no other option).
The problem with adjusting for confounders is unknown confounders—factors that we either cannot measure or do not even know about—that could influence the results. For example, participants' level of motivation to participate fully in an intervention (consider one that required people to perform certain exercises daily) is very difficult to measure accurately and could be a potential unknown confounder for a study that was examining the effectiveness of this intervention. Randomisation is the key, because the act of randomisation distributes all confounders, both known and unknown, fairly. A problem remains, though: what about the chance of an unequal distribution of confounders between groups? The answer to that is to do with two things: numbers and statistics.
Statistical significance, clinical significance, and power
Statistical significance
The concern we identified above is that a randomised controlled trial could be biased because of a chance uneven distribution of confounders across the groups. The chance of this happening is reduced if the number of participants in the trial is increased (as the numbers get larger, the chance of unevenness decreases). However large the trial is designed to be, though, the chance of unevenness never decreases to zero. This means that there is always a chance of bias from confounders, so we have to tolerate some uncertainty; less so as the trial size gets larger, until the trial is sufficiently large that we can relax. The question is: how large? The answer comes from statistics, which is the science of dealing with this uncertainty and quantifying it. There are two main ways of deciding whether a difference in the summaries of two groups of participants is due to chance or to a real difference between them.
The p value
The p here is short for ‘probability’. This test is based on one of the cornerstones of scientific philosophy: that we cannot ever prove anything, but rather can only disprove it.14 This means that we have to invert the test from the intuitive, which is:
to
If we can show that the latter statement is unlikely, then we can say that there must be some other factor responsible for the difference. In other words, the p value is estimated to establish ‘how likely it is that the difference is because of chance alone’. Statisticians estimate a value of p that will be somewhere between 1.0 (absolutely sure that the difference is because of chance alone) and 0.0 (absolutely sure that the difference is not because of chance alone). Traditionally we set the arbitrary value of p as <0.05, at which point we assume that chance was so unlikely that we can rule it out as the cause of the difference. A value of 0.05 ( ) is the same as 5% or 1 : 20. What we mean when we use this cut-off point for the p value is: ‘We would have to repeat the study an average of 20 times for the result to happen once by chance alone.’ When a study produces a result where the p value is <0.05, that result is considered to be ‘statistically significant’.
Confidence intervals
Confidence intervals take a different approach, and instead estimate what range of values the true value lies within. True value refers to the population value, not just the estimate of a value that has come from the sample of one study (such as an estimate about how effective an intervention is)—this is explained in more depth in Chapter 4. The range of values is called the confidence interval, and is most commonly set at the same arbitrary level as p values (0.95, or 20 : 1), which is also called the 95% confidence interval. Another way to think of the value is graphically, as shown in Figure 2.3.
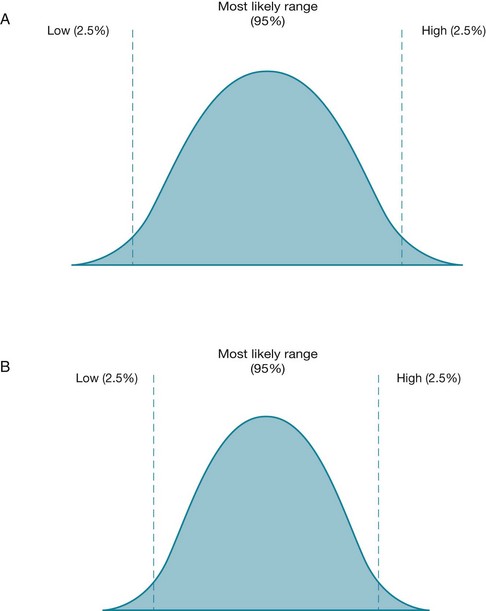
Figure 2.3 For two different studies, the range of possible values for an estimated measurement (with the 95% confidence interval) is shown. In the study represented by figure B, the 95% confidence interval is smaller (narrower) than the one in figure A. A smaller confidence interval can occur when the sample size of a study is larger.
Figure 2.3 shows the range of possible values for an estimated measurement for two different studies, A and B. In each figure the two vertical lines indicate the two limits (or boundaries) of the confidence interval. The values in between these lines indicate the range of values within which we are 95% certain (or confident, hence the term confidence intervals) that the true value is likely to lie. The probability that the true value lies outside of this confidence interval is 0.05 (or 5%), with half of this value (2.5%) lying in each tail of the curve. The most likely value is central and, in most cases, the distribution of possible values forms a normal distribution (that is, a bell-shaped curve). The spread of values will form a different shape according to different influences on the 95% confidence interval. For example, in the study that is represented by Figure 2.3B, the sample size is larger. This has the effect of narrowing the 95% confidence interval because the normal curve is more peaked. The same effect is achieved by samples that yield greater uniformity of the participants (that is, decreased variance of the sample). This is summarised in Table 2.7.
TABLE 2.7:
Effect of sample size and variance on a study's confidence interval
| Factor | Effect on the confidence interval |
| Sample size (the number of participants in the study) | The confidence interval narrows as the sample size increases—there is more certainty about the effect estimate. This is one of the reasons why it is important that studies have an adequate sample size. The importance of a smaller (narrower) confidence interval is explained in Chapter 4. |
| Variance (the amount of ‘noise’ or differences in values between participants in the sample) | The confidence interval widens as the variance increases—there is less certainty about the effect estimate. |
Confidence intervals are an important concept to understand if you wish to use evidence-based practice, as they help you with the second step (What is the impact of the evidence?) of the three-step critical appraisal process described in Chapter 1. The role that confidence intervals play in helping you to determine the impact of the evidence is explained in more detail in Chapter 4.
Clinical versus statistical significance
There is one more essential consideration: how big a difference is worthwhile? Once we have established a difference that is unlikely to be attributable to chance (that is, it is statistically significant), how can we decide whether the difference is important? Clinical significance is defined as just that: the minimum difference that would be important to patients. (Because of this, some people use the term ‘clinical importance’ rather than ‘clinical significance’ to refer to this concept.)
We cannot use statistics to measure clinical significance because it is a judgment: we have to decide what difference would be important (meaning, would change clinical practice). This means choosing some difference based on what is clinically important. Such differences are called ‘clinically significant’. For example, consider an intervention study where the outcome being measured was pain, using a visual analogue scale (a straight line with one end meaning ‘no pain’ and the other end meaning ‘the most pain imaginable’). If the intervention had the effect of reducing participants' pain (on average) by 4 points on a 10-point visual analogue scale (where 1 = ‘no pain’ and 10 = ‘the most pain imaginable’), we would probably judge a difference of this size to be clinically significant; whereas a reduction of 0.5 would probably not be considered clinically significant. Chapter 4 discusses in further detail the various approaches that can be used to help determine clinical significance.
Hopefully it is now clear that there are three main categories that the results of a study can fall into:
• a result that is not statistically significant—when this is the case, you do not need to bother deciding whether the result is clinically significant as you cannot even be very sure that the result was not due to chance.
• a result that is statistically significant but not clinically significant. This is, unfortunately, a common scenario and regrettably means that the difference is not large enough to be important (even though it is a ‘real’ not-by-chance difference).
• a result that is statistically significant and clinically significant—this is the type of result that is clear: there is a real and meaningful difference that can potentially inform our clinical practice and we can proceed to the third step in the three-step critical appraisal process—deciding whether you can apply the evidence to your patient.
Outcome measures—what you need to know about them
The issue of clinical significance raises another issue that is important when it comes to appraising articles—you need to know about the outcome measure that a study used, as this helps you to make a judgment about clinical significance. In our pain study example above, if the visual analogue scale that was used to measure pain was a 0–100 scale, then we would probably no longer consider a reduction in pain of 4 points (on a 100-point scale) to be clinically significant (although on a 10-point scale, we felt that it was). If you are lucky, the study that you are reading will include the scale range of the continuous outcome measures used in the study somewhere in the article (usually in the methods section or in a results table). If they do not, then you will need to find this information out for yourself. If it is an outcome measure that you are familiar with, great! If not, perhaps searching for it on the internet (even Google can be useful in this instance) may help you to find out more about it.
In addition to knowing about the actual measures used in a study to measure the outcomes, it is important that you consider whether the outcomes themselves are relevant, useful and important to your patient. An example is a patient who has had a stroke and, as a result, has difficulty using their arm to perform functional activities such as eating and getting dressed. The patient's goal is to return to doing these activities independently. You are considering using a physical rehabilitation technique on them to improve their ability to carry out these activities, primarily by working on the quality of the movement that they have in their affected arm. Let us suppose that when evaluating the evidence for the effectiveness of this intervention, there are two studies that you can use to inform your practice (for the sake of simplicity, we will assume that they both have a similar level of internal validity). The outcomes measured in one study (study A) are arm function and the ability to perform self-care activities, whereas the outcome measured in the other study (study B) is quality of arm movement. In this (very simplified!) example, if you choose study A to inform your clinical practice you will be able to communicate the results of the study to the patient and explain to them the estimated effect that the intervention may have on their ability to perform these activities. Remember that this is what your patient primarily wants to know. Although study B may provide you with information that is useful to you as a health professional, the effect that the intervention may have on the quality of arm movement may be of less interest to your patient than knowing how it may improve the function of their arm. Considering whether the outcomes measured by a study are useful to your patient is one way of considering the patient-centredness of the study. In Chapter 14, the concept of patient-centred care is explained and the importance of encouraging patients' involvement in decisions about their health care is discussed.
Putting it all together: thinking about power
As we mentioned earlier, we can have results that are statistically significant but not clinically significant. But statistical significance can be made more likely by increasing the size of the sample (or reducing the ‘noise’, more properly called ‘variance’). If a study is large enough, its results will become statistically significant even though the differences are not important clinically—which is why we call on clinical significance to decide what is worthwhile. This means we can decide on the minimum size a study's sample has to be to give a definitive answer. This is important because it helps decide what would be wasteful (above the minimum is wasteful of research resources).
Estimating the minimum is called a ‘power calculation’. A study has enough power (meaning that there is a large enough sample) if a statistically significant difference is found. In other words, the power of a study is the degree to which we are certain that, if we conclude that a difference does not exist, that it in fact does not exist. The accepted level of power is generally set at the arbitrary level of 80% (or 0.80).
What happens if the minimum sample size is not reached? Such a study is called ‘underpowered’, meaning that if a non-significant difference was found, it might nevertheless correspond to a truly clinically significant difference but this was something that was not detected because the sample was too small. In other words, a non-significant result might mean either that there is truly no difference or that the sample was too small to detect one. This state of affairs, where a study has incorrectly concluded that a difference does not exist, is also called a type-2 error. Because of the risk of this type of error occurring, when evaluating a study you need to decide whether the study had adequate power (that is, a large enough sample size). This can be determined by checking an article to see if the researchers did a power calculation. Researchers do a power analysis prior to conducting the study because it enables them to estimate how many participants they will need to recruit to be reasonably sure (to a given level of uncertainty) that they will detect an important difference if it really exists. You can then check if they actually did recruit at least as many participants as they estimated would be needed.
Can a study be too large? Surprisingly, the answer is yes. If a study is too large, then effort and money have been wasted in undertaking research unnecessarily. A more subtle reason is that a difference that is statistically significant can be found, but the difference may be so small that we judge its significance to not be meaningful. This can mean having a situation that we discussed earlier in this chapter, where a difference is statistically significant but clinically not significant.
References
1. Bastian, H, Glasziou, P, Chalmers, I. Seventy-five trials and eleven systematic reviews a day: how will we ever keep up? PLoS Med. 2010; 7:e1000326.
2. Shirky C. It's not information overload. It's filter failure. Title of talk, Web 2.0 Expo, New York, 2008.
3. Hoffmann, T, Erueti, C, Thorning, S, et al. The scatter of research: a cross-sectional comparison of randomised trials and systematic reviews across specialties. BMJ. 2012; e3223. [doi: 10.1136/bmj.e3223].
4. Ely, J, Osheroff, J, Ebell, M, et al. Analysis of questions asked by family doctors regarding patient care. BMJ. 1999; 319:358–361.
5. Gonzalez-Gonzalez, A, Dawes, M, Sanchez-Mateos, J, et al. Information needs and information-seeking behaviour of primary care physicians. Ann Fam Med. 2007; 5:345–352.
6. Gorman, P, Helfand, M. Information seeking in primary care: how physicians choose which clinical questions to pursue and which to leave unanswered. Med Decis Making. 1995; 15:113–119.
7. Cogdill, K. Information needs and information seeking in primary care: a study of nurse practitioners. J Med Libr Assoc. 2003; 91:203–215.
8. Coumou, H, Meijman, F. How do primary care physicians seek answers to clinical questions? A literature review. JAMA. 2006; 94:55–60.
9. McGowan, J, Hogg, W, Campbell, C, et al. Just-in-time information improved decision-making in primary care: a randomised controlled trial. PLoS ONE. 2008; 3:e3785.
10. Straus, S, Richardson, W, Glasziou, P, et al. Evidence-based medicine: how to practice and teach EBM, 4th ed. Edinburgh: Churchill Livingstone; 2011.
11. Crawford, MH, DiMarco, JP, Paulus, WJ. Cardiology, 3rd ed. Philadelphia: Mosby; 2010.
12. Guyatt, G, Keller, J, Jaeschke, R, et al. The n-of-1 randomised controlled trial: clinical usefulness. Our three-year experience. Ann Intern Med. 1990; 112:293–299.
13. National Health and Medical Research Council (NHMRC), NHMRC additional levels of evidence and grades for recommendations for developers of guidelines. NHMRC, Canberra, 2009. Online Available www.nhmrc.gov.au/_files_nhmrc/file/guidelines/developers/nhmrc_levels_grades_evidence_120423.pdf [11 Mar 2012].
14. Hacking, I. An introduction to probability and inductive logic, 1st ed. New York: Cambridge University Press; 2001.