Conditions Involving Inflammatory Changes of Bowel
In the sections that follow, we discuss three important diagnoses involving inflammatory changes of bowel: appendicitis, diverticulitis, and inflammatory bowel disease (including ulcerative colitis and Crohn’s disease). X-ray is typically not helpful in the diagnosis of conditions involving bowel inflammation, because it does not directly visualize bowel inflammation and lacks sensitivity and specificity for these diseases. CT has become the most commonly applied emergency department modality for these conditions, although ultrasound plays an important role in the diagnosis of appendicitis in children and pregnant women.
Appendicitis
Figures 9-51 through 9-57 demonstrate imaging findings of appendicitis. Suspected appendicitis remains a key reason to obtain abdominal imaging. It also is a focus for many controversies in abdominal imaging, ranging from the need for or benefit from imaging of any form, to the value of contrast agents, to the optimal imaging modality. Appendicitis is one of the most intensively researched areas in emergency diagnostic imaging, yet questions remain. We divide our discussion into several sections. First, we present a simplified explanation about the potential use of a variety of common image modalities, avoiding areas of debate. Next, we ask a series of clinically oriented questions and examine the evidence available to answer these more controversial issues.
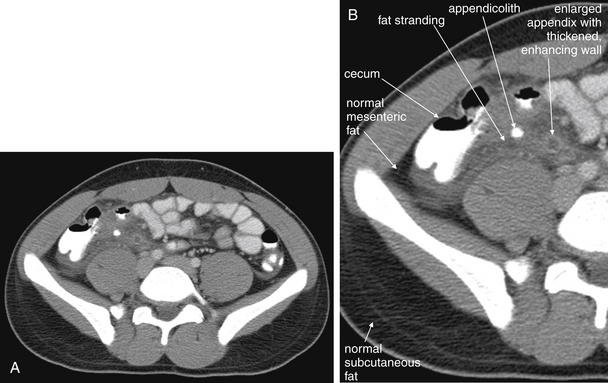
Figure 9-51 Appendicitis, CT with IV and oral contrast.
This CT demonstrates classic findings of appendicitis in an 18-year-old male with right lower quadrant pain, as seen with CT with IV and oral contrast. Studies suggest that CT without contrast has similar sensitivity and specificity. An enlarged appendix is seen near the cecum as a right lower quadrant tubular structure in short-axis cross section, giving it a circular appearance. The surrounding fat shows stranding, a smoky appearance, indicating inflammation (compare with normal mesenteric and subcutaneous fat, which is nearly black). The appendiceal wall shows enhancement, a brightening after administration of IV contrast. This slice also shows an appendicolith, an occasional finding of appendicitis. It does not appear to be within the appendix in this slice, because the appendix bends in and out of the plane of this slice. An appendicolith usually appears as a calcified (white) rounded structure—visible without any contrast. A, Axial CT image. B, Close-up.Figure 9-52 demonstrates the appendix in long-axis cross section as it emerges from the cecum.
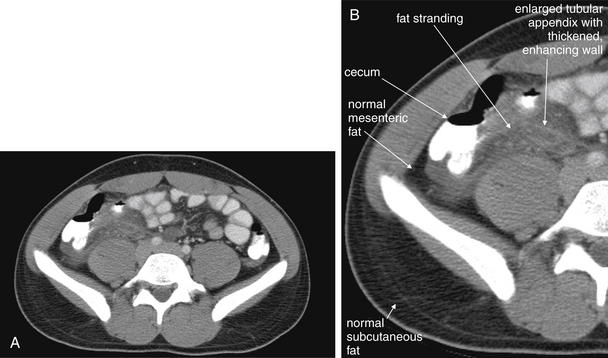
Figure 9-52 Appendicitis, CT with IV and oral contrast.
Compare with Figure 9-51 showing the same appendix in short-axis cross section, with a circular appearance. When considering appendicitis, search carefully for either the circular cross section or the tubular profile, because the appearance depends on the orientation of the appendix relative to the slice. When perpendicular to the slice, the appendix appears circular. When oriented parallel to the plane of the slice, the appendix appears tubular. A, Axial CT image. B, Close-up.
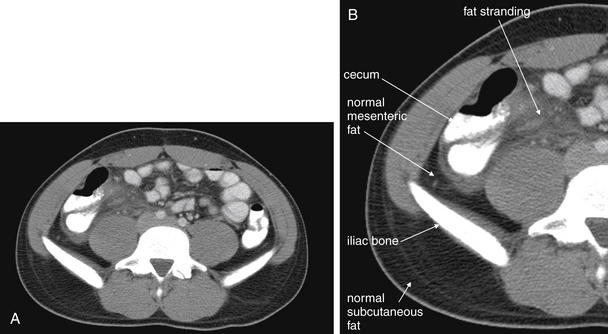
Figure 9-53 Appendicitis, CT with IV and oral contrast.
Same patient as Figures 9-51 and 9-52. This CT slice is taken slightly cephalad to the prior two slices and shows fat stranding in the right lower quadrant. The appendix itself is not visible in this slice. Note the smoky gray appearance of mesenteric fat medial to the cecum, compared with the nearly black appearance of normal mesenteric and subcutaneous fat. Fat stranding should alert you to the possibility of appendicitis, even if the appendix itself is not visible. Orient yourself to your location: the iliac wings of the pelvis are visible, and the cecum is present in the right abdomen. Remember that fat stranding is a finding of inflammation, not of appendicitis specifically. Other diagnoses, such as cecal diverticulitis, colitis, and terminal ileitis, might cause right lower quadrant fat stranding. Occasionally, appendicitis can occur without significant fat stranding, so examine the CT carefully for the appendix. A, Axial CT image. B, Close-up.
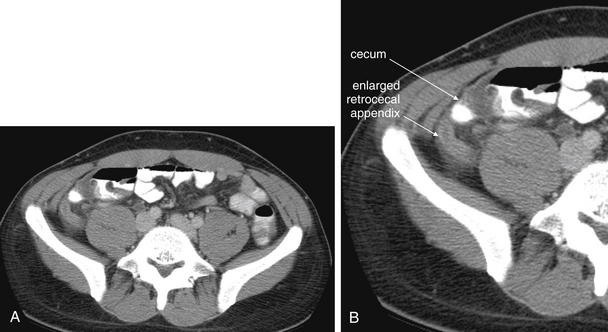
Figure 9-54 Appendicitis, CT with IV and oral contrast.
This patient with appendicitis has a retrocecal appendix, located deep to the cecum and lateral to the psoas muscle. This slice captures the appendix in long-axis cross section, with its enlarged (>6 mm), tubular shape and thickened, enhancing wall. On this slice, less fat stranding is visible than in the previous figures, though stranding is visible on careful inspection. A, Axial image. B, Close-up.Remember that the appendix can have many orientations relative to the cecum, so the region anterior, posterior, medial, and lateral to the cecum must be inspected.
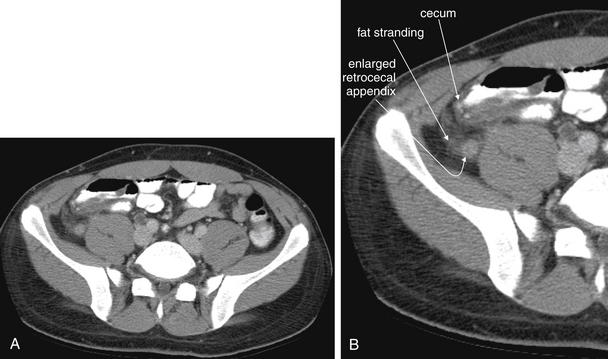
Figure 9-55 Appendicitis, CT with IV and oral contrast.
Same patient as Figure 9-54. This slice captures the appendix in short-axis cross section, with an enlarged (>6 mm), circular shape and thickened, enhancing wall. Compare with the tubular appearance seen in Figure 9-54, seen two slices away in the same patient. On this slice, fat stranding is visible. A, Axial image. B, Close-up.
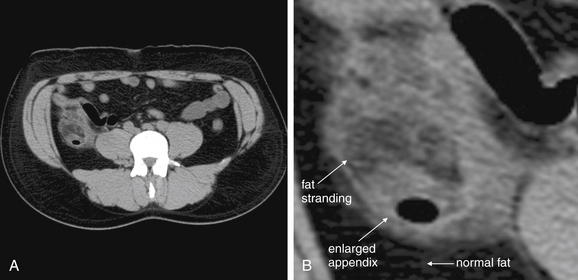
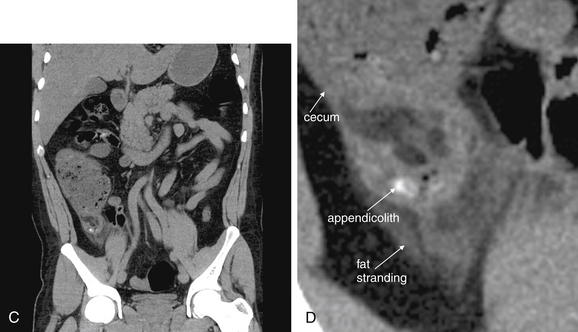
Figure 9-56 Appendicitis, noncontrast CT, soft-tissue window.
This 34-year-old male complained of periumbilical pain and right flank pain. Noncontrast CT was performed following a typical protocol for renal stone diagnosis.
A, An axial CT slice shows an enlarged appendix with surrounding fat stranding. B, Close-up.C, Coronal reconstruction shows similar findings. Dense material within the appendix may represent an appendicolith—one was identified by the pathologist after appendectomy. D, Close-up.
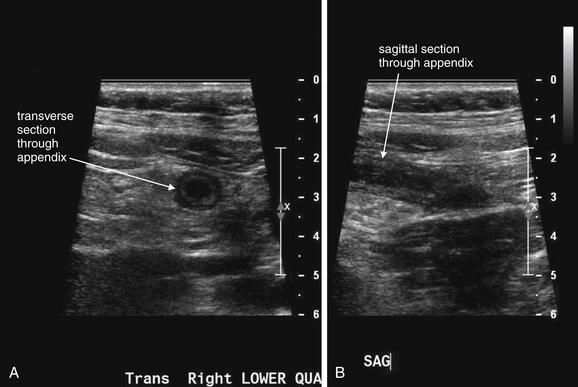
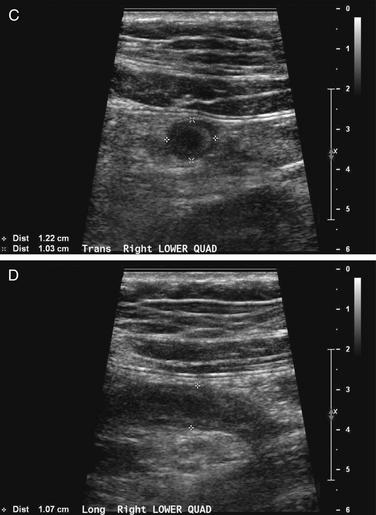
Figure 9-57 Appendicitis, ultrasound.
Ultrasound is an alternative diagnostic imaging modality to CT for appendicitis. Unlike CT scan, ultrasound exposes the patient to no ionizing radiation, and it has been advocated as the first-line imaging modality in children, pregnant women, and thin adults. The appendix may be difficult to visualize in obese patients using ultrasound. Abnormal findings include a tubular structure exceeding 6 mm in diameter in the right lower quadrant, as well as right lower quadrant fluid collection that may indicate perforation and abscess formation. Hyperemia of the appendix may also be documented with Doppler technique. If the appendix is seen and tenderness is elicited by palpation with the ultrasound probe, this finding is the analogue of the sonographic Murphy’s sign and may increase diagnostic specificity. Enlarged right lower quadrant lymph nodes may simulate appendicitis but should be distinguished on careful examination from the more tubular appendix. Ultrasound is reported to have lower sensitivity than CT but high specificity, so it can be used to rule in disease but not to rule out appendicitis. If the appendix is not clearly visualized, evaluation for appendicitis should continue with CT scan, clinical observation, or other strategies such as laparoscopy.This ultrasound shows a tubular right lower quadrant structure in transverse (short-axis, A, C) and sagittal (long-axis, B, D) cross sections. This structure is over 1 cm in diameter, concerning for appendicitis. The patient was 14 weeks pregnant at the time and underwent laparoscopic appendectomy that confirmed the ultrasound diagnosis.
X-ray for Appendicitis
X-rays were a common historical starting point for evaluation of appendicitis, but they have little diagnostic value and should generally be avoided. The classic x-ray findings of appendicitis include a radiodensity in the right lower quadrant, called an appendicolith. Yet this is found on x-ray in fewer than 20% of cases of appendicitis.130 Multiple studies have shown a low diagnostic yield for x-ray. Other findings sometimes seen on x-ray include obscuration of the normal right psoas muscle and properitoneal fat interface, presumably because of periappendiceal inflammation, but these are seen with equal frequency in patients with and without appendicitis and therefore have no discriminatory value.131 Rao et al.132 reviewed 821 consecutive patients hospitalized for suspected appendicitis, 78% of whom underwent x-ray. Radiographic abnormalities were seen in 51% of patients with appendicitis and 47% of those without appendicitis, with no radiographic finding being sensitive or specific. Even in the 10% of cases in which the x-ray suggested a specific condition, these failed to match the final diagnosis in 57%. Although the cost of x-ray was low ($67), the utility was so low that the cost per specific diagnosis was $1593, exceeding the cost for CT ($270).
One important reason for the lack of utility of x-ray is that treatment of appendicitis has evolved from open appendectomy to laparoscopic appendectomy for uncomplicated cases and frequent percutaneous drainage with antibiotic therapy in cases with complications such as loculated abscess. Even in the minority of cases in which x-ray findings of appendicolith support the diagnosis of appendicitis, x-ray does not provide additional information relevant to modern management strategies.
Barium Enema for Appendicitis
Before the advent of CT, barium enema was used periodically in assessment of appendicitis. Although a mass effect on the cecum and nonfilling of the appendix were described as diagnostic of appendicitis, these findings can be seen in nonsurgical disease processes such as small-bowel obstruction, enterocolitis, pelvic adhesions, and pelvic inflammatory disease.133 Barium enema is generally no longer indicated for diagnosis of appendicitis. The ACR rates contrast enema as two or three (meaning “usually not appropriate”) out of nine on its appropriateness scale, depending on the clinical scenario.134
Computed Tomography for Appendicitis
Despite intense research into CT for appendicitis, many controversies remain, which we address in the text that follows:
What Is the Sensitivity of Computed Tomography for Appendicitis?
CT is given the highest rating by the ACR in its appropriateness criteria, for evaluation of adults with suspected appendicitis. CT is suggested as possibly appropriate by the ACR following negative or equivocal ultrasound in children and pregnant women.134 There is little doubt that CT is a sensitive and specific imaging modality for appendicitis, capable of identifying alternative diagnoses and complications including perforation and abscess formation. A metaanalysis of prospective studies comparing CT and ultrasound found CT to be 94% sensitive and 95% specific.135. Another systematic review of 23 studies found CT to be highly sensitive and specific, with or without oral contrast. The range of reported sensitivity is 83% to 97%, and for specificity the range is 93% to 98%.32
Computed Tomography Findings of Appendicitis
On CT scan, the normal appendix is a narrow tubular structure emerging from the cecum. It may occupy many different positions: descending into the pelvis, projecting medially or laterally from the cecum, or lying retrocecally. The upper limit of size of the normal appendix is 6 mm. The wall thickness is generally less than 1 mm.136 The normal appendix may contain air or enteral contrast, but a calcified appendicolith is not normally present. The pericecal and periappendiceal fat normally show no inflammatory stranding or free fluid. These normal findings naturally give rise to criteria to identify an abnormal appendix.
An abnormal appendix is enlarged in cross-sectional diameter, is thick walled, and may contain an appendicolith. The surrounding fat often shows inflammatory stranding, a brightened appearance discussed earlier in this chapter. Free fluid may be present adjacent to the appendix or in dependent portions of the abdomen and pelvis. Air may be observed outside of the lumen of the appendix if perforation has occurred. An abscess or inflammatory phlegmon may be present in cases of perforation. The difference between true abscess and phlegmon is one of degree; an abscess typically has discrete borders and is fluid filled, whereas a phlegmon represents inflamed tissues without discrete abscess and may have less well-delineated margins.137 All of these findings are potentially visible without the administration of any contrast agents. Enteral contrast (oral or rectal) theoretically might improve the diagnosis of appendicitis in several ways. First, by filling the cecum and terminal ileum with contrast, the bowel lumen is identified and can be discriminated from a fluid- and air-filled abscess. Second, a normal appendix might be expected to fill with enteral contrast, whereas an obstructed or edematous appendix might not. IV contrast might be expected to improve the diagnosis of appendicitis as well. In the presence of appendicitis, the appendix shows abnormally high enhancement with IV contrast, drawing attention to the appendix, which can be difficult to identify because of its small size and variable position. IV contrast may also cause rim enhancement of a periappendiceal abscess. The evidence for and against contrast is discussed later in this section. Table 9-7 lists CT findings of appendicitis with their reported sensitivity and specificity. Figures 9-51 through 9-56 demonstrate CT findings of appendicitis.
Table 9-7 Findings of Appendicitis Using Computed Tomography With Intravenous Contrast∗
| CT Sign | Sensitivity | Specificity |
|---|---|---|
| Abscess | 9% | 93% |
| Appendiceal intraluminal air | 21% | 66% |
| Appendiceal wall enhancement | 75% | 85% |
| Appendiceal wall thickening | 66% | 96% |
| Appendicolith | 16% | 100% |
| Enlarged appendix (>6 mm diameter) | 93% | 92% |
| Extraluminal air | 8% | 97%137 |
| Extraluminal fluid | 17% | 78% |
| Focal cecal apical thickening | 17% | 100% |
| Intramural air | 4% | 100% |
| Lymphadenopathy | 41% | 58% |
| No identification of the appendix† | 7% | 98% |
| Periappendiceal fat stranding | 87% | 74% |
| Phlegmon | 7% | 99% |
| Segmental colonic wall thickening | 1% | 87 |
| Segmental terminal ileal wall thickening | 6% | 81 |
Sensitivity and specificity are given for the most discriminatory CT findings.
Adapted from Choi D, Park H, Lee YR, et al: The most useful findings for diagnosing acute appendicitis on contrast-enhanced helical CT. Acta Radiol 44:574-582, 2003.∗Darkened rows indicate findings that are neither sensitive nor specific and therefore should not be used to rule-in or rule-out appendicitis.†Subsequent publications suggest that failure to identify the appendix is not pathological when all other CT findings are normal.
Because the appendix can be present in a variety of locations and with a variable course, images should be inspected for different cross-sectional appearances. In one study, the appendix was located more than 5 cm from McBurney’s point in 36% of cases.138 On axial slices, the cecum should be identified first, because the appendix arises from this structure. The cecum should be a large blind pouch filled with air (black) and stool (intermediate gray), located in the right lower quadrant. In most patients, the cecum lies near the level of the iliac crest. Another means of locating the cecum is to identify the ascending colon in the right upper quadrant medial to the liver and to follow the cecum through consecutive caudad slices until it terminates in the right lower quadrant. Three common appearances of the appendix occur on axial slices, depending on the orientation of the appendix relative to the axial plane. If the appendix is perpendicular to the axial plane, it will appear circular in cross section. If it is oriented parallel to the axial plane, it will appear tubular. And if the appendix is oriented obliquely to the axial plane, it will appear elliptic in cross section. Coronal imaging planes can assist in identification of an appendix not identified on axial planes.
Once the appendix is identified, it should be inspected for pathologic changes of appendicitis. The diameter should be measured; a diameter exceeding 6 mm is consistent with appendicitis. The wall thickness should be measured; a thickness greater than 1 mm suggests appendicitis.136 If IV contrast has been administered, the appendiceal wall should be brighter than other normal bowel wall or the nearby psoas muscle. The presence of an intraappendiceal radiodensity (bright white on a soft-tissue CT window) is consistent with appendicolith, although its presence does not prove that the appendix is actively inflamed, in the absence of other findings. The fat surrounding the appendix should be inspected for stranding; comparison with fat in other locations, such as subcutaneous fat or remote intra peritoneal or retroperitoneal fat, may assist in recognition of subtle stranding. Normal fat should appear quite dark and homogeneous. Extremely thin patients with little intraperitoneal fat can present a diagnostic challenge, because they have no substrate for inflammatory fat stranding. Adjacent extraluminal air, free fluid, or abscess should be noted. We devised the mnemonic SCALPEL (Table 9-8) to guide assessment of the appendix for changes suggesting appendicitis.
Table 9-8 CT Findings of Appendicitis: SCALPEL Mnemonic
| Term | Description |
|---|---|
| Stranding | Fat stranding suggests regional inflammation, possibly because of appendicitis. |
| Cecum | The appendix originates from the cecum, which should be identified first to help localize the appendix. The cecum may show wall thickening, suggesting appendicitis. |
| Air | Air outside of the lumen of the appendix is pathologic and suggests perforation. Air within the appendiceal wall is also abnormal. |
| Large | The normal appendix is <6 mm; an enlarged appendix >6 mm suggests appendicitis. Wall thickening >1 mm also suggests appendicitis. |
| Phlegmon | Inflammatory changes surrounding the appendix suggest a perforated appendix. A heterogeneous collection called a phlegmon may be seen. If the appendix has ruptured, a pericecal phlegmon may be the only remaining evidence, because the appendix itself may not be seen. |
| Enhancement | The wall of an abnormal appendix enhances with IV contrast and appears brighter than the normal bowel or the normal psoas muscle. |
| Lith | An appendicolith is a calcified stone sometimes found in the lumen of an inflamed appendix. |
Ultrasound for Appendicitis
Ultrasound is a common alternative diagnostic modality to CT scan for appendicitis. Advantages of ultrasound include portability, the absence of any exposure to ionizing radiation (a major concern with CT, especially in children, young adults, and pregnant women), and the absence of need for oral or injected contrast agents. Ultrasound disadvantages include operator dependence (a term used to describe the variable diagnostic performance of ultrasound in the hands of ultrasonographers of varying skill and experience) and limited ability to visualize the appendix in patients with significant fat stores or overlying bowel gas. Ultrasound is generally found to be quite specific (~93%-94% in multiple studies) but relatively insensitive (83%-88%) (Table 9-9).135,139-141 In patients without appendicitis, the normal appendix can be difficult to identify, with as few as 2.4% of normal appendixes found in one study.142
Table 9-9 Sensitivity and Specificity of Ultrasound for Appendicitis, Compared With Computed Tomography
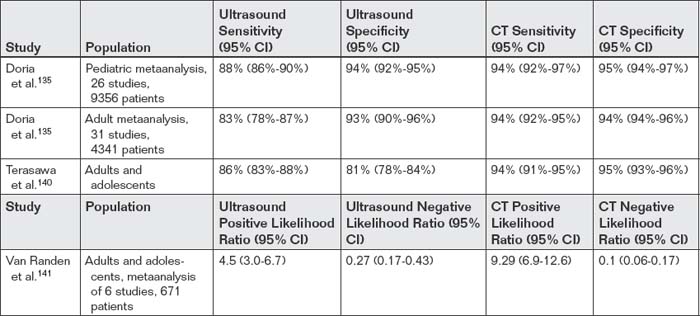
Van Randen et al.141 performed a metaanalysis of studies that compared CT and ultrasound in the same population and found that CT performed more accurately, though the performance of both tests was quite dependent on the prevalence of disease. In patients with low pretest probability and a positive ultrasound or CT, the possibility of a false-positive test should be considered. Overall, CT had a positive likelihood ratio of 9.29, indicating a high probability of appendicitis with a positive CT. Ultrasound had a positive likelihood ratio of only 4.5, which may not be adequate to rule in disease in cases of low pretest probability (recall that a positive likelihood ratio greater than 10 is generally felt to increase the probability of disease to a clinically actionable level). Negative likelihood ratios for CT and ultrasound were 0.1 and 0.27, respectively. Recall that a negative likelihood ratio less than 0.1 is felt to exclude disease with a high degree of certainty, except in cases of very high pretest probability. Thus a negative CT rules out appendicitis in most patients, whereas a negative ultrasound does not.
Multiple authors have proposed the following use of ultrasound. In patients in whom appendicitis is clinically suspected but additional confirmation is desired, ultrasound should be the first diagnostic imaging test performed. If ultrasound confirms appendicitis, no further imaging may be required because of high specificity. If ultrasound does not confirm appendicitis, CT may be required, as a result of the poor sensitivity of ultrasound. Target populations in whom ultrasound use as the first diagnostic test should be encouraged are young patients and pregnant patients, arising from concerns about radiation exposures from CT. Thin patients of any age may be reasonable candidates for ultrasound. Conversely, ultrasound is likely to be nondiagnostic in obese patients, and CT may more reasonably be the first test. In older adults and the elderly, in whom radiation exposures from CT are of little concern and in whom multiple other serious abdominal conditions may be present, CT may be the more appropriate initial test.
Ultrasound for appendicitis is a focused examination. The examiner inspects the right lower quadrant, often starting with the location of tenderness identified by the patient. An abnormal appendix exceeds 6 mm in diameter and is incompressible. Sometimes a hypoechoic or heterogeneously echoic fluid collection representing abscess may also be identified. A normal appendix may be difficult to identify because of its small size. Figure 9-57 demonstrates ultrasound findings of appendicitis.
Magnetic Resonance Imaging for Appendicitis
MRI represents a third option for imaging of suspected appendicitis. MRI is generally not a first-line test because of expense and limited availability but is useful in patients with equivocal results of other modalities or in patients in whom radiation exposures are a particular concern, such as children and pregnant females. The normal appendix on MRI is less than or equal to 6 mm in diameter and may be filled with air and oral contrast material. MRI findings of appendicitis include an appendiceal diameter greater than 7 mm and the presence of periappendiceal inflammatory changes.143 MRI has high reported sensitivity and specificity. Pedrosa et al.143 reported MRI to be 100% sensitive and 93% specific in a consecutive series of 51 pregnant patients—though only 4 patients in this series had appendicitis. In another study, Pedrosa et al.144 reviewed 148 consecutive pregnant patients evaluated for acute appendicitis, 140 of whom had both ultrasound and MRI. MRI was 100% sensitive (14 of 14) and 93% specific, although the small number of patients in this study results in wide CIs.
Israel et al.145 found MRI to be 100% sensitive and specific for appendicitis when the appendix was visualized, though only four patients with appendicitis were diagnosed by MRI. MRI was unable to identify the appendix in a fifth patient with appendicitis.
Cobben et al.146 found MRI to be 100% sensitive and specific for appendicitis in pregnancy—but in a series of only 12 patients, 3 with appendicitis.
Chabanova et al.147 examined a fast, unenhanced MRI technique in 48 patients and found sensitivity of 83% to 93% and specificity of 50%-83%. This study was not restricted to pregnant patients.
Basaran and Basaran148 performed a systematic review and compared the pooled sensitivity and specificity of CT and MRI, following a nondiagnostic ultrasound in a pregnant patient. CT was 87.5% sensitive and 97.4% specific, whereas MRI was 80% sensitive and 99% specific. Although the studies on MRI in pregnancy are limited, the ACR134 rates MRI as seven on its nine-point appropriateness scale, just below ultrasound (with a score of eight). In children, the ACR gives MRI a rating of five of nine, below both ultrasound (eight of nine) and CT (seven of nine).
Appendicitis Decision Rules
Imaging in suspected appendicitis carries economic costs, radiation exposures (in the case of CT), and potential harms, including adverse effects of IV contrast administration for CT. In patients with acute appendicitis, therapeutic delays while awaiting diagnostic imaging could lead to perforation, with increased morbidity or even mortality. Therefore a clinical decision rule to stratify appendicitis risk could improve imaging utilization with cost, radiation, time, and morbidity benefits. Patients at low risk for appendicitis might require no imaging, only clinical observation for signs of worsening. Patients at high risk might require no imaging but, rather, empiric surgical management. Patients with intermediate risk might represent a group in whom imaging could provide benefit by preventing unnecessary appendectomy, reducing perforation rate, and identifying alternative diagnoses.
Several scoring systems have been proposed, though none are widely accepted at this time. The Alvarado score incorporates elements from the classic history, physical examination, and laboratory abnormalities associated with appendicitis (Table 9-10).149 The mnemonic MANTRELS is sometimes used to indicate the criteria (see Table 9-10). In a retrospective validation study of 150 patients aged 7 or older, an Alvarado score of 7 or higher predicted appendicitis with 100% specificity, whereas a score of 3 or lower ruled out appendicitis without use of imaging (sensitivity = 96.2%). Patients with intermediate Alvarado scores (4-6) required further testing for appendicitis. Further study is required to narrow CIs.150
Table 9-10 Alvarado Score for Appendicitis, Also Known by the MANTRELS Mnemonic149-150
| Criterion | Points |
|---|---|
| Migration of abdominal pain to the right iliac fossa | 1 |
| Anorexia or acetone (ketones) in the urine | 1 |
| Nausea or vomiting | 1 |
| Tenderness to palpation of the right lower quadrant | 2 |
| Rebound tenderness | 1 |
| Elevated temperature (37.3°C) | 1 |
| Leukocytosis, or >10,000 white blood cells per microliter in the serum | 2 |
| Shift to the left (an increase in the percentage of neutrophils in the serum white blood cell count) | 1 |
Alvarado Scores of 3 or lower rule out appendicitis (sensitivity = 96.2%). Scores of 7 or higher rule in appendicitis (specificity = 100%). Scores of 4 to 6 require imaging. This score requires further validation.
Adapted from Alvarado A: A practical score for the early diagnosis of acute appendicitis. Ann Emerg Med 1986;15:557-64; and McKay R, Shepherd J. The use of the clinical scoring system by Alvarado in the decision to perform computed tomography for acute appendicitis in the ED. Am J Emerg Med 25:489-493, 2007.
Other investigators have suggested that the Alvarado score is too nonspecific for clinical use without CT. Kim et al.151 prospectively scored 157 patients using the Alvarado score and a separate clinical impression by an emergency physician, in which patients were judged to have “clinically evident appendicitis” or not. Of 71 patients with clinically evident appendicitis, 19 did not have appendicitis (specificity = 71.6%). Of 52 patients with Alvarado scores greater than or equal to 8 (predicted high likelihood of appendicitis), 14 did not have appendicitis (specificity = 79%). CT was 95.5% specific, leading the authors to suggest that CT should be used even in patients with apparently high pretest probability to prevent negative appendectomy.
The Pediatric Appendicitis Score similarly incorporates classic features of appendicitis to develop a risk assessment (Table 9-11).152 In a validation study of 246 children with a 34% rate of appendicitis, the score performed well in reducing imaging, limiting the negative appendectomy rate, and avoiding missed appendicitis. A score of five or greater detected appendicitis with a sensitivity of 97.6%, meaning that children with scores of four or less need no imaging. A score greater than or equal to eight gave a specificity of 95.1%, indicating a need for appendectomy without imaging. Patients with scores of five to seven required imaging to exclude or confirm appendicitis. Using this rule would have eliminated 41% of imaging, achieved a negative appendectomy rate of 8.8%, and resulted in a missed appendicitis rate of 2.4%.152 Larger studies are required to validate these findings.
Table 9-11 Pediatric Appendicitis Score152
| Criterion | Point Value |
|---|---|
| Right lower quadrant tenderness | 2 |
| Hop tenderness (or tenderness with cough or percussion) | 2 |
| Anorexia | 1 |
| Fever >38°C | 1 |
| Emesis | 1 |
| Pain migration | 1 |
| Leukocytosis >10,000 | 1 |
| Neutrophilia ≥75% neutrophils | 1 |
A score of 4 or less excludes appendicitis (sensitivity = 97.6%, negative predictive value = 97.7%). A score of 8 or more confirms appendicitis (specificity = 95.1%, positive predictive value = 85.2%).
Scores of 5-7 require imaging. This scoring system requires further validation.
Adapted from Bhatt M, Joseph L, Ducharme FM, et al: Prospective validation of the pediatric appendicitis score in a Canadian pediatric emergency department. Acad Emerg Med 16:591-596, 2009.
Birkhahn et al.153 prospectively derived an appendicitis likelihood model in 439 patients. Patients with a white blood cell count of less than 9500 x 109/L and either no right lower quadrant tenderness or a neutrophil count of less than 54% were classified as low likelihood. Patients were classified as high likelihood if they had a white blood cell count greater than 13,000 x 109/L and either rebound tenderness or voluntary guarding with a neutrophil count greater than 82%. The authors suggest that patients with neither high nor low likelihood undergo imaging, whereas patients with high and low likelihood undergo laparotomy and observation, respectively. Compared with actual clinical practice in the study population, use of this model would have reduced the number of missed cases of appendicitis from 10% to 1% and negative laparotomy from 14% to 5.6% while reducing imaging from 71% to 62%. This study was underpowered to prove statistical significance of these findings.
Clinical scoring systems have not yet achieved wide acceptance, partly because of disparate results among studies and lack of broad external validation of studies with promising results.
Imaging Controversies: Does Abdominal CT Reduce the Rate of Negative Appendectomy and Perforation? In Which Patient Populations?
Before the advent of CT and other imaging tests for appendicitis, therapeutic decisions rested on history, physical examination, and laboratory assessment. Lewis et al.154 reviewed 1000 appendectomies performed between 1963 and 1973. The overall negative appendectomy rate was 20%, whereas in women between the ages of 20 and 40 years, the rate was higher than 40%—with more than two thirds of surgeries performed for nonsurgical lesions such as mesenteric adenitis, gastroenteritis, abdominal pain of uncertain cause, and pelvic inflammatory disease. The appendiceal perforation rate in this series was 21%. The benefit of any imaging modality for appendicitis can be measured in terms of reductions in these two rates. Hypothetically, a diagnostic test that delayed surgery might have a negative effect by increasing rupture rates, even if achieving a lower rate of negative appendectomy.
Numerous studies have examined the association of imaging practices, particular CT use, on these two rates. Most studies of this type are retrospective observational studies, often comparing a historical control period without imaging to a later period with high CT utilization rates. In other cases, studies compare outcomes in contemporaneous patient groups, some undergoing imaging and some not, without randomization. Studies of this type measure associations, not causation, but authors often conclude that a causative relationship exists between imaging and patient outcomes. A cause–effect relationship cannot be determined from studies of this type for several reasons. Among the most important, without randomization, patients selected to undergo diagnostic imaging likely differ from patients who are managed without imaging. Patients undergoing imaging may represent more equivocal cases, with atypical histories, ambiguous physical examination findings, and uncertain laboratory results. Patients selected for surgical therapy without imaging, or observation without imaging, likely represent more classically abnormal or normal presentations. Comparing outcomes among these patient categories and attributing the outcomes to the use of imaging ignores these baseline differences. Some studies attempt to account for or even statistically correct for baseline differences, but in reality a randomized controlled trial is required to allow a fair comparison of two diagnostic and treatment strategies. We consider some examples of this type of study here.
Numerous studies have documented the historical rate of negative appendectomy and perforation, correlated these with rising rates of CT utilization, and attempted to draw conclusions about the effect of CT on these important outcomes. Overall, most of these reports suggest a correlation between CT use and reduced rates of negative appendectomy in women of childbearing age, with lesser or no benefit in men or older women. Some studies suggest benefits in older adults. In children, some studies suggest lower rates of negative appendectomy with CT, whereas others suggest no benefit from CT. A handful of studies suggest lower perforation rates with CT use, though others show no difference. Most of the studies we review here (Table 9-12) suffer from the same methodologic flaw: they are not randomized, so patients undergoing CT may differ in important ways from patients not undergoing CT. As a consequence, the differences in outcomes observed between the two groups may have more to do with those initial differences than with the choice of diagnostic strategy. Consider this example before we examine the study findings: Patients with a classic presentation of appendicitis may be relatively unlikely to be subjected to CT by the treating physician, whereas patients with an atypical presentation may be more likely to be subjected to CT or other diagnostic tests. At the same time, classic-presentation patients may be more likely to have appendicitis (and therefore have a low rate of negative appendectomy) compared with patients with atypical presentations (who would therefore have a higher rate of negative appendectomy). If CT prevents unnecessary appendectomy in some patients with atypical presentations, the negative appendectomy rate in this group would decline but might remain equal to or higher than the rate in patients with classical presentations. Using a study design that compares the rates of negative appendectomy in patients with and without CT, it might appear that CT had no effect or benefit—when in truth it might have substantially decreased appendectomy in patients with equivocal presentations. With this in mind, consider some studies on CT and surgical outcomes.
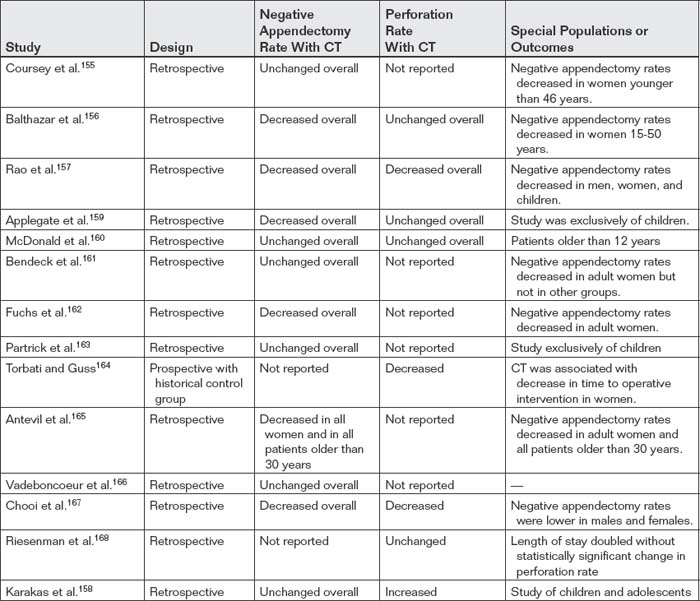
Coursey et al.155 retrospectively reviewed records from 925 patients undergoing appendectomy from 1998 to 2007 and found a dramatic increase in CT use from 18.5% to 93.2%. At the same time, the overall negative appendectomy rate remained unchanged, whereas the negative appendectomy rate fell in women 45 years and younger from 42.9% to 7.1%.
Balthazar et al.156 retrospectively compared negative appendectomy and perforation rates in patients undergoing preoperative CT with historical rates from previous publications. The negative appendectomy rate was 4%, compared with historical rates of 15% to 20%. The perforation rate was 22%, similar to previous publications. In women ages 15 to 50 years, the negative appendectomy rate was 8.3%, with a 19% perforation rate.
Rao et al.157 compared rates of negative appendectomy and perforation from 1992 to 1995 (before introduction of appendiceal CT) and from 1997, when 59% of patients underwent preoperative CT. Before appendiceal CT was introduced, the negative appendectomy rate was 20%, falling to 7% during a period of intensive use of preoperative CT. Perforation rates fell from 22% to 14% during the same period. Negative appendectomy rates fell from 11% to 5% in men, from 35% to 11% in women, from 10% to 5% in boys, and from 18% to 12% in girls. The authors advocated preoperative CT in most female and many male patients.
Karakas et al.158 retrospectively reviewed the charts of 633 children and adolescents with suspected appendicitis, noted an increased risk for perforation in patients undergoing CT, and suggested a causal relationship. However, this retrospective study cannot prove causation, and it may be that patients with perforation are more difficult to diagnose and therefore are more likely to undergo CT than patients with unperforated appendicitis.
Applegate et al.159 retrospectively examined rates of perforation and negative appendectomy in children. Perforation rates were similar with preoperative CT, preoperative ultrasound, and no preoperative imaging. Negative appendectomy rates were lower in patients undergoing CT alone (2%) than in patients with CT with or without prior ultrasound (7%), ultrasound alone (17%), and no imaging (14%).
McDonald et al.160 observed no statistically significant change in negative appendectomy or perforation rates with increasing rates of CT utilization. In a retrospective study, Bendeck et al.161 found the negative appendectomy rate to be significantly decreased, from 28% to 7%, in adult women undergoing CT compared with women undergoing no preoperative imaging, leading the authors to suggest that women undergo preoperative CT when appendicitis is suspected. Negative appendectomy rates were not significantly different in men or male and female children, with or without CT imaging.
In a retrospective review, Fuchs et al.162 noted a negative appendectomy rate of 11.9% in patients undergoing no CT versus 6.3% in patients undergoing preoperative CT. In women, the negative appendectomy rate was 23.5% without CT and 5.3% with preoperative CT.
In a retrospective study in 616 children, Partrick et al.163 noted an increase in preoperative CT utilization from 1.3% in 1997 to 58% in 2001, with a nonsignificant decrease in negative appendectomy from 8% to 7%.
Torbati and Guss164 prospectively observed 310 emergency department adult patients with suspected appendicitis. Patients with “clinically evident appendicitis” did not undergo CT, whereas those with equivocal presentations underwent CT. Comparison with historical controls was performed. In males, the perforation rate fell from 38% in historical controls to 25% with selective use of CT. In females, perforation rate fell from 23% historically to 6% with selective CT. This study also showed a decrease in time to operative intervention of nearly 5 hours in females with selective CT compared with historical controls.
Antevil et al.165 retrospectively reviewed 633 adult patients undergoing appendectomy from 2000 to 2002, subdividing by age and gender. They found an association between CT use and lower rates of negative appendectomy in female patients of all ages and in patients of both genders older than 30 years (23% without CT vs. 8% with CT).
Vadeboncoeur et al.166 compared the rate of negative appendectomy with selective CT use to a historical period before introduction of CT and found no significant difference (13.5% vs. 14.8%).
Chooi et al.167 reviewed 380 patients undergoing appendectomy between 2000 and 2004 and found lower rates of negative appendectomy in both male and female patients undergoing (CT or ultrasound) imaging (11.4%) than in those without imaging (22.2%). The authors also reported a lower perforation rate in patients with preoperative imaging.
Riesenman et al.168 compared emergency department length of stay and perforation rate in patients with and without CT for suspected appendicitis. Statistically, length of stay was significantly longer in patients with CT (606 vs. 321 minutes). Perforation rate was not significantly different between groups.
Randomized Controlled Trials on the Clinical Effect of Abdominal Computed Tomography for the Diagnosis of Appendicitis
A better research methodology for determining the effect of diagnostic imaging on patient outcomes is a randomized controlled trial. In trials of this type, randomization attempts to create two equivalent patient populations before the study intervention, the use or not of diagnostic imaging for appendicitis. Several trials of this type have been conducted, using slightly different comparisons. All of these studies suffer from a lack of statistical power, so their results may not accurately depict the likely effect of imaging on negative appendectomy rates, rupture, or other patient outcomes. Although existing studies do not lay to rest questions about the clinical benefit of CT, we examine the evidence because it may shed light on future studies to resolve this debate.
Hong et al.169 randomized 182 patients with suspected appendicitis to clinical assessment alone or clinical assessment with mandatory abdominal CT. The authors found clinical assessment to be more sensitive (100%) than CT (91%) but less specific (73% for clinical assessment vs. 93% for CT). Perforation rates were low in both groups and not statistically different (6% for clinical assessment vs. 9% for CT). Hospital length of stay and costs were equal in the two groups. Patients assessed without CT were operated upon more quickly. The authors concluded that CT was not routinely warranted.
Although this study begins to apply strong methodology to this important clinical question, it may fail to reveal a benefit of CT because of the inclusion of all patients with suspected appendicitis, regardless of pretest probability. It stands to reason that CT would be unlikely to benefit patients with classic clinical presentations of appendicitis, because these patients likely have the disease process. CT in these patients would be expected to delay operative care, raise costs, and potentially increase perforation rates by delaying operative care. Because most patients in this group would be expected to have appendicitis, CT would be unlikely to reduce the negative appendectomy rate, which would be near zero. CT would also be expected to have little benefit in patients with very low clinical probability of appendicitis. In these patients, appendicitis would be expected to be rare, and few would undergo appendectomy on clinical grounds if CT were not used. CT might identify patients in this group with unexpected appendicitis, but this would be expected to be a rare event. Consequently, CT use would be expected to raise costs while having little effect on important outcomes such as perforation and negative appendectomy rates. CT would be most likely to have clinical benefit in patients with intermediate pretest probability of appendicitis. In this group, a relatively high rate of negative appendectomy might be expected without CT; a relatively high rate of perforation might also be expected if appendectomy were delayed until clinical signs progressed. Hong et al.169 might have found clinical benefit to CT if the patient population had been selected in this way based on pretest probability.
Lee et al.170 randomized 152 adult patients with right lower quadrant pain to selective CT or mandatory CT use. CT was performed in 68% of patients in the selective group and 97% of patients in the mandatory group. Mandatory CT imaging showed a trend toward decreased negative appendectomy (11% reduction) and perforation rates (8% reduction), not reaching statistical significance. A larger study is required to determine whether the observed trends represent a true benefit of mandatory CT.
Lopez et al.171 randomized 98 women of childbearing age with possible appendicitis to clinical observation alone or observation with CT scan. Charges and length of stay were similar in the two groups. Clinical observation alone was 100% sensitive and 87.5% specific, whereas CT was 89.5% sensitive and 95.6% specific. The study was underpowered to determine superiority of one method over the other. While acknowledging this limitation, the authors concluded that CT reliably identified patients requiring operation and appeared equivalent to observation. In addition to limitations because of poor statistical power, this study again suffers from inclusion of patients with very low and very high pretest probability of appendicitis, extremes at which CT would be predicted to have little benefit. The authors included patients with Alvarado scores of 2 to 8 (see Table 9-10). Alvarado scores of 7 or greater strongly predict appendicitis, whereas scores of 3 or less strongly exclude the diagnosis.150 Inclusion of patients with these scores dilutes the possible benefit of CT in patients in whom true clinical uncertainty exists.
Contrast Controversies: Is Oral, Rectal, or Intravenous Contrast Required for the Diagnosis of Appendicitis by CT? In Which Patients? What Forms of Contrast?
A major controversy in appendicitis imaging today is the benefit or requirement for oral and IV contrast for CT. In its appropriateness criteria, the ACR acknowledges the mixed evidence for and against enteral and IV contrast. The ACR134 states that oral or rectal contrast use should be determined by institutional preference. For nonpregnant adults, the ACR rates CT with IV contrast 8 of 9 on its appropriateness scale and CT without IV contrast 7 of 9. Oral contrast represents a potentially serious barrier to CT use, because it adds a median of more than 100 minutes to the emergency department stay, even when antiemetics are administered prophylactically.27 IV contrast represents a risk for contrast allergy and contrast nephropathy. In addition, in some settings, up to an hour delay may occur for creatinine measurement before administration of IV contrast is allowed. Delays such as these could increase the risk for appendiceal rupture and could be critical in other time-dependent abdominal conditions, such as aortic aneurysm or mesenteric ischemia. Therefore the question of the need for contrast agents is an important one to emergency physicians.
An ideal study to determine the incremental value of oral, IV, and rectal contrast agents would randomize patients to receive unenhanced CT, CT with each contrast agent individually, or CT with each possible combination of contrast agents. Such studies are rare; instead comparisons are often made among separate studies that determine the sensitivity and specificity of a single CT protocol. Critics of this approach point out that comparisons of this type can be confounded by differences in the study populations so that differences in the performance qualities of various CT protocols may not be valid. While acknowledging this limitation, let’s examine the available evidence. We summarize the findings using available metaanalyses and systematic reviews where possible, because the number of studies of CT for appendicitis is large, with more than 800 publications in PubMed.
A number of studies suggest that oral contrast is not needed for the diagnosis of appendicitis. Anderson et al.32 performed a systematic review to compare the performance of CT with and without oral contrast. The authors identified 23 studies, and the sensitivity of CT without oral contrast was not statistically different from that of CT with oral contrast (95% vs. 92%). The specificity of CT without oral contrast was 97%, whereas the specificity of CT with oral contrast was 94% (p < 0.0001). The authors suggest that a prospective head-to-head comparison of the two protocols be performed to confirm the findings. This study, although suggesting that oral contrast is unnecessary, pools results from a variety of different CT protocols. Some studies used no oral contrast but applied rectal or IV contrast. Interestingly, in the subgroup of 1510 patients receiving no contrast, sensitivity was 93% and specificity was 98%. In the 750 patients receiving only rectal contrast, sensitivity and specificity were 97%. For the 914 patients receiving oral and IV contrast, sensitivity and specificity were 93%. None of the included studies used IV contrast alone.
Studies have also examined the performance of CT with IV contrast alone. Iwahashi et al.172 found CT with IV contrast only to be 92% sensitive and 88% specific in a population of 78 patients. Mun et al.173 retrospectively reviewed 173 patients undergoing CT with IV contrast only for appendicitis and found sensitivity of 100% and specificity of 97%. Anderson et al.174 prospectively randomized 303 patients to CT with IV contrast alone or CT with oral and IV contrast and found similar performance for the diagnosis of appendicitis: sensitivity of 100% and specificity of 97% for both protocols. Keyzer et al.175 prospectively randomized 131 patients with suspected appendicitis to CT with or without oral contrast. All patients underwent two CT scans, before and after administration of IV contrast. Performance of unenhanced, IV only, oral only, and oral and IV contrast CT were similar, with variation in accuracy depending more on the radiologist interpreting the images than on the contrast protocol. Seo et al.176 performed CT with IV contrast (and no oral or rectal contrast) in 207 adults with suspected appendicitis, using both standard and low-radiation dose CT techniques. Sensitivity was 98% to 100% for low-radiation dose and 100% for standard radiation dose. Specificity was 95% to 97% for low dose and 93% to 97% for standard radiation dose.
Other studies suggest that noncontrast CT (with no oral, IV, or rectal contrast) is adequate for the emergency department diagnosis of appendicitis in adults (see Figure 9-56). Hlibczuk et al.177 performed a systematic review, identifying seven methodologically rigorous studies from more than 1258 publications. The included studies used a representative emergency department patient spectrum and strong reference standards for diagnosis and provided a pooled sample of 1060 patients. The pooled sensitivity of noncontrast CT for appendicitis was 92.7% (95% CI = 89.5%-95.0%) and specificity was 96.1% (95% CI = 94.2%-97.5%). The positive likelihood ratio was 24, and the negative likelihood ratio was 0.08. Positive likelihood ratios greater than 10 are generally considered to confirm disease confidently, whereas negative likelihood ratios less than 0.1 are generally considered to exclude disease. Although this review does not specifically compare the performance of noncontrast CT to CT with various contrast agents, it suggests that unenhanced CT is accurate for the diagnosis of appendicitis. This review does not address the question of alternative diagnoses in patients without appendicitis, so the results should be treated with caution when applied to patients with a broad differential diagnosis. For example, unenhanced CT does not exclude subtle vascular pathology such as iliac artery dissection.
Other authors have suggested that unenhanced CT be performed as the initial test, with contrast being administered for inconclusive cases. Tamburrini et al. (2007) found that unenhanced CT was conclusive in 75% of patients, with a sensitive of 90% and specificity of 96%. In the 25% of patients with inconclusive initial noncontrast CT, a repeat CT scan with IV and oral or rectal contrast yielded a sensitivity of 96% and specificity of 92%. The authors conclude that a noncontrast CT is an appropriate first test, with contrast reserved for equivocal cases. However, this approach would also result in two radiation exposures in 25% of patients. Such exposure might be acceptable in older patients but quite undesirable in young patients, so the choice of unenhanced CT or enhanced CT should include consideration of factors such as patient age and differential diagnosis.
Other factors may influence the sensitivity of CT and the benefit of contrast agents. Thin patients including many children have little intraperitoneal fat, providing little substrate for inflammatory fat stranding that can be important to the diagnosis of appendicitis. Some authors have suggested that thin patients and children should receive oral and IV contrast because of this limitation. Kaiser et al.178 found that unenhanced CT (no IV, oral, or rectal contrast) limited to the lower abdomen was only 66% sensitive but 96% specific for appendicitis in 306 children. Addition of IV contrast and widening of the region of the CT to the entire abdomen increased sensitivity to 90%, with a 94% specificity. Grayson et al.179 demonstrated that decreased peritoneal fat reduces visualization of the normal appendix in pediatric patients. Benjaminov et al.180 observed that the normal appendix was more difficult to identify in patients with lesser degrees of intraperitoneal fat, using unenhanced CT.
When CT Fails to Visualize the Appendix but Is Otherwise Normal, Is Appendicitis Excluded?
In approximately 13% to 15% of CT scans performed for evaluation of appendicitis, the appendix is not visualized, preventing direct commentary on the findings of appendicitis described earlier.181-182 With modalities such as ultrasound, lack of visualization results in a nondiagnostic test—additional assessment is required by some other means (e.g., CT, observation, or laparoscopy) to determine whether appendicitis is present. When the appendix is not visualized on CT, are additional imaging studies required? Multiple studies have investigated the rate of appendicitis in patients with a nonvisualized appendix on CT, with more than 750 adults and 1100 pediatric patients included (Table 9-13). A nonvisualized appendix in the absence of additional signs of inflammation, such as fat stranding or free fluid, yields a negative predictive value of 98%—the equivalent of a CT that visualizes a normal appendix. Consequently, a normal CT with or without visualization of the appendix effectively rules out appendicitis in most patients.181-183
Table 9-13 Rate of Appendicitis When CT Is Normal but the Appendix Is Not Visualized
| Study | Population | Rate of Appendicitis |
|---|---|---|
| Nikolaidis et al.182 | 366 consecutive adults | 2% rate of appendicitis when appendix not seen and no secondary signs of appendicitis (one female patient with paucity of right lower quadrant fat) |
| Ganguli et al.181 | 400 consecutive patients, 20% with appendicitis | 2% |
| Garcia et al.183 | 1139 children | Negative predictive value of 98.7% for nonvisualized appendix, 100% for partially visualized, 99.6% for fully visualized—not statistically different |
When CT Findings Are Equivocal, What Is the Likelihood of Appendicitis?
In some instances, CT findings are equivocal for appendicitis, because the appendix may appear enlarged without surrounding inflammatory change or inflammatory changes may be present in the right lower quadrant without evident abnormalities of the appendix. In other cases, the appendix is not seen but inflammatory changes of the right lower quadrant are present.
Daly et al.184 reviewed 1344 consecutive patients undergoing CT for suspected appendicitis between 1998 and 2002. They found that 172 patients (12.8%) had equivocal CT results. Of these, approximately 30% were ultimately diagnosed with appendicitis. Consequently, when CT findings include some abnormalities but appendicitis is not diagnosed specifically, the diagnosis is not ruled out.
Appendicitis Imaging in the Pediatric Patient
Imaging for appendicitis in the pediatric patient warrants several special considerations. First, the differential diagnosis for acute abdominal pain is usually far more restricted than in adults. Often a binary question can be asked: Is the cause of the patient’s pain appendicitis? No further diagnostic testing is required when the answer is no. In contrast, a multitude of important causes in adults may simulate appendicitis, including ovarian pathology, obstructing renal stones, and vascular pathology. Although a broad differential diagnosis should be considered in pediatric patients, the requirement for an imaging test to fully evaluate all possible causes of abdominal pain is diminished. As a consequence, ultrasound, with its more limited ability to assess right lower quadrant abdominal pain, becomes a reasonable alternative to CT (see Figure 9-57).
Second, radiation exposures are a growing concern in pediatric patients, with risks varying depending on age at exposure. Brenner and Hall185 estimate lifetime attributable mortality from a single abdominal CT to be approximately 1 in 700 if performed at birth, 1 in 1000 if performed at 5 years, and 1 in 2000 if performed at age 25. In contrast, the attributable risk is thought to be less than 1 in 5000 if CT is performed at 35 years, with a continued decrease with advancing age. Whereas these risks are small for the individual patient compared with baseline risks for cancer death in the United States (~22%, according to Centers for Disease Control and Prevention data from 2005),186 on a population level these risks are estimated to translate into as many as 500 additional pediatric deaths annually in the United States.187 Again, a diagnostic imaging test with no ionizing radiation exposure becomes more desirable; ultrasound and MRI meet this criterion.
Third, the CT diagnosis of appendicitis depends partly on the presence of intraperitoneal fat, the substrate for inflammatory fat stranding. Although CT has been shown to be relatively sensitive (84%) and highly specific (99%) for appendicitis in children,158 some thin pediatric patients have little intraperitoneal fat, which may make diagnosis more difficult.179 At the same time, a low body mass index typically improves the diagnostic performance of ultrasound.
Therefore a growing trend has emerged toward ultrasound as the first diagnostic imaging test for pediatric patients. As we discussed earlier, ultrasound is quite specific but relatively insensitive. Consequently, the ACR recommends that ultrasound be used as the first diagnostic test in children younger than 14 years, followed by CT for equivocal ultrasound results (e.g., nonvisualization of the appendix by ultrasound).134 MRI is another option, although its expense and limited emergency availability make it a less viable strategy in many centers.134
Imaging the Pregnant Patient With Possible Appendicitis
Pregnant patients with possible appendicitis pose another clinical diagnostic dilemma. Appendicitis is one of the most common surgical emergencies in pregnancy. Changes in the location of the appendix have been posited as causing atypical presentations in pregnant patients, although there is little supporting evidence in the medical literature. Leukocytosis is a normal finding in pregnancy, also complicating the diagnosis. Missed appendicitis can lead to fetal loss, so accurate diagnosis through the use of imaging is particularly desirable. As with the pediatric patient, minimizing radiation exposure in the pregnant patient is a priority. Consequently, alternatives to CT imaging using ultrasound or MRI are often sought.
Ultrasound is the first-line imaging modality in pregnant patients with suspected appendicitis. In pregnant patients, ultrasound has limited sensitivity (~50%) but is highly specific (100%) for appendicitis when the appendix is seen.145 Ultrasound may fail to visualize the appendix in a large minority of pregnant patients, resulting in a nondiagnostic study. Shetty et al.188 found that CT was 100% sensitive for appendicitis in pregnancy, compared with only 46% for ultrasound. Given the low sensitivity of ultrasound for appendicitis, further imaging is prudent in patients with negative or equivocal ultrasound.
Ironically, physicians generally overestimate the radiation risk from CT in pregnancy. The radiation dose from a single CT of the abdomen and pelvis is approximately 8 mSv, below the cumulative radiation exposure generally held to result in a measurable increase in risk for fetal anomaly or loss.189-190 Despite this, physician knowledge lags behind, perhaps resulting in unnecessary fear of CT by physicians and patients. Ratnapalan et al.190 surveyed family physicians and obstetricians on the risk for fetal anomaly following a single CT scan in pregnancy. In the survey, 61% of family physicians and 34% of obstetricians rated the likelihood of anomaly as greater than 5%—although the consensus among experts in this field is that no appreciable risk results from these exposures. This is not to say that CT should be used with abandon in pregnancy. Some evidence suggests that in utero radiation exposures might result in an increased risk for childhood leukemias, so if other imaging or diagnostic options are available, they should be considered. Ultrasound and MRI are reasonable options, with CT used when these are unavailable. Currently the ACR recommends right lower quadrant ultrasound, followed by MRI and CT when ultrasound is nondiagnostic for suspected appendicitis in pregnancy (Table 9-14).134,191 Neither ultrasound nor MRI exposes the patient to radiation. Both ultrasound and MRI can evaluate for appendicitis and other causes of right lower quadrant or pelvic pain. Gadolinium safety in pregnancy is unknown; avoid gadolinium use when possible.
Table 9-14 American College of Radiology Appropriateness Criteria: Right Lower Quadrant Pain —Suspected Appendicitis, Fever, Leukocytosis, Pregnant Woman
| Radiologic Procedure | Rating | Comments |
|---|---|---|
| Ultrasound abdomen right lower quadrant | 8 | With graded compression. Better in first and early second trimesters |
| MRI abdomen and pelvis without contrast | 7 | May be useful following negative or equivocal ultrasound |
| Ultrasound pelvis | 6 | |
| CT abdomen and pelvis with IV contrast | 6 | Use of oral or rectal contrast depends on institutional preference. |
| CT abdomen and pelvis without IV contrast | 5 | Use of oral or rectal contrast depends on institutional preference. |
Rating Scale: 1,2,3: usually not appropriate; 4,5,6: may be appropriate; 7,8,9: usually appropriate.
This table is abbreviated from the complete ACR appropriateness criteria. Only the primary imaging recommendations (i.e., procedures rated as “usually appropriate”) and alternatives (i.e., procedure rated as “may be appropriate”) are included in this truncated list.Reprinted with permission of the American College of Radiology, Reston, VA. No other representation of this material is authorized without expressed, written permission from the American College of Radiology. Refer to the ACR website at www.acr.org/ac for the most current and complete version of the ACR Appropriateness Criteria®.”
From American College of Radiology: ACR appropriateness criteria: Right Lower Quadrant Pain — Suspected Appendicitis. 2010. Available at: http://www.acr.org/SecondaryMainMenuCategories/quality_safety/app_criteria/pdf/ExpertPanelonGastrointestinalImaging/RightLowerQuadrantPainDoc12.aspx.
Complications and Treatment of Appendicitis: Abscess and Percutaneous Drainage
A frequent complication of appendicitis is perforation with abscess formation. Today, when CT detects periappendiceal abscess, surgery is often delayed or avoided in favor of antibiotic therapy with percutaneous drainage (discussed in detail in Chapter 16). Randomized controlled trials show a high rate of resolution with this approach. In long-term follow-up, the risk for recurrent appendicitis appears low, suggesting that routine appendectomy following percutaneous drainage may be unnecessary.
Limited Computed Tomography Versus Computed Tomography of Entire Abdomen for Suspected Appendicitis
In the pediatric patient and in adults with localized right lower quadrant pain and tenderness, appendicitis may be the leading diagnosis, and complete imaging of the abdomen may be unnecessary. When the differential diagnosis is constrained, a more restrictive CT imaging approach could be sufficient, reducing radiation exposure. Rao et al.192 explored the sensitivity of z-axis restricted CT for the diagnosis of appendicitis, using a CT confined to the lower abdomen, and reported a sensitivity of 100% and specificity of 95%. The same group reported a cost savings of more than $45,000 per 100 patients using this technique, compared with clinical assessment alone.193 Fefferman et al.194 retrospectively reviewed 93 CT scans performed in children for assessment of appendicitis and determined that a CT limited to the region below the lower pole of the right kidney would be 97% sensitive and 93% specific while limiting radiation exposure. Mullins et al.195 found focused CT to be 97% sensitive and 99% specific in 199 children.
Broder et al.196 used a CT strategy guided by the location of abdominal tenderness, rather than guided by anatomic landmarks. Although the study was designed to assess for multiple forms of abdominal pathology, in the subset of patients with appendicitis, the technique was 93% sensitive. They found 38% to 69% of radiation exposure could be avoided by this technique, though additional study is required.
Appendicitis Mimics
Multiple disease processes can mimic appendicitis and may be detected with imaging performed for evaluation of appendicitis. CT can visualize obstructing renal stones, ovarian pathology (including tuboovarian abscess, ovarian torsion, ovarian mass, and ectopic pregnancy), hernias, vascular abnormalities, right-sided diverticulitis, and inflammatory bowel disease such as colitis or terminal ileitis.197 Two common appendicitis mimics deserve special attention because they may be unfamiliar to emergency physicians and are frequently visualized with CT: epiploic appendagitis and mesenteric adenitis.
Epiploic appendagitis (Figure 9-58) occurs when fat appendages attached to the taeniae coli, called epiploic appendages, become inflamed. This may occur primarily, caused by torsion of the appendage with ischemic infarction, or secondarily, caused by adjacent inflammatory processes such as diverticulitis. The diagnosis is made on CT when a round or oval pericolonic structure is identified with rim enhancement and adjacent fat stranding.198 Fever and leukocytosis, as well as abdominal pain, may occur with epiploic appendagitis. Primary epiploic appendagitis does not require surgery in many cases, although historically the condition was often discovered at surgery for suspected appendicitis and the torsed epiploic appendage was often removed.199 Some authors advocate antibiotics,200 although no systematic evidence exists for their use because the condition is believed to be caused by vascular insufficiency of the appendage, not infection. Conservative management with nonsteroidal antiinflammatory drugs and analgesics may be sufficient in most cases.201
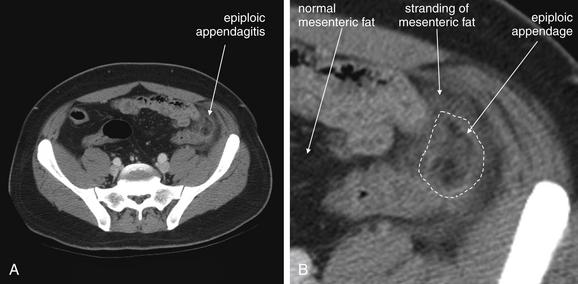
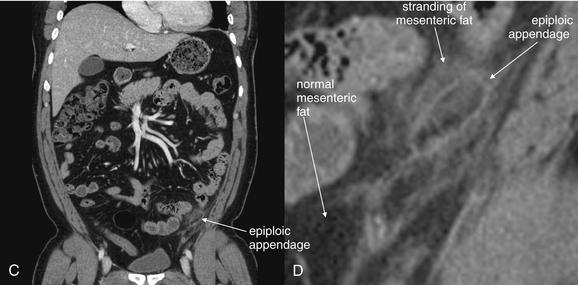
Figure 9-58 Epiploic appendagitis, CT with IV contrast, soft-tissue window.
Epiploic appendagitis occurs when fat-containing appendages from the colon undergo torsion and ischemic infarction. The epiploic appendage appears as a dark and well-circumscribed structure of fat density. Surrounding the epiploic appendage is inflammatory change with stranding in the surrounding mesenteric fat.A, Axial view. B, Close-up from A. C, Coronal view. D, Close-up from C.
Mesenteric adenitis (Figure 9-59) is enlargement of mesenteric lymph nodes and may occur with viral or bacterial enteritis (including pathogens such as Clostridium difficile, Yersinia enterocolitica, Salmonella typhi, Mycobacterium tuberculosis, and Mycobacterium avium complex), inflammatory bowel disease, lupus, appendicitis, diverticulitis, human immunodeficiency virus, and malignancy.202-203 When enlarged nodes are found without another cause of inflammation, primary mesenteric adenitis is diagnosed. When another cause is found, secondary mesenteric adenitis is diagnosed. The enlarged nodes may cause right lower abdominal pain and tenderness, whereas the underlying infection or inflammatory process can cause diarrhea and fever, simulating appendicitis. Adenovirus is a classically described cause of mesenteric adenitis.204 Treatment of primary mesenteric adenitis is supportive care, whereas a search for an underlying cause such as bacterial enteritis may be warranted. Surgery is not required for primary mesenteric adenitis. Antibiotics are required only if indicated for the underlying infection. In one study, 8.3% of patients undergoing CT for acute abdominal symptoms had mesenteric adenitis, with 3.3% having primary adenitis.205 Rao et al.206 found that mesenteric adenitis was the final diagnosis in 7.7% of 651 consecutive patients admitted with suspected appendicitis. In this same group of patients, it constituted about 20% of the final diagnoses in patients without appendicitis, indicating that it is a frequent appendicitis mimic.
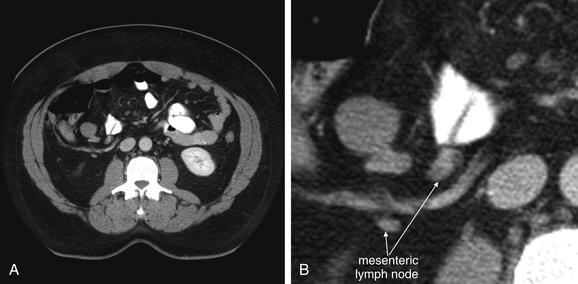
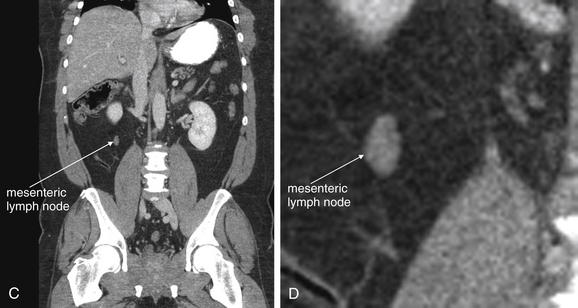
Figure 9-59 Mesenteric adenitis, CT with IV and oral contrast, soft-tissue window.
Mesenteric adenitis can mimic appendicitis in its clinical presentation. Enlarged lymph nodes are visible on CT. Lymph nodes have soft-tissue density and appear as discrete, rounded structures. On a single image they may appear similar to blood vessels or to the appendix, but on inspection of adjacent images it becomes clear that lymph nodes are rounded, not tubular like a blood vessel or the appendix.A, Axial image. B, Close-up from A. C, Coronal reconstruction. D, Close-up from C.
CT criteria for the diagnosis of mesenteric adenitis include a cluster of three or more mesenteric lymph nodes, each measuring 5 mm or more. With CT, lymph nodes appear as rounded structures with soft-tissue density, usually surrounded by mesenteric fat. They usually enhance homogenously with IV contrast. Necrotic lymph nodes associated with malignancy may be hypoattenuating with an enhancing rim. Because mesenteric lymph nodes can enlarge from serious processes, including appendicitis and malignancy, the CT must be reviewed carefully for other findings.
Diverticular Disease
Figures 9-60 through 9-66 demonstrate imaging findings of diverticulosis and diverticulitis.
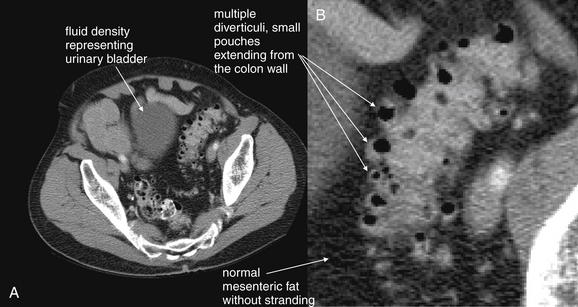
Figure 9-60 Diverticulosis, CT with oral and IV contrast, soft-tissue window.
This patient had known diverticulosis from prior colonoscopy. His scan shows diverticuli without evidence of inflammation such as fat stranding, abscess, or free air. This slice is through the pelvis and visualizes a section of the sigmoid colon, a common location for both diverticulosis and diverticulitis. Note the normal, dark appearance of the fat surrounding the sigmoid colon. A, Axial image. B, Close-up.Future figures examine cases of diverticulitis, which are revealed by the smoky appearance of inflammatory fat stranding. This patient did receive intravenous (IV) and oral contrast. Diverticulitis can be recognized without contrast, using findings such as fat stranding and abscess, but IV contrast assists by providing bowel wall enhancement, and oral contrast may assist by revealing the margins of bowel versus an adjacent abscess.
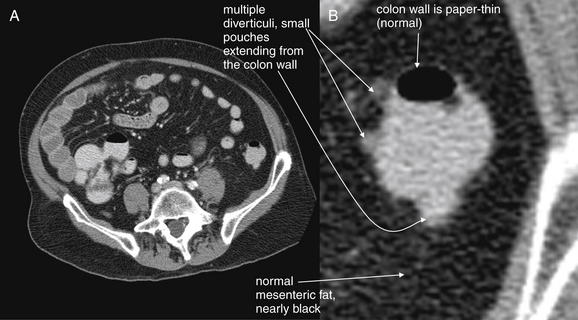
Figure 9-61 Diverticulosis, CT with oral and IV contrast, soft-tissue window.
The descending colon in the same patient as in Figure 9-60 also shows scattered diverticuli. Again, note the normal surrounding fat and extremely thin (normal) colon wall.A, Axial image. B, Close-up.
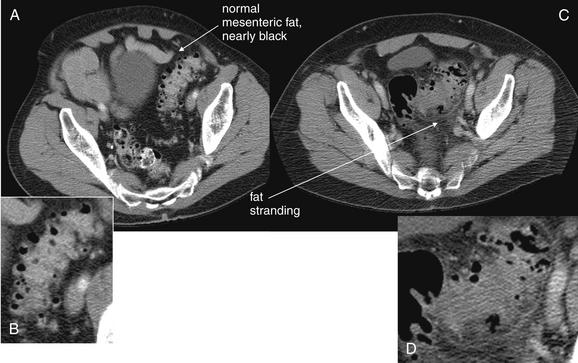
Figure 9-62 Diverticulosis compared with diverticulitis, CT.
Compare the axial image in A, showing uninflamed sigmoid diverticuli, with that in C, showing sigmoid diverticulitis. The normal fat surrounding the sigmoid colon appears nearly black with a soft-tissue window in A, whereas the inflamed fat in C shows stranding, giving it a gray or smoky appearance. Whereas the borders of the uninflamed sigmoid colon are quite distinct in A, the margins of the sigmoid are blurred in C, reflecting inflammation of the bowel wall and surrounding fat. B, D, Close-ups from A and C, respectively.
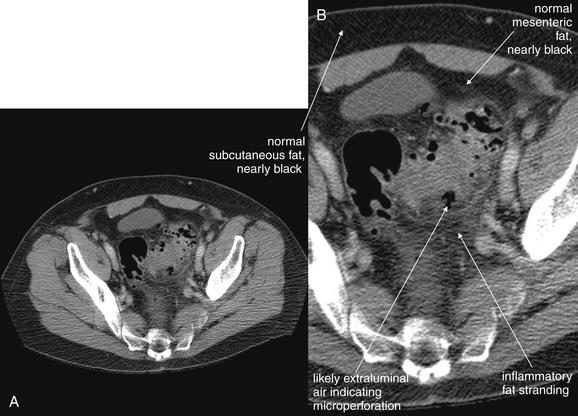
Figure 9-63 Diverticulitis, CT.
This figure explores diverticulitis in more detail. Again, note the appearance of fat stranding. Several foci of air along the margins of the sigmoid colon may be in extraluminal fat, rather than within diverticuli. Although it may appear intuitive that this would indicate perforation or abscess formation requiring surgical drainage, this is a common feature of diverticulitis and may resolve with medical therapy. This 69-year-old male was treated with intravenous ciprofloxacin and metronidazole with resolution of his symptoms and did not require surgery. A, Axial image. B, Close-up.
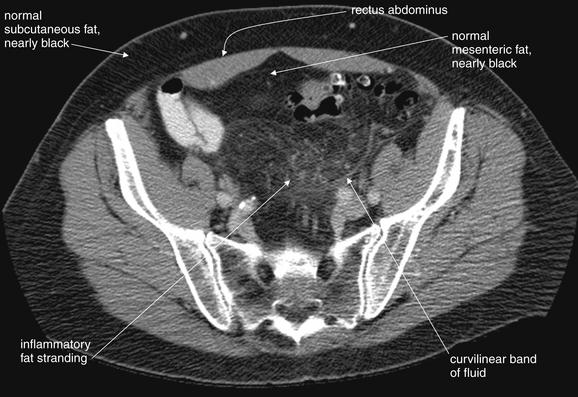
Figure 9-64 Diverticulitis, CT with IV and oral contrast, soft-tissue window, showing sentinel fat stranding.
Even before an inflamed area of diverticulitis is seen, fat stranding gives away an inflammatory process in the region. Look at this pelvic section, taken a few slices cephalad to the image from Figure 9-63. A smoky region of stranding is seen. Compare this with the normal subcutaneous fat—a convenient standard present in nearly every patient. A curvilinear band may be a thin line of fluid tracking in a tissue plane, rather than true fat stranding, which usually has a less organized appearance. The fat becomes more normal in appearance just deep to the rectus muscles. When seeking any inflammatory process, look for the smoke (fat stranding) that gives away the presence of the fire (inflammatory process).
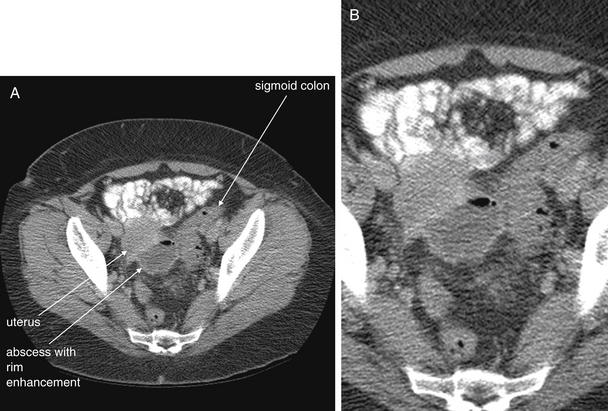
Figure 9-65 Diverticulitis with abscess, CT with oral and IV contrast, soft-tissue window.
In this 48-year-old female, diverticulitis has progressed to abscess formation. The abscess is seen as a rounded, fluid-filled structure with an air–fluid level and an enhancing rim in this CT with intravenous and oral contrast. The sigmoid colon is seen to the patient’s left; no definite diverticuli are seen on this scan, although the patient has known diverticuli from prior studies. A, Axial image. B, Close-up.When viewing CT scans of the pelvis, it is important to identify normal landmarks to ensure that normal structures are not mistaken for pathology, and vice versa. Theoretically, a loop of fluid-filled bowel could have a similar appearance to an abscess on a single slice, but inspection of slices above and below this one in the complete CT proved that this abscess was cystic, not tubular like bowel. The uterus lies slightly anterior and right of the abscess, and the bladder lies deeper in the pelvis, not visible on this slice. Figure 9-66 shows a coronal reconstruction that illustrates this relationship. Large discrete fluid collections such as this one usually require drainage, rather than medical therapy alone. This patient underwent ultrasound-guided drainage, with a percutaneous drain left in place. Cultures from the abscess grew beta-hemolytic Streptococcus group F, Candida albicans, and Bacteroides fragilis.
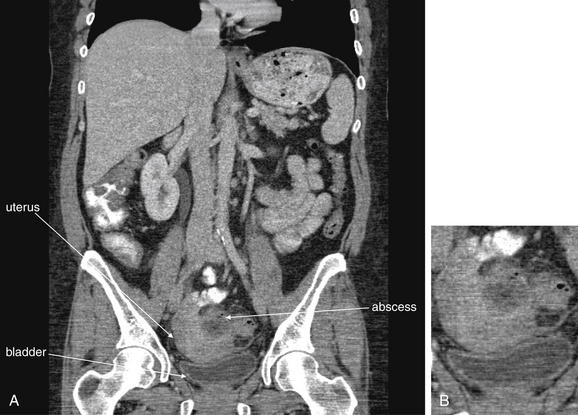
Figure 9-66 Diverticulitis with abscess, CT with oral and IV contrast, soft-tissue window.
A coronal section (A; B, close-up) from the same patient as Figure 9-65 shows an abscess arising from a sigmoid diverticulum. The uterus and bladder lie close together. When looking for abscesses in the pelvis, be sure to identify normal anatomic structures; these may otherwise be taken for pathology, and vice versa. Distinguish between bowel and abscess by examining adjacent slices to determine whether a structure is tubular or cystic.
Diverticulosis
Diverticulosis (see Figures 9-60 through 9-62) is the presence of diverticuli, small outpouchings of the bowel, most common in the colon. Risk factors include low-fiber diets, common in the United States and rare in the developing world. Diverticuli occur with increasing frequency in older patients but are present in patients in the United States as early as age 30. Diverticulosis occurs in 10% of U.S. adults younger than 40 and 50%-70% of adults 80 years or older.207 Thus diverticulosis is not a condition restricted to the elderly in the United States. Colonic diverticuli more commonly occur in the distal colon, where stool is more solid in consistency; the sigmoid and descending colon are the most frequent sites, though ascending and transverse colon diverticuli occur.207 Pseudodiverticuli, composed only of mucosa and submucosa with no muscular layer, can occur at entry sites of perforating arteries, which represent weak areas in the muscle wall.
Diverticuli are not seen on x-ray. Historically, contrast barium enema was used to diagnosis diverticuli, but today the diagnosis is more commonly made using CT in U.S. emergency departments. On contrast enema, the appearance is of small outpouchings, often with a narrow neck. A similar appearance is seen with CT scan, although no enteral contrast is needed to identify diverticuli. Imaging of diverticular bleeding is discussed in the later section on GI hemorrhage.
Diverticulitis
When food particles become entrapped within diverticuli, infection and inflammation of diverticuli may occur, termed diverticulitis (see Figures 9-62 through 9-66). Mirroring the locations of diverticuli, diverticulitis occurs in the descending and sigmoid colon in 90% of cases. CT is the preferred imaging modality for diagnosis of diverticulitis, because it can display inflammatory change, complications of diverticulitis such as perforation or abscess formation, and alternative diagnoses including ischemic or infectious colitis, cancers, ureteral stones, and aortic aneurysm. Ultrasound and MRI are alternatives, though studies are limited. X-ray plays little role in the diagnosis. The ACR appropriateness criteria for imaging of suspected diverticulitis are shown in Table 9-15.208
Table 9-15 American College of Radiology Appropriateness Criteria: Left Lower Quadrant Pain, Older Patient With Typical Clinical Presentation for Diverticulitis
| Radiologic Procedure | Rating |
|---|---|
| CT abdomen and pelvis with IV contrast—Oral and/or colonic contrast may be helpful for bowel luminal visualization | 8 |
| CT abdomen and pelvis without IV contrast | 6 |
| X-ray contrast enema | 5 |
| Ultrasound abdomen transabdominal with graded compression | 4 |
| Ultrasound abdomen, transrectal or transvaginal | 4 |
| X-ray abdomen and pelvis | 4 |
| MRI abdomen and pelvis with or without contrast | 4 |
Rating Scale: 1,2,3: usually not appropriate; 4,5,6: may be appropriate; 7,8,9: usually appropriate.
The full ACR Appropriateness Criteria document includes other clinical variations with additional imaging recommendations.Reprinted with permission of the American College of Radiology, Reston, VA. No other representation of this material is authorized without expressed, written permission from the American College of Radiology. Refer to the ACR website at www.acr.org/ac for the most current and complete version of the ACR Appropriateness Criteria®.
From American College of Radiology: ACR appropriateness criteria: Left lower quadrant pain, 2008. (Accessed at http://www.acr.org/SecondaryMainMenuCategories/quality_safety/app_criteria/pdf/ExpertPanelonGastrointestinalImaging/LeftLowerQuadrantPainDoc8.aspx
Do All Patients With Suspected Diverticulitis Require Imaging?
Not all patients with suspected diverticulitis require emergency imaging. Some practitioners may empirically treat suspected diverticulitis with antibiotics, reserving imaging for patients with history or examination findings concerning for complications or in whom an alternative diagnosis is seriously considered. Some preliminary work has been performed to derive clinical decision rules for imaging of diverticulitis, though no rule has received wide acceptance. Lameris et al.209 found that direct tenderness only in the left lower quadrant, the absence of vomiting, and a C-reactive protein of more than 50 mg/L was 98% specific for diverticulitis but only 36% sensitive. In this same study, sensitivity based on clinical judgment before CT was 71%. Toorenvliet et al.210 found that clinical diagnosis of diverticulitis had a positive predictive value of 65% and a negative predictive value of 98%. Imaging improved accuracy but changed management in only 7% of cases. Other authors have suggested broad application of CT in most patients to define the severity of disease, complications of diverticulitis, and alternative diagnoses.211,213
Diagnostic Accuracy of CT for Diverticulitis
Lameris et al.212 performed a metaanalysis of studies on diagnostic accuracy of CT and ultrasound for diverticulitis. CT was 94% sensitive (95% CI = 87%-97%) and 99% specific (95% CI = 90%-100%). Ultrasound was 92% sensitive (95% CI = 80%-97%) and 90% specific (95% CI = 92%-95%). Although there was no statistically significant difference between ultrasound and CT in sensitivity or specificity, CT was more likely to identify alternative diagnoses. Other authors have found similar sensitivity and specificity for CT. 207 Although CT is likely highly sensitive and specific for diverticulitis, Liljegren et al.214 performed a systematic review of the literature on diagnostic imaging of diverticulitis and found relatively poor methodologic quality as a result of poor reference standards and selection bias in most studies.
What Are the CT Findings of Diverticulitis?
We review the CT findings of diverticulitis here and consider the potential value of contrast agents (Box 9-3). Figures 9-60 through 9-66 demonstrate CT findings of diverticulosis, diverticulitis, and diverticular abscess.
Essential to the CT diagnosis of diverticulitis is the presence of diverticuli, plus the presence of inflammatory changes. On CT, diverticuli are visible without the administration of any contrast agents. They appear as small outpouchings from the colon, particularly in the descending and sigmoid colon. Usually they contain some air (black on soft-tissue windows).
Inflammatory changes associated with diverticulitis include stranding of the adjacent fat, giving it a “smoky” appearance, which is brighter than uninflamed fat elsewhere in the abdomen, in the retroperitoneum, or in subcutaneous fat stores. When doubt exists about the presence of fat stranding, compare the fat region in question with an unaffected region to assess for differences in brightness. As described earlier in this chapter in the general discussion of CT, fat stranding results from increased water content of fat and is visible without the administration of any contrast agents. The bowel wall may appear thickened in the region of the affected diverticulum. If IV contrast is administered, the bowel wall may show increased enhancement in this region. CT grading systems for diverticulitis divide the condition into mild, moderate, and severe disease. Table 9-16 defines each grade by CT findings.215 The Hinchey classification for diverticulitis is based on surgical findings and predicts mortality (Table 9-17).207 CT accurately correlates with Hinchey classification in most cases (93% in one study).216
Table 9-16 CT Grading of Diverticulitis
| Grade of Disease | CT Findings |
|---|---|
| Mild | Diverticula with bowel wall thickening ≤3 mm and pericolic fat stranding |
| Moderate | Bowel wall thickening >3 mm with small abscess or phlegmon formation |
| Severe | Bowel wall thickening >5 mm, perforation with localized or subdiaphragmatic free air, and abscess >5 cm |
Adapted from Buckley O, Geoghegan T, O’Riordain DS, et al: Computed tomography in the imaging of colonic diverticulitis. Clin Radiol 59:977-983, 2004.
Table 9-17 Hinchey Classification of Diverticulitis Severity
| Grade | Findings | Mortality |
|---|---|---|
| 1 | Small, confined pericolic or mesenteric abscesses | 5% |
| 2 | Larger abscesses, confined to pelvis | 5% |
| 3 | Ruptured peridiverticular abscess with purulent peritonitis | 13% |
| 4 | Rupture of an uninflamed and unobstructed diverticulum into the peritoneal cavity with fecal contamination | 43% |
Adapted from Jacobs DO. Clinical practice. Diverticulitis. N Engl J Med 357:2057-2066, 2007.
Perforation of a diverticulum can occur, so the peritoneum or retroperitoneum surrounding the diverticulum should be carefully inspected for extraluminal air. Because air is black and fat surrounding the colon is quite dark in appearance on a soft-tissue window, the window setting should be modified to accentuate the
Box 9-3 CT Findings of Diverticulitis
difference between fat and air. A lung or bone window makes air more visible and may be useful. Extraluminal air is also visible with no contrast agents. Perforation can also lead to free fluid in the abdomen, which appears an intermediate gray on a soft-tissue window. No contrast is needed to identify free fluid, which typically pools in dependent regions of the abdomen and pelvis, between bowel loops, solid abdominal organs, and pelvic organs. When enteral contrast is given, it may be found in the peritoneal cavity in up to 35% of cases of perforation.216
Abscess formation adjacent to an area of diverticulitis may occur. An abscess typically is an irregular, sometimes rounded collection with a mixture of fluid and air densities. Fluid appears an intermediate gray on an a soft-tissue window; air appears black. An abscess may be visible without the administration of any contrast agents. Fat stranding surrounding an abscess is common and can be seen without IV contrast administration. Contrast agents can be useful in some circumstances in differentiating an abscess from adjacent bowel. The colon normally contains air, liquid, and solid stool; this can have a similar appearance to an abscess, filled with air and heterogeneous purulent contents. Addition of enteral contrast (orally or rectally administered) identifies the bowel lumen; an abscess would not be expected to fill with enteral contrast. IV contrast typically causes rim enhancement of an abscess, which is not expected in normal colon. However, in some cases, an abscess may be readily distinguishable from adjacent bowel based on the other characteristics described, without use of contrast agents.
Colonic obstruction can occur in about 6% to 10% of cases of diverticulitis.215,217 Findings of large-bowel obstruction were discussed earlier in this chapter. Ureteral obstruction can also occur; findings of ureteral obstruction are discussed in Chapter 12. Fistula formation may complicate diverticulitis. Colovesical fistula is the most common form and is characterized by thickening of the colon adjacent to the bladder and air within the bladder.215
Are Contrast Agents Required for the CT Diagnosis of Diverticulitis?
When CT is performed, controversy exists about the preferred technique. The ACR appropriateness criteria for left lower quadrant pain recommend CT with IV contrast and acknowledge conflicting evidence for the need for enteral contrast.208 Some institutions use oral contrast, whereas others use rectally administered contrast. CT without any contrast agents has been shown to have high sensitivity and specificity, though no single study has compared unenhanced CT, CT with IV contrast, and CT with enteral contrast to determine the incremental benefits of each contrast type.
Tack et al.29 compared sensitivity and specificity of CT for diverticulitis, using low-radiation-dose unenhanced CT (no oral, rectal, or IV contrast) and standard-radiation-dose CT with IV contrast in the same patient. No significant difference in sensitivity was found between the two protocols, with four readers achieving sensitivities between 85% and 100% with both protocols. Specificity was also equivalent for the two protocols, between 92% and 100%.
Werner et al. (2003) performed CT with IV and rectal contrast only in 120 patients and reported a sensitivity of 97% with 98% specificity. Perforation was detected with a sensitivity of 100% and a specificity of 91%; abscess was detected with a sensitivity of 100% and a specificity of 97%. As with many studies, the reference standard in this study was mixed, with some patients having surgery, others undergoing additional diagnostic imaging, and some having clinical follow-up only. This is a common problem in studies of diagnostic imaging modalities and calls into question the accuracy of the reported sensitivity and specificity, because the true diagnosis in all patients is not confirmed using the same technique.
Cho et al.218 compared CT and barium enema in 56 patients with suspected diverticulitis based on left lower quadrant pain and tenderness, fever, and leukocytosis. CT was 93% sensitive and 100% specific. Barium enema was 80% sensitive and 100% specific. CT demonstrated alternative diagnoses in 69% of patients without diverticulitis, whereas barium enema found alternative diagnoses in only 10%. This study is compromised by a poor gold standard, in that more than half of the patients were diagnosed with diverticulitis based on improvement with antibiotic therapy—calling into question the validity of the reported CT and barium enema performance.
Rao et al.7 reported the performance of CT using only rectal contrast (no IV or oral contrast) and found sensitivity of 97% with specificity of 100%. Alternative diagnoses were found in 58% of patients who did not have diverticulitis.
Computed Tomography and Complications of Diverticulitis
Ambrosetti et al.219 reported that 16% of cases of diverticulitis diagnosed by CT had an associated abscess. They found that 40%—mostly mesocolonic abscesses—were treated with antibiotics without surgery and resolved.
Ambrosetti et al.220 also reported that poor outcomes in diverticulitis could be predicted from CT findings. When CT demonstrated only mild changes, including localized thickening of the colon wall and pericolic fat inflammation, only 16% of patients experienced complications such as persistent or recurrent diverticulitis, abscess, or fistula formation. In contrast, 48% of patients with severe CT findings, such as abscess, extraluminal air, or extraluminal enteric contrast, experienced bad outcomes requiring surgery.
Ambrosetti et al.221 later found CT to be 97% sensitive for diverticulitis and to predict complications requiring surgery. Abscess formation and extracolonic gas and enteral contrast predicted failure of medical management in this series.
Image-Guided Drainage of Diverticular Abscesses
Image-guided drainage of diverticular abscesses using CT or ultrasound can be performed, with several potential advantages. In some cases, surgery may be avoided altogether. In other cases, resolution of the acute abscess with percutaneous drainage allows time for colon cathartic cleansing before resection of diseased colon. This allows a single procedure partial colectomy with primary anastomosis, rather than colostomy followed by takedown, which would typically be required for unprepped emergency partial colectomy. Particularly in the elderly or in patients who are poor operative candidates because of comorbidities, percutaneous drainage may be the primary or only therapy. The evidence for this approach comes primarily from small retrospective nonrandomized case series, not large prospective randomized studies.
Bernini et al.222 examined outcomes in abscesses associated with intestinal disease, drained percutaneously under CT guidance. They found 23% were diverticular abscesses and 100% of unilocular abscesses resolved without surgery. Even with complicated abscesses, drainage was successful in more than half of cases.
Siewert et al.223 retrospectively reviewed 181 patients with a CT diagnosis of diverticulitis and found 17% with associated abscess. Abscesses less than 3 cm in diameter resolved with antibiotics alone, without CT-guided drainage or surgery. In addition, 50% of abscesses between 3.4 and 4.1 cm in diameter resolved with antibiotics alone. Abscesses larger than 4 cm were successfully treated with CT-guided percutaneous drainage, without acute surgery.
Singh et al.224 retrospectively reviewed 16 patients undergoing percutaneous diverticular abscess drainage under CT or ultrasound guidance. Even large abscesses were successfully managed initially with percutaneous drainage, although fistula formation complicated 38% and half of patients in this series had surgical resection ultimately.
Sparks et al.225 reported two cases of percutaneous image-guided diverticular abscess drainage and noted that by treating abscess initially by this approach, an emergent colonic resection and colostomy were avoided.
Stabile et al.226 reviewed 19 patients with large diverticular abscesses (mean = 8.9 cm) treated with percutaneous drainage. No complications occurred as a result of catheter placement, and resolution of sepsis was seen within 3 days in 89%. Fistula formation occurred in 47%. In addition, 74% of patients were successfully treated with single-stage partial colectomy and primary anastomosis.
Mimics of Diverticulitis on Computed Tomography
Several mimics of diverticulitis should be considered. An inflammatory mass resulting from a colonic neoplasm can have a similar appearance, and it is often recommended that a repeated CT be performed following antibiotic treatment to assess for resolution of CT findings. Follow-up colonoscopy may be performed (in addition to, or sometimes instead of, repeated CT imaging) to help identify neoplasms simulating diverticulitis. CT morphologic criteria, including length of involved bowel, presence of a mass, pericolonic inflammation, and pericolonic lymph nodes, have relatively poor ability to discriminate colon cancer from diverticulitis, because characteristics overlap between the two conditions. Early work using CT perfusion scanning to identify cancers suggests better sensitivity and specificity but these are too low for clinical application.227 If diverticuli are not identified but regional inflammatory changes such as stranding, bowel wall thickening, and altered bowel wall enhancement are seen, colitis should be considered (ischemic, infectious, or resulting from inflammatory bowel disease). These conditions are discussed in more detail in this and other chapters.
Ultrasound of Diverticulitis
Transabdominal ultrasound has been investigated for detection of diverticulitis and has a reported sensitivity of 77% to 98% and specificity of 80% to 99%.228-231 Overall, ultrasound is likely less sensitive and specific than CT. In women, transvaginal ultrasound can be used and can differentiate left lower quadrant abnormalities such as ectopic pregnancy, tuboovarian abscess, and ovarian torsion. Ultrasound carries no radiation exposure, unlike CT. The ACR recommends ultrasound as the initial test in women of childbearing age with left lower quadrant abdominal pain for this reason.208
Ultrasound findings of diverticulitis include bowel wall thickening greater than 4 mm and a relatively hypoechoic colonic wall. Dilated and fluid-filled colon may be seen. In some cases, air-containing diverticuli or abscesses may be identified.230 A target-like appearance of the bowel in transverse view can be seen. Tenderness of the abdomen during graded compression over a segment of colon has also been described.229
Magnetic Resonance Imaging of Diverticulitis
MRI is rarely used in diagnosis of diverticulitis, and studies are limited. The indications for MRI are relatively few, because patients with allergies to IV contrast can undergo unenhanced CT or CT with enteral contrast only. Patients in whom radiation exposures must be limited, such as pregnant patients, can undergo ultrasound as an initial test. More studies are required to validate the sensitivity and specificity of MRI. If MRI becomes more widely available, inexpensive, and rapid, it may become a more widely accepted alternative to CT, given the advantage of no ionizing radiation exposure.
Ajaj et al.232 compared T1-weighted dark-lumen MRI using an aqueous enema with IV gadolinium contrast to conventional colonoscopy for the diagnosis of sigmoid diverticulitis in 40 patients. MRI findings of diverticulitis included increased wall thickness and pericolic mesenteric fat infiltration. MRI was 83% sensitive and 81% specific. MRI missed cases of mild inflammation detected by colonography and misclassified as diverticulitis some cases of colon cancer identified by colonography.
Heverhagen et al.233 performed MRI in 20 patients with established acute diverticulitis, using diagnostic criteria including presence of at least one diverticulum, pericolonic inflammatory change, and colon wall edema. MRI detected 95% of cases, although this performance might not be replicated in an unselected patient sample. In addition, because only positive cases were included, the specificity of MRI cannot be determined from this study.
Schreyer et al. (2004) performed MRI in 14 consecutive patients with suspected diverticulitis and found the performance was identical to CT.
Bowel Abnormalities: Inflammatory Bowel Disease, Infectious Colitis, and Enteritis
Inflammatory bowel disease and infectious colitides and enteritides have similar imaging findings, which must be correlated with clinical history to determine the likely cause (Figures 9-67 through 9-71). X-ray is of little utility. CT scan can demonstrate typical inflammatory findings, can identify complications of inflammatory bowel disease such as abscess or fistula formation, and can demonstrate alternative diagnoses such as bowel ischemia, diverticulitis, appendicitis, or neoplasm. Ultrasound, MRI, and nuclear scintigraphy are alternatives, though these are rarely used in the emergency department for this indication. In the emergency department, CT is the most commonly used modality in the United States because of its wide availability and ability to diagnose complications and alternative disease processes. CT is likely the most appropriate initial test in the patient without known inflammatory bowel disease as well, as a result of its ability to evaluate for multiple disease processes.
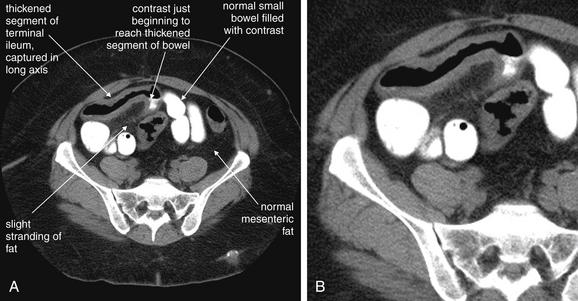
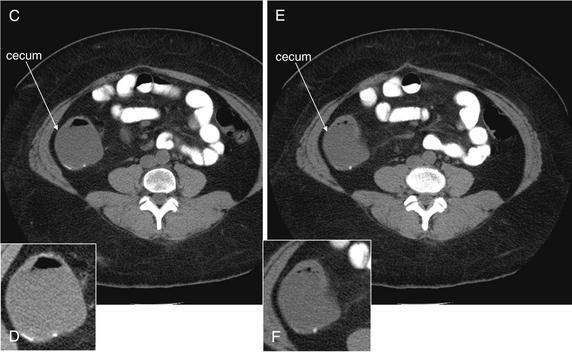
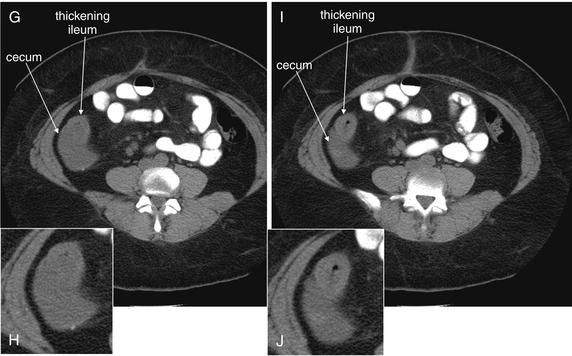
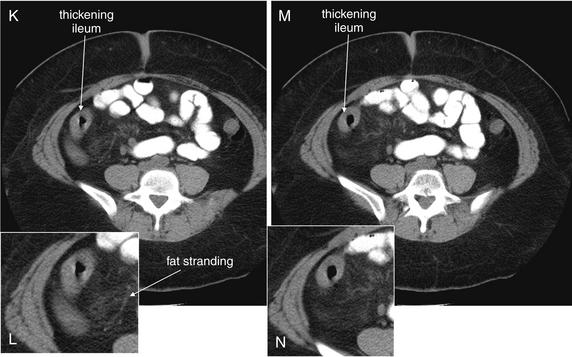
Figure 9-67 Inflammatory bowel disease: Crohn’s disease, CT with oral contrast, soft-tissue window.
This patient with confirmed Crohn’s disease presented with abdominal pain and has thickening of the terminal ileum typical of Crohn’s disease, although the CT appearance is not pathognomonic and could be mimicked by infectious causes. A, C, E, G, I, K, M, Axial images. B, D, F, H, J, L, N, Close-ups from A, C, E, G, I, K, M, respectively.Note the abnormal bowel wall thickness—compare with the normal small bowel in the same slice. The patient received oral contrast, which has just started to reach the terminal ileum but did not fill the affected segment. Theoretically, oral contrast might help to distinguish the bowel lumen from the bowel wall, but in this case air in the thickened bowel segment performs this function. The diagnosis could have been made in this patient without oral contrast. The patient did not receive intravenous contrast for unclear reasons. The normal bowel to the patient’s left has an extremely thin wall. The oral contrast in the normal bowel lumen is discretely contained, but the wall itself is hardly visible—oral contrast marking the lumen gives way to the mesenteric fat surrounding the bowel. The abnormal bowel segment is also surrounded by fat that appears to show slight stranding (gray in comparison to the dark fat surrounding normal bowel).These images also prove that the inflamed segment is the terminal ileum. Following retrograde from C to N, the thickened ileum emerges from the cecum. Wall thickening of the ileum is present, and fat stranding can be seen. The thickened small bowel has a “doughnut” appearance in short-axis cross section.Figure 9-67, cont’d
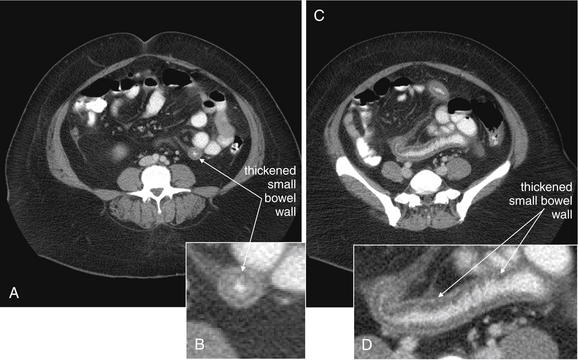
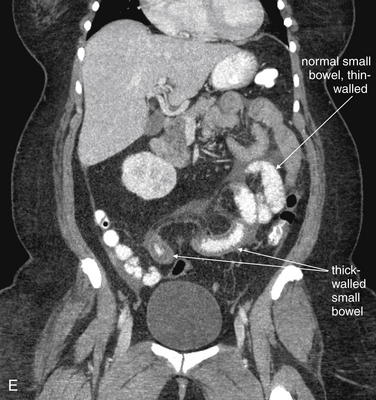
Figure 9-68 Inflammatory bowel disease, Crohn’s disease, positive oral contrast in bowel, CT with oral and IV contrast, soft-tissue window.
In another patient with Crohn’s disease, oral contrast has reached a thickened segment of small bowel. Note the remarkable degree of thickening of the small-bowel wall, remembering that the normal wall is nearly invisible. A, C, Axial images. B, D, Close-ups from A and C, respectively. E, Coronal view.A shows a thickened section in short-axis cross section, with a typical doughnut appearance, whereas B shows a thickened segment in long-axis cross section. The lumen of the bowel in A is nearly obliterated, with just a narrow column of oral contrast remaining (the “doughnut hole”). E shows a coronal reconstruction. Compare the normal and abnormal small-bowel segments in E. Technically, CT cannot determine whether there is a fixed point of stricture from bowel wall thickening, because CT is a static study capturing a moment in time. Perhaps the bowel segment was undergoing peristaltic contraction at the moment of CT. Note also the relative lack of fat stranding—this CT shows a relative remission for this patient, who has had chronic bowel wall thickening and at times has had more inflammatory stranding. Remember also that a differential diagnosis exists for these findings. Bowel wall tumors such as lymphomas can present with bowel wall thickening. Infection and ischemia, as well as inflammatory bowel disease, may cause bowel wall thickening.
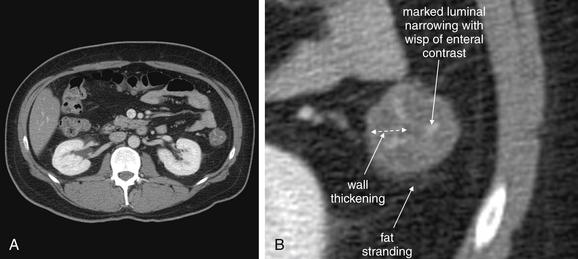
Figure 9-69 Colitis, likely infectious, CT with oral and IV contrast, soft-tissue window.
This 41-year-old male with no past medical history presented with abdominal pain and bright red blood per rectum. The wall of the descending colon is quite thickened, leaving only a ribbon of lumen with enteral contrast. Some surrounding fat stranding is present. These findings are consistent with colitis, though the cause is not determined by CT. Infectious colitis, inflammatory bowel disease, or ischemia colitis could have similar appearances.A, Axial image. B, Close-up.
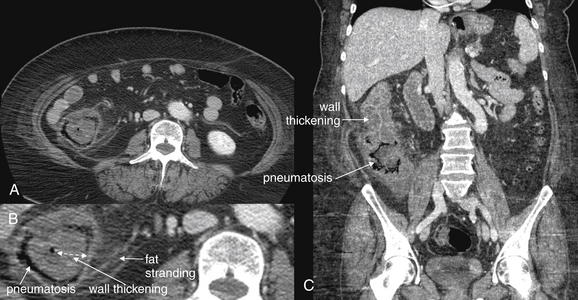
Figure 9-70 Colitis, CT with oral and IV contrast, soft-tissue window.
CT findings of colitis include large-bowel wall thickening and stranding of surrounding fat. CT often cannot distinguish the cause, though subtle findings may suggest infectious, inflammatory, or ischemic causes. Ischemic colitis may be recognized by explicit identification of a vascular occlusion or may be suspected when the affected portions of bowel follow a specific vascular distribution. This patient had concerning findings for ischemia and underwent laparotomy—but no resection was performed because the bowel appeared viable. The patient recovered uneventfully with antibiotics and fluids.A, The axial CT slice (B, close-up) shows significant bowel wall thickening and pneumatosis coli of the cecum and ascending colon. Fat stranding is also present. C, A coronal reconstruction shows similar findings. Bowel ischemia is discussed in detail in Chapter 11.
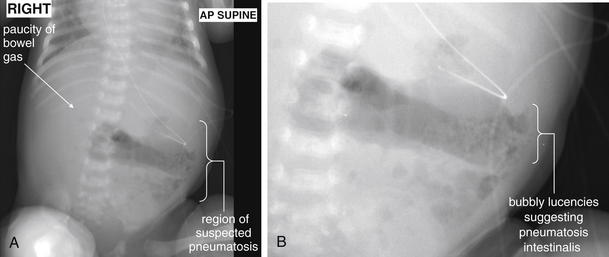
Figure 9-71 Neonatal necrotizing enterocolitis, x-ray.
This 1-month-old female infant was in the intensive care unit for treatment of a complex congenital heart defect when she developed bloody stools. Her x-ray is concerning for necrotizing enterocolitis, with small bubbles consistent with pneumatosis intestinalis and a paucity of luminal bowel gas.A, Supine x-ray. B, Close-up.
A dedicated CT technique called CT enteroclysis can be used to evaluate the small bowel. In this technique, a nasoenteric tube is passed into the small bowel at the duodenal–jejunal junction under fluoroscopic guidance and low-density contrast material (usually water) is rapidly instilled in large volumes to distend the small bowel. This allows identification of abnormal bowel wall thickness and morphology. The technique is not commonly used in the emergency department, partly because of poor patient tolerance of nasoenteric intubation.234
Sensitivity of Diagnostic Modalities for Inflammatory Bowel Disease
The sensitivity and specificity of CT, MRI, ultrasound, and nuclear scintigraphy have been compared in a metaanalysis of prospective studies. Horsthuis et al.235 evaluated 33 studies and found similar diagnostic performance among the modalities on a per-patient basis, as opposed to a per-bowel-segment diagnostic basis (Table 9-18). The authors suggest that MRI and ultrasound be considered for disease monitoring, because these modalities do not result in ionizing radiation exposure.
Table 9-18 Diagnostic Performance of Modalities for Inflammatory Bowel Disease
| Modality | Sensitivity | Specificity |
|---|---|---|
| CT | 84.3% | 95.1% |
| MRI | 93% | 92.8% |
| Nuclear scintigraphy | 87.8% | 84.5% |
| Ultrasound | 89.7% | 95.6% |
Adapted from Horsthuis K, Bipat S, Bennink RJ, Stoker J. Inflammatory bowel disease diagnosed with US, MR, scintigraphy, and CT: meta-analysis of prospective studies. Radiology 247:64-79, 2008.
Other authors have found better sensitivity of dedicated CT techniques such as CT enteroclysis, though the number of included patients is small. Boudiaf et al.236 reported CT enteroclysis to have a sensitivity of 100% and specificity of 95% for small-bowel diseases including small-bowel masses, Crohn’s disease, small-bowel tuberculosis, small-bowel lymphoma, and low-grade small-bowel obstruction. However, the total number of patients in this study was only 107 and represented a range of disease processes, so the sensitivity and specificity of CT for each disease process have wide CIs. In small studies, CT enterography has been shown to correlate with disease progression, may reveal clinically unsuspected bowel strictures, and may rule out clinically suspected strictures.237-238
Computed Tomography Findings of Inflammatory Bowel Disease
Figures 9-67 through 9-70 demonstrate CT changes of inflammatory bowel disease. On CT scan, hallmarks of bowel inflammation include bowel wall thickening (often visible with no contrast agents) and surrounding fat stranding (also visible without contrast agents). Bodily et al.239 found that increased wall thickness and increased mural attenuation correlated with disease activity measured by endoscopy and histology. Lymphadenopathy may be seen. Findings such as free abdominal fluid may be present and should raise concerns about perforation. Inspection for extraluminal air should also be performed. If IV contrast is administered, the bowel wall should be inspected for increased enhancement, consistent with inflammation, infection, or ischemia, and decreased enhancement—which suggests bowel ischemia. Mural pneumatosis suggests regional bowel gangrene, which can occur from ischemia or infection. Occasionally, fistula formation may be visible without enteral contrast, but enteral contrast can assist in the diagnosis by demonstrating extraluminal contrast leak via the fistula. Abscess formation can occur with inflammatory bowel disease and appears the same as described in the earlier section on diverticulitis or in the later section on abscesses.
The “fat halo” sign is a finding of submucosal fat deposition in the bowel wall, associated with Crohn’s disease. A density of less than −10 Hounsfield units is diagnostic. The ileum and ascending colon are the most common locations. It is not a marker of acute inflammation but is thought to occur with increasing duration of disease. In one study, the fat halo sign was seen in only 3.8% of patients with disease duration of less than 1 year and in 21.9% of patients with longer duration of disease.240 Unfortunately, the fat halo sign may also be seen in obese patients with no apparent inflammatory bowel disease and is thus nonspecific.241
Differentiating the cause of bowel abnormalities by CT criteria may be difficult or impossible, and clinical history or other testing such as microbiologic or endoscopic findings may be required. Some clues from CT can narrow the differential diagnosis (Table 9-19). First, diverticuli should be sought; their absence generally rules out diverticulitis. However, sometimes severe inflammation around diverticuli may mask their presence. If previous CT or other imaging from the patient is available, it may be useful to review that imaging for the presence of diverticuli. The bowel should be followed sequentially from the rectum proximally, including both the small and the large bowel, for signs of inflammation. Ulcerative colitis should demonstrate only contiguous regions of inflammation starting at the rectum and moving proximally. In contrast, Crohn’s disease is well known for discontiguous regions of inflammation (sometimes called “skip lesions”), which can involve any part of the intestine from mouth to anus. Vascular disease causing ischemic bowel can appear identical to other inflammatory or infectious abnormalities of bowel; it is discussed in detail in Chapter 11. However, clues to a vascular cause include a region of inflammation or bowel abnormality matching a common vascular distribution. Inspection of blood vessels for filling defects can allow direct detection of stenosis or thrombosis; this requires IV contrast administration. Beware the possibility of bowel ischemia; a noncontrast CT cannot fully discriminate bowel ischemia and inflammatory or infectious bowel disease. Neoplastic disease can result in bowel wall abnormalities and inflammation, sometimes mimicking infection or benign inflammatory bowel disease. Inspection of solid organs may reveal lesions consistent with metastatic disease, suggesting a malignant cause of the bowel abnormalities. Lymphadenopathy can occur with infectious, inflammatory, or malignant disease. Radiation colitis typically causes circumferential bowel wall thickening and adjacent fat stranding, but the appearance is nonspecific. Graft-versus-host disease in patients with a history of bone marrow transplant can result in a similar appearance. 242
Table 9-19 CT Findings Suggesting Inflammatory, Infectious, or Ischemic Colitis, or Colonic Neoplasm
| CT Finding | Implication |
|---|---|
| Bowel wall thickening | Nonspecific |
| Differential bowel wall enhancement | Decreased enhancement suggests ischemia; increased enhancement is nonspecific |
| Diverticuli | Nonspecific—may coexist with other pathology |
| Fat halo sign | Nonspecific—correlates with duration of Crohn’s disease, not acute inflammation |
| Free air | Nonspecific—can occur with ischemia, inflammation, infection, or neoplasm |
| Free fluid | Nonspecific |
| Lymphadenopathy | Lymphadenopathy greater than 1 cm concerning for malignancy rather than infection or inflammation |
| Metastatic disease in solid organs | Suggestive of bowel malignancy, although other acute bowel pathology (e.g., ischemia) and other primary malignancy may be present |
| Skip lesions | Intermittent areas of abnormal bowel, with intervening normal regions, suggestive of Crohn’s disease |
| Vascular lesions | Occlusive mesenteric disease is specific for mesenteric ischemia |
| Vascular territories | Abnormal bowel corresponding to a single vascular territory suggests ischemia |
Infectious enteritis or colitis, including C. difficile colitis, can appear similar to other forms of inflammatory or ischemic disease and should be considered.242 Fishman et al.243 described the CT findings of C. difficile pseudomembranous colitis, including significant bowel wall thickening with a mean thickness of 14.7 mm, and enteric contrast trapped between broad transverse tissue bands. The entire colon or localized segments can be involved. An accordion appearance can be seen, in which the colon wall is so thickened that only a thin string of contrast is seen within the lumen between abutting walls. The appearance is not specific and must be correlated with the clinical presentation. Toxic megacolon from C. difficile or other causes can be evaluated with CT. Perforation and septic thrombosis of the portal system complicating toxic megacolon can be identified with CT.244
Bowel disease can be further evaluated with a variety of modalities when CT does not adequately differentiate disease. Angiography can further explore bowel ischemia. Upper GI or lower GI contrast studies, including enteroclysis and contrast enema, can assist in identifying changes of inflammatory bowel disease. Direct endoscopic visualization can also assist when imaging is nondiagnostic. MRI, ultrasound, and nuclear scintigraphy provide other options but are rarely indicated in the emergency department.
Typhlitis
Typhlitis is cecal inflammation and necrosis first described in leukemia patients but subsequently observed in patients with AIDS, lymphoma, aplastic anemia, immunosuppression for organ transplant, and chemotherapy-induced neutropenia. It can involve the appendix and terminal ileum and, in severe cases, potentially the entire colon. The condition is seen in patients with absolute neutrophil counts less than 1000 per microliter. The exact cause is unknown, although GI mucosal cytotoxicity from chemotherapy agents is thought to play a role in iatrogenic cases. Cytomegalovirus infection has also been implicated. Mucosal ischemia may allow transmural penetration of bacteria, leading to perforation. Intramural hemorrhage may also be seen. Although rare, the condition has a mortality of 40% to 50%, related to sepsis from bowel perforation.
Computed Tomography Findings of Typhlitis
The normal cecum thickness on CT is 3 mm or less, and when the cecum is distended with stool, it normally appears paper thin. The pericecal fat does not normally show inflammatory stranding. With typhlitis, the cecal wall thickens; a symmetrical pattern is common, but eccentric thickening can occur. Pericecal fat stranding is typical. Hemorrhage in the colonic wall may appear higher in attenuation than the normal wall. Complications such as pneumatosis coli, pneumoperitoneum, and abscess may be seen and have the CT characteristics described elsewhere in this chapter. Overall, the CT appearance is nonspecific, resembling other forms of colitis, but is diagnostic in the setting of severe immunocompromise and neutropenia.245-246
Ultrasound of Typhlitis
Ultrasound can be used to diagnose typhlitis and demonstrates decreased or absent peristalsis, a thickened and hypoechoic bowel wall, and a thickened and echogenic mucosa. Ultrasound findings should be augmented with CT to evaluate for complications such as abscess or perforation.
Bowel Ischemia
Mesenteric ischemia encompasses a family of disorders, including acute thrombosis of the SMA, chronic mesenteric artery thrombosis, ischemic colitis, portal vein thrombosis, and ischemia caused by mechanical effects such as bowel obstruction or volvulus (described earlier). These conditions are not accurately diagnosed by x-ray, which only rarely shows findings of advanced disease such as pneumatosis intestinalis from bowel infarction. Historically, catheter angiography was used to identify vascular occlusions and stenoses, but modern CTA has largely replaced this. CT with IV contrast has the advantage of identifying other causes of acute abdominal pain, as well as secondary bowel injury related to vascular occlusion. MRI is rarely used in the emergency department to identify bowel ischemia but is comparable in performance to CT and can be used when contraindications to CT exist. Imaging of bowel ischemia is discussed in detail in Chapter 11.
Hepatobiliary Imaging
In the sections that follow, we discuss the imaging of hepatobiliary disorders, including cholelithiasis, cholecystitis, choledocholithiasis, biliary ductal obstruction, and biliary ductal leaks. Figures 9-72 through 9-110demonstrate hepatobiliary imaging with a variety of modalities.
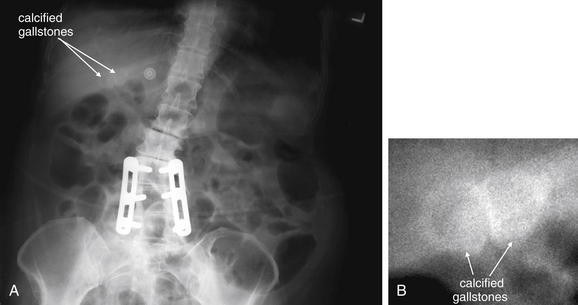
Figure 9-72 X-ray demonstrating calcified gallstones.
X-ray is a poor modality for diagnosis of biliary disease, although gallstones are sometimes incidentally noted. X-ray typically does not provide the necessary additional information to differentiate asymptomatic gallstones, symptomatic gallstones, or acute cholecystitis. Additional imaging with ultrasound, nuclear medicine studies, or computed tomography is usually required.A, X-ray. B, Close-up. The contrast in B has been adjusted to improve the visibility of the gallstones.
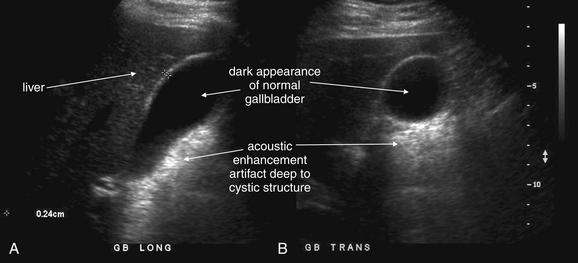
Figure 9-73 Normal gallbladder, ultrasound.
The normal gallbladder is thin-walled, hypoechoic (black, with no internal echoes), and has no pericholecystic fluid (which would appear black with ultrasound). Although the exact size and position of the gallbladder varies from patient to patient, in general it is a pear-shaped structure, elliptic in the long-axis view (A), and circular in short axis (B). It narrows to a neck (infundibulum) at one end, leading to the cystic duct. At this end, it may have one of more folds that are normal anatomic variants. Normal liquid bile is an excellent medium for sound transmission without reflection, resulting in the black appearance of the normal gallbladder. This in turn leads to an image artifact, called acoustic enhancement. This is an artificial brightening of the image deep to any cystic structure. This is not caused by the tissues deep to the gallbladder being more echogenic. Rather, more sound is transmitted through the gallbladder than through solid tissues at a similar depth. Put another way, the gallbladder and other cystic structures attenuate ultrasound transmission to a lesser extent than do solid tissues. As a consequence, more ultrasound signal remains to be reflected back by deep tissues. Ultrasound software is typically written to brighten the tissue appearance to account for an expected uniform loss of signal with increasing depth. When less signal is lost than is expected, the software over-corrects, resulting in acoustic enhancement artifact.
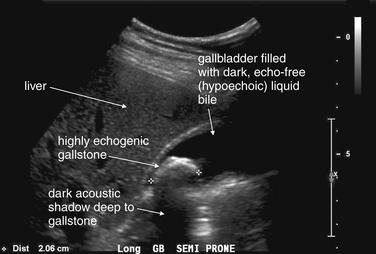
Figure 9-74 Cholelithiasis, ultrasound.
The standard modality for assessment of gallbladder pathology is ultrasound. Cholelithiasis, the presence of gallstones, is demonstrated readily on ultrasound. Liquid bile is black on ultrasound because liquid is an excellent medium for sound transmission, with little internal reflection (echoes). Gallstones cause significant reflection of sound waves, making them quite bright or echogenic. In addition, because sound waves are mostly reflected and not transmitted well beyond the location of the stone, the stone typically casts a black acoustic shadow on ultrasound. Gallstones may be single or multiple. Normally cholelithiasis without cholecystitis shows gallstones without accompanying gallbladder wall thickening, pericholecystic fluid, or sonographic Murphy’s sign.Here, a classic example of a gallstone is shown. This large gallstone (2 cm) has a highly echogenic surface, with acoustic shadowing occurring deep to the gallstone.
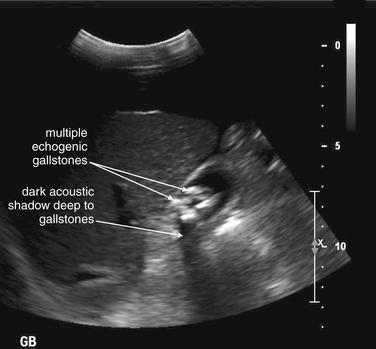
Figure 9-75 Cholelithiasis, multiple stones, ultrasound.
Stones may vary in size from sandlike (sometimes called “sludge”), to pea-sized (“gravel”), to quite large “stones.” This patient has multiple smaller stones, piled upon one another, compared with the previous patient, in Figure 9-74. These stones share the same highly echogenic appearance and posterior acoustic shadowing on ultrasound.
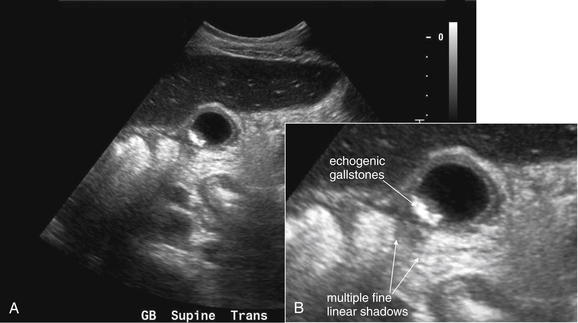
Figure 9-76 Cholelithiasis, multiple stones, ultrasound.
A, Short-axis (transverse) view of the gallbladder. Fine, sandlike gallstones are echogenic but cast relatively small shadows. A close-up (B) shows the thin linear shadows cast by these stones. This gallbladder also shows abnormal wall thickness, which is discussed in a future figure.
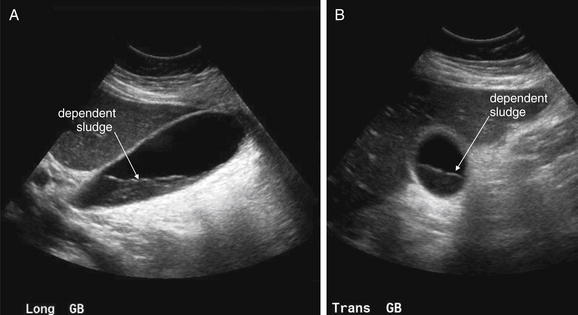
Figure 9-77 Cholelithiasis, multiple stones and sludge, ultrasound.
Here, long-axis (A) and transverse (B) views of the gallbladder show sludge in the gallbladder. This material is denser than liquid bile but does not have discrete stones. Sludge may be asymptomatic or could be present in a case of acalculous cholecystitis. Sludge typically does not cast an acoustic shadow. This patient underwent a CT scan, which showed additional findings suggesting acute cholecystitis, including fat stranding in the region of the gallbladder.
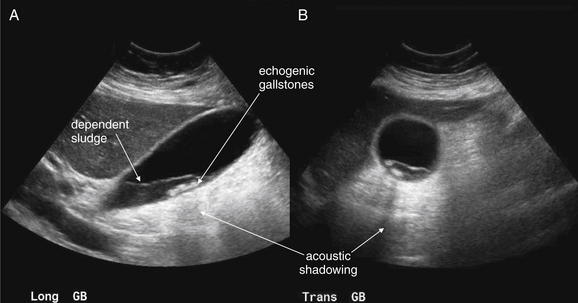
Figure 9-78 Cholelithiasis, multiple stones and sludge, ultrasound.
Same patient as Figure 9-77. Sludge and stones can coexist. Dependent sludge is present, and small stones have settled to the bottom of the sludge layer. Long-axis (A) and transverse (B) views both show these findings. Posterior acoustic shadowing is seen in both views.
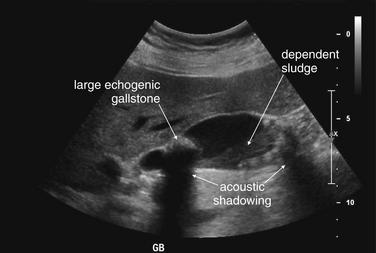
Figure 9-79 Cholelithiasis, multiple stones and sludge, ultrasound.
Sludge and stones can coexist. In this patient, not currently complaining of any abdominal pain, large and small stones are present, along with sludge. But no pericholecystic fluid or wall thickening is present, and the patient does not have a sonographic Murphy’s sign. The patient does not have acute cholecystitis.
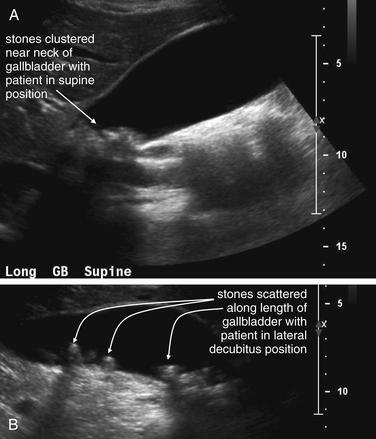
Figure 9-80 Cholelithiasis, mobile stones, ultrasound.
Stones are typically mobile, shifting in the gallbladder if the patient changes position, such as rolling from a supine to a decubitus position. In contrast, gallbladder polyps are not mobile, because they are fixed to the gallbladder wall with a stalk. A gallstone may also be immobile if it is lodged in the neck (infundibulum) of the gallbladder—a setup for cholecystitis even if other sonographic findings are not yet present.A, B, Long-axis views of the gallbladder. In this patient, gallstones are clustered near the neck of the gallbladder when the patient is supine (A). In the next image (B), the patient has rolled to a left lateral decubitus position, scattering the stones along the length of the gallbladder. These stones are not impacted.
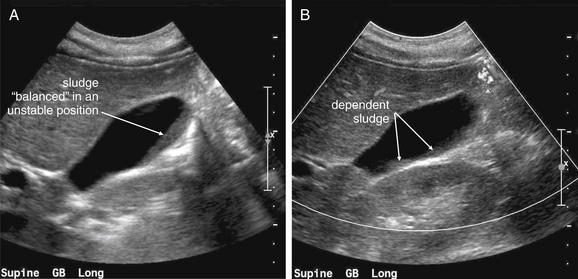
Figure 9-81 Cholelithiasis, mobile sludge, ultrasound.
Sludge is also freely mobile, settling to a dependent position as the patient is repositioned.A, B, Long-axis views of the gallbladder. In this patient, sludge is seen sloped in an unstable position along the wall of the gallbladder. A moment later, a “landslide” occurs, and the sludge is seen settled in a more dependent position.
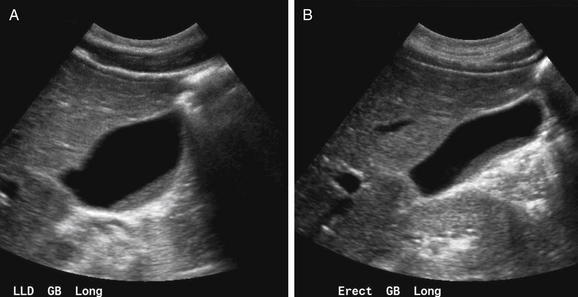
Figure 9-82 Cholelithiasis, mobile sludge, ultrasound.
A, B, Long-axis views of the gallbladder. In this patient, sludge is seen in a dependent position with the patient positioned in left lateral decubitus (A) and erect (B) positions.
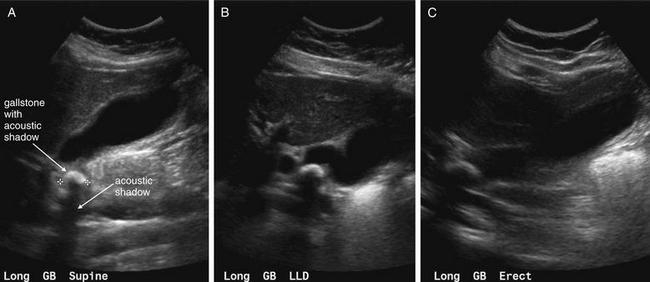
Figure 9-83 Cholelithiasis, immobile stones, ultrasound.A, Long-axis view of the gallbladder with the patient supine. B, Long-axis view of the gallbladder with the patient in a left lateral decubitus position. C, Long-axis view of the gallbladder with the patient erect.In this 38-year-old presenting with abdominal pain and vomiting, a single large gallstone is seen in the neck of the gallbladder. It remains in the same location as the patient is taken from supine (A), to a left lateral decubitus position (B), and even to an erect position (C). This suggests impaction of the gallstone in the gallbladder neck, which will lead to acute cholecystitis. Cholecystectomy was performed, confirming the ultrasound findings.
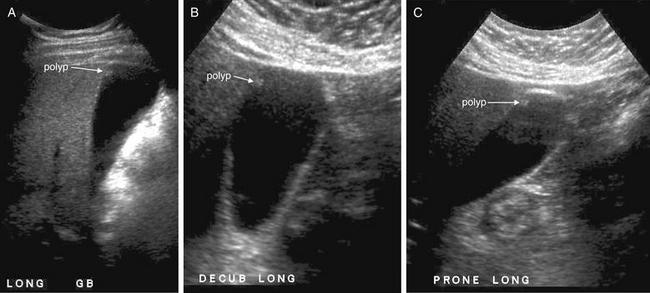
Figure 9-84 Gallbladder polyps, ultrasound.
When echogenic foci are seen within the gallbladder, gallbladder polyps should also be considered. These can strongly resemble gallstones, but several features may distinguish them. First, because they are comparatively lucent to sound waves, polyps usually do not cast a posterior acoustic shadow, in contrast to gallstones that most often do. Second, polyps are immobile, because they are attached to the gallbladder mucosa. Gallstones may be immobile as well, but usually only when they are lodged in the neck of the gallbladder. In contrast, polyps remain immobile as the patient is moved from supine through decubitus and upright positions, even when the polyps are located in the fundus of the gallbladder.In these long-axis views of this patient, an echogenic focus is seen in the fundus of the gallbladder. It does not move as the patient transitions from supine (A), to a left lateral decubitus position (B), and finally to a prone position (C). This is a gallbladder polyp. This image has been adjusted to accentuate the low-density polyp with its faint echo, resulting in a noisy appearance with other internal echoes seen in the gallbladder.
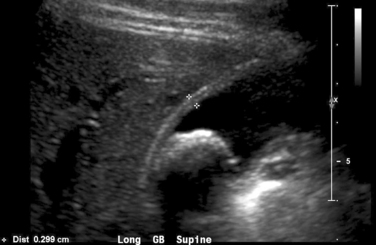
Figure 9-85 Cholelithiasis—assessing wall thickness, ultrasound.
The normal gallbladder wall thickness is less than 3 mm, a pencil-thin hyperechoic appearance to the eye without measurement. Thickening greater than 4 mm is suggestive of acute cholecystitis—although a rule of thumb is that a normal gallbladder wall is hardly visible. Thickening of the gallbladder wall normally occurs after eating, as a consequence of gallbladder contraction. This can lead to a false-positive ultrasound, suggesting cholecystitis when inflammation is not present. Ultrasound technicians typically ask that the patient not take anything by mouth for 4-6 hours before ultrasound to avoid this problem. However, an early ultrasound with a normal wall can exclude cholecystitis, and a markedly thickened wall with other features of cholecystitis can rule in the disease even if the patient has not been kept from oral ingestion.
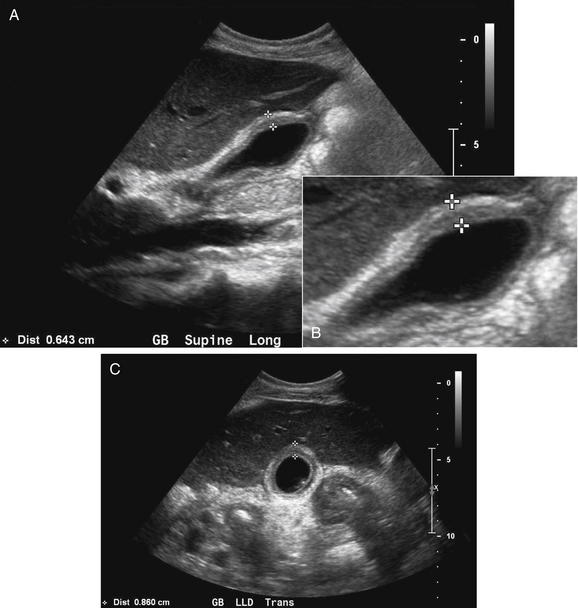
Figure 9-86 Acute cholecystitis with gallbladder wall thickening, ultrasound.
A, Long-axis view of the gallbladder. B, Close-up from A. C, Transverse view.Edema and inflammation of the gallbladder wall thickens it, resulting in an abnormal ultrasound. This patient has significant thickening of the gallbladder wall, more than twice that of normal. The wall has a banded appearance, illustrated in B. As discussed in Figure 9-85, normal contraction of the gallbladder after a meal thickens the gallbladder wall and can cause a false-positive ultrasound.
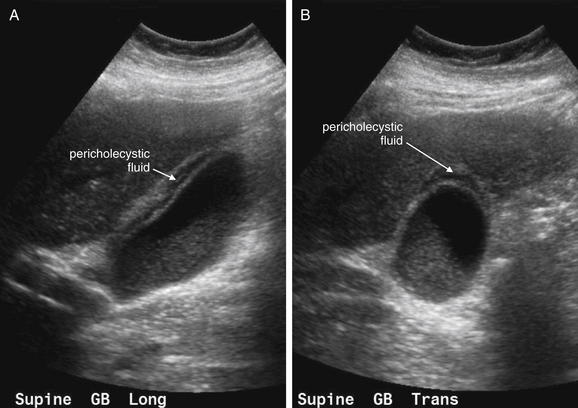
Figure 9-87 Acute cholecystitis with gallbladder wall thickening and pericholecystic fluid, ultrasound.
Pericholecystic fluid, or fluid in the gallbladder fossa, is a sign of acute cholecystitis. Alone, it is neither specific nor sensitive. In combination with other findings, it gains significance—this patient has gallbladder sludge, as described in earlier figures. As we saw in an earlier figure, cholecystitis may be present without pericholecystic fluid. In addition, disease states with diffuse ascites (cirrhosis, congestive heart failure, malignancy, and hypoalbuminemia) may result in pericholecystic fluid without cholecystitis.A, Long-axis view of the gallbladder. B, Short-axis view.
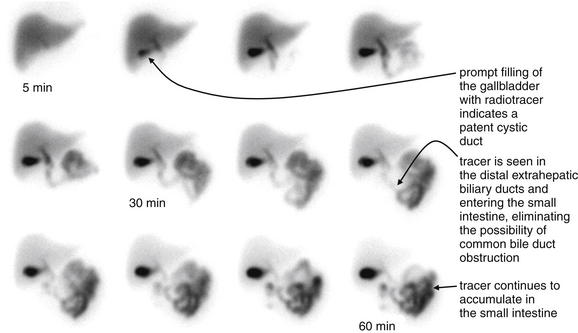
Figure 9-88 Hepatobiliary iminodiacetic acid (HIDA) scan.
When ultrasound or CT is nondiagnostic, hepatobiliary nuclear scintigraphy can be useful to detect acute cholecystitis and obstruction of the biliary ducts. In this imaging test, a radiopharmaceutical (usually technetium-99-labeled HIDA) is administered intravenously. A gamma camera is positioned over the patient to detect emitted radiation, and a series of images are generated at 5-minute intervals over 1 hour or longer. The radiopharmaceutical is rapidly taken up by the liver and excreted in bile. In a normal study, this radiolabeled bile becomes visible in all bile-containing structures: the liver, gallbladder, the intrahepatic and extrahepatic biliary ducts, and ultimately the small intestine as bile enters the bowel through the sphincter of Oddi. In acute cholecystitis, the obstructed gallbladder does not fill with radiolabeled bile and thus does not appear. In chronic cholecystitis, the gallbladder may fill but not empty. In a case of distal biliary ductal obstruction, radiolabeled bile does not move beyond the point of obstruction, so structures beyond the obstruction do not appear on the images. Cholecystokinin can be administered to stimulate gallbladder contraction. A gallbladder that contracts and empties normally shows progressive loss of radiotracer.
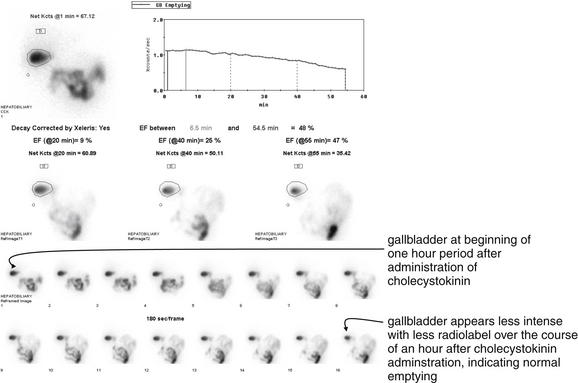
Figure 9-89 Hepatobiliary iminodiacetic acid (HIDA) scan.
In the same patient as Figure 9-88, cholecystokinin was administered at 1 hour, and additional images were acquired over the next hour. There is progressive loss of radiotracer from the gallbladder, indicating emptying of the gallbladder. A quantitative measurement can be made, giving the gallbladder “ejection fraction.”
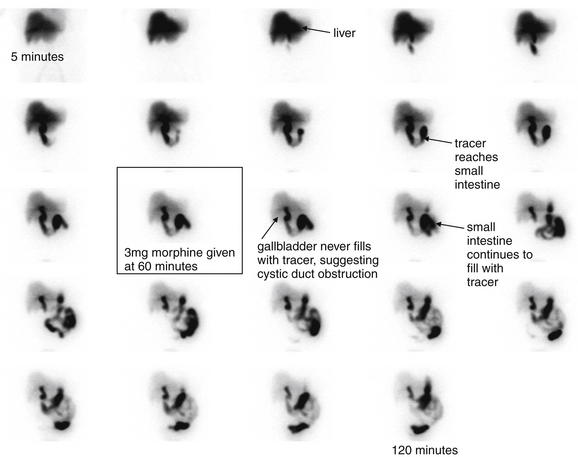
Figure 9-90 Abnormal hepatobiliary iminodiacetic acid (HIDA) scan consistent with acute cholecystitis (images taken at 5-minute intervals).
In acute cholecystitis, the obstructed gallbladder does not fill with radiolabeled bile and thus does not appear. In this patient, the liver intensifies with radiolabel and labeled bile enters the extrahepatic bile ducts and progresses to the small intestine. However, the gallbladder does not appear, suggesting obstruction of the cystic duct and cholecystitis. Compare with the normal images in Figures 9-88 and 9-89. Interestingly, ultrasound in this patient was read as negative for cholelithiasis or cholecystitis. CT performed after ultrasound showed a distended gallbladder with slight thickening of the wall and trace pericholecystic fluid. In addition, the liver parenchyma was noted to be enhancing around the gallbladder, sometimes seen in acute cholecystitis. This prompted a HIDA scan. Morphine was administered in an attempt to constrict the sphincter of Oddi to increase back-filling of the gallbladder through the cystic duct, with no apparent effect. Cholecystectomy was performed, and pathology showed chronic cholecystitis and a single gallstone.
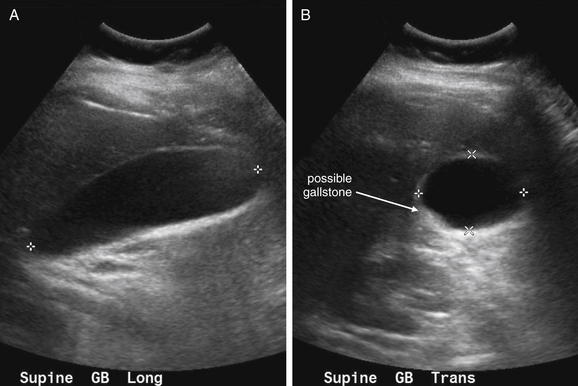
Figure 9-91 Ultrasound from patient with abnormal hepatobiliary iminodiacetic acid (HIDA) scan consistent with acute cholecystitis.
Same patient as in Figure 9-90. This ultrasound was performed before a HIDA scan and was interpreted as normal—although in retrospect a possible stone is seen in the gallbladder. No definite posterior acoustic shadowing is seen. The gallbladder wall appears of normal thickness, and no pericholecystic fluid is present.A, Long-axis view of the gallbladder. B, Short-axis view.
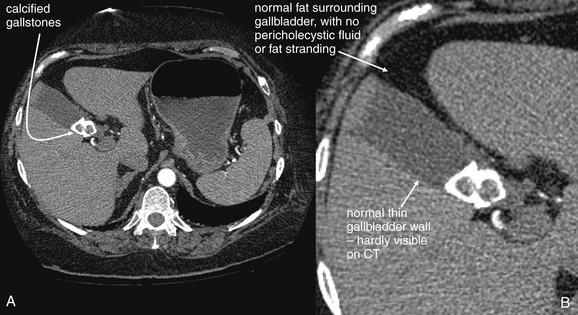
Figure 9-92 Calcified gallstones, seen on chest CT with IV contrast.
These gallstones were noted on the lower slices of a chest CT with IV contrast performed to assess for possible pulmonary embolism. They had been observed as well on an earlier chest x-ray. Gallstones may be seen on CT scan, depending on the degree on calcification and density relative to liquid bile. These gallstones are more calcified than most, making them readily visible.This patient has no other findings to suggest acute cholecystitis by CT. The gallbladder wall is extremely thin, and no fluid surrounds the gallbladder.
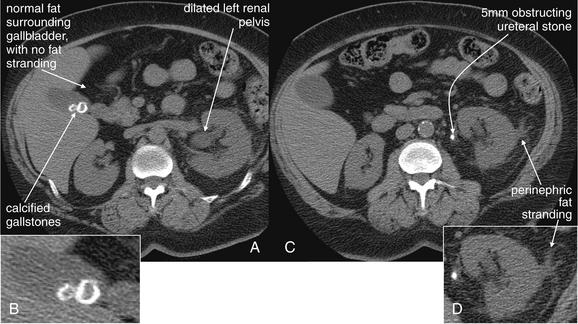
Figure 9-93 Noncontrast CT (“renal colic protocol CT”) showing cholelithiasis.
This figure demonstrates two important points. First, some gallstones are visible on noncontrast CT—CT with no oral, intravenous, or rectal contrast. The reason is simple: Gallstones can be detected by the difference in density between liquid bile and solid stones or sludge. The density of these is not affected by contrast, because typical CT contrast agents do not enhance bile or stones (although special contrast agents for bile are available).Second, gallstones detected on CT are not necessarily the acute cause of the patient’s pain or other symptoms. Other pathology must be considered and sought. In this patient, left flank pain was the chief complaint. Although two calcified gallstones are readily seen, the adjacent fat shows no inflammatory stranding. The left kidney shows enlargement of the renal pelvis (pelviectasis) and perinephric stranding, and an obstructing 5-mm ureteral stone is seen a few slices caudad—the cause of this patient’s pain.A, C, Axial images. B, D, Close-ups from A and C, respectively.
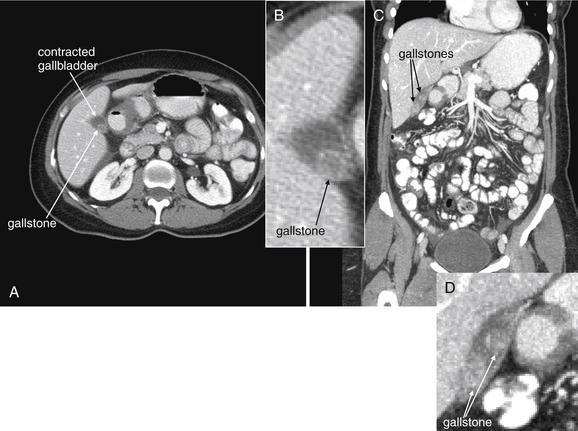
Figure 9-94 Cholelithiasis, CT with oral and IV contrast, soft-tissue window.
A, Axial image demonstrating incidental cholelithiasis. B, Close-up from A. The gallbladder is not dilated, and no free fluid is present in the gallbladder fossa. No inflammatory stranding is seen. C, Coronal view from the same patient. D, Close-up from C.
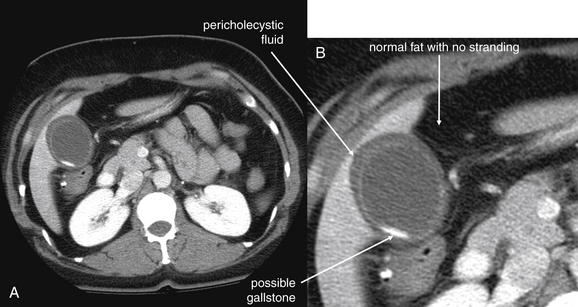
Figure 9-95 CT from a patient with an abnormal hepatobiliary iminodiacetic acid (HIDA) scan consistent with acute cholecystitis.
See also this patient’s HIDA scan in Figure 9-90 and ultrasound in Figure 9-91.This CT was performed following ultrasound and before a HIDA scan and was interpreted as abnormal, with pericholecystic fluid and a likely gallstone. However, the gallbladder wall itself appears thin, and the adjacent fat shows no stranding. The take-home point is that no diagnostic imaging test is perfect. When clinical examination and history suggest pathology, care must be taken not to rely excessively on apparently normal or nondiagnostic imaging. The HIDA scan suggested acute cholecystitis, and surgery confirmed chronic cholecystitis.A, Axial image. B, Close-up.
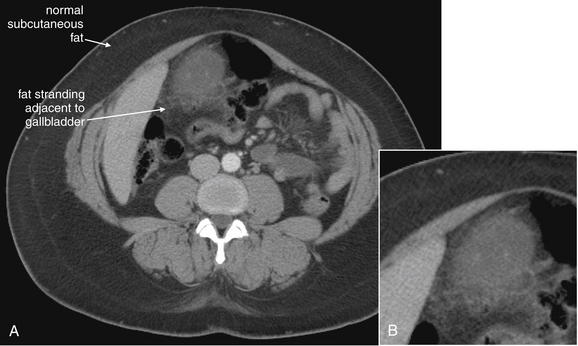
Figure 9-96 CT showing cholecystitis.
In this 37-year-old woman with choledocholithiasis, stranding is present in mesenteric fat adjacent to the gallbladder. This supports a diagnosis of cholecystitis, despite the absent of gallbladder wall thickening on her ultrasound. Operative and pathology findings confirmed the diagnosis.A, Axial image, with intravenous contrast. B, Close-up.
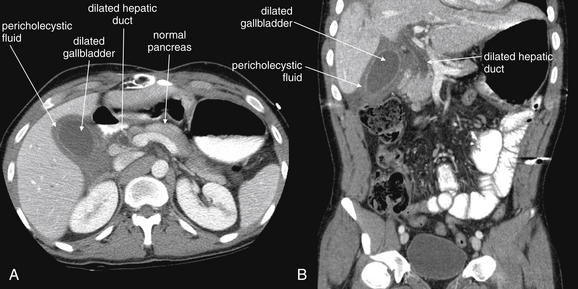
Figure 9-97 Cholecystitis and choledocholithiasis, CT with IV and oral contrast, soft-tissue window.
This scan demonstrates cholecystitis. Findings include a dilated gallbladder and pericholecystic fluid. No stones are seen within the gallbladder—a finding that may be caused by gallstones that are isodense with liquid bile, by acalculous cholecystitis, or by choledocholithiasis with an obstructing gallstone outside of the gallbladder in the cystic duct or common bile duct. In both the axial (A) and the coronal (B) images, dilated extrahepatic bile ducts are visible, consistent with distal obstruction. This patient underwent endoscopic retrograde cholangiopancreatography that confirmed an 8-mm obstructing stone in the common bile duct.
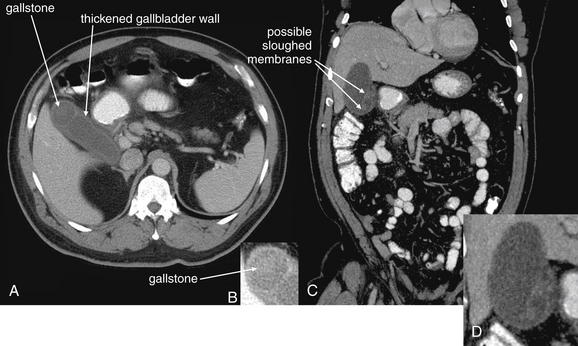
Figure 9-98 Acute cholecystitis, CT with IV and oral contrast, soft-tissue window.
CT demonstrating acute cholecystitis with visible gallstones. As in our prior examples, the gallbladder wall is thickened, and the gallbladder is dilated. Gallstones are visible as hyperdensities within the gallbladder. The density of gallstones on CT may vary from isodense with liquid bile to hyperdense. When calcified, gallstones are quite hyperdense on CT.A, Axial image. B, Close-up from A. C, Coronal image. D, Close-up from C. The more linear appearance in D may indicate sloughed membranes within the gallbladder, a finding of acute cholecystitis.
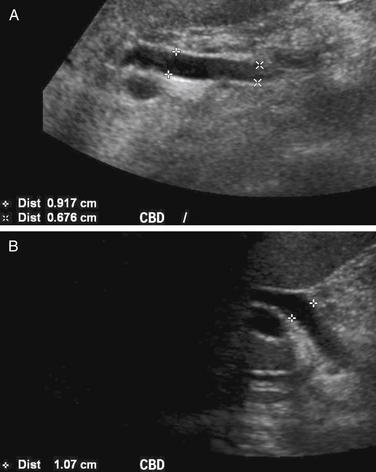
Figure 9-99 Biliary ductal dilatation, ultrasound.
A normal common bile duct (CBD) measures 5 mm or less, although some increase in size with age can be normal. Dilatation of the CBD is concerning for distal obstruction, with possible causes including CBD stone, stricture, extrinsic compression (e.g., from a pancreatic head mass), or intrinsic narrowing from a neoplasm such as cholangiocarcinoma. The CBD can be measured by ultrasound, computed tomography, or magnetic resonance imaging. A cholangiogram can also be performed, using endoscopic instillation of contrast material through the sphincter of Oddi by intraoperative cholangiography, or by percutaneous injection into the biliary ducts.A, B, Long-axis views of the CBD.
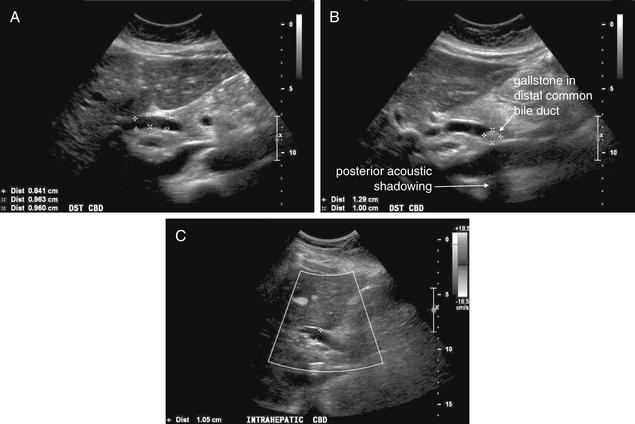
Figure 9-100 Common bile duct dilatation with choledocholithiasis, ultrasound.
As described earlier, common bile duct dilatation may be a normal age-related phenomenon or may be caused by intrinsic or extrinsic obstruction of the duct. In this 37-year-old female with known cholelithiasis, extrahepatic biliary ductal dilatation was noted on ultrasound. Her common bile duct measures nearly 1 cm, clearly abnormal given her age. Careful inspection of the duct showed a 1-cm echogenic structure with posterior shadowing—a gallstone in the common bile duct, or choledocholithiasis. This is an important finding that requires either endoscopic retrograde cholangiopancreatography or surgery for stone removal. The intrahepatic biliary ducts were also noted to be enlarged on this patient’s ultrasound.A, B, Long-axis views of the common bile duct. C, Long-axis view with Doppler ultrasound. Doppler helps to identify vascular structures with flow. The bile duct does not appear to have flow, because bile flow is normally quite slow and is not present in this obstructed duct. The intrahepatic common bile duct is dilated here.
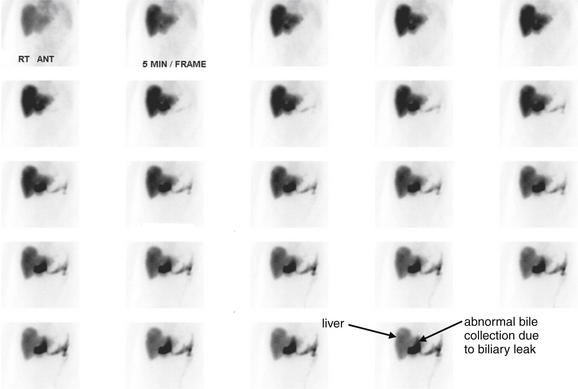
Figure 9-101 Abnormal hepatobiliary iminodiacetic acid (HIDA) scan consistent with bile leak.
A HIDA scan is not just a test for cholecystitis and biliary obstruction. In a postoperative patient, HIDA can assess for a bile leak. In this patient, radiotracer accumulates in an abnormal position overlying the liver and never appears to fill the bowel. This is concerning for a bile leak. Why use HIDA for this purpose? Why wouldn’t CT be a better test? This is a complex patient who has undergone a liver and kidney transplant. He did undergo CT, which showed massive ascites (Figure 9-102). Bile leaking into ascites cannot be recognized on CT, because bile and ascites are of similar fluid density. Moreover, as they mix, they become identical in density. In addition, as a result of the patient’s recent renal transplant, intravenous contrast was not given, though it is doubtful this would have changed the diagnostic ability of the CT. Here, HIDA played a key role in diagnosis.
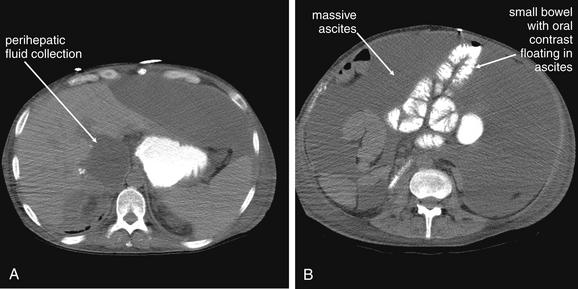
Figure 9-102 CT in patient with bile leak shown on hepatobiliary iminodiacetic acid (HIDA) scan.
The patient in Figure 9-101 had a bile leak demonstrated by HIDA scan. CT was performed before the HIDA scan but was nondiagnostic. A fluid collection is seen adjacent to the transplanted liver, but the cause is unclear. The patient has massive ascites, so the perihepatic fluid could be ascites, bile, blood, or an abscess—all essentially indistinguishable by CT. A, B, Axial images with oral contrast but no intravenous (IV) contrast. IV contrast might help to identify an abscess, but the patient had undergone recent renal transplant and IV contrast was withheld because of a creatinine of 1.4 mg/dL. HIDA scan was key to the diagnosis by confirming bile leak. Because the injected radiotracer accumulates only in bile, the collection was confirmed to be biliary. Paracentesis had been nondiagnostic because the ascites diluted the bile substantially.
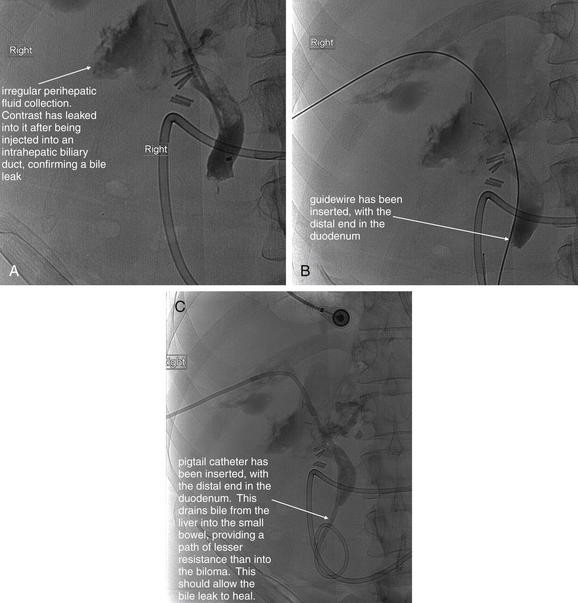
Figure 9-103 Cholangiogram for bile leak.
A, B, C, Fluoroscopic cholangiogram images. Same patient as in Figures 9-101 and 9-102. Cholangiography is not a common emergency department diagnostic imaging procedure, but this case concludes with the patient undergoing diagnostic and therapeutic cholangiography. This procedure is included to illustrate the importance of making the correct diagnosis to treat the patient appropriately. Wise use of diagnostic imaging led to the correct diagnosis. Although cholangiography could have been used instead of a hepatobiliary iminodiacetic acid (HIDA) scan to make the diagnosis, the HIDA scan is noninvasive, whereas cholangiography is an invasive procedure performed by an interventional radiologist. In this procedure, an intercostal location in the right midaxillary line was sterilely prepped and a needle was introduced through the liver into a bile duct under fluoroscopic guidance. Contrast injection confirmed intrabiliary puncture, and a guidewire was advanced into the biliary system, common bile duct, and duodenum. A pigtail catheter was then placed over the guidewire to drain the collection. A, The image shows irregular extravasation of injected contrast into the biloma. B, A guidewire has been placed. C, The pigtail catheter is present.
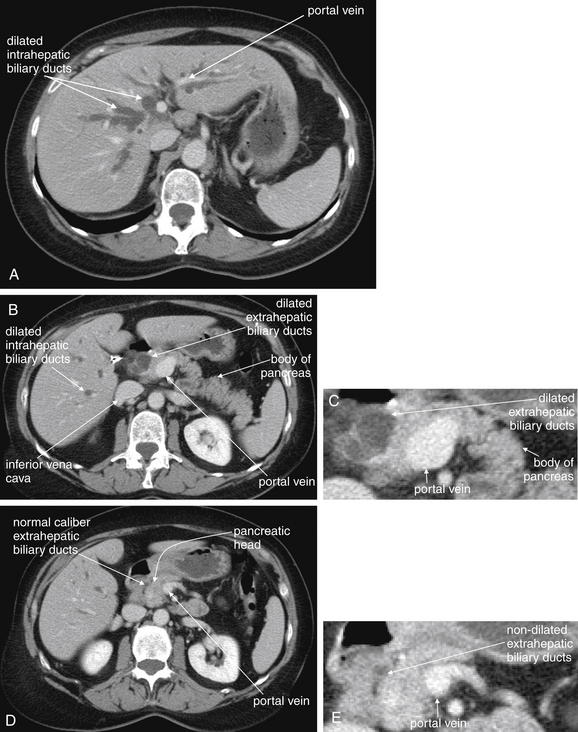
Figure 9-104 Biliary tract obstruction, CT with IV and oral contrast, soft-tissue window.
Intra and extrahepatic biliary ductal dilatation from cholangiocarcinoma. The patient presented with painless jaundice and had a remote history of cholecystectomy. The scan suggests that the obstruction is in the distal bile duct, because the proximal extrahepatic biliary ducts and intrahepatic biliary ducts are markedly dilated. The patient was found to have a cholangiocarcinoma resulting in a biliary stricture. A, B, D, Axial slices. C, E, Close-ups from B and D, respectively. B and C show a more caudad slice relative to A. Biliary ducts are dilated throughout the liver. These can be distinguished from vascular structures such as portal veins on this scan with intravenous contrast. The vascular structures are strongly enhancing (white) because of the injected contrast. The biliary ducts have a dark gray appearance on this soft-tissue window because they contain low-density fluid—bile. In cross section, some of these ducts have a circular appearance similar to hepatic cysts, but they can be followed through multiple slices, revealing their tubular shape. The pancreas is seen draped anterior to the portal vein. D and E, more caudad slice compared with B, show extrahepatic ducts that have assumed a normal nondilated size. The pancreatic head lies just right of the portal vein. The transition zone where the biliary ducts lose their dilatation and assume a normal size marks the location of the obstruction, stricture, or external compression.
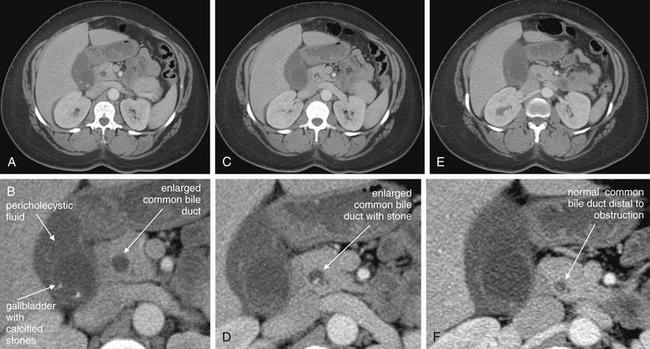
Figure 9-105 CT with IV contrast of choledocholithiasis and biliary ductal dilatation.
In this 37-year-old female, a gallstone has obstructed the distal common bile duct—a condition called choledocholithiasis. In this series of slices, moving from cephalad (A) to caudad (E), the common bile duct is seen to be enlarged at and above the level of the obstructing stone and smaller in caliber below the obstruction. Interestingly, this patient has evidence of cholecystitis by CT (pericholecystic fluid), which was not recognized by ultrasound the same day. Operative findings and pathology results confirmed cholecystitis. A, C, E, Progressively more caudad axial CT slices. B, D, F, Close-ups from A, C, E, respectively.
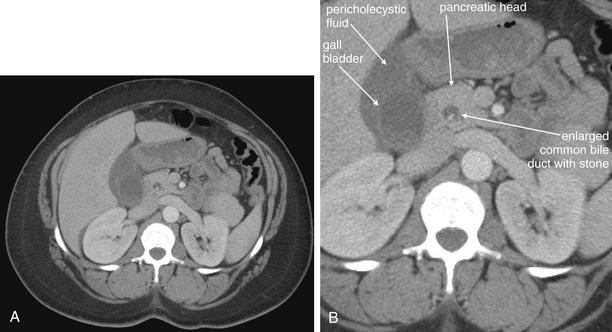
Figure 9-106 CT with IV contrast of choledocholithiasis and biliary ductal dilatation.
Same patient as Figure 9-105. The gallbladder with dependent sludge or gallstones is visible, and pericholecystic fluid is present. To the patient’s left, the common bile duct is seen in cross section in its normal position within the pancreatic head. A bright stone is visible in the duct. Notice how the common bile duct is filled with bile, which has the same fluid density as bile in the gallbladder. The stone in this case is denser than liquid bile, likely partially calcified. A, Axial image. B, Close-up.
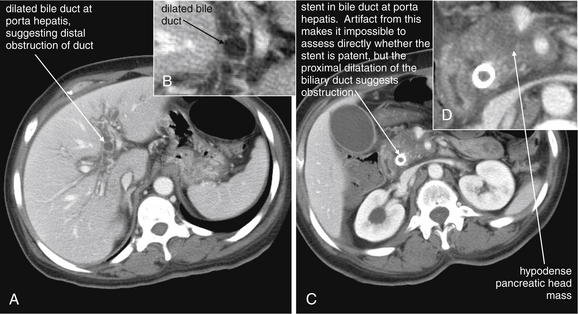
Figure 9-107 Ascending cholangitis, dilated bile ducts, CT with IV contrast.
Obstruction of the biliary ducts can lead to devastating ascending infection—cholangitis. This is largely a clinical diagnosis, because classic imaging findings such as pneumobilia can lag behind clinical deterioration. Fever, jaundice, abdominal pain, and altered mental status should prompt immediate antibiotic therapy and surgical consultation, regardless of imaging findings. A, C, Axial images. B, D, Close-ups from A and C, respectively. This patient with a known pancreatic mass and a previously placed biliary stent presented with right upper quadrant abdominal pain. She became febrile during her emergency department stay. Her scan shows biliary ductal dilatation, suggesting obstruction of her stent. In addition to antibiotic therapy, a procedure to relieve obstruction is needed. Her blood cultures subsequently grew Escherichia coli, consistent with ascending cholangitis.
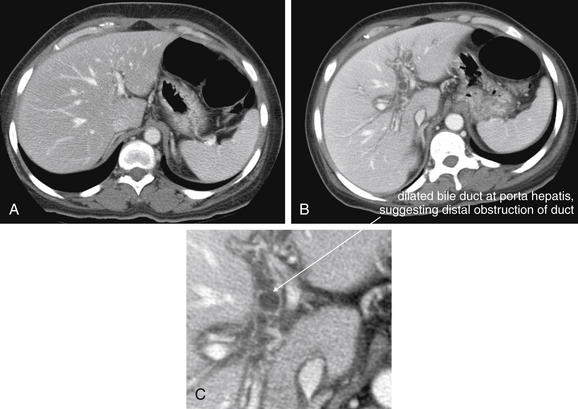
Figure 9-108 Comparison of dilated and nondilated intrahepatic biliary ducts, CT with IV contrast.
Same patient as in Figure 9-107. Patient with stent in the common bile duct for treatment of malignant biliary stricture. A, The stent (not seen in this axial slice because it lies in the extrahepatic biliary ducts) is patent and the intrahepatic biliary ducts are not dilated. They are essentially invisible on this scan because they are draining normally and are empty of bile. B, The stent has become obstructed, and the intrahepatic biliary ducts are becoming dilated. C, Close-up from B. The patient became febrile, and blood cultures grew Escherichia coli, consistent with ascending cholangitis. Biliary evidence of biliary ductal dilatation suggests obstruction, and ascending cholangitis should be suspected if clinical features are present, even if imaging does not show dramatic findings such as pneumobilia.
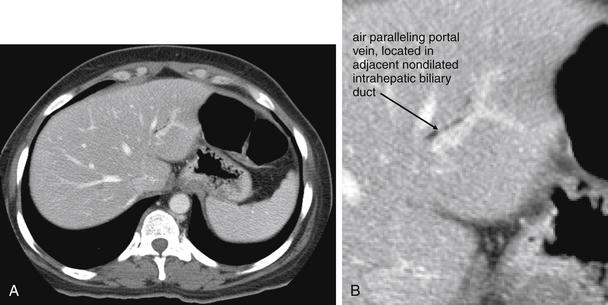
Figure 9-109 Pneumobilia, CT with IV contrast.
This patient’s CT demonstrates pneumobilia (air in the biliary tree), which is worrisome for ascending cholangitis if abdominal pain, fever, jaundice, leukocytosis, altered mental status, or signs of biliary obstruction are present. Air is black on CT. A, Axial image. B, Close-up. In this patient, this pneumobilia is iatrogenic, caused by placement of a biliary stent 15 days prior. The patient has adenocarcinoma of the pancreatic head that had resulted in a stricture of the common bile duct. There is no biliary ductal dilatation (see Figures 9-104 through 9-108 demonstrating this), implying that the biliary stent is not obstructed.
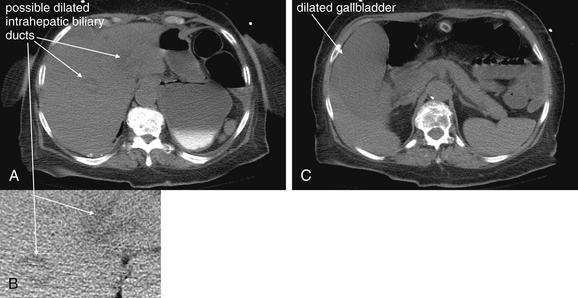
Figure 9-110 Ascending cholangitis, CT without IV contrast, no biliary air.
This patient presented with altered mental status, hypotension, fever, and a history of abdominal pain. CT without IV contrast was performed because the patient was in acute renal failure. CT showed a markedly dilated gallbladder. Ascending cholangitis was suspected—a percutaneous cholecystostomy tube was placed by interventional radiology. Fluid from that drain, as well as blood cultures, grew Enterococcus faecalis. CT findings in this patient are more difficult to recognize in the absence of IV contrast. Without IV contrast, the liver parenchyma, vessels, and biliary tree are nearly isodense (fluid and tissue densities). If IV contrast had been given, the liver parenchyma would have enhanced, making the nonenhancing biliary tree more evident. A, C, Axial images. B, Close-up from A. A, The biliary tree is slightly hypodense relative to the liver parenchyma and appears to be dilated. B, The gallbladder is hypodense relative to the liver and appears markedly enlarged. Again the patient had ascending cholangitis without classic features such as biliary air, which would have been visible (black) on this CT without IV contrast. The patient did receive oral contrast through her gastrostomy tube, which does not contribute to the diagnosis because it is pooled in the stomach.
Cholelithiasis and Cholecystitis
Cholelithiasis and its complications can be imaged with multiple modalities, including ultrasound, nuclear scintigraphy, CT and MRI. Although x-rays occasional demonstrate calcified gallstones (see Figure 9-72), they lack sensitivity or specificity for cholecystitis and should not be used for this diagnosis.247 Clinical signs and symptoms and laboratory testing are relatively nonspecific and insensitive, meaning that imaging is often necessary to exclude or confirm disease.248 Gruber et al.249 found that 71% of patients with nongangrenous cholecystitis were afebrile and 32% lacked leukocytosis. In gangrenous cholecystitis, 59% of patients were afebrile and 27% lacked leukocytosis.
Ultrasound of Cholelithiasis and Cholecystitis
Ultrasound is commonly used for the diagnosis of cholelithiasis and cholecystitis and is increasingly performed by emergency physicians. The test is portable, requires no radiation exposure, and can rapidly provide diagnostic information. Ultrasound findings of cholecystitis must be differentiated from those of cholelithiasis—because the presence of gallstones is not sufficient for the diagnosis of cholecystitis. Although gallstones are present in most cases of cholecystitis, acalculous cholecystitis can occur in critically ill patients, particularly following burns or trauma, during sepsis, and while receiving total parenteral nutrition.250 Currently ultrasound is recommended by the ACR as the most appropriate imaging test in patients with right upper quadrant pain.251
Ultrasound Findings of Cholelithiasis
With ultrasound, gallstones are visible as hyperechoic (bright white) structures within the gallbladder, casting dark acoustic shadows (see Figures 9-73 through 9-87). Gallstones are typically mobile (see Figure 9-80) unless lodged in the gallbladder neck (see Figure 9-83), cystic duct, or common bile duct—distinguishing them from gallbladder polyps, which are immobile and do not cast acoustic shadows (see Figure 9-84). Gallstone mobility can be assessed by rolling the patient during the ultrasound examination to observe any resulting motion of gallbladder contents. Smaller gallstones may be as small as a grain of sand or even finer particles—leading to terms such as “gallbladder sand” and “sludge.” Even at these small sizes, gallstones remain hyperechoic and are mobile. Gallbladder sludge forms a dependent layer within the gallbladder but may not be so dense as to cast an acoustic shadow. When the gallbladder is completely filled with stones, an appearance called the wall–echo–shadow sign may be seen. In this case, the ultrasound beam reflects off of stones immediately deep to the superficial gallbladder wall. Deeper structures are not seen. This appearance can be similar to that seen with a heavily calcified gallbladder (porcelain gallbladder; Figure 9-111), which is associated with gallbladder carcinoma. In one recent study, this association has been found to be less strong than previously described.252 In addition, in gangrenous cholecystitis, air within the gallbladder wall creates a bright echo and posterior shadowing.253
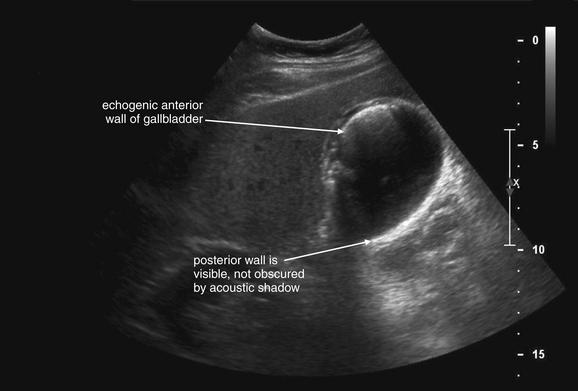
Figure 9-111 Porcelain gallbladder versus air in gallbladder wall, ultrasound.
Porcelain gallbladder, a finding concerning for carcinoma of the gallbladder, can be recognized on ultrasound by a highly echogenic anterior wall of the gallbladder with posterior acoustic shadowing. This patient has findings that do not quite meet this definition. The anterior wall is highly echogenic, but the posterior wall is visible. With a true porcelain gallbladder, the densely echogenic anterior gallbladder wall would create a dense shadow, preventing visualization of the posterior wall. Other possible causes of this finding in this patient are air within the gallbladder wall (which scatters and reflects the ultrasound signal) or confluence of “comet tail artifact” from multiple adjacent cholesterol crystals. In this case, the patient had severe pulmonary disease and was not an operative candidate, so no pathology report is available. His CT suggested acute cholecystitis, and he was treated successfully with percutaneous drainage and antibiotics.
Findings of cholecystitis include gallbladder wall thickening (>3-4 mm), pericholecystic fluid, and sonographic Murphy’s sign.253-254 The normal gallbladder wall is a pencil-lead-thin (2-3 mm) hyperechoic line (see Figures 9-73 and 9-85). With inflammatory change, the wall thickens and may take on a striated appearance (see Figure 9-86). Thickening may occur in other disease states besides cholecystitis, including cirrhosis, viral hepatitis, heart failure, hypoalbuminemia, and chronic renal failure.255 Pericholecystic fluid appears hypoechoic (black) on ultrasound (see Figure 9-87). The finding is nonspecific in isolation, because fluid may be present in the gallbladder fossa from other processes including diffuse ascites. A sonographic Murphy’s sign is the presence of tenderness to direct palpation over the gallbladder with the ultrasound probe. The sensitivity of this finding in isolation for acute cholecystitis is only around 86%, with 35% specificity.256 Some radiologists decline to comment on the sonographic Murphy’s sign in a patient who has received analgesics. An enlarged gallbladder is another nonspecific sign of possible cholecystitis. The normal size of the gallbladder is 7-10 cm in length and 2-3 cm in width. A transverse diameter greater than 5 cm suggests cholecystitis.254
Sensitivity and Specificity of Ultrasound and Nuclear Scintigraphy for Acute Cholecystitis
Numerous studies have evaluated the sensitivity and specificity of ultrasound and nuclear scintigraphy (described shortly) for cholelithiasis and acute cholecystitis. Most studies suggest that ultrasound is highly sensitive and specific for gallstones. It is sensitive but less specific for cholecystitis. Nuclear scintigraphy is considered more sensitive and specific than ultrasonography for acute cholecystitis—but is more costly and time-consuming and exposes the patient to ionizing radiation.251 Shea et al.257 performed a metaanalysis of studies of ultrasound and nuclear scintigraphy and corrected the calculated sensitivity and specificity for a common methodologic bias: verification bias. This error occurs when a gold standard test is not performed in all patients to confirm the findings of the test whose performance is being evaluated. This can result in inaccurate calculation of sensitivity and specificity, because the true presence or absence of disease is not confirmed. The authors found that the sensitivity of ultrasound and nuclear scintigraphy were likely lower than previously reported, when corrected for verification bias (Table 9-20). They recommended that a sensitivity midway between corrected and uncorrected values be assumed.
Table 9-20 Sensitivity and Specificity of Ultrasound and Nuclear Scintigraphy for Cholelithiasis and Cholecystitis
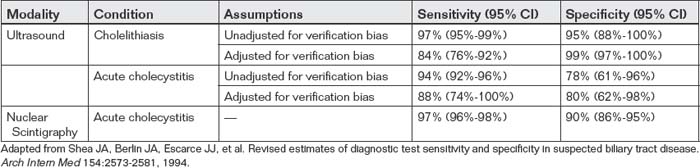
False-positive ultrasound findings can occur in a number of settings. Gallbladder wall thickening can occur postprandially because of normal gallbladder contraction.254 Consequently, some centers require that the patient fast at least 4 hours before gallbladder ultrasound. As previously mentioned, pericholecystic fluid may represent fluid within the abdomen from another source such as ascites, rather than inflammatory fluid related to gallbladder pathology.
Nuclear Scintigraphy (Hepatobiliary Iminodiacetic Acid Scan) of Cholecystitis and Biliary Obstruction
Hepatobiliary iminodiacetic acid (HIDA) nuclear scintigraphy (also called cholescintigraphy, hepatobiliary scintigraphy, or a hepatobiliary scan) represents another means of assessing the gallbladder and biliary tree for pathology. In this test, HIDA labeled with a radioactive tracer (usually technetium-99m) is injected intravenously, is taken up by the liver, and is excreted into the bile. It then travels in bile from the liver through the biliary ducts to the gallbladder and on to the small intestine. A series of images is captured over time with a gamma camera, recording the sequence of passage of bile. In a normal HIDA scan, the liver becomes visible first, followed by the hepatic duct. The gallbladder then becomes visible, because it fills retrograde through the cystic duct. Filling of the common bile duct also occurs, followed by transit of bile through the Sphincter of Oddi into the small bowel. Patients are usually required to fast for 2 hours before cholescintigraphy.
In cases of obstruction of biliary ducts, portions of the biliary system distal to the obstruction are not visualized, because HIDA-labeled bile does not pass the point of obstruction. If the cystic duct or gallbladder neck becomes obstructed by a stone, as is common in cases of cholecystitis, the gallbladder is not visualized. In cases of choledocholithiasis, distal portions of the common bile duct and small bowel do not receive HIDA-labeled bile and are not visualized. An abnormal HIDA scan is not specific for biliary obstruction by a stone, because obstruction by a mass or stricture would have a similar appearance.
In some cases of cholecystitis or gallbladder dysfunction leading to chronic abdominal pain, the gallbladder fills normally but does not contract normally. When the gallbladder is visualized on cholescintigraphy but doubt remains about the function of the gallbladder, cholecystokinin can be administered intravenously and the response observed. Usually brisk emptying of the gallbladder is observed, with subsequent nuclear scintigraphy images showing an absence of the gallbladder in the image after HIDA-laden bile is expelled. In the case of an abnormal gallbladder, the gallbladder image remains on images acquired after administration of cholecystokinin, because HIDA-labeled bile remains within the gallbladder. Quantitative measurement of the gallbladder ejection fraction can be performed; an ejection fraction less than 50% after cholecystokinin is abnormal.258 Figures 9-88 through 9-90 demonstrate normal and abnormal HIDA studies.
HIDA–nuclear scintigraphy can be used to assess for conditions other than cholecystitis, biliary obstruction, and gallbladder dysfunction. Because the test traces the route of bile excreted from the liver, it can be used to assess for bile leaks, as may occur as a complication of hepatobiliary surgery. If radiotracer accumulates in an unexpected location, a leak can be diagnosed (see Figure 9-101). If tracer accumulates locally, a biloma may be diagnosed. If tracer is distributed diffusely in the abdomen, a bile leak into the peritoneal cavity is present. HIDA scintigraphy can also diagnose iatrogenic obstruction, such as inadvertent clipping of the common bile duct during surgery. Because the method records scintigraphic emission from bile, it provides no specific information about the cause of the obstruction (tumor, stone, stricture, or surgical clip), because the body tissues themselves are not imaged.
The high sensitivity and specificity of HIDA cholescintigraphy is achieved with imaging up to 4 hours after radiotracer administration, an important limitation to use in the emergency department. Sensitivity and specificity are decreased to only 80% to 88% when imaging is continued for only 1 hour. Administration of morphine can be performed if the gallbladder is not seen by 40 to 60 minutes after administration of radiotracer and if tracer is seen in the small bowel. Morphine is thought to cause some constriction of the sphincter of Oddi, enhancing retrograde filling of the gallbladder when the cystic duct is patent. Cholescintigraphy with morphine augmentation in this manner has been shown to achieve high sensitivity (94.6%) and specificity (99.1%) with only 1.5 hours of imaging.259
The sensitivity and specificity of HIDA cholescintigraphy has been studied extensively (see Table 9-20).251,257 It remains a second-line test to ultrasound in most circumstances, because it may take 2 to 4 hours to complete, exposes the patient to ionizing radiation, and is more expensive than ultrasound. In addition, it does not directly visualize organs, unlike ultrasound and CT, and so may be less useful in evaluating for alternative pathology. Although metaanalysis data suggests high specificity, some studies have suggested very low specificity of HIDA scans, as low as 38%.260
Computed Tomography for Cholelithiasis and Acute Cholecystitis
CT is generally not considered the first-line test for cholecystitis and related biliary disorders, because ultrasound is well-studied and offers an imaging option free from radiation or the use of potentially nephrotoxic contrast agents. However, CT is frequently used for the imaging of nonspecific abdominal pain and sometimes reveals biliary pathology as the source of pain. CT can disclose the presence of gallstones, although many gallstones are isodense with bile by CT and are not seen. Normal bile has a density somewhat greater than water (~20 Hounsfield units), and appears dark gray on a CT soft-tissue window. Bile does not normally enhance with IV (or oral) contrast. The gallbladder wall is normally a pencil-thin line and isodense or slightly denser than bile, thus appearing as a slightly brighter line around the gallbladder. The normal gallbladder fossa does not contain fluid. Gallstones may be visible as hyperdense (brighter) rounded or irregular structures in a dependent position within the gallbladder. Figures 9-92 through 9-94 demonstrate gallstones seen with CT.
Fidler et al.261 reported the CT findings of acute cholecystitis in 29 patients with proven disease (Table 9-21). Gallbladder wall thickening may be seen as thickness greater than 4 mm. The gallbladder may appear distended. An abnormal gallbladder wall may enhance with IV contrast, appearing bright. A gangrenous gallbladder may fail to enhance. Pericholecystic fluid may be visible within the gallbladder fossa and appears an intermediate gray, around 0 to 20 Hounsfield units. CT cannot assess for the presence of a Murphy’s sign. Complications of gangrenous cholecystitis, including gas in the gallbladder, gallbladder wall, or gallbladder fossa, may be seen. Inflammatory fat stranding may be seen surrounding the gallbladder. In some cases, an abscess in the gallbladder fossa may be seen, with rim enhancement, air, and fluid.262 Figures 9-95 through 9-98 demonstrate CT findings of cholecystitis.
Table 9-21 CT Findings of Acute Cholecystitis
| Finding | Description | Frequency |
|---|---|---|
| Gallbladder distension | >5 cm short axis or 8 cm long axis | 41% |
| Gallbladder wall thickening | ≥4 mm at a midpoint of the wall, not near the fundus | 58% |
| Gas in gallbladder wall and lumen | Gas from anaerobic gas-forming organisms appears black on all CT windows | 0% in this study; has been described in other studies as a finding of gangrenous cholecystitis263 |
| High attenuation bile | Increased attenuation relative to water density | 24% |
| Pericholecystic fat stranding | Fat stranding isolated to the pericholecystic region | 52% |
| Pericholecystic fluid | Fluid in the gallbladder fossa without diffuse ascites | 31% |
| Sloughed membranes | Irregular linear soft-tissue densities within the gall bladder | 3% |
| Subserosal edema | Defined by a central region of low attenuation within the gallbladder wall, also called a halo | 31% |
Adapted from Fidler J, Paulson EK, Layfield L. CT evaluation of acute cholecystitis: findings and usefulness in diagnosis. AJR Am J Roentgenol 166:1085-1088, 1996.
Additional complications such as ascending cholangitis are discussed later.
X-ray for Gallstones and Biliary Disease
Some gallstones are visible on x-ray (see Figure 9-72), but many are not, and the sensitivity and specificity of x-ray for clinically important conditions such as cholecystitis are too low for clinical utility. In some complicated cases such as ascending cholangitis, air may be seen on x-ray overlying the gallbladder fossa, or branching over the liver, suggesting biliary duct or portal venous gas. Generally, x-rays should not be obtained for assessment of suspected biliary pathology. Rothrock et al.247 found that major abnormalities such as pneumobilia were extremely rare in patients with biliary disease—and did not occur in their series of patients. Minor findings possibly suggesting biliary disease (e.g., right upper quadrant calcifications, ileus, and right basilar atelectasis) occurred with equal frequency in patients with and without acute biliary disease—making them useless to differentiate biliary and nonbiliary sources of symptoms.
Contrast-Biliary Imaging for Gallstones
Contrast biliary studies using fluoroscopy and contrast agents injected directly into the biliary tract represented the first imaging method to visualize the biliary system—before the advent of ultrasound, CT, or MRI. Today the modality is primarily used for interventions such as placement of percutaneous biliary drains or stents under image guidance (see Figure 9-103). The ACR does not generally recommend these studies, except in hospitalized patients in whom invasive cholangiography with percutaneous cholecystostomy can be both diagnostic and therapeutic.251
Magnetic Resonance Cholangiopancreatography for Biliary Obstruction and Cholecystitis
Magnetic resonance cholangiopancreatography (MRCP) allows visualization of the gallbladder, biliary ducts, and pancreas. The method can detect obstruction and can often reveal the cause, including gallstone, extrinsic compression from mass, and intrinsic obstruction from neoplasm. This technique is used more often in the diagnosis of painless jaundice from presumed pancreatic mass than in the diagnosis of cholecystitis, because less expensive and more available alternatives exist.264
MRI has been compared with ultrasound for the diagnosis of acute cholecystitis. Hakansson et al.265 studied 35 patients with both MRI and ultrasound and found that MRI was more sensitive. Loud et al.266 also reported that MRI was useful in the preoperative evaluation of 14 patients with suspected acute cholecystitis, though no comparison with other modalities was made.
Acalculous Cholecystitis
Acalculous cholecystitis can be a difficult diagnosis, with nonspecific imaging findings. Large prospective studies do not exist because of the rarity of the condition. Mirvis et al.260 retrospectively reported findings in 56 patients during a 6-year period. Ultrasound and CT were sensitive (92% and 100%, respectively) and specific (96% and 100%, respectively), whereas cholescintigraphy with HIDA was only 38% specific. Findings were similar to those of gallstone-associated cholecystitis, but with an absence of stones.
Choledocholithiasis and Biliary Ductal Obstruction
Choledocholithiasis is the presence of bile stones within the biliary ducts. It can be assessed with several modalities, including ultrasound, magnetic resonance, CT, cholescintigraphy, and contrast fluoroscopy.
Ultrasound of Choledocholithiasis and Biliary Ductal Obstruction
Ultrasound readily measures the caliber of the major biliary ducts, although distal segments may be hidden by overlying bowel gas. A stone obstructing the common bile duct may be directly visualized and has the same characteristics as a stone within the gallbladder—hyperechoic with acoustic shadowing—but is immobile once trapped within the duct (see Figures 9-99 and 9-100). Sometimes the source of obstruction (stone, mass, or extrinsic compression) is not directly seen with ultrasound, but biliary ductal dilatation proximal to the obstruction is seen. The normal diameter of the common bile duct is around 5 mm but increases with age.267 The extrahepatic bile duct (including the common bile duct) increases in diameter by about 0.4 mm per year in patients older than 50 years. In elderly patients, a diameter of 8.5 mm has been suggested as the upper limit of normal.267
Magnetic Resonance Cholangiography of Choledocholithiasis and Biliary Ductal Obstruction
Magnetic resonance similarly can demonstrate biliary ductal obstruction and is considered the current optimal noninvasive imaging test for stones and tumor.268-271 Soto et al.272 reported sensitivity for detection of bile duct stones of 96% for MR, with 100% specificity. In the case of malignancy, magnetic resonance can demonstrate ductal infiltration and lymph node metastases.264 Magnetic resonance is also useful in assessment of patients with postoperative complications of biliary surgery and can demonstrate anastomoses.273
Computed Tomography of Choledocholithiasis and Biliary Ductal Obstruction
CT can reveal both intrahepatic and extrahepatic biliary ductal dilatation (see Figures 9-104 through 9-108). In some cases, the source of obstruction may be evident with CT, including obstructing stone or extrinsic compression such as from pancreatic mass. A stone within a duct can sometimes be seen as a bright filling defect, with a surrounding rim of darker bile called the target or crescent sign.274 In other cases, the stone may be isodense with bile and thus invisible. The stone’s location may then be inferred by the transition from dilated to nondilated biliary duct. Bile does not enhance with standard IV or oral contrast agents, and the normal density of bile is approximately 20 Hounsfield units, making it a dark gray on a soft-tissue window. Hemobilia (blood in bile) gives blood a higher density, around 40 to 60 Hounsfield units. Although iodinated IV contrast does not enhance bile, it can be useful in visualizing intrahepatic bile ducts by enhancing the surrounding liver parenchyma and adjacent portal triad. This triad is composed of hepatic vein, portal vein, and biliary duct. Without IV contrast, the density of bile, blood in vessels of the portal triad, and surrounding liver parenchyma are similar—around 20 to 40 Hounsfield units. Consequently, without IV contrast, the intrahepatic biliary ducts may be difficult to identify, and dilatation may be difficult to recognize. Enhancement of liver parenchyma with IV contrast leaves unenhancing dilated biliary ducts in relief. IV contrast can thus be important in assessment of ductal patency. However, some bile duct stones are calcified and are better seen on unenhanced CT. Some noncalcified stones are visible on unenhanced CT because they have higher density than surrounding liquid bile. Very small stones, 6 mm or smaller, can be difficult to detect.274 Specialized oral contrast agents that are concentrated in bile are also available (e.g., iopodic acid) and are sometimes used for dedicated CT cholangiography.272 Accurate delineation of the cause of biliary ductal obstruction with CT requires thin-section image acquisition and reconstruction, because biliary ducts have normal diameters in the range of a few millimeters.
When biliary duct obstruction is not present, intrahepatic biliary ducts are nearly invisible, because they are decompressed and quite small in diameter. The portal triad appears to consist of only two components in this instance, the hepatic and portal veins, both filled with IV contrast. When biliary ductal obstruction is present, the intrahepatic biliary ducts become dilated proximal to the point of obstruction. Low-density bile is visible within the dilated ducts, allowing this component of the portal triad to be seen.
Studies of CT with protocols dedicated to biliary duct assessment show high sensitivity and specificity.
Soto et al.272 compared unenhanced CT, oral contrast–enhanced CT cholangiography using iopodic acid, and MRCP for the diagnosis of choledocholithiasis in 51 patients. Unenhanced CT was 65% sensitive, compared with 92% sensitivity for CT cholangiography and 96% sensitivity for MRCP. Specificity was 84% for unenhanced CT, 92% for CT cholangiography, and 100% for MRCP.
Ahmetoglu et al.275 performed CT using only IV contrast without an oral cholangiographic contrast agent. The sensitivity and specificity were 93% and 89%, respectively, for biliary stone. For malignant obstruction, the sensitivity and specificity were 94%.
Anderson et al.274 compared unenhanced and IV contrast–enhanced CT without the use of a bile-specific oral contrast agent. For study purposes, two observers interpreted the CT scans specifically with choledocholithiasis in mind. For the two observers, the sensitivity ranged between 69% and 87% for unenhanced CT and was 87% for enhanced CT. Specificity was 92% for unenhanced CT and 83% to 88% for enhanced CT. However, the original CT interpretation, performed at the time of patient evaluation, was only 46% sensitive (unenhanced) and 33% sensitive (enhanced), with high specificity (98%-100%). This serves as a strong reminder that real-world sensitivity and specificity may differ substantially from those found in a study setting.
Anderson et al.276 compared 64-slice CT with IV contrast enhancement during the portal venous phase to MRCP. CT was moderately sensitive (70%-78%) and very specific (100%) for detection of biliary stenosis. CT was 72% to 78% sensitive for choledocholithiasis and 96% specific—though in a setting in which the CT interpreters were specifically looking for biliary duct abnormalities.
Kim et al.277 reported sensitivity and specificity of CT cholangiography for stones to be 97% and 96%, respectively. The sensitivity and specificity for bile duct stricture were 86% and 100%, respectively. Multiplanar reconstruction was used in this and the previous studies to improve diagnostic performance.
Fluoroscopic Contrast Biliary Studies for Biliary Ductal Obstruction
Fluoroscopic assessment of biliary ductal patency can be performed but usually is reserved for interventions to treat obstruction, following diagnosis with another imaging modality. In these procedures, an intrahepatic biliary duct is cannulated, often using ultrasound guidance. A radiopaque contrast agent is then injected, allowing visualization of the biliary ducts using fluoroscopy. An obstructing lesion prevents contrast from progressing distally. A stent or catheter can sometimes be placed across the point of obstruction using this technique. In other cases, percutaneous external drainage is performed.
Ascending Cholangitis
Ascending cholangitis is a life-threatening infection of the biliary ducts, usually in the context of biliary ductal obstruction. Imaging plays both direct and indirect roles in the diagnosis. The primary role of imaging is to rule out other causes of symptoms such as abdominal pain, tenderness, jaundice, and fever. In addition, imaging may reveal biliary ductal obstruction from an intrinsic process, such as gallstone, or extrinsic obstruction from a compressing mass or abscess. In some cases, imaging may reveal more direct evidence of ascending cholangitis such as gas within the biliary ducts or portal venous system, caused by the presence of gas-forming anaerobic organisms. Direct evidence of ascending cholangitis may not be present; the emergency physician may need to infer the presence of ascending cholangitis from imaging findings of biliary obstruction, in the presence of other clinical findings such as fever, jaundice, altered mental status, or hypotension. Treatment requires decompression of obstruction, which can be performed surgically, endoscopically by endoscopic retrograde cholangiopancreatography, or by percutaneous biliary drainage under ultrasound or fluoroscopic guidance. Thus imaging plays a role in both diagnosis and treatment. Treatment need not relieve the actual site of pathologic obstruction; instead, as a temporizing measure, percutaneous drainage of the biliary system can suffice.
X-ray for Ascending Cholangitis
X-ray is insensitive for ascending cholangitis and should not be relied upon to confirm or exclude the diagnosis However, gas in a branching pattern overlying the liver can suggest pneumobilia from gas-forming organisms in the biliary system.
Computed Tomography for Ascending Cholangitis
In ascending cholangitis, CT findings may include signs of biliary obstruction as described earlier (see Figures 9-107 and 9-108), as well as gas within the intrahepatic biliary ducts (see Figures 9-109 and 9-110). Gas in this location appears black on a soft-tissue window and may have a branching pattern. Gas in biliary ducts may be difficult or impossible to differentiate from gas in portal venous branches. Balthazar et al.278 reported that CT identified biliary dilatation suggesting obstruction in 78% of patients with ascending cholangitis, detected the level of obstruction in 65%, and identified the cause in 61%. Five patients (22%) had air within the biliary tree, and three patients (13%) had hepatic abscesses. Lee et al.279 similarly reported biliary obstruction to be a common finding. Papillitis and inhomogeneous liver enhancement were also associated with cholangitis in this study.
Ultrasound for Ascending Cholangitis
Ultrasound in ascending cholangitis also provides supporting but not direct evidence of the diagnosis. Ultrasound findings may include those of acute cholecystitis and biliary ductal dilatation (intra hepatic and extrahepatic). An obstructing stone in the common bile duct may be seen (see Figures 9-99 and 9-100). Ultrasound can demonstrate air within bile ducts; air scatters the ultrasound beam, resulting in “static” in the ultrasound image. Normally this artifact is not seen within the liver parenchyma, allowing intrahepatic air to be recognized or suspected.
Magnetic Resonance Cholangiography for Ascending Cholangitis
Magnetic resonance can demonstrate biliary ductal dilatation and in some cases can determine the cause. Like CT, magnetic resonance does not prove the diagnosis of ascending cholangitis but rather confirms biliary obstruction, a risk factor for cholangitis. Bile-specific contrast agents such as gadolinium ethoxybenzyl diethylenetriamine pentaacetic acid can assist in the diagnosis.280-281
Pancreatitis and Pancreatic Masses
Figures 9-112 through 9-119 demonstrate imaging findings of the normal pancreas, pancreatitis, and pancreatic masses. Imaging in pancreatitis can serve several purposes, the most clear-cut being to identify cases of pancreatitis resulting from an obstructing gallstone in the common bile duct. Gallstone obstruction of outflow of pancreatic secretions is a leading cause of pancreatitis and is treated by stone removal with endoscopic retrograde cholangiopancreatography. Obstruction of biliary ducts can be identified using ultrasound, CT, or MRI as described earlier.282
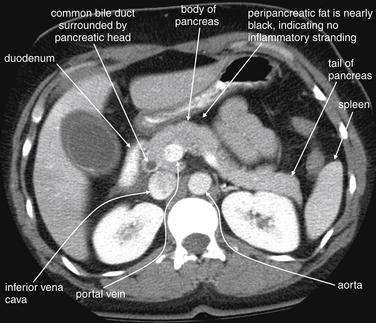
Figure 9-112 Normal pancreas, CT with IV and oral contrast, soft-tissue window.
This scan shows a normal pancreas. In many patients, the pancreas is not so horizontally oriented and is therefore difficult to see in a single slice. Here, the common course of the pancreas is seen. The pancreatic head is draped over the portal vein. The tail of the pancreas crosses the midline and then moves posteriorly. It crosses the left kidney and ends medial to the spleen. The duodenum is to the right of the pancreatic head, filled with oral contrast. The common bile duct is seen as a hypodense area within the pancreatic head, because it is filled with bile. The contrast between the dark bile and the bright pancreatic tissue is increased by the administration of IV contrast, because the pancreas enhances as a result of high blood flow. The fat surrounding the pancreas is dark, which is normal and indicates the absence of inflammatory stranding—almost the entire pancreas is outlined in fat and has distinct border. Incidentally, the patient has an abnormal dilated gallbladder with pericholecystic fluid. Given this finding, the prominent common bile duct should be inspected further for an obstructing stone.
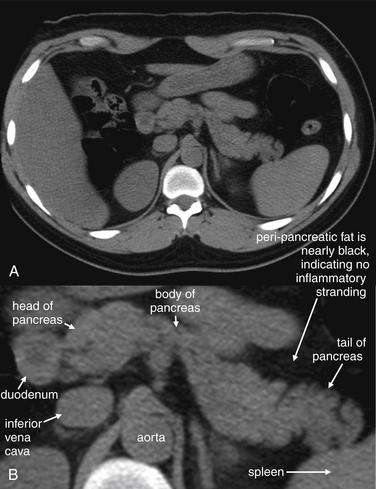
Figure 9-113 Normal pancreas, CT without IV or oral contrast, soft-tissue window.
Without oral and IV contrast, the pancreas can be a bit harder to identify. Here, another common course of the pancreas is seen. The pancreatic head is anterior to the inferior vena cava and medial to duodenum. The body of the pancreas crosses the midline and then moves posteriorly. The pancreatic tail ends anterior to the spleen. A, Axial image. B, Close-up.
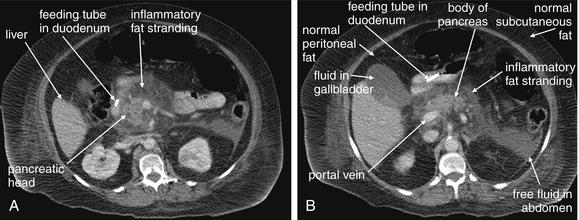
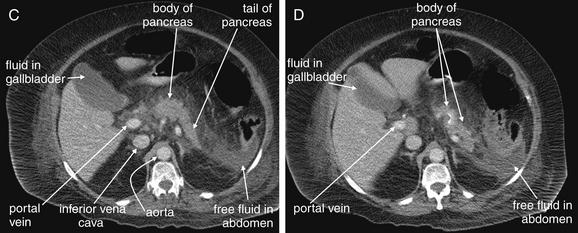
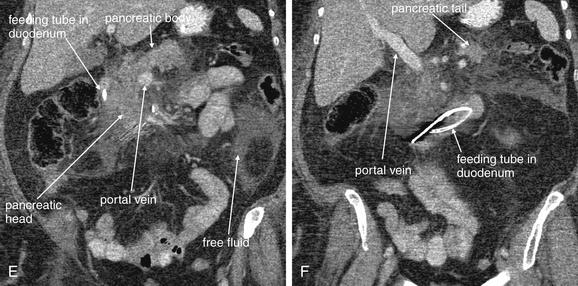
Figure 9-114 Pancreatitis, CT with IV contrast, soft-tissue window.
For novice readers, pancreatitis can be one of the most difficult diagnoses to recognize on this CT, perhaps because the normal pancreas attracts so little attention. A through D, Axial images. E, F, Coronal images. This series of four axial slices shows an inflamed pancreas, starting at the pancreatic head (A) and moving progressively cephalad to its tail (C, D). The entire pancreas here is surrounded by inflamed peripancreatic fat that shows marked stranding. Near the tail, free fluid is evident. Find the pancreas by recognizing the company it keeps. The pancreatic head normally lies medial to the gallbladder, in the vicinity of the portal vein. If necessary, trace the portal vein backward from the liver to the center of the abdomen. In addition, the pancreas typically lies at the level of the celiac artery as it emerges from the aorta. The body and tail of the pancreas then continue to the patient’s left, typically terminating near the left kidney and spleen. The splenic artery feeds branches to the pancreas and is usually parallel to the pancreas, so one method of finding the pancreas is to follow the splenic artery backward from the spleen to the aorta. A, The pancreatitic head is visible, just left of the duodenum that is marked by a bright feeding tube. Compare the inflamed fat around the pancreas with normal subcutaneous and peritoneal fat (labeled in B). C, The body and tail of the pancreas are visible, starting at the midline anterior to the aorta and progressing left and posteriorly. A fluid collection is visible in the left abdomen—its density is similar to that of fluid in the gallbladder. Normal structures such as the aorta are labeled to assist you in getting your bearings. Frustrated? This process is easier using a digital picture archiving and communication system (PACS), because you can find familiar landmarks before looking for a less familiar structure such as the pancreas. E, F, Coronal reconstructions from the same patient may help you to understand the orientation.
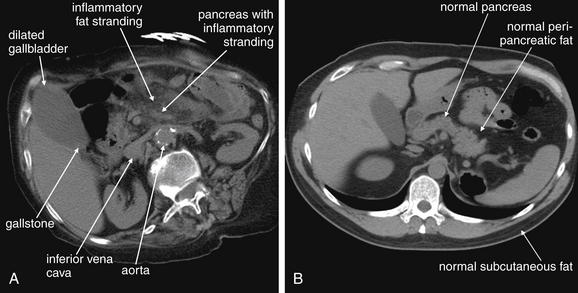
Figure 9-115 Gallstone pancreatitis and normal pancreas for comparison, axial CT without contrast.
A, Gallstone pancreatitis CT. A dilated gallbladder is visible with a hyperdense dependent lesion consistent with a gallstone. The region of the pancreas shows significant inflammatory stranding In this patient, the pancreas lies just anterior to the left renal vein, which can be seen crossing anterior to the aorta and entering the inferior vena cava. B, A normal pancreas is visible. This pancreas is surrounded by uninflamed fat, which is dark (nearly black). Compare this normal fat with normal subcutaneous fat.
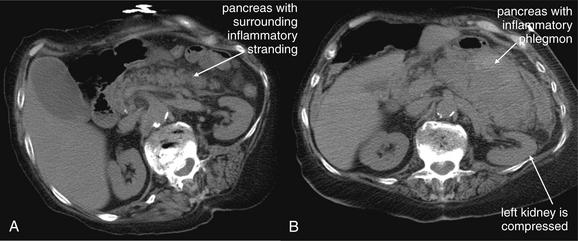
Figure 9-116 Gallstone pancreatitis, progressing to hemorrhagic pancreatitis over a 13-day period, CT without contrast, soft-tissue window.
A, The inflamed pancreas is visible on the initial scan. B, An expanding region of pancreatic inflammation and hematoma is visible 13 days later. Notice how the left kidney is compressed by the inflamed pancreas in B, compared with A.
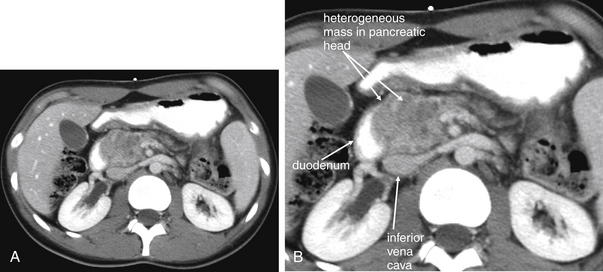
Figure 9-117 Pancreatic mass, CT with IV and oral contrast, soft-tissue window.
A 24-year-old female with newly diagnosed pancreatic head mass, ultimately diagnosed as a solid pseudopapillary tumor. This was an aggressive malignancy that rapidly metastasized. On this scan with intravenous and oral contrast performed around the time of initial diagnosis, the mass is seen in abutting the inferior vena cava and duodenum. From our earlier discussion of pancreatitis, you’ll recognize that much of the pancreas is not seen in this slice. A, Axial image. B, Close-up.
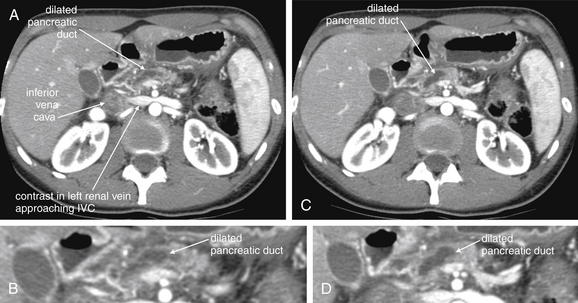
Same patient as Figure 9-117. This CT with IV contrast shows dilatation of the pancreatic duct up to 8 mm. Normally the pancreatic duct is quite subtle on CT, but obstruction of the duct in the pancreatic head by the mass has resulted in its prominence here. The mass itself is not visible in these images. The dilated pancreatic duct is a dark gray—fluid density, because we have reviewed previously. The mottled appearance of the spleen is caused by the early arterial phase of injected contrast; this can mimic splenic infarction or injury. You can recognize that this is an early-phase CT, rapidly performed after contrast injection, as the inferior vena cava has not yet filled with contrast. Contrast is seen in the left renal vein about to enter the inferior vena cava. Images obtained slightly later would result in a more homogeneous appearance of the spleen as venous structures fill with contrast.
A, C, Axial CT images. B, D, Close-ups from A and C, respectively.
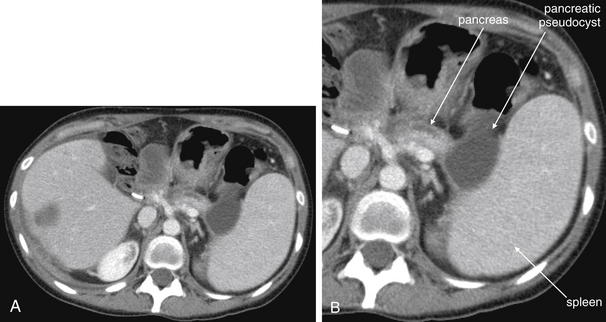
Figure 9-119 Pancreatic pseudocyst, CT with IV contrast.
This patient has a known pancreatic head mass (adenocarcinoma). After an episode of pancreatitis caused by malignant obstruction of the pancreatic duct, a cystic lesion developed in the tail of the pancreas abutting the spleen. This lesion was followed by CT over the course of months and slowly decreased in size, consistent with a pancreatic pseudocyst. Notice the large spleen as well. A, Axial CT image. B, Close-up.
The role of diagnostic imaging for the diagnosis of pancreatitis itself is less clear. Laboratory assessment of pancreatitis can be insensitive, particularly in chronic pancreatitis, where elevations of amylase and lipase may not occur. Isolated amylase elevations can occur without pancreatic inflammation, from sources including bowel and salivary gland, making laboratory assessment nonspecific as well. Still, in most cases, pancreatitis is diagnosed by a combination of clinical features and laboratory abnormalities. No well-validated decision rule for the use of diagnostic imaging in pancreatitis has been developed, either for patients with normal lab assessment or for patients with apparent pancreatitis based on laboratory abnormalities. Diagnostic imaging can identify complications of pancreatitis such as abscess, pseudocyst, and hemorrhagic or necrotizing pancreatitis. Which patients require imaging to assess for these complications is debated, though a cogent case can be made for imaging in critically ill patients, patients with a history of these complications, patients with pancreatitis and fever, or patients with metabolic derangements such as multiple Ranson’s criteria. The grading of severity of pancreatitis with imaging has some prognostic value, although no studies have shown clinical benefits to patients based on management changes resulting from imaging. Imaging today provides much information with little apparent effect on patient treatment or outcomes. Perhaps future advances in therapy will use imaging findings to guide patient treatment decisions. We review diagnostic imaging findings of pancreatitis here and discuss grading of severity.
X-ray in Pancreatitis
X-ray findings of pancreatitis are insensitive and nonspecific; x-ray should not generally be used to assess the condition. Nonspecific findings such as ileus may occur, and in chronic pancreatitis calcifications of the pancreas may be present. Pancreatic calcifications may be present during quiescent periods between acute flares and thus have little clinical value. Calcified gallstones may occasionally be visible, but x-ray can neither confirm nor exclude the diagnosis of pancreatitis, nor does it provide prognostically or therapeutically useful information in most cases. Davis et al.283 reviewed abdominal x-rays in 100 patients with pancreatitis and found pancreatic calcification in only one case. Biliary abnormalities including a visible gallbladder, gallstones, or biliary gas were seen in only 10%. Nonspecific so-called sentinel bowel loops representing dilated duodenum or jejunum were seen in around 30% of patients. In its appropriateness guidelines for acute pancreatitis, the ACR282 does not provide any rating or discussion of x-ray—because x-rays are not typically indicated.
Ultrasound of Pancreatitis
The primary role of ultrasound in evaluation of pancreatitis is to assess for biliary ductal obstruction by a gallstone or mass, as described earlier. Ultrasound also can identify secondary signs of pancreatitis such as free abdominal fluid and complications such as pseudocyst or abscess. Fluid collections in the pancreatic bed appear hypoechoic (black); an abscess may have a more complex architecture with internal echoes. The ACR282 recommends ultrasound as the most indicated imaging test in a first episode of pancreatitis, as a result of its ability to assess for gallstone pancreatitis. Even when alcoholic pancreatitis is suspected, the ACR recommends assessment for biliary obstruction using ultrasound. Visualization of pancreatic abnormalities such as intraparenchymal and retroperitoneal fluid collections with ultrasound is difficult in acute pancreatitis because of the frequent presence of overlying bowel gas.
Computed Tomography of Pancreatitis
The ACR282 recommends CT, with or without contrast, for the evaluation of acute pancreatitis. The ACR rates CT as indicated for first episodes of pancreatitis of unknown cause, though ultrasound is recommended as the first-line imaging test in this circumstance. In other pancreatitis scenarios, including severe abdominal pain, elevated lipase and amylase, fever and leukocytosis, hemoconcentration, oliguria, or tachycardia, the ACR recommends CT be performed. The ACR credits CT as useful for differentiating pancreatitis from other disease processes, as well as for identifying complications of pancreatitis such as necrosis, severe inflammation, and fluid collections. The ACR states that CT is insensitive for detection of biliary calculi, although as we have reviewed in the earlier section on choledocholithiasis and biliary obstruction, some studies show CT to have sensitivity comparable to MRI.
Computed Tomography Findings of the Normal Pancreas and Pancreatitis
The normal pancreas is an intermediate gray band of soft-tissue density (~+40 Hounsfield units) in the upper abdomen (see Figures 9-112 and 9-113). The pancreatic head is located just right of the midline, with the pancreatic body crossing to the patient’s left anterior to the abdominal aorta. The pancreatic tail terminates in the left abdomen medial to the spleen and anterior to the left kidney. The surface of the normal pancreas has a frondlike or crenellated appearance. The surrounding fat is quite black, with no inflammatory change. No free fluid is seen around the normal pancreas. When IV contrast is administered, the normal pancreas enhances uniformly. Oral contrast is not needed to assess the pancreas.
CT findings of pancreatitis include peripancreatic free fluid, peripancreatic fat stranding, and edema of the pancreas, with loss of the normal crenellated appearance (see Figures 9-114 through 9-116).284 The adjacent fat appears smoky or hazy, and the borders of the pancreas become indistinct. A pancreatic mass or pseudocyst may also be seen (see Figures 9-117 through 9-119). Pancreatitis can be recognized by CT without oral or IV contrast. However, if IV contrast is given, areas of necrosis will fail to enhance and remain dark, whereas less-affected areas will enhance and appear brighter.285 The demarcation between areas of normal enhancement and necrotic unenhancing regions is often sharp.284 The pancreatic head is often spared because of a redundant vascular supply.284 Several investigators have shown a correlation between lack of pancreatic parenchymal enhancement on CT with IV contrast and surgically proven pancreatic necrosis.285-286 Areas of necrosis identified by CT do not recover enhancement but rather eventually resorb in survivors.287 Mesenteric edema surrounding blood vessels creates a low-attenuation cuff around the contrast-enhanced blood vessel. A pancreatic pseudocyst may be seen as a well-circumscribed area of hypodensity (typically close to 0 Hounsfield units, or dark gray by CT with a soft-tissue window) within or immediately adjacent to the pancreas, often with an enhancing rim. This may be difficult to differentiate from abscess, although abscesses may be more heterogeneous, sometimes containing air, as well as fluid and semi-solid debris. Patients with extrapancreatitic phlegmon and pancreatic necrosis are at high risk for complications and poor clinical outcomes.288 CT severity of pancreatitis has been shown to be more predictive of clinical outcomes than are clinical scoring systems such as Ranson’s criteria in some studies, although this remains an area of research (described in detail later).289-290
Is Intravenous Contrast Detrimental in Pancreatitis? Is it Necessary to Diagnosis or Prognosis?
As described earlier, use of IV contrast allows identification of nonenhancing regions of the pancreas, reflecting pancreatitic necrosis. Some authors have cautioned against the use of IV contrast, because its administration in some animal models is associated with worsened pancreatitis.291 McMenamin and Gates292 retrospectively studied 95 patients with acute pancreatitis and found that IV contrast–enhanced CT was associated with longer hospitalization, suggesting the possibility that IV contrast might worsen pancreatitis. The authors found no difference in initial Acute Physiology and Chronic Health Evaluation (APACHE) II scores in patients who underwent IV contrast–enhanced CT and those who did not. Consequently, they concluded that IV-contrasted CT was likely the cause of worsened outcome, not simply a marker of patient disease severity. However, a prospective randomized trial would be required to determine a causal relationship. The ACR282 currently states that no prospective human data supports an adverse effect of IV contrast in pancreatitis and that benefits outweigh risks. On the other hand, no prospective trial has demonstrated improved outcomes in patients undergoing IV contrast–enhanced CT, so it is difficult to determine the benefit of CT.
Spitzer et al.33 determined the association of CT without any contrast agents performed within 48 hours with patient mortality in acute pancreatitis and found a strong correlation. Consequently, if patients are unable to receive IV contrast because of contraindications, unenhanced CT may provide similar prognostic information.
Clinical and Computed Tomography Grading Systems for Pancreatitis
Ranson’s criteria for pancreatitis are a clinical grading scale that correlates with mortality—though validation of these criteria in subsequent trials shows less impressive predictive power than some proposed CT systems. Nonetheless, it is interesting to observe a qualitative relationship among Ranson’s criteria, CT findings, and the pathophysiology of pancreatitis (Table 9-22). Ranson’s criteria include several clinical parameters that may have visible CT analogues.293
Table 9-22 Ranson’s Criteria for Pancreatitis and Related CT Findings
| Pathophysiology | CT Correlate | |
|---|---|---|
| At Admission | ||
| Age >55 years | — | None |
| White blood cell count >16,000 cells/mm3 | — | None |
| Blood glucose >10 mmol/L (>200 mg/dL) | Pancreatic injury reducing insulin production | Pancreatic necrosis with lack of enhancement on CT |
| Serum aspartate aminotransferase >250 IU/L | — | None |
| Serum lactate dehydrogenase >350 IU/L | — | None |
| At 48 Hours | ||
| Serum calcium <2.0 mmol/L (<8.0 mg/dL) | Fat saponification because of digestion of retroperitoneal fat and sequestration of calcium in the resulting soap | Inflammatory change (stranding) in retroperitoneal fat |
| Hematocrit fall >10% | Hemorrhagic pancreatitis | Hemorrhagic pancreatitis with fluid in retroperitoneal space |
| Oxygen (hypoxemia PO2 < 60 mm Hg) | Systemic inflammatory response syndrome with development of acute respiratory distress syndrome | Possible diffuse infiltrates on lung window |
| Blood urea nitrogen increased by ≥1.8 mmol/L (≥5 mg/dL) after IV fluid hydration | Inflammatory change with increased vascular permeability | Possible anasarca and ascites on CT |
| Base deficit (negative base excess) >4 mEq/L | Third spacing of fluid results in intravascular hypovolemia and poor end-organ perfusion | Possible anasarca and asciteson CT |
| Sequestration of fluids >6 L | Inflammatory change with increased vascular permeability | Possible anasarca and ascites on CT |
| Ranson’s Score | Predicted Mortality | |
| 0-2 | 2% | |
| 3-4 | 15% | |
| 5-6 | 40% | |
| 7-8 | 100% | |
Adapted from Ranson JH, Rifkind KM, Roses DF, et al. Prognostic signs and the role of operative management in acute pancreatitis. Surg Gynecol Obstet 139:69-81, 1974.
A number of grading systems for the severity of pancreatitis have been developed, based on CT criteria. Increasing severity by CT predicts increasing mortality. A direct relationship between CT findings and therapeutic interventions has not been developed, so although CT may have prognostic significance, the clinical benefit to patients is not proved. Presumably, additional information about the severity of pancreatitis would improve clinical care by allowing treatment of complications such as abscess. We examine some of the studies on CT severity scores here.
Balthazar et al.294 graded 83 patients with acute pancreatitis based on CT findings and correlated CT severity with clinical outcome (Table 9-23). Length of hospitalization correlated positively with CT severity. Abscesses occurred in 21.6% of all patients, no patients with grades A and B, and 60.0% of patients with severe pancreatitis (grade E). Pleural effusions were more common in grade E patients. No patients with CT grade A or B died. The authors concluded that early CT had prognostic value for morbidity and mortality. Whether early CT results in improved care has not been studied and would require a prospective study randomizing patients to CT or no CT to determine the effect on outcome.
Table 9-23 CT Pancreatitis Severity Index, Which Combines the Balthazar Grading System With Additional Points for Degree of Pancreatic Necrosis
| Balthazar CT Grade | CT Findings | Points Assigned |
|---|---|---|
| A | Normal pancreas | 0 |
| B | Pancreatic enlargement | 1 |
| C | Pancreatic inflammation, peripancreatic fat stranding, or both | 2 |
| D | Single peripancreatic fluid collection | 3 |
| E | Two or more fluid collections, retroperitoneal air, or both | 4 |
| Pancreatic Necrosis | Points Assigned | |
| 0% | 0 | |
| <30% | 2 | |
| 30%-50% | 4 | |
| >50% | 6 | |
| Pancreatitis severity index (0-10) | Sum of points from Balthazar CT grade and percentage necrosis | |
Adapted from Balthazar EJ. Acute pancreatitis: assessment of severity with clinical and CT evaluation. Radiology 223:603-613, 2002.
Subsequently, Balthazar et al.295 correlated the degree of pancreatitic necrosis identified with CT in 88 acute pancreatitis patients with morbidity and mortality. Based on these findings, they developed a CT severity index to predict morbidity and mortality (see Table 9-23).
Clavien et al.296 compared early CT findings (within 36 hours) and clinical scores to clinical course in 202 patients with acute pancreatitis. The authors classified CT findings in three categories and clinical scores as three groups, which correlated with mortality (Table 9-24). In patients with CT grade III and clinical score 2 or 3, mortality was particularly high: 32% or 58%, respectively. Complications developed in all survivors in these two groups, and all but two pancreatic abscesses developed in patients with CT grade III. The authors suggested that early CT be performed in all patients with a clinical score of 2 or 3, given the high mortality in these groups. This study did not explicitly examine any therapeutic inventions performed in response to CT findings, so it is unproven that the additional information provided by CT would alter management or improve mortality.
Table 9-24 CT Findings and Clinical Scores in Pancreatitis, Compared With Mortality
| CT Grade | Description | Mortality |
|---|---|---|
| I | No phlegmonous extrapancreatic spread | 0% |
| II | Phlegmonous extrapancreatic spread in one or two areas | 4% |
| III | Phlegmonous extrapancreatic spread in three or more areas | 42% |
| Clinical Score | Description | Mortality |
| 1 | 0-1 positive Ranson sign | 0% |
| 2 | 2-4 positive Ranson signs | 13% |
| 3 | ≥5 positive Ranson signs | 35% |
Adapted from Clavien PA, Hauser H, Meyer P, Rohner A. Value of contrast-enhanced computerized tomography in the early diagnosis and prognosis of acute pancreatitis. A prospective study of 202 patients. Am J Surg 155:457-466, 1988.
London et al.297 studied 126 patients with acute pancreatitis undergoing contrast-enhanced abdominal CT within 72 hours of presentation. Several CT criteria including pancreatic enhancement, loss of peripancreatic tissue planes, and a pancreatic size index (calculated by multiplying the maximum AP diameter of the pancreatic head and body) correlated with severity of pancreatitis. A pancre atic size index of at least 10 cm2 was 71% sensitive and 77% specific for a severe attack—but was less predictive than the modified Glasgow criteria (similar to Ranson’s Criteria), which were 85% sensitive and 79% specific.
Basterra et al.298 compared Ranson’s criteria with Balthazar’s CT criteria in 100 consecutive patients admitted with pancreatitis and found CT criteria to have superior sensitivity and specificity in predicting outcomes. Pancreatic necrosis was most predictive of outcome.
Ju et al.300 compared clinical scores (Ranson’s criteria) with three CT scoring systems: the Balthazar ABCD score, the Balthazar CT severity index (see Table 9-23), and London’s pancreatic size index. Ranson’s criteria and the pancreatic size index performed best, with the pancreatic size index being more predictive of local complications. Earlier investigators had found little additional prognostic benefit to CT compared with clinical scores.301
Rickes et al.302 reported the sensitivity and specificity of contrast-enhanced ultrasound (using an IV sonography contrast agent) for detection of severe pancreatitis, defined by a Balthazar score of D or E or CT evidence of pancreatic necrosis. Compared with CT, ultrasound was 82% sensitive and 89% specific.
Magnetic Resonance Imaging of Pancreatitis
Lecesne et al.303 compared contrast-enhanced CT to MRI in predicting morbidity. Unenhanced MRI and MRCP both correlated well with patient outcome and with CT. Ward et al.304 found MRI and contrast-enhanced CT to be comparable in identifying areas of pancreatic necrosis. MRI was better at characterizing fluid collections and identifying gallstones, whereas CT was superior in detection of gas and pancreatic calcification. MRI is thus an option in patients with nondiagnostic CT or contraindications to CT.
Urologic Emergencies
Imaging of conditions of the urinary tract including renal and ureteral stones, pyelonephritis, and perinephric abscess is discussed in detail in Chapter 12. Noncontrast CT is the most versatile emergency department study for
Box 9-4 Modified Glasgow Criteria for Pancreatitis
Adapted from Corfield AP, Cooper MJ, Williamson RC, et al. Prediction of severity in acute pancreatitis: Prospective comparison of three prognostic indices. Lancet 2:403-407, 1985.
Clinical scores and CT grading systems have been compared in the research setting to determine their prognostic accuracy. In many studies, CT is more predictive than clinical criteria.
these conditions because of its ability to evaluate nonurinary conditions that may have overlapping clinical presentations. Other imaging modalities, including IV urography and ultrasound, are discussed in Chapter 12.
Abdominal Aortic Aneurysm and Dissection
Abdominal aortic aneurysm and dissection are life-threatening and time-dependent conditions. In unstable patients, no imaging may be possible, and immediate laparotomy may be required. Ultrasound provides a portable imaging solution for patients with concerning vital signs, whereas CT provides more definitive imaging in patients who appear temporarily stable. X-ray plays virtually no role in evaluation of patients with suspected abdominal vascular emergencies. Imaging of nontraumatic abdominal aortic pathology is discussed in detail in Chapter 11.
Obstetric and Gynecologic Emergencies
Obstetric and gynecologic emergencies may overlap substantially with other abdominal and urinary conditions in their clinical presentation, and the emergency physician must prioritize the imaging evaluation based on the most dangerous, time-dependent, or likely diagnosis. Ultrasound is the preferred initial imaging test for most obstetric and gynecologic conditions, because it causes no radiation exposure (and is thus safe in pregnancy and in young female patients), can be performed portably, provides dynamic blood flow information for conditions such as ectopic pregnancy and ovarian torsion, and has good sensitivity and specificity for many gynecologic conditions. Often imaging with CT must be considered as well, because competing diagnoses such as appendicitis may sometimes be impossible to rule out with ultrasound. Imaging of conditions including ectopic pregnancy, ovarian torsion, ovarian masses, and tuboovarian abscess is discussed in detail in Chapter 12.
Abscesses, Cysts, and Masses
Abscesses, cystic masses, and solid masses may be detected with a number of modalities. CT, ultrasound, and MRI are generally accurate for masses, with sensitivity and specificity greater than 95%.305 Figures 9-120 through 9-128 demonstrate findings of abscess and mass.
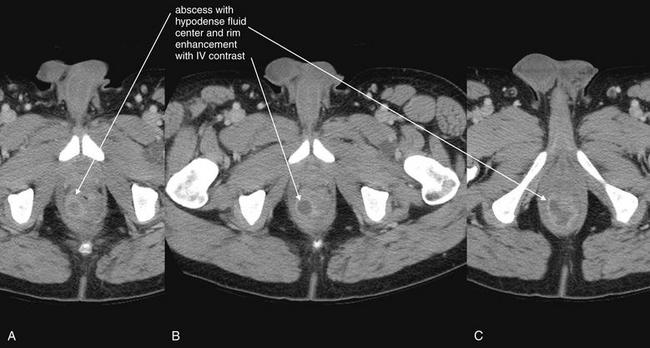
Figure 9-120 Perirectal abscess, CT with IV and oral contrast, soft-tissue window.
This patient presented with rectal pain but was afebrile and had only a mild leukocytosis (10.6×10⁹/L, with the upper limit of normal being 9.8×10⁹/L). Rectal examination did not reveal an obvious mass. A, B, C, Axial images, cephalad to caudad. An abscess abuts the rectum on the right. The abscess reveals typical findings: a hypoattenuating (fluid-density) center and an enhancing rim, which results from the administration of IV contrast. The orally administered contrast had not transited to the rectum at the time of this CT and was of no diagnostic benefit.
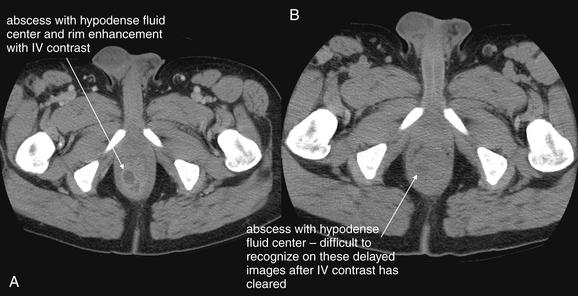
Figure 9-121 Perirectal abscess, CT with IV and oral contrast, role of contrast agents.
Are contrast agents needed for CT diagnosis of abscess? Contrast agents can be helpful, although many abscesses can be detected without any contrast. A, The appearance of a perirectal abscess after administration of IV contrast. The abscess shows rim enhancement, which makes the rim brighter than the surrounding soft tissues. The center of the abscess is quite hypodense relative to the enhancing rim. B, Delayed images taken after the bolus of IV contrast had dissipated. The rim of the abscess is not as conspicuous, and the center, although hypodense, is not as obvious because of the lesser degree of tissue contrast. An experienced reader would likely make the correct diagnosis, although the extent of the abscess might be less certain. The orally administered contrast had reached several slices higher but did not play a role in the diagnosis. Occasionally, rectal (or orally administered) contrast might help to differentiate the bowel lumen from an adjacent abscess.
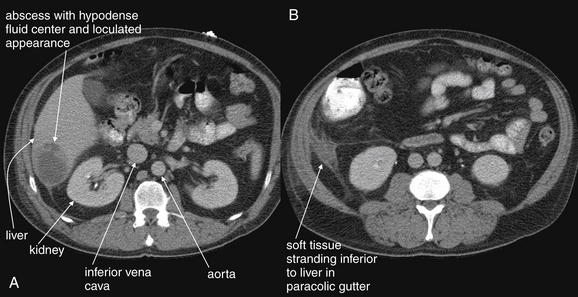
Figure 9-122 Liver abscess, CT with oral and IV contrast.
This 50-year-old male presented with high fever and rigors. He had undergone a laparoscopic appendectomy several weeks prior, complicated by a right lower quadrant abscess that had been percutaneously drained. CT scan of the abdomen was performed to assess for abscess. A, Axial CT shows a hypodense lesion in the liver, with a loculated appearance—consistent with abscess. B, Inflammatory soft-tissue stranding inferior to the liver also suggests that this is an infectious abscess. No abscess was seen in the right lower quadrant. The patient grew Clostridium ramosum from blood cultures, and a mixture of anaerobes was cultured from the abscess after CT-guided percutaneous drainage. Compare these images to Figure 9-121. Why is rim enhancement not present here? IV contrast was administered, but these images were taken after a delay (the patient underwent a chest CT with IV contrast first to evaluate for pulmonary embolism resulting from recent surgery). Look at the aorta, inferior vena cava, kidneys, and liver. They all show a small degree of enhancement compared with the psoas muscle but not the intense blush seen when CT is performed immediately upon IV contrast administration. A CT performed slightly earlier after IV contrast administration would have demonstrated rim enhancement of the abscess. This abscess likely would have been diagnosed without any contrast administration, because it is rather large and hypodense. To be fair, the difference in density between the liver and the abscess here is accentuated because the liver is moderately enhanced by the IV contrast. Oral contrast was also given, because of concern for appendiceal abscess, but played no role in the diagnosis of this hepatic abscess. In general, solid organ lesions do not require oral contrast for diagnosis.
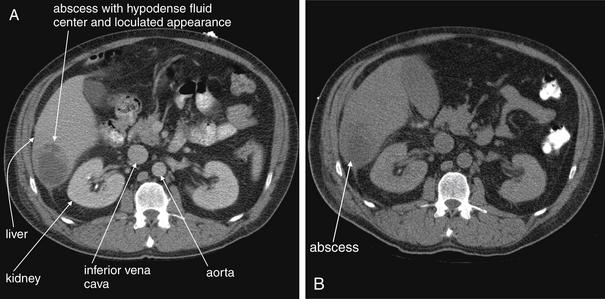
Figure 9-123 Liver abscess, comparison of CT with and without IV contrast.
Six hours after the initial CT with IV and oral contrast, the patient underwent CT-guided needle aspiration. No additional contrast agents were given at that time. A, The initial CT, performed shortly after IV and oral contrast administration. B, A slice through the same level, 6 hours later. The IV contrast has been cleared by the kidneys at this point, so this scan is a CT without IV contrast. Oral contrast remains in the descending colon. The abscess is visible without IV contrast, although the difference in contrast between liver parenchyma and fluid in the abscess is less pronounced.
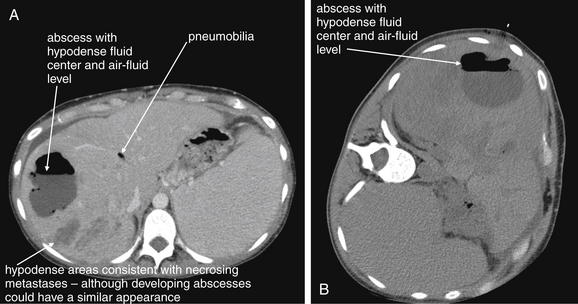
Figure 9-124 Liver abscess with air–fluid levels, comparison of CT with and without IV contrast.
This 28-year-old patient has a large hepatic abscess, in this case with a dramatic air–fluid level. The patient has metastatic pancreatic cancer (low-density lesions spread throughout liver) and had undergone a radiofrequency ablation and other invasive procedures, including biliary stent placement. Her CT also shows pneumobilia, which had been noted on prior CT scans following her biliary stent. She likely became bacteremic or seeded her biliary system with gastrointestinal flora, with areas of necrotic liver metastases then acting as a perfect culture medium for circulating bacteria. This abscess was percutaneously drained under CT guidance. The patient grew ampicillin- and vancomycin-resistant enterococci from blood and from the abscess aspirate. Cultures from the abscess also grew Klebsiella pneumoniae. This patient received oral and IV contrast for her CT, because the cause of her symptoms was not clear initially and a broad differential diagnosis was considered. The patient presented with intermittent fevers for 3 weeks, as well as chronic right upper quadrant pain, and was receiving chemotherapy. She also had a history of pancreatic pseudocyst, so a long list of abdominal disorders was considered. In retrospect, no contrast was needed to make this diagnosis. Air in the abscess does not require contrast for diagnosis, because it appears black without any contrast agents. The fluid in this abscess is extensive and quite hypodense relative to the liver parenchyma, although the difference in density is accentuated by the IV contrast enhancement of the liver. Oral contrast was a reasonable choice given the broad differential diagnosis being entertained, though it did not assist with the diagnosis of hepatic abscess. A, An axial slice from the patient’s CT with IV and oral contrast, obtained with the patient in the usual supine position. Air in the abscess has risen to the top of the cavity, while fluid remains dependent. B, For comparison, a slice through the same region is shown from the patient’s CT-guided drainage procedure the following day, during which no contrast agents were given. The patient is in a lateral decubitus position for the procedure, and the air–fluid level has shifted accordingly.
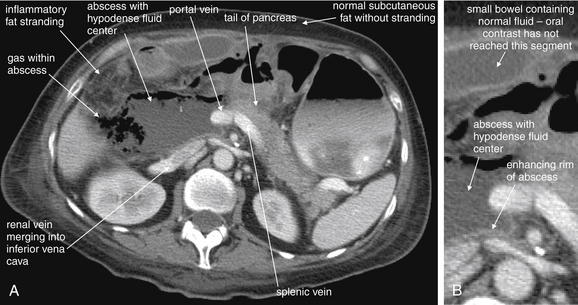
Figure 9-125 Abdominal abscess, developing in postoperative patient following Whipple procedure.
CT with oral and IV contrast, soft-tissue window. An abscess is visible in the region of the resected pancreatic head (the pancreatic tail was not removed). For orientation, several other structures are labeled. The abnormalities typical of an abscess include a fluid collection, rim enhancement with IV contrast, gas or air within the fluid collection, and stranding of adjacent fat. Compare this abnormal fat with normal subcutaneous fat that does not show stranding. A, Axial CT image. B, Close-up. Could this abscess have been detected without contrast? The hypodense abscess fluid, the fat stranding, and the gas within the abscess would all have been visible. The overall appearance might have been more confusing, because the pancreas, liver, blood vessels, and bowel in the region would have been more isodense with the abscess without the administered contrast agents. The boundaries of the abscess are likely better recognized with contrast, especially in this busy region of the central abdomen.
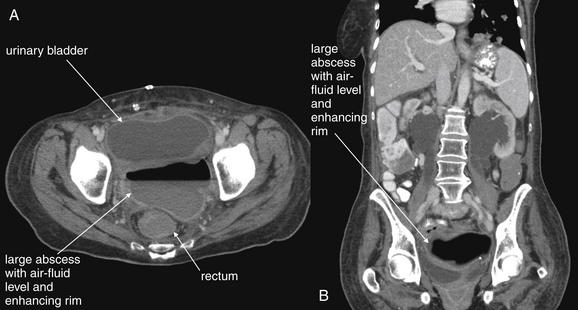
Figure 9-126 Pelvic abscess, developing following pelvic exenteration for mass, CT with IV and oral contrast.
This 63-year-old female with metastatic ovarian cancer presented with chills following resection of a pelvic mass. A, Axial image. B, Coronal image. An abscess is visible in the pelvis, deep to the urinary bladder. This abscess demonstrates classic findings of an air–fluid level and rim enhancement with IV contrast. The rectum is visible deep to the abscess (A).
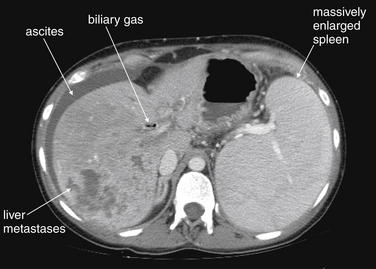
Figure 9-127 Metastatic disease, CT.
This patient has metastatic pancreatic cancer and related splenomegaly. Other findings in this CT (splenomegaly, biliary gas, and ascites) are discussed in detail elsewhere in this text. The liver is a common site of metastatic disease from many sources, including pancreatic and colon cancers. On IV contrast–enhanced CT, liver metastases frequently show rim enhancement with central hypodensity, reflecting central necrosis as these lesions outgrow their blood supply. Remember that a differential diagnosis exists for this appearance, including liver injury (contusion or hematoma) in the setting of trauma and abscess in the setting of suspected fever. On noncontrast CT, these lesions remain hypodense compared with the surrounding liver parenchyma, though less so than on IV contrast–enhanced CT, because normal liver enhances brightly with IV contrast. Hepatic cysts are typically more rounded than metastatic disease, although they too can be multiple. Other lesions that appear hypodense on noncontrast CT, such as hemangiomas, can be distinguished from metastases by their pattern of enhancement on IV-contrasted CT, including their contrast appearance on delayed images (taken periodically as time elapses from the time of contrast administration). Primary hepatic neoplasms such as hepatomas may have a similar appearance to these for the nonspecialist. Differentiating the multitude of hepatic lesions by their CT appearance is beyond the scope of this text, although it is important for the emergency physician to recognize the existence of a differential diagnosis to avoid misdiagnosis.
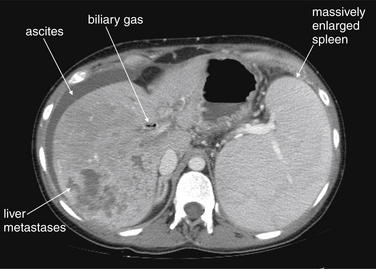
Figure 9-128 Splenomegaly, CT with IV contrast.
Splenomegaly can occur from many causes. A normal spleen can be difficult to measure with ultrasound, because it lies sheltered by the left costal margin in many cases. An enlarged spleen can usually be seen with ultrasound. CT readily reveals splenomegaly, as does magnetic resonance imaging (MRI). This patient has metastatic pancreatic cancer and related splenomegaly. The spleen is nearly as large as the liver in this cross section. This may be partly caused by thrombosis of the portal vein (not seen in this image, but noted in other CT images and confirmed with MRI in this patient). Remember that the splenic vein drains ultimately to the portal vein, so thrombosis of the portal vein may lead to splenomegaly. Other findings in this CT (biliary gas, metastatic disease, and ascites) are discussed in detail elsewhere in this text.
X-ray of Abscesses, Cysts, and Masses
X-ray findings of abscess, cyst, and solid mass are insensitive and nonspecific. Any of these may lead to obstruction of bowel, with findings described elsewhere in this chapter. Abscesses may occasionally demonstrate air–fluid levels, though these may be difficult to distinguish from air–fluid levels within bowel. Solid masses can increase x-ray attenuation. Some solid masses such as ovarian dermoid tumors (teratomas) may have internal calcifications, visible on x-ray. Other modalities are more sensitive and specific. The ACR rates CT with or without contrast as most definitive but continues to suggest x-ray as a reasonable initial study for a possible mass and to exclude bowel obstruction as a possible cause of an apparent mass. Interestingly, a mass is found in only about 16%-38% of patients referred for imaging of a possible mass.305
Ultrasound of Abscesses, Cysts, and Masses
Ultrasound can be used to assess for abscesses, cysts, and solid masses.305 Abscess cavities typically display heterogeneous contents, with both anechoic or hypoechoic (black) fluid contents and hyperechoic (white) semi-solid components. Air within an abscess may be evident as scattering of the ultrasound beam with acoustic shadows occurring deep to the air, a consequence of lack of through-transmission of sound. Simple cystic structures are often visible as spheroid structures with homogeneous anechoic or hypoechoic (black) fluid contents. Some cysts are more complex and display internal echoic septations, although the contents remain primarily anechoic. Solid masses are typically hyperechoic (bright), though the tissue density may vary between hypo echoic and hyperechoic relative to the adjacent organs. Calcifications within a solid mass are highly echoic (bright white) and cast acoustic shadows, much like gallstones. Ultrasound can also display the presence of blood flow within vascular lesions, including hypervascular solid masses and primary vascular anomalies such as hemangiomas and hemangioblastomas. The use of ultrasound for assessment of solid and cystic gynecologic conditions is discussed in more detail in Chapter 12. In general, ultrasound is useful for detection of abscesses, masses, and cystic structures within or adjacent to solid organs, which provide excellent acoustic windows for the ultrasound beam. Abscesses and masses associated with bowel may be more difficult to assess as a result of poor transmission of the ultrasound beam through bowel gas. Nonetheless, ultrasound diagnosis of appendiceal and diverticular abscesses can be performed, and percutaneous drainage of these lesions under ultrasound guidance is possible. The ACR306 recommends ultrasound as the most appropriate imaging modality for suspected abdominal abscess in the pregnant patient.
Computed Tomography of Abscesses, Cysts, and Masses
Abscess, cysts, and solid lesions are well-characterized by CT.305-306 With CT, a simple cyst is seen as a spherical structure with homogeneous contents, with a typical fluid density near or just above water density (0 HU) (see Figure 9-3). Simple cysts are visible without any contrast agents. Usually these structures do not enhance with IV contrast administration—in contrast to abscesses and vascular lesions such as hemangiomas. For example, a variety of cystic-appearing liver lesions can occur, sometimes differentiated on CT only by their temporal pattern of IV contrast enhancement. Differentiation of these lesions is beyond the scope of this text but may require CT with additional delayed image acquisition.
An abscess can be recognized on CT by several common features (see Figures 9-120 through 9-126). These include the presence of heterogeneous contents, including fluid contents 0 to +40 Hounsfield units in density (dark gray on a soft-tissue window), denser solid and semi-solid debris, and occasionally gas caused by bacterial metabolism (black or −1000 HU). Because of high blood flow, the rim of an abscess usually enhances with administration of IV contrast, giving it a bright appearance. IV contrast can make abscesses within solid organs more prominent by demonstrating abnormalities of enhancement. Fat surrounding an abscess may demonstrate inflammatory stranding. Enteral contrast may assist in differentiating adjacent loops of bowel (containing fluid and air) from an abscess. Enteral contrast delineates the bowel lumen, whereas an abscess would not be expected to fill with enteral contrast. Abscesses within solid organs such as the liver do not require enteral contrast for diagnosis—though often the emergency physician cannot suspect the specific site of abscess based on history or examination. Consequently, enteral and IV contrast should generally be administered when abscess is suspected, particularly if the abscess is believed to lie adjacent to bowel. Exceptions may include soft-tissue abscesses not thought to involve the peritoneal cavity, some suspected retroperitoneal abscesses such as perinephric abscesses, and solid-organ abscesses such as hepatic abscesses when their presence has already been disclosed by another modality such as ultrasound.306 CT with IV contrast can differentiate perirectal abscess from cellulitis. Usually enteral contrast (most often rectal) is also given to identify bowel and potential fistula.307 CT can be used to guide percutaneous drainage of abscesses. Studies show good outcomes in percutaneous drainage of periappendiceal abscess, with approximately 80% resolving without surgery (see Chapter 16 for a more detailed discussion).308
Mass lesions including metastatic disease can be recognized by CT (see Figures 9-127 and 9-128). IV contrast enhancement patterns can be important to the diagnosis, because certain lesions have a typical spatial and temporal pattern of enhancement (e.g., filling from the periphery or filling selectively during arterial or portal venous phases of enhancement). Characterizing mass lesions based on these criteria is beyond the scope of this text.309