Chapter 1 Applied Physiology of Body Fluids in Dogs and Cats
Appropriate treatment of fluid and electrolyte abnormalities requires a basic understanding of the physiology of fluid balance. The purpose of this chapter is to provide an overview of the principles of body fluid homeostasis, beginning with a brief review of body fluid compartments. This is followed by a discussion of measurement of solutes in body fluids and the concepts of anion gap, osmolal gap, and zero balance.
Distribution of body fluids
In health, approximately 60% of an adult animal’s body weight is water. Estimates of total body water in adult dogs that are neither very thin nor obese are 534 to 660 mL/kg.26,59 Total body water of adult cats also was determined to be approximately 60%.56 There are some species and individual variations in total body water, likely related to age, sex, and body composition. In humans, total body water decreases with age and is lower in women than in men.13 Neonatal dogs and cats have higher total body water content (80% of body weight) than adults (60% of body weight),30 and an age-related decrease in total body water has been described in puppies and kittens during the first 6 months of life.35 Total body water was approximately 70% of total body weight in racing Greyhounds, likely due to low body fat content.21 Because fat has a lower water content than lean tissue, fluid needs should be estimated on the basis of lean body mass to avoid overhydration, especially in patients with cardiac or renal insufficiency or in those with hypoproteinemia. Formulas for estimating lean body mass are based on the assumptions that (1) in normal small animal patients, approximately 20% of body weight is due to fat, (2) morbid obesity increases body fat to approximately 30% of body weight, and (3) body weight is a reasonable estimate of lean body mass in thin patients:


Water is the major component of all body fluids, which are distributed into several physically distinct compartments. Body fluids in each compartment equilibrate with fluids in other compartments by multiple mechanisms across a wide variety of membranes to maintain homeostasis. The volume of fluid in each of these compartments has been estimated using various isotope or dye dilution techniques and calculating their volumes of distribution. Results are expressed either as a percentage of body weight, which is easy to measure when calculating fluid therapy needs, or as a percentage of total body water, which is a useful conceptualization of body fluid compartments. Studies of body fluid compartments often are performed in experimental animals that have been anesthetized, splenectomized, or nephrectomized. Data from these kinds of studies vary with the protocol used and thus provide only approximations of fluid compartment sizes in healthy awake animals. The second edition of this book contains a more detailed discussion of the techniques involved in determination of total body water and the amount of fluid in the various compartments.
As shown in Figure 1-1, the largest volume of fluid in the body is inside cells. The intracellular fluid (ICF) compartment comprises approximately 40% of body weight (approximately two thirds of total body water). The composition of ICF is very different from extracellular fluid (ECF) (Fig. 1-2). Intracellular homeostasis is maintained by shifts in water, solutes, and numerous other substances across the cell membrane.
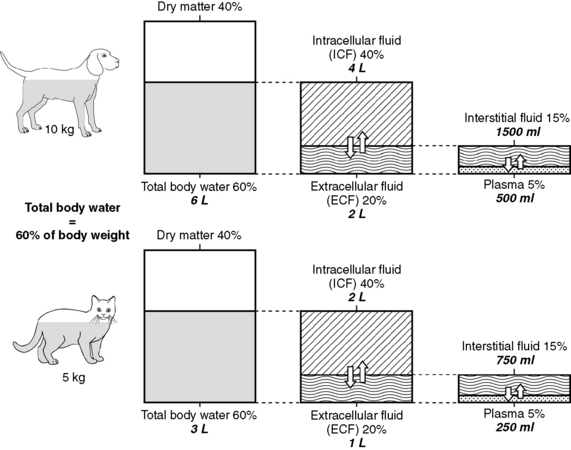
Figure 1-1 Compartments of total body water expressed as percentage of body weight and total body water for a 10-kg dog and a 5-kg cat.
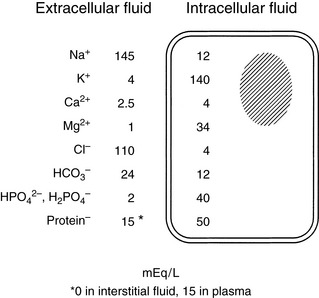
Figure 1-2 Average values for electrolyte concentrations in extracellular and intracellular fluid. Note the marked concentration differences for many electrolytes.
Any fluid not contained inside a cell is in the extracellular fluid compartment (approximately one third of total body water). Fluid shifts that occur during changes in hydration can have a marked effect on the ECF, and in most disease states, loss of fluids occurs initially from the ECF. For example, in diarrhea, a large volume of gastrointestinal fluid is lost; in renal failure, a large volume of ECF may be excreted. Fluid losses often are treated using parenteral fluids, which initially enter the ECF. Therefore, it is important to be able to estimate the volume of the ECF compartment and the volume of fluid lost to initiate appropriate fluid replacement and monitor fluid therapy.
Unfortunately, data from dye dilution studies of ECF volume are difficult to interpret because no indicator is truly confined to the ECF space. Estimates of ECF vary dramatically with the indicator used. ECF volumes reported for adult, healthy dogs and cats vary between 15% and 30% of body weight. The wide range in estimates of ECF volume likely results from the variety of techniques used to measure this space and the heterogeneity of ECFs, which include interstitial fluid (ISF), plasma, and transcellular fluids. Dense connective tissue, cartilage, and bone also contain a small amount of ECF. From a physiologic perspective and based on multiple studies using various indicators, the most accurate estimate of the ECF in adult small animals is 27% of lean body weight. However, an easier distribution of body fluids to remember is the 60:40:20 rule: 60% of body weight is water, 40% of body weight is ICF, and 20% of body weight is ECF (see Fig. 1-1). Many clinicians use 20% as an estimate for ECF when calculating fluid therapy needs for their patients.
As mentioned above and as shown in Figure 1-1, ECF is distributed among several different subcompartments. Most ECF (about three fourths) is in spaces surrounding cells and is called interstitial fluid. Although accurate studies of the size of the ISF compartment in dogs and cats have not been reported, estimates derived from measurement of fluids in other compartments indicate that the ISF comprises approximately 15% of body weight (approximately 24% of total body water). About one fourth of the ECF is within blood vessels and is called the intravascular compartment (plasma). Intravascular fluids are approximately 5% of body weight (approximately 8% to 10% of total body water). Most of the intravascular fluid is plasma. Plasma volume estimates range from 42 to 58 mL/kg in adult dogs that are neither very thin nor obese.26 Estimates for plasma volume in cats are 37 to 49 mL/kg.26 Blood volume, which includes erythrocytes, is a function of lean body mass, and estimated blood volume in dogs is 77 to 78 mL/kg (8% to 9% of body weight) and in cats is 62 to 66 mL/kg (6% to 7% of body weight).24 Racing Greyhounds may have higher blood volumes (110 to 114 mL/kg) than other breeds, possibly related to higher lean body mass.21
Fluids produced by specialized cells to form cerebrospinal fluid, gastrointestinal fluid, bile, glandular secretions, respiratory secretions, and synovial fluid are in the transcellular fluid compartment, which is estimated as approximately 1% of body weight (approximately 2% of total body water). Dense connective tissues, bone, and cartilage contain approximately 15% of total body water. However, these tissues exchange fluids slowly with other compartments. Because this fluid usually is not taken into account for routine fluid therapy, this compartment is not shown in Figure 1-1. Thus, a more simplified distribution of total body water often used for fluid therapy is:
Although body fluids traditionally are conceptualized anatomically within these various compartments, water and solutes in these spaces are in dynamic equilibrium across the cell membrane, capillary endothelium, and specialized lining cells. Fluids and electrolytes shift among compartments to maintain homeostasis within each compartment. In health, the concentration of a particular substance may be similar or very different among the various fluid compartments. During disease, fluid volumes and solute concentrations may change dramatically. Loss or gain of fluid or electrolytes from one compartment likely will alter the volume and solute concentrations of other compartments.
Distribution of body solutes
In addition to water, body fluids contain various concentrations of solutes. Total body content of solutes may be measured by cadaver analysis (desiccation) or by isotope dilution studies. Every solute has a space or apparent volume of distribution. Dilution studies of body solute content yield variable results, depending on the volume of distribution of the particular tracer used to estimate the solute space. There are limited data in the literature from cadaver and isotope dilution studies of body solute content in small animals, and most of the following discussion is based on data from studies in humans.13,48
Solutes are not distributed homogeneously throughout body fluids. Vascular endothelium and cell membranes have different permeabilities for various solutes. Healthy vascular endothelium is relatively impermeable to the cellular components of blood and to plasma proteins. Consequently, the volume of distribution of cells and proteins is the plasma space itself. However, the vascular endothelium is freely permeable to ionic solutes, and the concentration of these ions is almost the same in ISF as in plasma. Cell membranes maintain intracellular solutes at very different concentrations from those of the ECF. The compositions of solutes in the ECF and ICF are compared in Figure 1-2, and concentrations of solutes in plasma and in ISF and ICF are listed in Table 1-1.
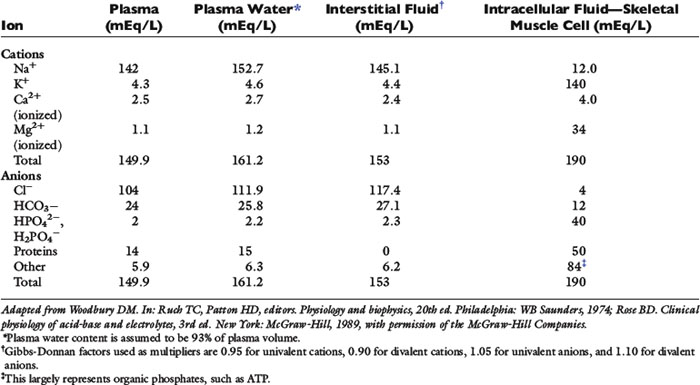
The slightly increased concentration of cations and anions in ISF compared with plasma water occurs primarily because of the presence of negatively charged proteins in plasma. The equilibrium concentrations of permeable anions and cations across the vascular endothelium are determined by the Gibbs-Donnan equilibrium, which occurs because negatively charged, nondiffusible proteins affect the distribution of other small charged solutes. In clinical practice, the difference in concentrations of anions and cations across the vascular endothelium is negligible, and the effects of the Gibbs-Donnan equilibrium are usually ignored. Thus, in clinical practice, plasma concentrations of solutes are considered to reflect solute concentrations throughout the ECF. Average values for plasma concentrations of important solutes in dogs and cats are given in Table 1-2.
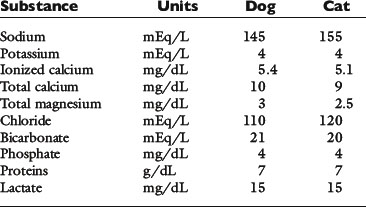
Table 1-1 shows that, although the solute compositions of ECF and ICF are quite different, the total numbers of cations and anions in all body fluids are equal to maintain electroneutrality. The most abundant cation in the ECF is sodium (Na+). Most of the body Na+ is in the extracellular space. Approximately 70% of body Na+ in humans is exchangeable, and 30% is fixed as insoluble salts in bone.48 The percentage of exchangeable sodium is important because only exchangeable solutes are osmotically active. Cell membranes are permeable to Na+, which tends to diffuse into cells. In health, however, cell membrane sodium, potassium-adenosinetriphosphatase (Na+, K+-ATPase) actively removes Na+ from cells, thus maintaining a steep extracellular-to-intracellular concentration gradient for Na+. The ECF also contains a small but physiologically important concentration of K+. For example, alterations in ECF K+ concentrations may result in muscle weakness (hypokalemia) or cardiotoxicity (hyperkalemia). The most abundant anions in ECF are chloride (Cl−) and bicarbonate (HCO3−). The volume of distribution of Cl− is primarily the ECF volume. Bicarbonate is present in all body fluids and can be generated from CO2 and H2O in the presence of carbonic anhydrase.
In contrast to ECF, the primary cations in ICF are K+ and magnesium (Mg2+). Most of the body K+ is in the ICF, where K+ is the most abundant cation. Cell membranes are permeable to K+. The K+ concentration gradient between ICF and ECF is maintained by cell membrane Na+, K+-ATPase, which moves K+ into cells against a concentration gradient. The ratio of intracellular to extracellular K+ concentration is important in generating and maintaining the cell membrane potential at approximately −70 mV (see Appendix). Almost 100% of body K+ in humans is exchangeable.48 Unfortunately, a reliable, practical method for measuring the intracellular K+ concentration is not available, and changes in serum K+ concentration may not reflect changes in total body K+ stores (see Chapter 5). The predominant anions in the ICF are organic phosphates and proteins.
ICFs are not homogeneous. Concentrations of solutes vary in different cell types and in different subcellular compartments. From a clinical perspective, these differences usually are ignored. The heterogeneity of solute distribution between ICF and ECF may, however, play an important role in some disease processes.
Transcellular fluids include cerebrospinal fluid, gastrointestinal fluid, bile, glandular secretions, and joint fluid. Transcellular fluids usually are not simply transudates of plasma. Transcellular fluid composition varies according to the cells that form the fluid. Concentrations of solutes in transcellular fluids will be discussed in later chapters, related to alterations in fluid balance involving specific transcellular fluids, such as loss of enteric fluids in diarrhea.
Units of measure
Definitions can be tedious, but familiarity with a few may help with understanding the subsequent sections in this chapter. The definitions are presented in sequence of discussion, not alphabetically.
Atomic mass (also referred to as relative atomic mass or atomic weight)
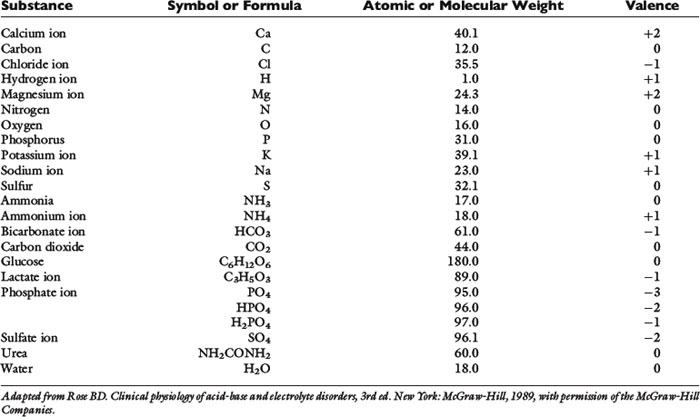
Most naturally occurring elements consist of one or more isotopes of that element, each of which has a different mass. For example, carbon in the environment consists of approximately 99% 12C and 1% 13C. The atomic mass of an element is an average mass based on the distribution of stable isotopes for that element, and is determined by the weight of that element relative to the weight of the 12C isotope of carbon, which is defined as 12.000. Atomic mass usually is reported with no units or as atomic mass units. The atomic mass is shown in most periodic tables of the elements. The atomic weights of some biologically important elements in body fluids are listed in Table 1-3.
Molecular mass (molecular weight)
Many elements combine to form physiologically important compounds. The molecular mass of a compound is the sum of the atomic masses of the atoms that form the compound. For example, the molecular mass of water (H2O) is 18 and represents two times the atomic mass of hydrogen (2 × 1) plus the atomic mass of oxygen (16). The molecular weights of important compounds in body fluids are shown in Table 1-3.
Formula weight
Ionic compounds do not really form molecules, and a more appropriate term for the mass of these substances is formula weight. For example, the formula weight of CaCl2 is the atomic mass of Ca2+ (40) plus two times the atomic mass of Cl− (2 × 35.5) = 111.
Mole
A mole is defined as 6.023 × 10²³ particles. Some physiology texts define a mole as the molecular (or atomic) weight of a substance in grams, but a mole really just describes 6.023 × 10²³ (Avogadro’s number) particles. It is defined as the number of atoms in exactly 12 g of 12C. One mole of a substance weighs its molecular weight in grams (see section on Molecular Mass).
Molar mass
The molar mass is the mass in grams of 1 mol of a substance. By definition, 1 mol of carbon has a mass of 12 g. Molar masses are numerically equivalent to atomic or molecular weights but are reported in grams. For example, 1 mol Na+ weighs 23 g. Molar mass and gram molecular weight often are used interchangeably.
Molality and molarity
Molality refers to the number of moles of solute per kilogram of solvent, whereas molarity refers to the number of moles of solute per liter of solution. The molarity and molality of most biologic solutions are approximately equal because the density of water is 1 kg/L. The slight difference between molarity and molality of a substance in plasma is because of nonaqueous proteins and lipids, which make up about 6% of the total volume. In body fluids, this difference is relatively unimportant, and the terms molality and molarity often are used interchangeably.
Millimole and milligram
The prefix “milli” refers to 1 one-thousandth. A millimole is 1 × 10⁻³ mol; a milligram is 1 × 10⁻³ g. Many biologic substances in body fluids are measured in millimoles or milligrams.
Concentration
Concentration refers to the amount of a substance that is present in a specified volume. The amount of a substance can be expressed as mass (grams or milligrams), moles (or millimoles), or equivalents (or milliequivalents). Volume usually is expressed as liters (L), deciliters (dL), or milliliters (mL). A deciliter is one tenth of a liter (i.e., 100 mL).
Many solutions used for fluid therapy are percent solutions. Percent concentration refers to a number of parts in 100 parts of solution. This may be used to express concentration in terms of weight per unit weight, weight per unit volume, or volume per unit volume. For example, a 0.9% solution of NaCl contains 0.9 g of NaCl per 100 mL of solution, because 100 mL of H2O is equal to 100 g of H2O (0.9 g NaCl/100 g H2O). Because a gram is equal to 1000 mg and a deciliter is equal to 100 mL of solution, a 0.9% solution of NaCl contains 900 mg of NaCl per deciliter (9 g NaCl/L). Similarly, a 10% solution of CaCl2 contains 10 g of CaCl2 per 100 mL of solution, or 10 g of CaCl2 per deciliter (100 g/L), and 5% dextrose contains 5 g of dextrose per deciliter (50 g/L).
Cation
A cation is an atom or molecule with a positive charge. A monovalent cation has one positive charge (e.g., Na+), and a divalent cation has two positive charges (e.g., Ca2+).
Anion
An anion is an atom or molecule with a negative charge. A monovalent anion has one negative charge (e.g., Cl−), and a divalent anion has two negative charges (e.g., SO42−).
Valence
Ions in body fluids combine according to ionic charge (valence) rather than weight. The number of cations (positively charged ions) in a solution always equals the number of anions (negatively charged ions) to maintain electroneutrality. A univalent anion has a charge of negative one (e.g., Cl−); a divalent cation has a charge of positive two (Ca2+). One atom of Ca2+ combines with two atoms of Cl− to form CaCl2. It is useful to express concentrations of solutes in body fluids in equivalents per liter (Eq/L) or milliequivalents per liter (mEq/L) to reflect the charge or valence of the solute. The equivalent weight of a substance is the atomic, molecular, or formula weight of a substance divided by the valance.
Electrochemical equivalence
Rose49 defines electrochemical equivalence as follows:
One equivalent is defined as the weight in grams of an element that combines with or replaces 1 g of hydrogen ion (H+). Because 1 g of H+ is equal to 1 mol of H+ (containing approximately 6.023 × 10²³ particles), 1 mol of any univalent anion (charge equals 1−) will combine with this H+ and is equal to 1 equivalent (Eq).
For example, 1 mol (1 equivalent) of Cl− combines with 1 mol of H+; 1 mol (1 equivalent) of Na+ could replace 1 mol of H+; 1 mol (2 equivalents) of Ca2+ combines with 2 mol (2 equivalents) of Cl− to form 1 mol of CaCl2. Therefore, it is useful to express concentrations of solutes in body fluids in equivalents per liter (Eq/L), thus reflecting the charge or valence of the solute.
Equivalent weight
The equivalent weight of a substance is the atomic, molecular, or formula weight divided by the valence. The milliequivalent (mEq) weight is 10−3 times the equivalent weight. For an element such as sodium, which has a valence of +1, the milliequivalent weight is equal to its atomic weight. Therefore, each millimole of Na+ provides 1 mEq. In contrast, the milliequivalent weight of Ca2+ is one half its atomic weight because its valence is +2. Each millimole of Ca2+ provides 2 mEq (0.5 mmol provides 1 mEq). These relationships may be summarized as:


Note: Multiplication by 10 in the numerator converts mg/dL to mg/L. Dividing by the molecular weight converts milligrams to millimoles. Multiplying by the valence converts to milliequivalents.
Phosphate can exist in body fluids in three different ionic forms: H2PO4−, HPO42−, and PO43− (see Chapter 7). At the normal pH of ECF, approximately 80% of phosphate is in the HPO42− form and 20% is in the H2PO4− form. Therefore, the average valence of phosphate in ECF is 0.8 × (−2) + 0.2 × (−1) = −1.8. At a normal plasma phosphate concentration of 4 mg/dL, the phosphate concentration expressed in mEq/L would be:
Osmolality and osmolarity
Regardless of its weight, 1 mol of any substance contains the same number of particles (6.023 × 10²³; Avogadro’s law). Solutes exert an osmotic effect in solution that is dependent only on the number of particles in solution, not their chemical formula, weight, size, or valence. One osmole (Osm) is defined as 1 g molecular weight of any nondissociable substance; therefore, each osmole also contains 6.023 × 10²³ molecules.
If a substance does not dissociate in solution (e.g., glucose), 1 mol equals 1 Osm. If a substance dissociates in solution, the number of osmoles equals the number of dissociated particles. For example, assuming that NaCl completely dissociates into Na+ and Cl− in solution, each millimole of NaCl provides 2 milliosmoles (mOsm): 1 mOsm of Na+ and 1 mOsm of Cl−. If a compound in solution dissociates into three particles, the number of osmoles in solution is increased three times (e.g., CaCl2). The milliosmolar concentration of a solution may be expressed as the solution’s milliosmolarity or milliosmolality.
Osmolality refers to the number of osmoles per kilogram of solvent. An aqueous solution with an osmolality of 1.0 results when 1 Osm of a solute is added to 1 kg of water. The volume of the resulting solution exceeds 1 L by the relatively small volume of the solute. In clinical veterinary medicine, osmolality is expressed as milliosmoles per kilogram.
Osmolarity refers to the number of osmoles per liter of solution. If 1 Osm of a solute is placed in a beaker and enough water is added to make the total volume 1 L, the osmolarity of the resulting solution is 1. In clinical medicine, osmolarity is expressed as milliosmoles per liter. In biologic fluids, there is a negligible difference between osmolality and osmolarity, and the term osmolality is used in this discussion
In clinical medicine, osmolality is measured in serum, because the addition of anticoagulants for plasma samples would increase solute in the sample. Serum osmolality usually is measured by freezing-point depression, which is more precise and accurate than vapor pressure determinations. One osmole of a solute in 1 kg of water depresses the freezing point of the water by 1.86° C.55 Average values for measured serum osmolality in the dog and cat are 300 and 310 mOsm/kg, respectively.8,17 Measured osmolality may not be the same as calculated osmolality (see later discussion).
Effective and Ineffective Osmoles
In any fluid compartment, the osmotic effect of a solute is in part dependent on the permeability of the solute across the membranes separating the compartment. Consider the two fluid compartments in a rigid box in Figure 1-3. Assume that the membrane dividing the two compartments is freely permeable to urea and water but is impermeable to glucose. When urea is added to the left compartment (top of figure), it moves down its concentration gradient from left to right, and water moves down its concentration gradient from right to left until there are equal concentrations of urea and water on both sides of the membrane. No fluid rises in the column attached to the left fluid compartment because urea is an ineffective osmole and does not generate osmotic pressure. In biologic fluids, urea is a small molecule that freely diffuses across most cell membranes and therefore does not contribute to effective osmolality.
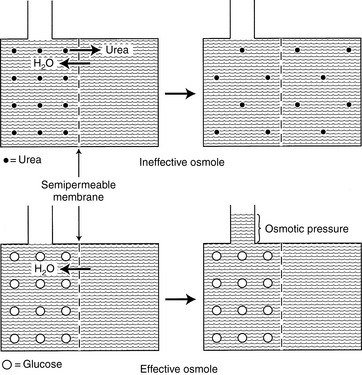
Figure 1-3 Effective and ineffective osmoles. Top, Effect of adding a permeable solute such as urea (small closed circles) to the fluid on one side of a membrane. In this setting, equilibrium is reached by urea equilibration across the membrane rather than water movement into the urea compartment. Consequently, no osmotic pressure is generated. Bottom, Effect of adding an impermeable solute such as glucose (large open circles) to the fluid on one side of a membrane. As water moves into the glucose compartment, hydraulic pressure is generated (measured by the height of the column of water above the glucose compartment), which at equilibrium equals the osmotic pressure of the solution.
When glucose is added to the left compartment (bottom of figure), water moves down its concentration gradient from right to left, but glucose cannot move across the membrane. This movement of water from a solution of lesser solute concentration across a semipermeable membrane to a solution of greater solute concentration is called osmosis. The influx of water into the left compartment resulting from the osmotic effect of glucose causes the solution to rise in the column. The height of fluid in the column is proportional to the osmotic pressure generated by glucose. In this example, glucose is an effective osmole because it generates osmotic pressure by causing a shift of water across the boundary membrane. Glucose is an effective osmole in this setting because the boundary membrane is impermeable to glucose but permeable to water. In biologic fluids, glucose can contribute to osmolality because it is not freely diffusible.
Tonicity
The effective osmolality of a solution is referred to as the tonicity of the solution. A freezing-point depression osmometer measures all osmotically active particles in the solution. Thus, the measured osmolality of a solution includes both effective and ineffective osmoles. The tonicity of a solution may be less than the measured osmolality if both effective and ineffective osmoles are present. Thus, the tonicity and osmolality of a solution are not necessarily equal—a circumstance that often is true in biologic solutions.
Measured Osmolality
The osmolality determined with an osmometer is the measured osmolality, which typically is not the same as the calculated osmolality estimated using various formulas.
Calculated Osmolality
The calculated osmolality is an estimate of serum osmolality using various formulas. The formulas include solutes that have a major contribution to total osmolality. Calculated osmolality often is less than measured osmolality because the formulas either exclude some osmotically active particles or estimate their contribution.
Example 1 Determine how many millimoles, milliequivalents, and milliosmoles of sodium and chloride there are in 1 L of a 0.9% solution of NaCl.
| Concentration of 0.9% NaCl: | 0.9 g NaCl/100 mL of solution = 900 mg NaCl/dL |
| Convert milligrams to grams and deciliters to liters | 900 mg NaCl/100 dL × 1 g/1000 mg × 10 dL/L = 9 g NaCl/L |
| Formula weight of NaCl: (use atomic weight from Table 1-3 or periodic table) |
Atomic mass of Na + atomic mass of Cl = 23 + 35.5 = 58.5 |
| Molar mass of NaCl: | 58.5 g |
| Convert grams to moles: | 9 g NaCl × (1 mol/58.5g) = 0.154 mol NaCl |
| Convert moles to millimoles: | 0.154 mol × (1000 mmol/mol) = 154 mmol NaCl |
| Determine millimoles of Na+ and Cl− | NaCl in solution dissociates into Na+ and Cl−, yielding 154 mmol/L of Na+ and 154 mmol/L of Cl− |
| Determine milliequivalents of Na+ and Cl− | millimoles × valence = milliequivalents Na+ and Cl− each have a valence of 1 154 mmol ×1 = 154 mEq of Na+ 154 mmol ×1 = 154 mEq of Cl− |
| Determine milliosmoles of Na+ and Cl− | NaCl in solution dissociates into Na+ and Cl−, so the mOsm/L in 0.9% NaCl is the sum of the mOsm for each component: 154 mEq/L Na+ + 154 mEq/L Cl− 154 mOsm/L Na+ + 154 mOsm/L Cl− = 308 mOsm/L |
Example 2 Determine how many millimoles, milliequivalents, and milliosmoles of calcium and chloride there are in 1 L of a 10% solution of CaCl2.
| Concentration of 10% CaCl2: | 10 g CaCl2/100 mL of solution = 10 g CaCl2/dL |
| To convert deciliters to liters: | 10 g CaCl2/dL × 10 dL/L = 100 g CaCl2/L |
| Formula weight of CaCl2: (use atomic weight from Table 1-3 or periodic table) |
Atomic mass of Ca + 2 × (atomic mass of Cl) = 40.1 + (2 × 35.5) = 111.1 |
| Molar mass of CaCl2: | 111.1 g |
| Convert grams to moles: | 100 g CaCl2 × (1 mol/111.1 g) = 0.9 mol CaCl2 |
| Convert moles to millimoles | 0.9 mol × (1000 mmol/mol) = 900 mmol CaCl2 |
| Determine millimoles of Ca+2 and Cl−: | CaCl2 in solution dissociates into Ca+2 and 2Cl, yielding 900 mmol/L of Ca+2 and 1800 mmol/L of Cl− |
| Determine milliequivalents of Ca+2 and Cl− | millimoles × valence = milliequivalents Ca+2 has a valence of 2; Cl− has a valence of 1 900 mmol Ca+2 × 2 = 1800 mEq of Ca+2 1800 mmol Cl− × 1 = 1800 mEq of Cl− |
| Determine milliosmoles of Ca+2 and Cl−: | CaCl2 in solution dissociates into Ca+2 + 2Cl− mOsm/L in 10% CaCl2 is the sum of the milliosmoles for each component: 1800 mEq/L Ca+2 + 1800 mEq/L Cl− 900 mOsm/L Ca+2 + 1800 mOsm/L Cl− = 2700 mOsm/L |
Colloid Osmotic Pressure (Oncotic Pressure)
Colloids are large molecular weight (MW = 30,000) particles present in a solution. The component of the total osmotic pressure in plasma contributed by colloids is called the colloid osmotic pressure (oncotic pressure). Plasma proteins are the major colloids present in normal plasma. Although colloid osmotic pressure is only about 0.5% of the total osmotic pressure, oncotic pressure is extremely important in transcapillary fluid dynamics. Oncotic pressure can be measured using a colloid osmometer (oncometer).
Several examples related to fluid therapy are included here to illustrate how these definitions may be used in clinical veterinary medicine.
Exchange of water between extracellular and intracellular fluid spaces
The number of osmotically active particles in each space determines the volume of fluid in the ECF and ICF compartments. The osmolality of physiologic fluids is dominated by small solutes that are present in high concentrations. In serum, sodium, potassium, chloride, bicarbonate, urea, and glucose are present in high enough concentrations to individually affect osmolality. Together these make up more than 95% of the total osmolality of serum. Larger molecules like albumin contribute little to the osmolality.
As mentioned above, osmotic activity depends on the solute and its permeability across the membrane. Sodium is the most abundant cation in the ECF. Although there is variation among different types of cells, many cell membranes are impermeable to sodium. Sodium movement across most cell membranes occurs by active transport. Consequently, Na+ and its associated anions account for most of the osmotically active particles in the ECF and as such are considered effective osmoles.
Glucose and urea are two other substances with potential osmotic activity. Many cell membranes are not freely permeable to glucose, in which case glucose would be osmotically active. In contrast, urea does not make a major contribution to effective osmolality in the ECF because it is a small molecule that is freely diffusible across most cell membranes. However, urea may have an impact on serum osmolality if its concentration is increased.
Osmolality of the ECF may be estimated using various formulas. This is called the calculated osmolality because it is based on estimating the contribution of osmotically active substances. Calculated osmolality by itself is not very useful because it is simply an estimate based on the concentration of commonly measured solutes. Calculated osmolality, which is an estimate, may not be the same as measured osmolality, which is determined by an osmometer.
The formulas for calculated osmolality include various combinations of the most osmotically active solutes, but none includes all osmotically active solutes because not all solutes are measured on routine biochemical profiles. The formulas also assume complete dissociation of some solutes, which may not be true in serum.
One of the most commonly used formulas for calculating the osmolality of serum is:48

In all formulas, Na+ and K+ are measured in millimoles per liter or milliequivalents per liter. In this formula, the contribution of Cl and HCO3− is estimated by multiplying the major cations by 2, assuming the serum must remain electrically neutral. The concentrations of glucose and blood urea nitrogen (BUN) are divided by 18 and 2.8, respectively, to convert milligram per deciliter to millimoles per liter (The molecular weight of glucose is 180 and the molecular weight of urea is 28, and there are 10 dL/L).
Several other formulas have been suggested for estimation (calculated osmolality) of the true serum osmolality (measured osmolality). These formulas vary based on which major solutes are included and whether constants are added to estimate the effects of other solutes. Including K+ is a more accurate estimate of measured osmolality. Remember, in all formulas, Na+ and K+ are measured in millimoles per liter or milliequivalents per liter. If glucose and BUN are measured in milligrams per deciliter, the conversion factor is included in the formula. If glucose and BUN are measured in millimoles per liter, delete the conversion factor (see later discussion). Alternate formulas are listed in the second edition of this book.
Not all potentially osmotic substances are osmotically active in body fluids. Cell membranes are permeable to urea and K+; therefore, these solutes are ineffective osmoles. Effective osmolality (tonicity) is calculated as:48

In healthy dogs and cats, the contribution of glucose to the effective osmolality of the ECF is small (about 4 to 6 mOsm/kg) based on blood glucose concentrations of 70 to 110 mg/dL. Therefore, 2 × [Na+] is a good approximation of the ECF effective osmolality.
All body fluid spaces are isotonic with one another. Thus, the effective osmolality of the ICF also may be estimated by doubling the ECF Na+ concentration, [Na+], even though the Na+ concentration in ICF is small. Because all body fluid spaces are isotonic, the tonicity of total body water also may be approximated by doubling the plasma [Na+]. The tonicity of total body water also may be expressed as the ratio of the sum of all exchangeable cations and all exchangeable anions to the volume of total body water. Exchangeable ions (denoted by the subscript letter “e”) are able to move throughout the fluid compartment. The total number of milliosmoles of exchangeable cations and anions may be estimated from the expression:
and
This relationship is represented graphically in Figure 1-4.14,49 Examination of Figure 1-4 shows that when total exchangeable Na+ increases, serum sodium concentration also increases,49 and these changes are usually associated with body fluid hypertonicity. A decrease in total exchangeable Na+ or K+ is associated with hyponatremia, a decrease in plasma osmolality, and hypotonicity. The effect of a decrease in total exchangeable K+ on serum [Na+] is not intuitively obvious but is clinically important.49 A decrease in serum [K+] results in a shift of K+ out of cells. To maintain electroneutrality, Na+ shifts into cells, thus causing hyponatremia.
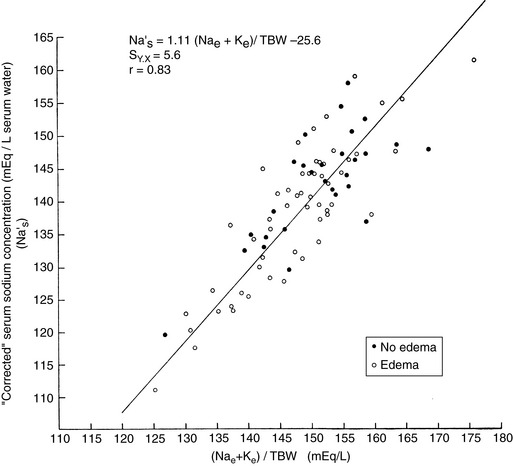
Figure 1-4 Relationship of plasma [Na+] to ([Na+]e ± [K±]e)/TBW. [Na+]e, total exchangeable Na+; [K+]e, total exchangeable K+; TBW, total body water.
(From Edelman IS, Leibman J, O’Meara MP, et al. Interrelations between serum sodium concentration, serum osmolarity and total exchangeable sodium, total exchangeable potassium, and total body water. J Clin Invest 1958;37:1236–1256.)
Serum (and therefore ECF) osmolality in dogs is approximately 300 mOsm/kg, and fluids with effective osmolalities greater than 300 mOsm/kg are hypertonic to plasma, whereas those with effective osmolalities less than 300 mOsm/kg are hypotonic to plasma. Those with effective osmolalities of 300 mOsm/kg are isotonic to plasma. In health, addition or loss of fluid or solute to or from the body results in alterations in body fluid space volumes and tonicity. These alterations elicit homeostatic shifts of fluid between compartments so that fluid spaces return to isotonicity (see Chapter 3).
In most disease states, fluid and solutes initially are lost from the ECF. Three basic types of fluid and solute loss may occur: solute in excess of water (loss of hypertonic fluids), isotonic loss (loss of isotonic fluids), or water in excess of solute (loss of hypotonic fluids) (Table 1-4).28 Solute and water losses theoretically may occur in any proportion along the continuum between solute loss with no water loss (e.g., peritoneal dialysis with a salt-poor solution) and water loss with no solute loss (e.g., water deprivation).
Table 1-4 Effect of Water and Solute Losses from Body Fluids
| Loss | ECF | Theoretical Replacement Fluid |
|---|---|---|
| Hypotonic | Hypertonic | Hypotonic |
| Isotonic | Isotonic | Isotonic |
| Hypertonic | Hypotonic | Isotonic/hypertonic |
When solute is lost in excess of water (hypertonic fluid loss), the osmolality of the ECF decreases relative to that of the ICF. This could be seen in oozing of serum from the skin of burn patients, which occurs much more commonly in human medicine than in veterinary medicine. Water passes from the ECF through the cell membrane to the ICF, thus diluting the ICF solute until the effective osmolalities of ECF and ICF are again equal. The osmolalities of both ICF and ECF decrease. This homeostatic fluid shift decreases ECF volume. When hypertonic fluid is lost from the ECF and volume depletion occurs, homeostatic water shifts further compromise the ECF volume and effective circulating blood volume, thus compounding fluid losses.
During water deprivation, the tonicity of ECF increases relative to that of the ICF. Water shifts out of cells and into ECF until the osmolalities of the two compartments are equal. The osmolalities of both ICF and ECF are greater than those during the state of normal hydration. This water shift augments the ECF volume, thus helping to preserve the effective circulating blood volume and protecting against the development of shock.
Loss or gain of isotonic fluid from the ECF results in no change in ECF osmolality, and no osmotically mediated water shifts between the ICF and ECF occur. Loss of isotonic fluid results in a decrease in ECF volume, whereas gain of isotonic fluid increases the ECF volume. Isotonic fluid loss, if of sufficient magnitude, results in hypovolemia and shock. These concepts are discussed further in Chapter 3.
Exchange of water between plasma and interstitial spaces
Most of the ECF is in either the interstitial compartment (approximately three quarters of the ECF) or the intravascular compartment, most of which is plasma (approximately one quarter of the ECF). The partitioning of fluid between plasma and ISF spaces is critically important for maintenance of the effective circulating blood volume. The effective blood volume has been defined as “the component of blood volume to which the volume-regulatory system responds by causing renal sodium and water retention in the setting of cardiac and hepatic failure even though measured total blood and plasma volume may be increased.”42,51
Exchange of solutes and fluid between plasma and interstitial spaces occurs at the capillary level. The volume of the vascular space is controlled by a balance between forces that favor filtration of fluid through the vascular endothelium into the interstitial space (capillary hydrostatic pressure and tissue oncotic pressure) and forces that tend to retain fluid within the vascular space (plasma oncotic pressure and tissue hydrostatic pressure). Oncotic pressure is the osmotic pressure generated by plasma proteins in the vascular space. Starling’s law describes these relationships (Fig. 1-5):
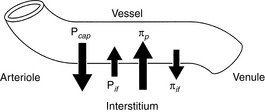
Figure 1-5 Factors affecting fluid movement at the level of the capillary. Pcap, Capillary hydrostatic pressure; Pif, interstitial hydrostatic pressure; πp, capillary oncotic pressure; πif, interstitial oncotic pressure.

where Kf represents the net permeability of the capillary wall, P represents the hydrostatic pressure generated by the heart (Pcap) or tissues (Pif), and π represents the oncotic pressure generated by plasma proteins (πp) or filtered proteins and mucopolysaccharides in the interstitium (πif).
The net filtration pressure in healthy capillaries is about 0.3 to 0.5 mm Hg at the proximal (arteriolar) end of the capillary.49 Near the venule, the forces favoring filtration are less than the forces favoring reabsorption of fluid into the vascular space, because capillary hydrostatic pressure decreases along the length of the capillary, but capillary oncotic pressure remains approximately the same.49 Some of the fluid that is filtered into the interstitium at the proximal end of the capillary is reabsorbed distally; the remainder of the filtered fluid is transported by lymphatics in the interstitium. The hydrostatic pressure transferred from arterioles to the capillaries is controlled by autoregulation of the precapillary sphincter. Autoregulation protects the capillary from increases in hydrostatic pressure caused by systemic hypertension, which otherwise could cause a dangerous loss of vascular fluid into the ISF by filtration.
During water depletion, capillary oncotic pressure increases and hydrostatic pressure may decrease if depletion is severe enough to cause hypovolemia. These alterations in Starling’s forces favor a decrease in net filtration of fluid into the interstitium at the level of the capillary. Increased reabsorption of ISF augments effective circulating blood volume, thus decreasing plasma protein concentration and increasing hydrostatic pressure. Conversely, loss of plasma protein decreases plasma oncotic pressure and increases the net force favoring filtration of fluid out of the capillary. Loss of intravascular fluid increases plasma oncotic pressure, but filtration of fluid into the interstitium produces the edema observed in hypoproteinemic states. Thus, in the healthy animal, maintenance of plasma volume depends on a fine balance between the forces favoring filtration and those favoring reabsorption in the capillary.
Electroneutrality and the anion gap
In body fluids, the sum of all cations must equal the sum of all anions to fulfill the law of electroneutrality. In the clinical setting, however, all anions and cations in body fluids are not routinely measured. Figure 1-6 compares the concentrations of the commonly measured anions and the commonly measured cations in a gamblegram. The commonly measured cations are Na+ and K+, and the commonly measured anions are Cl− and HCO3−. The sum of the concentrations of commonly measured anions is less than the sum of the concentrations of commonly measured cations. In other words, there are more unmeasured anions (UAs) than unmeasured cations (UCs). From this observation, the concept of the anion gap was developed. It is important to remember that there is no real difference between the total number of anions and the total number of cations in the body. In the clinical setting, the anion gap is used to predict changes in the UAs or less commonly in the UCs.
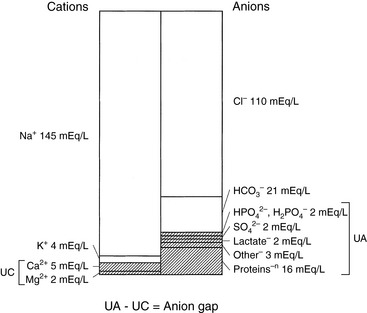
Figure 1-6 Relative concentrations of unmeasured anions (UAs) and cations (UCs) in extracellular fluid (ECF).
The anion gap is defined as the difference between the UAs and the UCs. According to the law of electroneutrality,


The range for the normal anion gap varies by species and is approximately 12 to 24 mEq/L in dogs and 13 to 27 mEq/L in cats (see Chapter 9). The average anion gap in dogs is 18 to 19 mEq/L11 and in cats is approximately 24 mEq/L.32 The higher average anion gap in cats suggests a higher net charge on proteins in this species. Younger animals may have a lower anion gap. Little information on variations in anion gap in pediatric small animal patients is available. In 3-day-old puppies, however, anion gap values were reported to be approximately 16 mEq/L in one study,37 suggesting that anion gaps in neonatal puppies are within the reference ranges for adults.
The primary usefulness of the anion gap is to detect an increase in UAs as an aid in the diagnosis of metabolic acidosis. Clinically relevant changes in the anion gap usually are from changes in UAs, and most of these changes are caused by increases in UAs associated with organic acids. For example, the ketoacidosis that occurs in some diabetic patients causes an increase in UAs, resulting in an increase in the anion gap. Similarly, the increased UAs that occur with ethylene glycol intoxication result in an increased anion gap. The derivation and clinical application of the principle of the anion gap are discussed further in Chapters 9 and 10.
The osmolal gap
The osmolal gap is defined as the difference between the measured and the calculated serum osmolalities:

Reference values for osmolal gaps in dogs are given in Table 1-5. Data for osmolal gaps in cats are not reported in the literature. Attempts to derive osmolal gaps from published data on measured serum osmolalities and electrolyte concentrations in cats have yielded confusing results (see footnote to Table 1-5). Values for the osmolal gap vary with the formula used to calculate osmolality. Numerous formulas have been derived to calculate serum osmolality (see earlier section on exchange of water between ICF and ECF spaces).
Table 1-5 Reference Ranges for Osmolal Gap
| Species | Osmolal Gap (mOsm/kg) | Reference |
|---|---|---|
| Dog | 10 ± 6 | Grauer15 |
| Dog | 10.1 ± 5.9 | Hauptman20 |
| Dog | 0-10 | Shull53 |
| Dog | 5 ± 6 | Burkitt7 |
Serum osmolality values in normal cats were reported to be approximately 308 ± 5 mOsm/kg (Chew et al8). When mean values for serum Na (155 mEq/L), K (4 mEq/L), glucose (120 mg/dL), and blood urea nitrogen (BUN; 24 mg/dL) are substituted into the equation 2(Na + K) + glucose/18 + BUN/2.8, a value of 333 mOsm/kg is obtained for cats. Calculated plasma osmolality values greater than measured values have generally been attributed to laboratory error. Why calculated plasma osmolality exceeds measured plasma osmolality using mean values from normal cats is unclear.
One of the most commonly used formulas to estimate osmolality is:
Some laboratories report a calculated osmolality based on these various formulas because it is easy to program the analyzer to perform the calculation. These are estimates of the actual osmolality, which must be measured using an osmometer. Serum osmolality most frequently is measured by freezing-point depression. Measured osmolality is higher than calculated osmolality because Osmm measures all osmotically active solutes, whereas the formulas used for Osmc do not account for all osmotically active solutes in serum. The difference (gap) between the measured (actual) and calculated (estimated) osmolality is called the osmolal gap.
Calculation of the osmolal gap is most helpful when unsuspected osmoles are present in ECF, thus increasing the osmolal gap as a result of an increase in the measured but not the calculated osmolality (e.g., ethylene glycol poisoning), and when assessing the significance of the serum Na+ concentration (see Chapter 3). During the acute stage (6 to 12 hours after exposure) of ethylene glycol toxicity, the osmolal gap is increased. This increased osmolal gap could be helpful in the diagnosis of ethylene glycol toxicity if a measured osmolality is requested. Hyponatremia with a normal osmolal gap suggests dilutional hyponatremia (e.g., overhydration). This rules out the presence of abnormal osmotically active particles that could cause a shift of water from ICF to ECF, thus decreasing the serum sodium concentration. The osmolal gap is discussed further in Chapter 3.
Homeostasis: zero balance
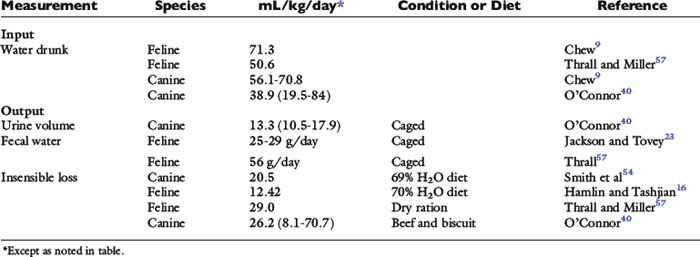
In the healthy adult animal at rest in a thermoneutral environment, the daily intake of water, nutrients, and minerals is balanced by daily excretion of these substances or their metabolic by-products. Thus, in this homeostatic state, the animal does not experience a net gain or loss of water, nutrients, or minerals and is said to be in zero balance. In a sedentary dog or cat in a thermoneutral environment, obligatory daily losses of water occur (Fig. 1-7). Input is equal to output in zero balance, and the volume of water added to body fluids by food and water consumption and by metabolism is equal to the volume of water lost in urine, feces, and saliva (i.e., sensible water loss) and evaporation from cutaneous and respiratory epithelia (i.e., insensible water loss).31 Although the classic definition of insensible water loss in healthy animals is water lost via the skin or lungs, in clinical veterinary medicine water lost in the feces and saliva also is included in insensible losses. This approach is used because it usually is impractical to measure fecal and salivary water losses, which are small under normal conditions. This chapter uses the clinical definition of insensible water loss. Although evaporative losses may be great in heat-stressed, exercising, or active animals, the most important and predictable obligatory daily loss of water in healthy, sedentary dogs and cats in a thermoneutral environment occurs via urine. Estimates for water input by drinking and water loss via urine, feces, or total insensible avenues in healthy dogs and cats are variable (Table 1-6).
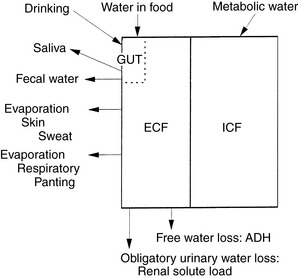
Figure 1-7 Total body water: daily input and obligatory losses.
(Adapted from Chew RW. Water metabolism of mammals. In: Mayer WW, Van Gelder RG, editors. Physiologic mammalogy, Vol II: mammalian reaction to stressful environments. New York: Academic Press, 1965: 43–177.)
Daily maintenance fluid requirement may be defined as the volume of fluid needed each day to maintain the animal in zero fluid balance. Maintenance needs thus are determined by daily sensible and insensible losses, by ambient temperature and humidity, by the animal’s voluntary or forced activity, and by disease. A high ambient temperature, especially with low humidity, results in increased insensible evaporative losses and, therefore, in increased maintenance fluid requirements. Similarly, fever and increased metabolic rate associated with disease may increase fluid requirements. Estimates of maintenance fluid requirements during thermal stress or disease usually are based on empirical adjustments of the estimated basal fluid requirements. Maintenance fluid requirements also are determined partially by composition of the diet. In dogs and cats, most absorbed dietary nitrogen and minerals not required to maintain zero balance or to provide for growth or tissue repair are excreted daily in urine. The volume of urine required for solute excretion thus is a function of both the amount of solute in the diet and the osmolality of the urine. Diets with higher solute contents require greater total water intake than do diets of relatively lower solute content. Most small animals have free access to water and therefore ingest sufficient water to support urinary excretion of dietary solutes. Sick animals often are inactive and have a poor appetite or are anorexic. Water requirements to replace insensible losses related to activity and to support renal solute excretion thus are decreased, and maintenance water requirements presumably are lower than those in healthy individuals. Increased insensible water losses caused by fever or increased metabolic rate during disease may offset this decrease in water requirement. Basal needs must be defined accurately if water requirements during disease are to be estimated using increments of basal requirements. To address this issue, the following discussion focuses on the relationship between basal water requirements and dietary solute in sedentary small animals in a thermoneutral environment.
Water losses
Urinary and fecal water loss
Daily urinary water losses may be divided into obligatory water loss (i.e., water needed to excrete the daily renal solute load) and free water loss (i.e., water excreted unaccompanied by solute under the control of antidiuretic hormone [ADH]). Clearance of free water increases during relative water excess, thus protecting the animal from the overhydration and hypotonicity that would result from retention of water in excess of solutes. Obligatory renal water loss must occur even in states of relative water deficit so that solute may be eliminated from the body. Similarly, a small daily, obligatory fecal water loss is required for fecal excretion of solute. Obligatory fecal water loss may increase if fecal solute increases (e.g., addition of CaCl2 or MgCl2 to the diet). These ions increase fecal solute, because Ca2+ and Mg2+ are poorly absorbed from the gastrointestinal tract. Maintenance water requirements must include at least enough water to allow renal and fecal solute excretion.
Obligatory urinary and fecal water losses
The amount of water required for elimination of the urinary solute load in theory depends on the maximal urine osmolality that can be achieved by the animal (Table 1-7). However, solute usually is not excreted at maximal urine osmolality, especially when water is readily available for voluntary consumption. Urinary osmolalities from experimental dogs at rest and in water balance ranged from 1000 to 2000 mOsm/kg.17 In a study of client-owned dogs, urine osmolality ranged from 161 to 2830 mOsm/kg, and urine osmolality was greater in the morning (mean, 1541 ± 527 mOsm/kg; range, 273 to 2620 mOsm/kg) than in the evening (mean, 1400 ± 586 mOsm/kg; range, 161 to 2830 mOsm/kg).58 There was no effect of sex on urine osmolality, but urine osmolality decreased significantly with age.
Table 1-7 Maximal Urine Osmolalities (mOsm/kg)
| Species | mOsm/kg | Reference |
|---|---|---|
| Dog | 2425 | Chew9 |
| Dog | 2791 | Hardy and Osborne17* |
| Cat | 3200 | Chew9 |
| Cat | 3420-4980 | Thrall and Miller57 |
| Cat | 2984 | Ross and Finco50* |
* Values obtained after dehydration resulting in 5% body weight loss.
Figure 1-8 depicts urine volume and urine osmolality plotted as a function of urine solute in a dog fed varying quantities of food.40 Increased intake produced increased renal solute and increased urine volume; however, urine osmolality remained approximately 1600 mOsm/kg (1200 to 2000 mOsm/kg).41 Urine osmolalities did not, as might be expected, increase toward the maximum attainable (2400 to 2800 mOsm/kg) in water-deprived dogs.9,17 Thus, urine osmolality is conserved in the presence of increased urine solute load by an increase in urine volume. The physiologic mechanisms that conserve urine osmolality as the renal solute load varies are not well defined.
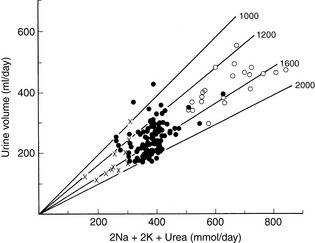
Figure 1-8 Urine volume of a dog plotted against urinary excretion of solute (2Na + 2K + urea) during consumption of 320 (∞), 385 (l), and 770 (s) grams of food. Each symbol represents data from 1 day. The lines labeled 1000, 1200, 1600, and 2000 indicate urine osmolality (mOsm/kg).
(From O’Connor WJ, Potts DJ. Kidneys and drinking in dogs. In: Michell AR, editor. Renal disease in dogs and cats: comparative and clinical aspects. Oxford, UK: Blackwell Scientific, 1988: 35.)
The renal solute load is derived from dietary sources of protein and minerals and comprises urea, Na+, K+, Ca2+, Mg2+, NH4+, and other cations and PO43−−, Cl−, SO42−, and other anions. When estimating solute load from the diet of an animal in zero balance, all nitrogen is assumed to form urea. Urea constitutes two thirds of the urinary solute load in dogs.40 The amount of solute in the diet is determined by the composition and the quantity of food and minerals ingested. Increasing dietary protein results in increased urea production. Metabolism of carbohydrates and fats yields only CO2 and H2O and does not produce urea or other solutes that must be excreted in the urine. Diets high in minerals that are well absorbed from the gut (usually NaCl) provide more solute for excretion.
Not all solute produced by metabolism of ingested and absorbed food is necessarily excreted in the urine. Fecal excretion of solutes does occur. In most healthy dogs, however, daily fecal Na+, K+, and Cl− excretion is substantially lower than urinary mineral excretion. The daily renal solute load is thus a function of the quantity of food ingested and of diet composition. Assuming a range of urine osmolalities in healthy dogs between 1000 and 2000 mOsm/kg and a urine solute load of approximately 400 mOsm in a 10-kg dog, the range of urine output would be 200 to 400 mL or 20 to 40 mL/kg/day. Urine volume is thus a function of renal solute load. Another important factor that determines urine volume is the total quantity of water ingested per day. Total water consumption depends both on water in the diet and on water voluntarily consumed by drinking.
Urinary free water
Excretion of urinary free water is controlled by stimulation or inhibition of secretion of ADH and by thirst. Urinary free water increases when enough water has been ingested to dilute body solute and result in hypotonicity. A 1% to 2% decrease in serum osmolality inhibits secretion of ADH and abolishes thirst in humans.45,46 During water depletion, body water osmolality increases and ADH secretion is stimulated. An increase in serum osmolality of 1% to 2% is sufficient to provoke maximal ADH secretion in humans.45,46 In dogs, increases in osmolality of 1% to 3% stimulate thirst.39,41 A water loss of 5 mL/kg of body weight provoked drinking in experimental dogs.47 Therefore, daily urinary free water losses are very small during water deficiency in otherwise healthy dogs and cats.
Respiratory and cutaneous evaporative losses
Cutaneous evaporative water losses usually are small in dogs and cats. Cats in hot environments are reported to lick themselves with saliva to promote evaporative cooling.9 This phenomenon is rarely observed in clinical practice, but if it occurs, salivary water losses could significantly increase water need. Evaporative water loss from the skin is minimal in dogs and cats because eccrine sweat glands (which are limited in distribution to the foot pads) do not participate in thermoregulation in these species. Evaporative water losses usually are less in healthy, sedentary cats in a thermoneutral environment compared with dogs (see Table 1-6), probably because cats rarely pant. Evaporative losses in caged, sedentary laboratory dogs are quite variable from dog to dog, and some individuals experience significant daily losses via this route (Table 1-8). Dogs in the study summarized in Table 1-8 fell into two categories: those that remained quiet in their cages all of the time and those that ran in circles, barking for several hours each day. The mean evaporative loss for all dogs was 27 mL/kg/day. This value overestimates evaporative loss in quiet dogs. For dogs at rest, evaporative losses usually were less than 1 mL/kg/hr. During periods of activity, evaporative losses were estimated at almost 7 mL/kg/hr.40
Table 1-8 Water Intake and Urinary Losses of Solute and Water in Six Sedentary Experimental Dogs Receiving the Same Diet
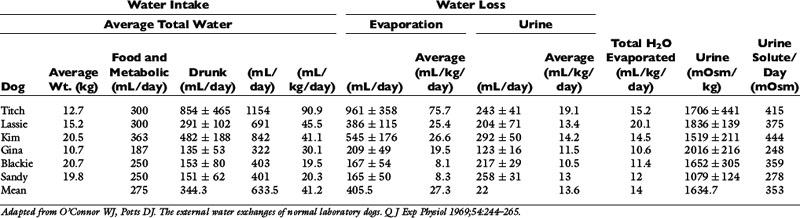
The total water intake per day of the dogs in Table 1-8 was quite variable from dog to dog, ranging from approximately 20 to 91 mL/kg/day. If insensible loss (primarily composed of respiratory evaporative loss) for each dog is subtracted from total daily water intake, the range of water intake unrelated to insensible losses is narrower (11 to 20 mL/kg/day) than the range for total water intake. This emphasizes the profound effect that insensible losses may have on daily water balance in dogs.
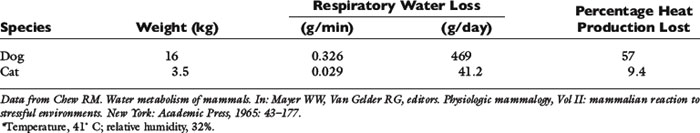
Increases in ambient temperature, especially in association with low relative humidity, may result in marked increases in respiratory water evaporation in dogs. The panting response to heat is more efficient in dogs than in cats. At an ambient temperature of 40° C, cats increase their respiratory rate 4.5 times, whereas dogs can increase their respiratory rate 12 to 20 times.9 The estimated respiratory water loss in a panting dog at 41° C was 469 mL/day, whereas that for a cat under the same conditions was 41 mL/day (Table 1-9).
Water intake
Water in food
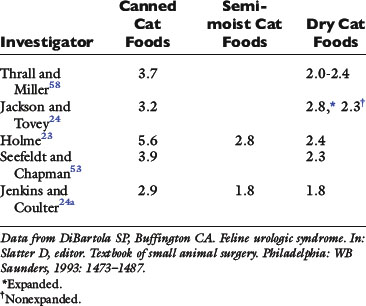
The percentage of water in pet foods is variable. In general, canned foods are more than 70% water, semimoist foods 20% to 40% water, and dry foods less than 10% water.29 Two representative cat diets are described in Table 1-10. Therefore water in food makes up a variable proportion of total daily water consumption, depending on what type of diet is fed (Figs. 1-9 and 1-10). Cats can exist without drinking water if fed a diet of cod, salmon, or beefsteak.43 If the beefsteak or salmon was partially desiccated, cats became hydropenic (increased serum osmolality and serum sodium concentration), anorexic, and cachectic. Thus, cats may meet their water needs solely from the water in some foods.
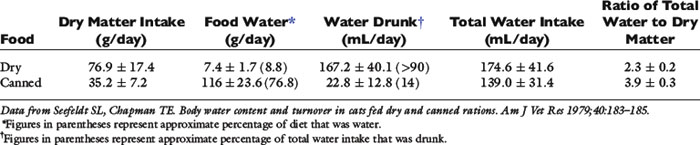
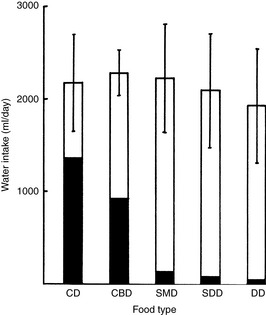
Figure 1-9 Effect of food type on water intake in dogs. Each column represents the total daily water intake (mean ± SD) for four dogs fed different diets. The solid area shows the amount of endogenous food water; the clear area shows water drunk. CD, canned; CBD, canned meat and biscuit mixture; SMD, SDD, intermediate moisture foods; DD, dry.
(From Burger IH, Anderson RS, Holme DW. Nutritional factors affecting water balance in the dog and cat. In: Anderson RS, editor. Nutrition of the dog and cat. Oxford, UK: Pergamon Press, 1980: 149.)
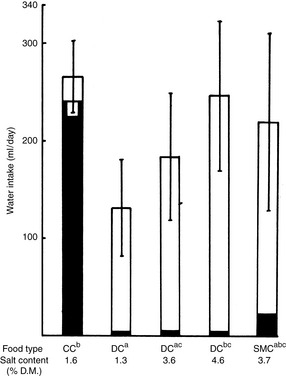
Figure 1-10 Effects of food type and salt content on water intake in cats. Each column represents the total daily water intake (mean ± SD) for cats on various diets. The same group of six cats was used for all foods except a DC diet 4.6% salt, data for which were obtained from a different experiment using another group of 12 cats. The solid area shows food water, and the clear area shows water drunk. Total water intake for foods bearing different superscript letters is significantly different (P <.05, Student t test). CC, canned; DC, dry; SMC, intermediate moisture food.
(From Burger IH, Anderson RS, Holme DW. Nutritional factors affecting water balance in the dog and cat. In: Anderson RS, editor. Nutrition of the dog and cat. Oxford, UK: Pergamon Press, 1980: 151.)
Drinking
The volume of water voluntarily ingested each day by healthy, sedentary dogs and cats in a thermoneutral environment depends on the composition and the quantity of the diet ingested. Water intake decreases in experimental dogs if food intake is limited (Fig. 1-11).9,10,33,34 After a 1-day fast, drinking decreased to 25% to 50% of the normal volume in dogs. After a 14- to 18-day fast, drinking was 45% of the normal volume in dogs.9 Conversely, if water intake is limited, food intake decreases in dogs and cats.43 As mentioned earlier, cats continue to eat and survive on some diets without drinking water. In dogs that are chronically deprived of food, a basal level of drinking is maintained.2 In sick, anorexic small animal patients, drinking may decrease, and because such animals do not have access to water from food, total water intake may decrease drastically. However, the water requirement of such animals is probably quite low. In quiet, sick animals, the major obligatory water loss occurs via urine (assuming no other major contemporary fluid loss, such as in diarrhea or vomitus). The renal solute load and obligatory renal water loss decrease because the animal is not eating. However, animals in a catabolic state obviously do produce urea and ions for excretion as a result of catabolism of lean body mass. Figures for renal solute loads generated from endogenous sources are not readily available in the literature. Water requirements of a sick animal may be increased if the animal is febrile, having seizures, or experiencing abnormal losses, such as in vomitus or diarrhea. These contemporary water needs are in addition to the maintenance water required to maintain zero balance during inanition and inactivity in the presence of diminished but still present obligatory urinary water losses.
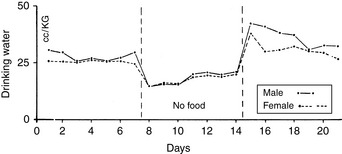
Figure 1-11 Comparison of composite drinking curves of male and female dogs during alimentation and food deprivation. Each curve is the composite of 10 experiments.
(From Cizek LJ. Long-term observations on the relationship between food and water consumption in the dog. Am J Physiol 1959;197:342–346.)
The volume of water drunk increases as the water in the diet decreases (see Table 1-10). Dogs maintain a uniform total water intake when food water is decreased by commensurately increasing drinking (see Fig. 1-9). However, cats may not increase drinking enough to maintain total water intake when consuming a diet low in water (see Fig. 1-10). Cats receiving dry food diets may ingest insufficient water. This issue has been investigated extensively as a contributing factor in the development of lower urinary tract disease in cats. Some investigators believe that a low ratio of total water intake to dry matter in the diet predisposes a cat to lower urinary tract disease. Diets with a ratio of total water to dry matter greater than 3 have been suggested as an aid in the prevention of lower urinary tract disease.4,22 The ratio of total water to dry matter is an index of the moisture content of the food and of the cat’s drinking response to that diet. As predicted, canned foods have higher ratios than dry foods (Table 1-11). Although cats drink more when consuming dry instead of canned foods, their total water intakes are usually lower with dry than with canned foods.
The solute load of the diet also influences water drinking. Approximately two thirds of the renal solute load is urea, an end product of protein metabolism, and increasing the protein content of the diet increases the renal solute load. Diets higher in protein also are associated with greater total water intake. The ions Na+, K+, Ca2+, Mg2+, PO43−, Cl−, and SO42− also contribute to dietary solute. Increasing percentages of salt in foods are associated with increased water intake in both cats and dogs.6,22 This principle has been exploited to increase voluntary water consumption in cats that are fed dry food diets and are at risk for developing lower urinary tract disease.
Metabolic water
Metabolic water contributes approximately 10% to 15% of total water intake in dogs and cats, depending on the diet.4 Nutrients differ in their yield of metabolic water (Table 1-12). Although fats provide the most water per gram, carbohydrates provide the most water per calorie and per liter of oxygen.3,9 Therefore, high-carbohydrate diets spare the water requirement by providing more metabolic water per calorie. Carbohydrates and fats also spare water loss because they do not generate renal solute.3 The volume of metabolic water generated per day in humans, and by inference in dogs and cats, is relatively small compared with the total daily water intake.12 Metabolic water is difficult to quantitate in the clinical setting, and many studies ignore its contribution to water homeostasis. Definitive water balance studies should include evaluation of metabolic water.52
Table 1-12 Metabolic Water per Gram of Nutrient
| Nutrient | Grams Metabolic Water per Gram of Nutrient |
|---|---|
| Carbohydrate | 0.6 |
| Protein | 0.41 |
| Fat | 1.07 |
Data from Davidson S, Passmore R, Brock JR, et al. Water and electrolytes. In: Davidson S, editor. Human nutrition and dietetics. Edinburgh: Churchill Livingstone, 1979: 81–89.
Water requirements
Maintenance
Water balance is complex, and there is no single maintenance water requirement for each animal. In healthy, sedentary dogs and cats in a thermoneutral environment, water intake is largely dependent on diet. Water requirement is a function of the renal solute load in the diet and the associated obligatory renal water losses for urinary solute excretion. In clinical practice, maintenance fluid needs in small animal patients are often empirically defined as 60 mL/kg/day for smaller dogs and 40 mL/kg/day for larger dogs.36 Alternatively, maintenance needs have been assessed on the basis of caloric needs: 1 mL of water per kilocalorie (kcal) of energy required.18,19 Early studies of water balance in healthy, caged dogs documented that mean water intake was approximately 1 mL/kcal ingested.2 Normal maintenance energy requirement is defined as the number of calories required to sustain the basal metabolic rate; to provide energy for digestion, absorption, and assimilation of nutrients (thermal effect of feeding); to maintain body temperature in a nonthermoneutral environment; and for normal activity.25 Maintenance energy expenditure may be calculated from the following formula:5

A 10-kg dog would require 750 kcal of energy per day or 75 kcal/kg/day. Following the rule of 1 mL/kcal, the water requirement would be 75 mL/kg/day.
Opinions vary on the formula for calculating maintenance caloric needs.38 Basal energy requirements may be calculated and then multiplied by a factor of approximately two38 to obtain maintenance needs. The basal energy requirement is defined as the caloric need of a resting, healthy dog in a postabsorptive state (i.e., renal solute load has been excreted) about 18 hours after feeding25 and in a thermoneutral environment. Basal energy requirement has been variously calculated from the following formulas:1,5


There has been considerable debate over the most appropriate exponent to use to relate body weight to metabolic size in the dog.1,27,44 We prefer the exponent 0.655 and use formula (b), which has been supported in the veterinary literature.27,44
Maintenance energy requirements are higher than basal needs primarily to provide calories for the normal activity of a healthy dog. Based on formula (b), a 10-kg dog has a basal energy requirement of 44 kcal/kg/day and a maintenance requirement of 88 kcal/kg/day. Assuming 1 mL of water required per kilocalorie of energy need, the maintenance water requirement for this dog would be approximately 88 mL/kg/day. A 50-kg dog would require 25 mL/kg/day for basal water needs and 50 mL/kg/day for maintenance. If basal water requirements were estimated from formula (a), a 10-kg dog would have a basal daily water requirement of 38 mL/kg and a maintenance requirement of 76 mL/kg.
Estimates of maintenance water needs based on caloric requirements are similar to the empirical values for maintenance needs used by some clinicians. However, it is important to remember that caloric needs are a logarithmic function of body weight, and larger dogs require less fluid per kilogram of body weight than smaller dogs.
The physiologic reason for the correlation between caloric and water needs is not well documented. The relationship may, in fact, be indirect. Water requirements and caloric needs may be related because water intake is in part a function of renal solute load, which is related to diet—both to the quantity of food ingested and to the composition of the food. However, the renal solute load per calorie in the diet varies with the composition of the diet. Diets vary in water content (dry vs. canned) and in nutrient composition, and hence in renal solute load per calorie. Fats provide more kilocalories per gram (9 kcal/g) than do carbohydrates or proteins (4 kcal/g). Fats provide more milliliters of water per gram (1.07) than do carbohydrates (0.56) or proteins (0.40).3 High-protein diets increase renal solute load, whereas fats and carbohydrates do not contribute to it. The mineral content of diets also varies. Therefore, the animal’s water requirement may be viewed more accurately as a function of total water content and renal solute load of the diet rather than strictly as a function of calories ingested. Thus, the relationship 1 mL of water per 1 kcal of energy may be fortuitous.
Basal
Fluid requirements for sick, inappetent small animals have not been well documented. Decreased food intake or anorexia decreases renal solute load and hence water requirements. However, clinicians frequently base estimates of water requirements for patients on tables derived from the formula for maintenance energy requirements: 140 × body weight (kg)0.73.19 Haskins19 commented that the use of tables for water intake based on this formula might overestimate the water requirements of sick patients. In fact, the water requirement of an inappetent, sedentary sick animal in a thermoneutral environment may approach basal water need. The basal water requirement for a healthy animal may be defined analogously to the basal energy need, as water required when the animal is resting is in a postabsorptive state (i.e., the renal solute load has been excreted) and is not exposed to thermal stress.
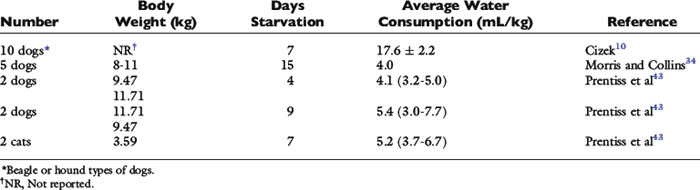
Basal water needs of dogs and cats have not been well studied. Water intake of healthy dogs and cats in a thermoneutral environment and deprived of food has been measured in a few experiments (Table 1-13). Two investigators found that quiet, food-deprived dogs (body weights 8 to 15 kg) or cats (approximately 3.5 kg) confined to metabolism cages drank about 5 mL/kg of water daily. A third investigator found that intake was considerably higher (17.6 ± 2.2 mL/kg/day) in dogs of about the same body weight. The dogs in the latter experiment may have been more active and may have had larger evaporative losses and greater compensatory drinking than dogs or cats in the previous experiments. If basal water need is estimated by determining the basal energy requirement, using the preceding formula,1 the water requirement of a 10-kg dog would be 40 mL/kg/day, assuming 1 mL of water per kilocalorie of energy required. Data for dogs deprived of food suggest that basal water requirements may be much lower. This fact is not surprising if we consider that when water intakes of dogs in the study by O’Connor and Potts40 (see Table 1-8) were corrected for water intake that balanced evaporative losses, total water intakes were 11 to 20 mL/kg/day. This value approximates the accepted general range for daily urine production in dogs. Thus, if dogs are deprived of food and urine volumes decrease substantially (renal solute load decreases), the water need may be small.
Water requirements of sick animals may be increased over basal requirements owing to increased contemporary fluid losses caused by evaporation (through panting), diarrhea, vomiting, or dilute urine. Clinicians must estimate how much water needs increase by assessing the volume of these additional fluid losses. However, fluid needs still may not approach 40 to 60 mL/kg/day.
Assessing the basal water needs of dogs and cats from the basal energy requirement provides a high estimate for water compared with the minimal requirement documented in experiments with dogs and cats deprived of food. This disparity makes estimating basal water needs of inappetent, quiet dogs problematic. Data on basal water needs of small animals would help clinicians to devise appropriate strategies for fluid therapy in inappetent, sick animals by providing a baseline assessment from which maintenance or replacement fluid needs may be estimated by use of a multiplication factor (i.e., maintenance = 2 × basal water need). Current methods for assessing fluid needs may overestimate the patient’s actual requirements because sick patients are inappetent and inactive. Administration of an excessive volume of fluid could be detrimental, especially to patients with heart failure or oliguric renal failure. Most patients respond satisfactorily to currently used standard fluid-replacement regimens, because the kidneys readily excrete excess fluid and solute. When calculating water needs, however, it would be prudent to consider that inactive, sick animals with decreased or no food intake may require less water than usual empirical estimates may indicate.
Appendix
The cell membrane is composed of a hydrophobic lipid bilayer with embedded protein molecules that play structural and functional roles. This configuration allows the cell membrane to act as an electrical capacitor that stores energy. Some of the embedded proteins act as hydrophilic pores in the membrane. One embedded functional protein is Na+, K+-ATPase, which pumps sodium out of and potassium into the cell in an Na/K ratio of 3:2. In this model, the cell membrane acts as a capacitor; the hydrophilic protein pores provide resistance; and the Na+, K+-ATPase provides energy.
The intracellular concentration of potassium (140 mEq/L) is much higher than its extracellular concentration (4 mEq/L). Consequently, potassium diffuses out of the cell down its concentration gradient. However, the cell membrane is impermeable to most intracellular anions (e.g., proteins and organic phosphates). A net negative charge develops inside the cell as potassium ions diffuse out of the cell, and a net positive charge accumulates outside the cell. As a result, a potential difference is generated across the cell membrane. The principal extracellular cation is sodium, which enters the cell relatively slowly down its concentration and electrical gradients, because the cell membrane is much less permeable to sodium than to potassium. Diffusion of potassium from the cell continues until the ECF acquires sufficient positive charge to prevent further diffusion of potassium ions out of the cell.
The ratio of intracellular and extracellular concentrations of potassium ([K+]I/[K+]O) is the major determinant of the resting cell membrane potential difference. This potential difference is demonstrated by the Nernst equation, which is derived from the general equation for free-energy change (GC):
where R is the gas constant (8.314 J/K/mol), T is the absolute temperature in K (°C + 273), [c+]I is the concentration of cation inside the cell, [c+]O is the concentration of cation outside the cell, z is the valence, F is the Faraday constant (96,484 C/Eq), and Em is the membrane potential in volts.
The first term on the right side of this equation represents the osmotic work required to transport 1 mol of particles across the membrane against a concentration gradient of [c+]I/[c+]O, and the second term represents the electrical work required to transport the same number of particles across the membrane against an electrical gradient.
At equilibrium, GC = 0, and solving the equation for Em yields:
At 37° C and with a monovalent ion (e.g., K+), the term RT/zF = 26.67 mV. Converting to the base 10 logarithm and specifying potassium as the cation:
The Nernst equation is valid only when there is no net current flow.
The Goldman-Hodgkin-Katz constant-field equation is a modification of the Nernst equation used to calculate the membrane potential based on the membrane permeability ratio for sodium and potassium (PNa/PK). This equation allows determination of the individual ionic contributions to Em by summing the individual concentrations and permeability effects:
where PNa and PK are the membrane permeabilities for sodium and potassium.
A term r is included in the constant-field equation to take into account the effect of the electrogenic Na+, K+-ATPase pump under steady-state conditions. This term is usually assigned the Na/K transport ratio of the Na+, K+-ATPase (r = 3/2 = 1.5). If the membrane permeability of potassium is assigned a value of 1.0 and the cell membrane is known to be 100 times more permeable to potassium than to sodium,
Any ion that is not actively transported across the membrane cannot contribute to the membrane potential, and the transmembrane distribution of such an ion must follow the resting potential. Chloride is not considered in the Goldman-Hodgkin-Katz equation, because chloride is usually passively distributed across the cell membrane according to the prevailing Em.
1 Abrams J.T. The nutrition of the dog. In: Rechcigl M., editor. CRC handbook series in nutrition and food. Section G: diets, culture media, and food supplements. Boca Raton, FL: CRC Press; 1977:1.
2 Adolph E.F. Measurements of water drinking in dogs. Am J Physiol. 1939;125:75.
3 Anderson R.S. Water balance in the dog and cat. J Small Anim Pract. 1982;23:588.
4 Anderson R.S. Fluid balance and diet. In: Proceedings of the Seventh Kal Kan Symposium. Columbus, OH: Kal Kan Foods; 1983:19.
5 Brody S., Proctor R.C., Ashworth U.S. Growth and development with special reference to domestic animals. XXXIV. Basal metabolism, endogenous nitrogen, creatinine and neutral sulphur excretions as functions of body weights. Columbia, MO: University of Missouri; 1934.
6 Burger I.H., Anderson R.S., Holme D.W. Nutritional factors affecting water balance in the dog and cat. In: Anderson R.S., editor. Nutrition of the dog and cat. Oxford: Pergamon Press; 1980:145.
7 Burkitt J.M., Haskins S.C., Aldrich J., et al. Effects of oral administration of a commercial activated charcoal suspension on serum osmolality and lactate concentration in the dog. J Vet Intern Med. 2005;19:683.
8 Chew D.J., Leonard M., Muir W.W. Effect of sodium bicarbonate infusion on serum osmolality, electrolyte concentrations, and blood gas tensions in cats. Am J Vet Res. 1991;52:12.
9 Chew R.M. Water metabolism of mammals. In: Mayer W.W., Van Gelder R.G., editors. Physiologic mammalogy, vol II: Mammalian reaction to stressful environments. New York: Academic Press; 1965:43.
10 Cizek L.J. Longterm observations on relationship between food and water ingestion in the dog. Am J Physiol. 1959;197:342.
11 Constable P.D., Stämpfli H.R. Experimental determination of net protein charge and Atot and Ka of nonvolatile buffers in canine plasma. J Vet Intern Med. 2005. (in press)
12 Davidson S., Passmore R., Brock J.F., et al. Water and electrolytes. In: Davidson S., editor. Human nutrition and dietetics. Edinburgh: Churchill Livingstone; 1979:81.
13 Edelman I.S., Leibman J. Review: anatomy of body water and electrolytes. Am J Med. 1959;27:256.
14 Edelman I.S., Leibman J., O’Meara M.P., et al. Interrelations between serum sodium concentration, serum osmolarity and total exchangeable sodium, total exchangeable potassium and total body water. J Clin Invest. 1958;37:1236.
15 Grauer G.F., Thrall M.A., Henre B.A., et al. Early clinicopathologic findings in dogs ingesting ethylene glycol. Am J Vet Res. 1984;45:2299-2303.
16 Hamlin R., Tashjian R. Water and electrolyte intake and output and quantity of feces in healthy cats. Vet Med Small Anim Clin. 1964;59:746.
17 Hardy R.M., Osborne C.A. Water deprivation test in the dog: maximal normal values. J Am Vet Med Assoc. 1979;174:479.
18 Harrison J.B., Sussman H.H., Pickering D.E. Fluid and electrolyte therapy in small animals. J Am Vet Med Assoc. 1960;137:637.
19 Haskins S.C. Fluid and electrolyte therapy. Compend Contin Educ Pract Vet. 1984;6:244.
20 Hauptman J.G., Tvedten H. Osmolal and anion gaps in dogs with acute endotoxic shock. Am J Vet Res. 1986;47:1617-1619.
21 Hill R.C., Lewis D.D., Scott K.C., et al. Effect of increased dietary protein and decreased dietary carbohydrate on performance and body composition in racing Greyhounds. Am J Vet Res. 2001;62:440.
22 Holme D.W. Research into the feline urological syndrome. In: Proceedings of the Kal Kan Symposium for Treatment of Dog and Cat Diseases. Columbus, OH: Kal Kan Foods; 1977:40.
23 Jackson O.F., Tovey J.D. Water balance studies in domestic cats. Feline Pract. 1977;7:30.
24 Jain N.C. Schalm’s veterinary hematology. Philadelphia: Lea & Febiger; 1986.
24a Jenkins E.E., Coulter D.B. Effects of diet on water intake, food intake, and feces production in the cat. Georgia vet. 1981;33:8.
25 Kleiber M. The fire of life. Huntington, NY: Robert E. Krieger Publishing; 1975.
26 Kohn K., DiBartola S. Composition and distribution of body fluids in dogs and cats. In: DiBartola S., editor. Fluid therapy in small animal practice. 2nd ed. Philadelphia: WB Saunders; 2000:6.
27 Kronfeld D.S. Protein and energy estimates for hospitalized dogs and cats. In: Proceedings of Purina International Nutrition Symposium. Orlando, FL: Kal Kan Foods; 1991:5.
28 Leaf A. The clinical and physiologic significance of the serum sodium concentration. N Engl J Med. 1962;267:24.
29 Lewis L.D., Morris M.L. Small animal clinical nutrition. Topeka, KS: Mark Morris Associates; 1987.
30 MacIntire D.K. Pediatric fluid therapy. Vet Clin North Am Small Anim Pract. 2008;38:621.
31 Maxwell M.H., Kleeman C.R., Narins R.G. Clinical disorders of fluid and electrolyte metabolism. New York: McGraw-Hill; 1987.
32 McCullough S.M., Constable P.S. Calculation of the total plasma concentration of nonvolatile weak acids and the effective dissociation constant of nonvolatile buffers in plasma for use in the strong ion approach to acid-base balance in cats. Am J Vet Res. 2003;64:1047-1051.
33 Morris M.L., Collins D.R. Anorexia in the dog. Vet Med Small Anim Clin. 1967;62:753.
34 Morris M.L., Collins D.R. A new solution to the problem of anorexia. Vet Med Small Anim Clin. 1967;62:1075.
35 Moulton C.R. Age and chemical development in mammals. J Biol Chem. 1923;57:79.
36 Muir W.W., DiBartola S.P. Fluid therapy. In: Kirk R.W., editor. Current veterinary therapy VIII. Philadelphia: WB Saunders; 1983:28.
37 Nattie E.E., Edwards W.H., Marin-Padilla M. Newborn puppy cerebral acid-base regulation in experimental asphyxia and recovery. J Appl Physiol. 1984;56:1178.
38 National Research Council. Subcommittee on Dog Nutrition, Nutrient requirements of dogs. Washington, DC: National Academy Press; 1985.
39 O’Connor W.J. Drinking by dogs during and after running. J Physiol. 1975;250:247.
40 O’Connor W.J., Potts D.J. The external water exchanges of normal laboratory dogs. Q J Exp Physiol. 1969;54:244.
41 O’Connor W.J., Potts D.J. Kidneys and drinking in dogs. In: Michell A.R., editor. Renal disease in dogs and cats: comparative and clinical aspects. Oxford: Blackwell Scientific; 1988:30.
42 Peters J.P. The role of sodium in the production of edema. N Engl J Med. 1948;239:353.
43 Prentiss P.G., Wolf A.V., Eddy H.A. Hydropenia in cat and dog: Ability of the cat to meet its water requirements solely from a diet of fish or meat. Am J Physiol. 1959;196:625.
44 Rivers J.P.W., Burger L.H. Allometry in dog nutrition. In: Nutrition of the dog and cat, Waltham Symposium No. 7. Cambridge: Cambridge University Press; 1989:67.
45 Robertson G.L. Thirst and vasopressin function in normal and disordered states of water balance. J Lab Clin Med. 1983;101:351.
46 Robertson G.L., Shelton R.L., Athar S. The osmoregulation of vasopressin. Kidney Int. 1976;10:25.
47 Robinson E.A., Adolph E.F. Pattern of normal water drinking in dogs. Am J Physiol. 1943;139:39.
48 Rose B.D. Clinical physiology of acid-base and electrolytes. New York: McGraw-Hill; 1984.
49 Rose B.D. Clinical physiology of acid-base and electrolyte disorders. New York: McGraw-Hill. 1989:5.
50 Ross L.A., Finco D.R. Relationship of selected clinical renal function tests to glomerular filtration rate and renal blood flow in cats. Am J Vet Res. 1981;42:1704.
51 Schrier R.W. Pathogenesis of sodium and water retention in high-output and low-output cardiac failure, nephrotic syndrome, cirrhosis, and pregnancy. N Engl J Med. 1988;319:1065.
52 Seefeldt S.L., Chapman T.E. Body water content and turnover in cats fed dry and canned rations. Am J Vet Res. 1979;40:183.
53 Shull R.M. The value of anion gap and osmolal gap determinations in veterinary medicine. Vet Clin Pathol. 1978;7:12-14.
54 Smith R.C., Haschen T., Hamlin R.L., et al. Water and electrolyte intake and output and quantity of feces in the healthy dog. Vet Med. 1964;59:743.
55 Smithline N., Gardner K.D. Gaps: anionic and osmolal. JAMA. 1976;236:1594.
56 Stanton C.A., Hamar D.W., Johnson D.E., et al. Bioelectrical impedance and zoometry for body composition analysis in domestic cats. Am J Vet Res. 1992;53:251.
57 Thrall B.E., Miller L.G. Water turnover in cats fed dry rations. Feline Pract. 1976;6:10.
58 van Vonderen I.K., Kooistra H.S., Rijnberk A. Intra- and inter-individual variation in urine osmolality and urine specific gravity in healthy pet dogs of various ages. J Vet Intern Med. 1997;11:30.
59 Wamberg S., Sandgaard N.C.F., Bie P. Simultaneous determination of total body water and plasma volume in conscious dogs by the indicator dilution principle. J Nutr. 2002;132:1171S.