Chapter 9 Introduction to Acid-Base Disorders
To Faraday we are indebted for naming the products of dissociation, ions—and thus we came by “hydrogen ions,” a term now synonymous with proton. Tiny though it is, I suppose no constituent of living matter has so much power to influence biological behavior….
Metabolic processes each day yield 50 to 100 mEq of H+ ions (fixed or nonvolatile acid) from the metabolism of proteins and phospholipids and 10,000 to 15,000 mmol of CO2 (volatile acid) from the metabolism of carbohydrate and fat. Carbon dioxide is potentially an acid by virtue of its ability to combine with H2O in the presence of carbonic anhydrase to form carbonic acid (H2CO3). Carbon dioxide is continuously removed by alveolar ventilation so that the partial pressure of CO2 (Pco2) is kept constant at approximately 40 mm Hg.
Concept of acidity
The most commonly used concept of acids and bases is that of Brönsted and Lowry, who stated that an acid is a proton donor and a base a proton acceptor. In the following equation, HA is an acid and A− is a base:

In aqueous solutions, protons or H+ ions are normally bound by electrostatic interaction to H2O, resulting in the formation of hydronium ions, designated H3O+. Conventionally, however, the term hydrogen ion and the symbol H+ are used to refer to protons in aqueous solutions.
The acidity of a solution refers to the chemical activity of its constituent H+ ions. Chemical activity is related to chemical concentration by the activity coefficient, a factor that varies directly with temperature and inversely with the ionic strength of the solution. Physiologic control of body temperature and osmolality, and the dilute nature of body fluids, result in this factor being near unity, and the difference between activity and concentration is negligible in body fluids.
The concentrations of the most important electrolytes in body fluids (e.g., Na+, K+, Cl−, HCO3−) are in the range of milliequivalents per liter, whereas the concentration of H+ is in the range of nanoequivalents per liter. That is, hydrogen ions are present at one-millionth the concentration of other electrolytes. What, then, accounts for the emphasis on hydrogen ions in biology and medicine? The answer lies in the fact that hydrogen ions are highly reactive. The proteins of the body have many dissociable groups. These may gain or lose protons as [H+] changes, resulting in alterations in charge and molecular configuration that may adversely affect protein structure and function. The [H+] of body fluids must be kept constant so that detrimental changes in enzyme function and cellular structure do not occur. The range of [H+] compatible with life is 16 to 160 nEq/L.
Concept of pH
The concept of pH was introduced by Sørensen to allow easier notation for the wide range of [H+] found in chemical systems. The term pH is defined as the negative base 10 logarithm of the hydrogen ion concentration expressed in equivalents per liter or the base 10 logarithm of the reciprocal of the hydrogen ion concentration:
Thus, at the normal extracellular fluid (ECF) [H+] of 40 nEq/L (4 × 10⁻⁸ Eq/L):
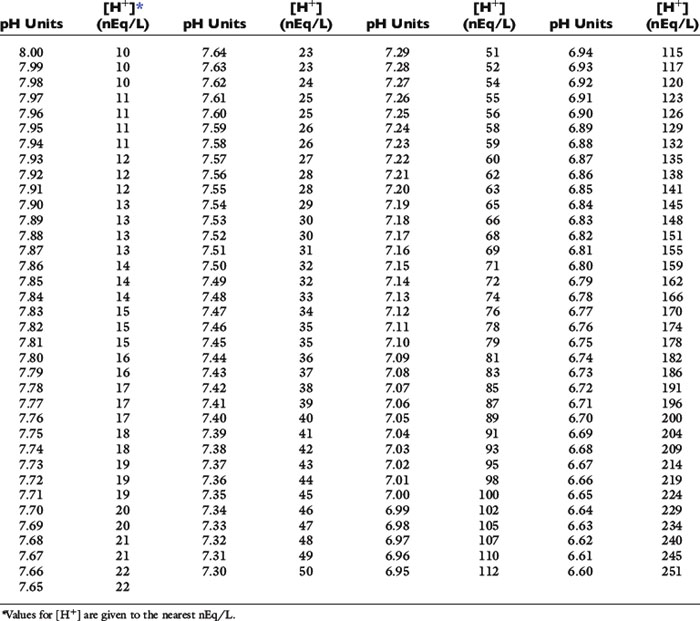
There is an inverse relationship between pH and [H+]: the greater the [H+], the lower the pH. Furthermore, pH and [H+] vary not linearly with one another but exponentially as shown in Figure 9-1. The [H+] for a given pH within the physiologic range is given in Table 9-1.

Law of mass action
The law of mass action states that the velocity of a reaction is proportional to the product of the concentrations of the reactants. For the acid just described, there are two opposing reactions:


The velocity of the first reaction can be written:

and the velocity of the second reaction:

At equilibrium, the rates of the two opposing reactions exactly counterbalance one another and the two velocities are equal:

Rearranging and substituting a new constant, Ka, the ionization, or dissociation, constant for the acid HA:
The ionization, or dissociation, constant for an acid is an indication of the strength of that acid. A large value for Ka means that [H+] and [A−] are much greater than [HA]; that is, the acid is a strong one and is largely dissociated. A small value for Ka means that [H+]and [A−] are much smaller than [HA]; that is, the acid is a weak one and little of it is dissociated. Hydrochloric acid (HCl) and sulfuric acid (H2SO4) are strong acids and dissociate almost completely in aqueous solutions, whereas NH4+ is a weak acid (i.e., it is a strong base) and dissociates to a small extent.
Taking the base 10 logarithm of both sides of the dissociation equilibrium equation yields:


Applying the concept of pH to both the hydrogen ion concentration and dissociation constant, Ka:
This is the commonly used Henderson-Hasselbalch form of the dissociation equilibrium equation. Occasionally, the term salt or base is substituted for A− and the term acid for HA:
Concept of buffering
A buffer is a compound that can accept or donate protons (hydrogen ions) and minimize a change in pH. A buffer solution consists of a weak acid and its conjugate salt. When a strong acid is added to a buffer solution containing a weaker acid and its salt, the dissociated protons from the strong acid are donated to the salt of the weak acid and the change in pH is minimized.
Consider an aqueous solution with equal amounts of Na2HPO4 and NaH2PO4. The pKa for this buffer pair is 6.8:
If the amounts of Na2HPO4 and NaH2PO4 are equal, their ratio is 1.0:
Consider adding 1 mmol of HCl to this solution. The protons from the HCl are donated to the salt of the buffer pair (Na2HPO4), converting it to its conjugate acid (NaH2PO4). If 10 mmol of each phosphate salt was present initially, the new ratio of Na2HPO4/NaH2PO4 would be 9/11 or 0.82 and:
By contrast, an aqueous solution containing 1 mmol/L HCl (10−3Eq/L) would have a pH of 3.0.
By solving the dissociation equilibrium equation for [H+], the same can be shown:
For the previously described solution of sodium phosphate:
The Ka for this reaction is 1.6 × 10⁻⁷ Eq/L, and if there are equal amounts of the two phosphate salts present ([NaH2PO4] = [Na2HPO4]):
After addition of 1 mmol of HCl:
By contrast, an aqueous solution containing 1 mmol/L HCl would have [H+] = 0.001 mol/L or 1 million nmol/L. Thus, 99.98% of the added hydrogen ions have been buffered by the sodium phosphate solution.
If the amount of strong acid (e.g., HCl) or base (e.g., NaOH) added to a solution of a weak acid and its salt (i.e., a buffer solution) is plotted against pH, the resulting relationship is called a titration or buffer curve (Fig. 9-2). The curve is sigmoidal, and its slope is greatest in the midregion, over which the curve is approximately linear. In the pH range associated with the midregion of the curve, the change in pH is smallest for a given amount of added acid or base and buffer capacity is greatest at the midpoint of the curve. At this point, there are equal amounts of the weak acid and its conjugate salt, and as shown by the Henderson-Hasselbalch equation, pH = pKa. The region of best buffer capacity extends approximately 1.0 pH unit on either side of the pKa. Thus, a buffer is most effective within one pH unit of its pKa. The pKa values for some important biologic compounds are listed in Table 9-2.

Figure 9-2 Titration curve for an aqueous solution containing a phosphate buffer.
(From Ruch TC, Patton HE (eds): Physiology and biophysics, 20th edition, Saunders, Philadelphia, 1974.)
Table 9-2 pKa Values of Biologically Important Compounds*
| Compound | pKa |
|---|---|
| Phosphoric acid | 2.0 |
| Citric acid | 2.9 |
| Carbonic acid (pKa) | 3.6 |
| Acetoacetic acid | 3.6 |
| Lactic acid | 3.9 |
| Citrate1− | 4.3 |
| Acetic acid | 4.6 |
| 3-Hydroxybutyric acid | 4.7 |
| Creatinine | 5.0 |
| Citrate2− | 5.6 |
| Uric acid | 5.8 |
| Organic phosphates | 6.0-7.5 |
| Carbonic acid (pK’a) | 6.1 |
| Imidazole group of histidine | 6.4-7.0 |
| Oxygenated hemoglobin | 6.7 |
| Phosphate1− | 6.8 |
| α-Amino (amino-terminal) | 7.4-7.9 |
| Deoxygenated hemoglobin | 7.9 |
| Ammonium | 9.2 |
| Bicarbonate | 9.8 |
| Phosphate2− | 12.4 |
* Compounds with pKa values in the range of 6.4-8.4 are most useful as buffers in biologic systems. The pKa values for the imidazole group of histidine and for α-amino (amino-terminal) amino groups are for those side groups in proteins. The pKa range for organ phosphates refers to such intracellular compounds as adenosine triphosphate, adenosine diphosphate, and 2,3-diphosphoglycerate.
Isohydric principle
Regardless of the number of buffers present, a solution can have only one [H+] and one pH. Using the law of mass action or the Henderson-Hasselbalch equation, the ratio of acid to salt forms of any buffer in the solution can be calculated. This has been called the isohydric principle. The implication of the isohydric principle is that the behavior of any buffer pair in a complex solution can be predicted by knowledge of the dissociation constant and concentrations of any one buffer pair. In clinical practice, the bicarbonate–carbonic acid buffer pair is the one used to monitor acid-base balance in body fluids.
The relative importance of a given buffer in the body is based on its concentration in the relevant body fluid, its pKa, and the prevailing [H+] (40 nmol/L in ECF). The bicarbonate–carbonic acid system is unique among buffers in that carbonic acid is in equilibrium with dissolved CO2, the concentration of which normally is kept constant by alveolar ventilation.
The bicarbonate–carbonic acid system: physical chemistry
Gaseous CO2 produced in the tissues is soluble in water, and the concentration of dissolved CO2 in body fluids is proportional to the partial pressure of CO2 in the gas phase (Pco2):

where α is a factor called the solubility coefficient of CO2. The solubility coefficient of CO2 has a value of 0.0301 mmol/L/mm in arterial plasma at 37˚ C. Thus:

Dissolved CO2 combines with water to form carbonic acid:

The uncatalyzed reaction proceeds slowly, but its rate is dramatically increased by the enzyme carbonic anhydrase, which is present in abundance in the body (e.g., red cells, renal tubular cells). In the body, therefore, the hydration of CO2 to form H2CO3 reaches equilibrium almost instantaneously. Normally, the equilibrium is so far to the left that there are approximately 340 molecules of dissolved CO2 for each molecule of carbonic acid.42
The dissociation of carbonic acid can be expressed using the law of mass action:
Ka for this reaction is 2.72 × 10⁻⁴ mol/L (pKa=3.57). The ratio of bicarbonate to carbonic acid at the normal [H+] of body fluids can be calculated by rearranging this equation:
Thus, at [H+] = 40 nmol/L (pH 7.40), there are 6800 bicarbonate ions and 340 molecules of dissolved CO2 for each molecule of carbonic acid.
The reaction of dissolved CO2 in aqueous body fluids can be summarized as:

However, the number of carbonic acid molecules is negligible compared with the number of dissolved CO2 molecules and HCO3− ions. Therefore, this equation can be simplified as:

The law of mass action for this equilibrium can be expressed as:
The concentration of water in dilute body fluids remains virtually unchanged by this reaction and can be incorporated into Ka to yield another constant, K′a:
In body fluids at 37˚ C, K′a is approximately equal to 8 × 10⁻⁷ mol/L and p K′a equals 6.1. An approximate value of 6.1 for this p K′a is valid at temperatures ranging from 30° to 40° C (86 to 104° F) and pH values ranging from 7.0 to 7.6.37
A formula for [H+] in nanomoles per liter or nanoequivalents per liter is obtained by expressing K′a in nanomoles per liter or nanoequivalents per liter:
Using the solubility coefficient for carbon dioxide yields:
This is the Henderson equation and has been used extensively in the clinical evaluation of acid-base disturbances. It shows clearly that the [H+] (and thus pH) of body fluids is determined by the ratio of Pco2 to HCO3− concentration. The Henderson-Hasselbalch equation is derived by expressing [H+] and K′a in moles per liter or equivalents per liter and converting the equation to logarithmic form:
Substituting 6.1 for the value of pK′a and applying the solubility coefficient for CO2, we obtain:
This is the clinically relevant form of the equation and shows that in body fluids, pH is a function of the ratio between HCO3− concentration and Pco2.
Body buffers
Body buffers can be divided into bicarbonate, which is the primary buffer system of ECF, and nonbicarbonate buffers (e.g., proteins and inorganic and organic phosphates), which constitute the primary intracellular buffer system. Bone is a prominent source of buffer and can contribute calcium carbonate and, to a lesser extent, calcium phosphate during chronic metabolic acidosis. Bone may even account for up to 40% of the buffering of an acute acid load in the dog.9 After administration of NaHCO3, carbonate can be deposited in bone.
Bicarbonate as a buffer in extracellular fluid
If a buffer is most effective within 1 pH unit of its pKa, what accounts for the importance of the bicarbonate system (p K′a 6.1 vs. ECF p. 7.4)? One factor is the high concentration of HCO3− (approximately 24 mEq/L vs. 2 mEq/L for phosphate). However, the most important factor is that the bicarbonate–carbonic acid buffer pair functions as an open system. In a closed system, the bicarbonate and carbonic acid or dissolved CO2 concentrations must change in a reciprocal manner as the following reaction is driven to the left or right:

In the body, the system is open, and carbonic acid, in the presence of carbonic anhydrase, forms CO2, which is eliminated entirely from the system by alveolar ventilation. Thus, the “acid” member of the buffer pair is free to change directly with the “salt” member as compensation for metabolic acidosis occurs. If Pco2 is kept constant at 40 mm Hg, the effectiveness of the bicarbonate–carbonic acid system is increased dramatically. In response to metabolic acidosis, however, the body goes even further, and Pco2 is decreased below the normal value of 40 mm Hg, thus increasing the effectiveness of this buffer pair even more.
Consider a closed system in which the bicarbonate–carbonic acid system is the only buffer pair. We will assume the following conditions at the start: [H+] = 40 nmol/L, [HCO3−] = 24 mmol/L, Pco2 = 40 mm Hg (dissolved CO2 = 1.2 mmol/L), and pH = 7.40. If 5 mmol of HCl is added to this closed system, [HCO3−] is titrated and decreases to 19 mmol/L, Pco2 increases to 206 mm Hg (dissolved CO2 = 1.2 + 5 = 6.2 mmol/L), [H+] increases to 260 nmol/L, and pH decreases to 6.58, a value incompatible with life.
Consider now what would happen if the system were open and the Pco2 kept constant at 40 mm Hg by a factor external to the system (i.e., alveolar ventilation). What would happen now if 5 mmol of HCl were added, assuming the same starting conditions? The [HCO3−] again decreases to 19 mmol/L, but Pco2 is fixed at 40 mm Hg (dissolved CO2 = 1.2 mmol/L). The [H+] can be calculated from the Henderson equation: [H+] = 24(40)/19 = 50 nmol/L. The pH is 7.30.
Consider now what would happen if, rather than being kept constant, the Pco2 actually decreased to 36.5 mm Hg. This is what would be expected in a patient with metabolic acidosis if we use the rule of thumb that Pco2 decreases by 0.7 mm Hg per 1.0 mEq/L decrement in plasma HCO3− concentration. In this setting, [HCO3−] still decreases to 19 mmol/L, but Pco2 is 36.5 mm Hg, and dissolved CO2 = 0.0301(36.5) = 1.1 mmol/L. Again, the [H+] can be calculated from the Henderson relationship: [H+] = 24(36.5)/19 = 46 nmol/L. The pH in this setting is 7.34, just slightly below the starting pH of 7.40. This, in essence, is what happens in the body in response to metabolic acidosis and illustrates the dramatic effect achieved because the bicarbonate–carbonic acid system is an open system with Pco2 closely regulated by alveolar ventilation.
Proteins as buffers
Plasma proteins play a limited role in extracellular buffering, whereas intracellular proteins play an important role in the total buffer response of the body. The buffer effect of proteins is the result of their dissociable side groups. For most proteins, including hemoglobin, the most important of these dissociable groups is the imidazole ring of histidine residues (pKa, 6.4 to 7.0). Amino-terminal amino groups (pKa, 7.4 to 7.9) also contribute somewhat to the buffer effect of proteins. Other side groups are relatively unimportant because their pKa values are either too high or too low to be useful in the normal physiologic range of pH. The pKa values for the dissociable groups of proteins are listed in Table 9-3.
Table 9-3 pK′a Values for Dissociable Groups Found in Proteins
| Dissociable Group (Amino Acid) | pK′a |
|---|---|
| α-Carboxyl | 3.6-3.8 |
| β-Carboxyl (aspartic acid) | ≈4.0 |
| γ-Carboxyl (glutamic acid) | ≈4.0 |
| Imidazole (histidine) | 6.4-7.0 |
| α-Amino | 7.4-7.9 |
| Sulfhydryl (cysteine) | ≈9.0 |
| ε-Amino (lysine) | 9.8-10.6 |
| Phenolic (tyrosine) | 8.5-10.9 |
| Guanidino (arginine) | 11.9-13.3 |
From Madias NE, Cohen JJ: Acid-base chemistry and buffering. In Cohen JJ, Kassirer JF, editors: Acid-base, Boston, 1982, Little, Brown & Co., p. 16.
Hemoglobin is responsible for more than 80% of the nonbicarbonate buffering capacity of whole blood, whereas plasma proteins contribute 20%. Of the plasma proteins, albumin is much more important than are the globulins. The buffer value of albumin is 0.12 to 0.14 mmol/g/pH unit, whereas that of globulins is 0 to 0.08 mmol/g/pH unit.38,69,71 The difference results from a larger number of histidine (Fig. 9-3) residues in albumin.

Figure 9-3 The imidazole group of histidine.
(From Madias NE, Cohen JJ. Acid-base chemistry and buffering. In: Cohen JJ, Kassirer JP, editors. Acid-base. Boston: Little, Brown, 1982: 16.)
The isoelectric point (pI) is the pH at which a substance has no tendency to move in an electric field and thus has no net charge. For proteins, this means that the sum of the charges on the negative side groups (e.g., R–COO−) equals the sum of the charges on the positive side groups (e.g., R–NH3+). At physiologic pH (7.4), plasma proteins are polyanions because their pIs range from 5.1 to 5.7. The net negative charge on plasma proteins in mEq/L can be calculated as:38

where [Pr] is the concentration of plasma proteins in grams per liter, β is the buffer value of plasma proteins in millimoles per gram per pH unit, pH is the ECF pH, and pI is the isoelectric point of plasma proteins. Using this formula, it can be calculated that, at a normal plasma protein concentration of 7 g/dL, average buffer value of 0.1 mmol/g/pH unit, and pI range of 5.1 to 5.7, plasma proteins contribute 12 to 16 mEq/L of negative charge. In dogs, the mean contribution of charge by plasma proteins is approximately 16 mEq/L.16,76
Phosphates as buffers
The most important intracellular buffers are proteins and inorganic and organic (e.g., adenosine triphosphate [ATP], adenosine diphosphate [ADP], 2,3-diphosphoglycerate) phosphates. The pKa value for H2PO4− is 6.8, and pKa values for organic phosphates range from 6.0 to 7.5. Inorganic phosphate is a more important buffer intracellularly, where its concentration is high (approximately 40 mEq/L in skeletal muscle cells), and less important in ECF, where its concentration is much lower (approximately 2 mEq/L). Inorganic phosphate is an important buffer in urine because the range of pH in tubular fluid (6.0 to 7.0) includes the pKa of the Na2HPO4/NaH2PO4 system (6.8). This buffer pair functions in the excretion of titratable acidity in urine (see the Titratable Acidity section later).
Physiologic lines of defense in acid-base disturbances
An overview of the body buffer response is provided by contrasting the body’s response to a nonvolatile, or fixed, acid (e.g., HCl) and its response to the volatile acid CO2. The hydrogen ions from a fixed acid load immediately titrate bicarbonate ions in ECF and then titrate intracellular buffers (e.g., proteins, phosphates). This physicochemical response occurs within minutes and protects ECF pH. Alveolar ventilation is stimulated, and Pco2 is decreased to below normal. This response, which begins immediately and is complete within hours, minimizes the change in pH because the ratio of HCO3− to Pco2 is normalized. Finally, the kidneys regenerate titrated HCO3−, pH increases, alveolar ventilation decreases, and Pco2 returns to normal. The renal response begins within hours but requires 2 to 5 days to reach maximal effectiveness.
The volatile acid CO2 cannot be buffered by HCO3−, and the hydrogen ions resulting from the dissociation of carbonic acid must titrate intracellular buffers, such as proteins (especially hemoglobin in red cells) and phosphates. Renal adaptation is characterized by increased HCO3− reabsorption and net acid excretion, mechanisms that require 2 to 5 days to achieve maximal effectiveness. The buffer response of the body to the primary acid-base disorders is considered in more depth in the chapters on those disorders (see Chapters 10 and 11).
Terminology
The terms acidosis and alkalosis refer to the pathophysiologic processes that cause net accumulation of acid or alkali in the body. The terms acidemia and alkalemia refer specifically to the pH of ECF. In acidemia the ECF pH is lower than normal, and the [H+] is higher than normal. In alkalemia the ECF pH is higher than normal, and the [H+] is lower than normal. The distinction between these terms is important. For example, a patient with chronic respiratory alkalosis may have a blood pH within the normal range because of effective renal compensation in this setting. Such a patient has alkalosis but does not have alkalemia. Patients with mixed acid-base disturbances can have blood pH values within the normal ranges as a result of the presence of two counterbalancing acid-base disturbances (see the following section on Simple and Mixed Acid-Base Disorders).
Primary acid-base disturbances
Acidosis and alkalosis can each be of metabolic or respiratory origin, and as a result, there are four primary acid-base disturbances: metabolic acidosis, respiratory acidosis, metabolic alkalosis, and respiratory alkalosis. The metabolic disturbances refer to a net excess or deficit of nonvolatile, or fixed, acid, whereas the respiratory disturbances refer to the net excess or deficit of volatile acid (dissolved CO2).
Metabolic acidosis is characterized by a decreased plasma HCO3− concentration and decreased pH (increased [H+]) caused by either HCO3− loss or buffering of a noncarbonic (nonvolatile or fixed) acid. Metabolic alkalosis is characterized by an increased plasma HCO3− concentration and increased pH (decreased [H+]), usually caused by a disproportionate loss of chloride ions from the body (i.e., loss of fluid with a chloride concentration greater than that of ECF) or hypoalbuminemia (because albumin is a weak acid). In the absence of volume depletion or renal dysfunction, it is extremely difficult to produce metabolic alkalosis by administration of alkali. Respiratory acidosis is characterized by increased Pco2 (hypercapnia) caused by alveolar hypoventilation. Respiratory alkalosis is characterized by decreased Pco2 caused by alveolar hyperventilation (hypocapnia). In one study, metabolic acidosis was the most common acid-base disturbance encountered in dogs.17
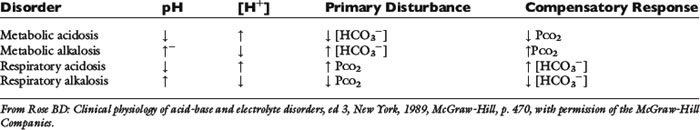
Each primary metabolic or respiratory acid-base disturbance is accompanied by a secondary, or adaptive, change in the opposing component of the system (Table 9-4). The adaptive response involves the component opposite the one disturbed and returns the pH of the system toward but not completely to normal. Overcompensation does not occur. For example, metabolic acidosis is accompanied by a secondary or adaptive respiratory alkalosis. Respiratory acidosis is accompanied by a secondary or adaptive metabolic alkalosis.
Simple and mixed acid-base disorders
An acid-base disorder is said to be simple if it is limited to the primary disorder and the expected secondary, or adaptive, response. The magnitude of the expected responses is considered in detail in the chapters devoted to the primary acid-base disorders (see Chapters 10 and 11). A mixed acid-base disorder is one that is characterized by the presence of at least two separate primary acid-base abnormalities occurring in the same patient. A mixed acid-base disorder should be suspected whenever the secondary, or adaptive, response exceeds or falls short of that expected. In dogs, for example, the expected response to metabolic acidosis is a 0.7-mm Hg decrease in Pco2 for each 1.0-mEq/L decrement in plasma HCO3− concentration caused by metabolic acidosis (see Chapter 10 for more details).
Consider a dog with these normal blood gas values: p. 7.39, [H+] = 41 nEq/L, [HCO3−] = 21 mEq/L, and Pco2 = 36 mm Hg. This dog becomes ill and is observed to have the following blood gas values: p. 7.22, [H+] = 60 nEq/L, [HCO3−] = 14 mEq/L, and Pco2 = 35 mm Hg. If the dog had a simple metabolic acidosis, using the rule of thumb described before, we would have expected the following results: p. 7.27, [H+] = 53 nEq/L, [HCO3−] = 14 mEq/L, and Pco2 = 31 mm Hg. Thus, the dog has a mixed acid-base disorder characterized by both metabolic and respiratory acidoses.
Consider a patient with the following blood gas values: p. 7.40, [H+] = 40 nEq/L, [HCO3−] = 31 mEq/L, and Pco2 = 51 mm Hg. This patient is neither alkalemicnoracidemic because blood pH is 7.40; however, based on the Pco2 and [HCO3−], the patient is not normal. This patient has a mixed disorder characterized by metabolic alkalosis and respiratory acidosis. The two disorders have counterbalancing effects, resulting in a normal pH. Mixed acid-base disorders are considered in detail in Chapter 12.
Compensatory responses for primary acid-base disturbances
The guidelines for secondary or adaptive responses are listed in Table 9-5 for reference. Note that there are single rules of thumb for each of the metabolic acid-base disorders but two rules of thumb (one each for acute and chronic disorders) for the respiratory acid-base disorders. This is a consequence of the fact that the adaptive respiratory response to metabolic disorders begins immediately and is complete within hours. Conversely, the response to respiratory disorders occurs in two phases. In the first phase, there is immediate titration of predominantly intracellular nonbicarbonate buffers, resulting in an initial change in plasma HCO3− concentration. The second phase is carried out by the kidneys and is characterized by alterations in net acid excretion and bicarbonate reabsorption. This response begins within hours but takes 2 to 5 days to achieve maximal effectiveness. Thus, there are two expected compensatory responses: acute (<24 hours) and chronic (>48 hours). One caution about rules of thumb is that they define the average response and not 95% confidence intervals. Acid-base maps depict 95% confidence intervals and, although more awkward to use, allow the clinician to consider normal variation in response (Fig. 9-4). Thus, a patient should be considered to have a mixed disorder only when the blood gas value in question deviates considerably from the calculated expected value. Guidelines for establishing a diagnosis of mixed acid-base disorder are discussed in Chapter 12.
Table 9-5 Expected Renal and Respiratory Compensations to Primary Acid-Base Disorders in Dogs
| Disorder | Primary Change | Compensatory Response |
|---|---|---|
| Metabolic acidosis | ↓ [HCO3−] | 1.0-mm Hg decrement in Pco2 for each 1-mEq/L decrement in [HCO3−] |
| Metabolic alkalosis | ↑ [HCO3−] | 0.7-mm Hg increment in Pco2 for each 1-mEq/L increment in [HCO3−] |
| Acute respiratory acidosis | ↑ Pco2 | 1.5-mEq/L increment in [HCO3−] for each 10-mm Hg increment in Pco2 |
| Chronic respiratory acidosis | ↑ Pco2 | 3.5-mEq/L increment in [HCO3−] for each 10-mm Hg increment in Pco2 |
| Acute respiratory alkalosis | ↓ Pco2 | 2.5-mEq/L decrement in [HCO3−] for each 10-mm Hg decrement in Pco2 |
| Chronic respiratory alkalosis | ↓ Pco2 | 5.5-mEq/L decrement in [HCO3−] for each 10-mm Hg decrement in Pco2 |

Figure 9-4 Acid-base map or template. The shaded areas exemplify the ranges of Paco2-bicarbonate relationships characteristic of graded degrees of simple acid-base disorders.
(From Harrington JT, Cohen JJ, Kassirer JP. Introduction to the clinical acid-base disturbances. In: Cohen JJ, Kassirer JP, editors. Acid-base. Boston: Little, Brown, 1982: 379.)
Measurement of blood gases
Most blood gas analyzers measure pH and Pco2. The HCO3− concentration is calculated. Total CO2 content is determined by adding a strong acid to plasma or serum and measuring the amount of CO2 produced according to the following reaction:

The term total CO2content refers to the fact that this method includes both dissolved CO2 and HCO3− present in the sample. As a result, total CO2 content is greater than HCO3− concentration in normal individuals by approximately 1 to 2 mEq/L:
If a sample to be analyzed for total CO2 content is handled aerobically, the dissolved CO2 is released to the atmosphere, and the value obtained is approximately equal to the HCO3− concentration.
Total CO2 concentrations determined by automated chemistry analysis may differ substantially from those obtained by standard blood gas analysis. In one study of normal dogs and cats, factors implicated in this discrepancy included underfilling of blood collection tubes, delays between sampling and analysis, and freshness of laboratory reagents.30 According to the results of this study, values for total CO2 obtained by routine blood gas analysis may be up to 5 mmol/L higher than those obtained by automated analysis. Another study comparing total CO2 measurement by three different methods (radiometer blood gas analyzer, Coulter DACOS analyzer [Beckman Coulter, Fullerton, Calif.], and Kodak Ektachem DTE analyzer [Eastman Kodak, Rochester, N.Y.]) found lower than expected agreement among the different methods of analysis.31 In this study, sample storage for 7 hours resulted in a decrease of approximately 2 mmol/L in total CO2 concentration.
CO2combining power is the total CO2 content of a plasma sample that has been equilibrated in vitro at 37° C with CO2 at a partial pressure of 40 mm Hg. This method overestimates total CO2 content when the patient’s Pco2 is less than 40 mm Hg and underestimates total CO2 content when the patient’s Pco2 is more than 40 mm Hg. It is no longer commonly used in clinical medicine.
Standard bicarbonate is the concentration of bicarbonate in the plasma of fully oxygenated whole blood after equilibration with CO2 at a partial pressure of 40 mm Hg at 37° C. The base excess (BE) is the amount of strong acid or base required to titrate 1 L of blood to p. 7.40 at 37° C, while Pco2 is held constant at 40 mm Hg.5,6,59 It usually is derived from the Siggaard-Andersen alignment nomogram using measurements of pH, Pco2, and hematocrit. BE is changed only by nonvolatile, or fixed, acids and thus is considered to reflect metabolic acid-base disturbances. In general, a negative value for BE (i.e., a base deficit) indicates metabolic acidosis, whereas a positive value indicates metabolic alkalosis.
One problem with the concept of standard bicarbonate is the assumption that the CO2 titration curve of a whole blood sample is similar to that of the intact organism. This is not true because in the isolated blood sample, all of the buffering of the CO2 equilibrated with the sample is done by the hemoglobin and other nonbicarbonate buffers in the sample, and the HCO3− generated can be distributed only within that sample. In vivo, however, other intracellular buffers are involved, the HCO3− produced has a larger volume of distribution, and the observed increase in HCO3− concentration would be less (Fig. 9-5).14 Another problem with standard bicarbonate and BE determinations is that abnormalities of these values do not necessarily imply the presence of a primary metabolic acid-base disturbance. Rather, the change in HCO3− concentration may represent the normal adaptive change resulting from renal compensation for a respiratory acid-base disturbance. Debate continues about whether standard bicarbonate and BE are any more useful than bicarbonate in the evaluation of acid-base disturbances.56,57 Regardless of the approach used, all of the aids devised to facilitate interpretation of blood gas data are merely graphic representations of the classic Henderson-Hasselbalch equation, and there is no substitute for a thorough understanding of the underlying principles of acid-base physiology.67
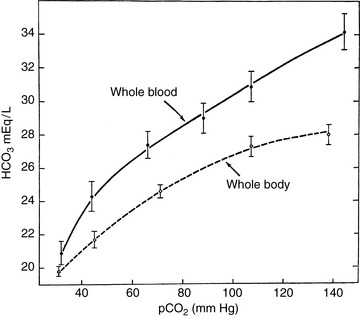
Figure 9-5 Comparison of the CO2 titration curves for whole blood and whole body using data derived from the dog.
(Reproduced from Cohen JJ, Brackett NC, Schwartz WB.The nature of the carbon dioxide titration curve in the normal dog. J Clin Invest 1964;43:777, with permission of the American Society for Clinical Investigation.)
Whole-blood buffer base is the sum of the concentrations of all buffer anions contained in whole blood and includes HCO3−, hemoglobin, plasma proteins, phosphates, and any other potential buffer anions.60 Its normal value is 40 to 50 mEq/L and is similar to Stewart’s strong ion difference (see Chapter 13).63,75 Changes in the Pco2 of the whole blood sample do not change the value of the whole blood buffer base because a change in the nonbicarbonate buffers results in a reciprocal change in HCO3− concentration. The whole body buffer base decreases with metabolic acidosis and increases with metabolic alkalosis, regardless of changes in Pco2 in the sample.
The calculations of standard bicarbonate and whole blood buffer base were introduced before the concept of whole body titration was developed22 and represented an attempt to use in vitro titration of whole blood samples to separate the respiratory and metabolic components of acid-base disturbances. These methods do not account for other buffering effects in the body (e.g., intracellular proteins other than hemoglobin, intracellular organic phosphates, bone carbonate).
Sample collection and handling
Proper collection and handling of samples for blood gas analysis are as important as accurate measurement of pH and Pco2 by the blood gas analyzer.23 In small animals, arterial samples usually are taken from the femoral artery. This procedure can be performed in unanesthetized dogs with minimal discomfort and restraint but is difficult in unanesthetized cats. Samples for venous blood gas analysis usually are taken from the jugular vein. However, venous stasis and muscular activity can result in accumulation of acid metabolites. Thus, an attempt should be made to obtain a free-flowing venous sample by releasing digital pressure on the vein after venipuncture has been achieved.
For femoral artery samples, the hair over the medial thigh is clipped, and the puncture site is disinfected. A 3-mL syringe with a 25-gauge needle is coated with a small amount of heparin (1000 U/mL). Enough heparin is drawn into the syringe to coat the interior of the entire barrel, and air is expelled, leaving the dead space of the syringe filled with heparin. The dead space of 1- to 5-mL syringes is 0.1 to 0.2 mL, and this volume provides more than enough heparin for anticoagulation.51 Dilution of the sample with heparin should be avoided because it can cause erroneously low values for pH, Pco2, and HCO3−.24,27,51
An assistant restrains the dog in lateral recumbency, and the rear limb closest to the table is extended. The artery is located by palpating the femoral pulse and is immobilized beneath the first and second fingers of the operator’s free hand. The artery is punctured with the needle directed at an angle approximately perpendicular to the course of the vessel. At least 1.5 mL of blood is withdrawn, and the site of puncture is manually compressed for 3 to 5 minutes after needle withdrawal to prevent hematoma formation. If necessary, air bubbles are dislodged by flicking the barrel of the syringe with the index finger and expelling any air from the hub of the syringe. Usually, the needle is inserted into a rubber stopper to prevent exposure of the sample to room air. A tightly fitting cap placed over the hub of the syringe may be superior.51 The syringe is rolled between the palms of the hands to mix the sample.
The Pco2 of dry room air is extremely low, and the Pco2 of the blood sample decreases, and its pH increases if it is exposed to air.51 The Po2 of room air is higher than that of arterial or venous blood, and the Po2 of the sample increases if it is exposed to air. The increase is much greater for venous than arterial blood samples. Air bubbles may also cause an increase in Po2 and a decrease in Pco2 if they occup. 10% or more of the sample volume.
Analysis of the sample within 15 to 30 minutes of collection is desirable. The Pco2 of a blood sample increases and the pH decreases as the sample is allowed to stand before analysis. The rate of change is much greater at 25° C than at 4° C. These changes in Pco2 and pH are accompanied by decreased glucose and increased lactate concentrations and are attributed to glycolysis by white cells, red cells, and platelets. Aerobic metabolism by white cells also decreases Po2. By cooling the blood sample, these changes are minimized. Therefore, if the sample cannot be analyzed soon after collection, the syringe should be immersed in a mixture of ice and water. Samples are stable for up to 2 hours at 4° C, but Pco2 begins to increase and pH to decrease after 20 to 30 minutes at 25° C.40
Arterial samples are preferred to venous ones because oxygenation of blood can be evaluated, and the sample is not affected by stasis of blood flow and local tissue metabolism. The most conspicuous difference between arterial and venous samples is the difference in Po2, which reflects oxygenation of blood in the lungs and use in the tissues. Conversely, arterial samples may not reflect the acid-base status in peripheral tissues. This may present a problem during cardiopulmonary resuscitation (see Chapter 10). The Pco2 is slightly higher and the pH is slightly lower in venous samples because of local tissue metabolism. Free-flowing capillary blood that has been “arterialized” by warming the skin puncture site is used as an alternative to arterial samples in human medicine.
Capillary blood obtained from the caudal medial ear margin of unanesthetized dogs had blood gas values similar to those of arterial samples and did not require induction of arteriolar vasodilatation by warming (“arterialization”).52 In a study of cats, arterialized capillary blood was obtained from the cut claw after previously warming the paw.62 In this study, mean Po2 and Pco2 did not differ from those of arterial blood, but mean pH was significantly higher (7.432 versus 7.419). Capillary blood is collected directly into a heparinized capillary tube; a small metal “flea” is added for mixing; and the ends of the tube are sealed with clay. During states of peripheral vascular collapse (e.g., hypovolemic shock), capillary blood does not provide meaningful blood gas values for comparison with those of arterial samples.52,70
Normal values
Normal blood gas values for dogs and cats should be established by the laboratory performing the analysis. Extreme care must be taken in obtaining blood samples to establish a normal range because hyperventilation related to fear or pain, increased muscular activity related to struggling, and delays during sample transport and analysis may have effects on the resulting normal range. A review of previously published data provided the following guidelines for normal arterial blood gas values in dogs and cats:25
| Dog | Cat | |
|---|---|---|
| pH | 7.407 (7.351-7.463) | 7.386 (7.310-7.462) |
| Pco2 (mm Hg) | 36.8 (30.8-42.8) | 31.0 (25.2-36.8) |
| HCO3− (mEq/L) | 22.2 (18.8-25.6) | 18.0 (14.4-21.6) |
| Po2 (mm Hg) | 92.1 (80.9-103.3) | 106.8 (95.4-118.2) |
Studies of normal unanesthetized dogs yielded venous blood gas results as follows: pH 7.397 (7.351 to 7.443), Pco2 37.4 (33.6 to 41.2) mm Hg, and HCO3− 22.5 (20.8 to 24.2) mEq/L.52,76 In one of these studies, venous Po2 values were reported to be 52.1 (47.9 to 56.3) mm Hg.52 Studies of normal unanesthetized cats indicated venous blood gas values as follows: pH 7.343 (7.277 to 7.409), Pco2 38.7 (32.7 to 44.7) mm Hg, and HCO3− 20.6 (18.0 to 23.2) mEq/L.11,26,46
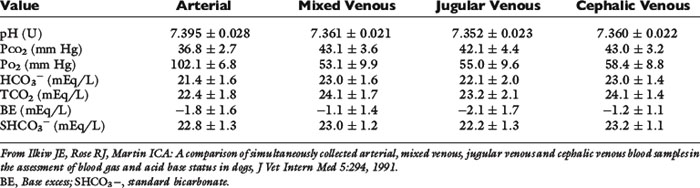
When sampling sites were compared using unanesthetized normal dogs, blood gas data from three different venous sites (jugular vein, pulmonary artery, and cephalic vein) were similar, but Pco2 was higher and pH was lower when venous data were compared with results obtained for the carotid artery.29 The respiratory compensation for metabolic acidosis in these dogs ranged from a 1.1- to 1.3-mm Hg decrement in Pco2 for each 1-mEq/L decrement in HCO3−, whereas the respiratory compensation for metabolic alkalosis ranged from a 0.4- to 0.6-mm Hg increment in Pco2 for each 1-mEq/L increment in HCO3− for arterial, mixed venous, and jugular venous samples. The increment was 1.3 mm Hg per 1-mEq/L increment in HCO3− for the cephalic samples, which had the highest Pco2 values, presumably because they were the only samples not collected under free-flowing conditions. Data for the normal dogs in this study are shown in Table 9-6.
Table 9-6 Blood Gas and Acid-Base Measurements (Mean ± Standard Deviation) in Five Normal Unanesthetized Dogs
Aging in humans has been associated with a decrease in Pao2 and an increase in the alveolar-to-arterial Po2 gradient, P(A − a)O2. Mild or no changes in these values were observed in geriatric dogs, and no significant changes in acid-base balance were found in geriatric dogs.4,32
Interpretation of blood gas data
Correct identification of acid-base disturbances may provide a clue to an underlying primary disease process and aids in determining appropriate therapy for the patient. A routine methodical approach to interpretation of blood gas data facilitates the clinician’s approach to the patient. The clinician should try to answer the following four questions:
1. Is an acid-base disturbance present?
2. What is the primary disturbance?
3. Is the secondary, or adaptive, response as expected (i.e., is the disturbance simple or mixed)?
4. What underlying disease process(es) is (are) responsible for the acid-base disturbance(s)?
The possibility of an acid-base disturbance should be considered when the history (e.g., vomiting, diarrhea) or the pathophysiology of the patient’s disease (e.g., renal failure, diabetes mellitus) is suggestive or when abnormalities in total CO2 or electrolytes (Na+, K+, and Cl−) are observed in the biochemical profile. Total CO2 may be increased as a result of metabolic alkalosis or renal adaptation to respiratory acidosis. Total CO2 may be decreased as a result of metabolic acidosis or renal adaptation to respiratory alkalosis. Thus, the acid-base disturbance cannot be classified based on the total CO2 concentration alone. Objective physical findings suggestive of an acid-base disturbance (e.g., hyperventilation) are unreliable as indicators of acid-base disturbances and are often not present. Blood gas analysis is required to identify and classify acid-base disorders conclusively.
The clinician should first consider the patient’s blood pH. Evaluation of pH often provides the answer to the question of whether an acid-base disturbance is present. If the pH is outside of the normal range, an acid-base disturbance is present. If the pH is within the normal range, an acid-base disturbance may or may not be present. If the patient is acidemic and plasma HCO3− concentration is decreased, metabolic acidosis is present. If the patient is acidemic and Pco2 is increased, respiratory acidosis is present. If the patient is alkalemic and plasma HCO3− concentration is increased, metabolic alkalosis is present. If the patient is alkalemic and Pco2 is decreased, respiratory alkalosis is present. These relationships are summarized in Table 9-4. However, complicating acid-base disturbances that would alter pH in the same direction as the primary disturbance cannot be ruled out at this point in the evaluation.
The next step is to calculate the expected compensatory response in the opposing component of the system (e.g., respiratory alkalosis as compensation for metabolic acidosis, metabolic alkalosis as compensation for respiratory acidosis) using the rules of thumb listed in Table 9-5. If the patient’s secondary or adaptive response in the compensating component of the system falls within the expected range, a simple acid-base disturbance is probably present. If the adaptive response falls outside the expected range, a mixed disorder may be present (see Chapter 12).
Considering the magnitude of change in pH can help in assessment of mixed disorders. This can be seen by consideration of the Henderson equation:
The effect on extracellular pH of a mixed disorder is minimized if the disorders change Pco2 and HCO3− in the same direction (e.g., respiratory acidosis and metabolic alkalosis) and is maximized if the disorders change Pco2 and HCO3− in opposite directions (e.g., respiratory acidosis and metabolic acidosis). In the former instance, blood pH may remain within the normal range, whereas in the latter instance, blood pH is markedly abnormal. Mixed acid-base disorders are discussed in detail in Chapter 12.
Once the clinician has classified the disturbance as simple or mixed and has defined the type of disturbance(s) present, an attempt should be made to determine whether the acid-base disturbance(s) is (are) compatible with the patient’s history and clinical findings. Examples include metabolic acidosis in renal failure, acute diarrhea, ethylene glycol ingestion, or diabetic ketoacidosis; respiratory acidosis in advanced pulmonary disease; metabolic alkalosis in vomiting of stomach contents or loop diuretic administration; and respiratory alkalosis in pulmonary disease or sepsis. The original interpretation of the blood gas data must be questioned if the acid-base disturbance does not fit the patient’s history, clinical findings, and other laboratory data. Diagnostic difficulties are most likely in mild acid-base disturbances with blood gas results still within the normal range, in mixed disturbances with counterbalancing components that result in a pH within the normal range, and in acute, rapidly changing disorders without adequate time for achievement of a compensated steady state.
Anion gap
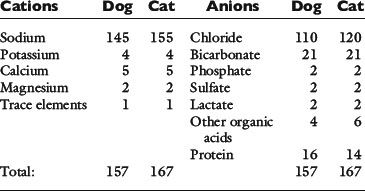
The major cations of ECF are sodium, potassium, calcium, and magnesium; the major anions are chloride, bicarbonate, plasma proteins, organic acid anions (including lactate), phosphate, and sulfate. The approximate charge contributions of these ions in dogs and cats are listed in Table 9-7. Automated clinical chemistry analyzers provide values for serum sodium, potassium, chloride, and total CO2 concentrations. Thus, the sum of the concentrations of commonly measured cations exceeds the sum of the concentrations of commonly measured anions, and the difference has been called the anion gap:18,47
Table 9-7 Approximate Concentrations of Cations and Anions in Plasma in Normal Dogs and Cats (mEq/L)

The serum concentration of potassium varies little, and its charge contribution is small compared with that of sodium. Therefore, the anion gap often is defined as:

From several reported studies, the normal anion gap calculated as (Na+ + K+) − (Cl−+ HCO3−) is approximately 12 to 24 mEq/L in dogs* and 13 to 27 mEq/L in cats.7,11-13 In one study, the anion gap was significantly increased in aged dogs compared with young dogs (16.7 ± 0.7 vs. 14.3 ± 0.8 mEq/L). The increase in anion gap was attributed to a slight decrease in serum chloride concentration that was balanced by an increase in the net negative charge associated with plasma proteins and phosphate.4 In recent studies, the anion gap was calculated to be 18.8 ± 2.9 mEq/L (range, approximately 13 to 25 mEq/L)16 for dogs and 24.1 ± 3.5 mEq/L (range, approximately 17 to 31 mEq/L) for cats.45
In reality, there is no anion gap because the law of electroneutrality must always be satisfied. This can be indicated by including terms for unmeasured cations (UCs) and unmeasured anions (UAs) as follows:


Thus, the anion gap is the difference between UAs and UCs and may be affected by changes in the concentration of either component. However, the magnitude of change in the concentration of any of the UCs (e.g., calcium, magnesium) necessary to cause an appreciable change in the anion gap would probably be incompatible with life.19 As a result, most discussions of the anion gap focus on changes in UAs.
Normally, plasma proteins contribute the majority of UA charge in mEq/L.35 In humans, albumin contributes 2.0 to 2.8 mEq/L for each gram per deciliter, and globulins contribute 1.3 to 1.9 mEq/L for each gram per deciliter.19 For each 0.1-U increment in pH, there is an approximate 0.1-mEq/L increase in negative charge on plasma proteins.19,35,69,71 In dogs, net plasma protein charge at a pH of 7.40 is 16 mEq/L and anion gap is approximately 19 mEq/L, and at a pH of 7.40, the anion gap changes 0.42 mEq/L for every 1 g/L change in albumin and 0.25 mEq/L for every 1 g/L change in total plasma proteins.16
Increases in anion gap are much more common than decreases, and the concept of anion gap is usually used as an aid in differentiating the causes of metabolic acidosis (see Chapter 10). In organic acidoses (e.g., diabetic ketoacidosis, lactic acidosis), HCO3− is titrated by H+ ions from organic acids. Theoretically, the ECF HCO3− concentration should decrease in reciprocal fashion with the increase in concentration of organic acid anions, and the serum chloride concentration should not change (so-called normochloremic metabolic acidosis). The anion gap in this setting should increase proportionately. In practice, however, the decrement in HCO3− concentration rarely equals the increment in anion gap for several reasons. For example, buffers other than HCO3− are titrated by hydrogen ions from the organic acid; the volume of distribution of the organic anion may differ from that of HCO3−; and the prevailing concentration of the organic anion in ECF is affected by its urinary excretion. Furthermore, the patient’s HCO3− concentration and anion gap before illness are usually not known, and the changes in HCO3− concentration and anion gap must by necessity be calculated from available normal values.
The anion gap may be useful in identifying mixed acid-base disturbances. For example, consider a mixed disturbance characterized by metabolic alkalosis and lactic acidosis (e.g., chronic vomiting severe enough to have caused hypotension and impaired tissue perfusion). The pH in such a setting could be normal if HCl loss from the stomach was exactly counterbalanced by accumulation of lactic acid from anaerobic metabolism. A markedly increased anion gap suggests the presence of the complicating organic acidosis. The usefulness of the anion gap in this situation is hampered by the fact that alkalemia itself can cause an increase in the anion gap by several mechanisms.19,35 Alkalemia results in loss of protons from plasma proteins and an increase in their net negative charge. Hemoconcentration related to volume depletion increases the concentration of plasma proteins and the concentration of their net negative charge. Finally, alkalemia increases lactic acid generation by stimulating phosphofructokinase. The net effect is an increase in the concentration of UAs (lactate and anionic plasma proteins) and an increase in anion gap. The utility of the anion gap concept is considered further in Chapter 12.
Acidosis resulting from administration of NH4Cl causes a decrease in HCO3− concentration because hydrogen ions are released during ureagenesis. There is a reciprocal increase in serum chloride concentration, and as a result, there is no change in the anion gap (so-called hyperchloremic metabolic acidosis). Gastrointestinal loss of HCO3− has the same result because the kidneys conserve NaCl in response to volume depletion. The use of the anion gap in the classification of metabolic acidosis is considered further in Chapter 10.
A decreased anion gap may be observed in immunoglobin G (IgG) multiple myeloma because the pI of IgG paraproteins is greater than 7.4. Hypoalbuminemia or dilution of plasma proteins by crystalloid infusion can decrease the anion gap by decreasing the concentration of the net negative charge associated with plasma proteins. Hypoalbuminemia may be the most common cause of a decreased anion gap, and each 1.0-g/dL decrease in albumin is associated with an approximately 2.4- to 3.0-mEq/L decrease in the anion gap.19,44
The Nontraditional approach to acid-base evaluation
The traditional approach to acid-base evaluation focuses on the relationship between pH, HCO3−, and Pco2 as described by the Henderson-Hasselbalch equation. In this approach, pH is shown to be a function of HCO3− concentration and Pco2. The Pco2 is viewed as the respiratory component and is determined by alveolar ventilation, whereas the HCO3− concentration is considered the metabolic (or nonrespiratory) component and is regulated by the kidneys. This approach may lead to the impression that Pco2 and HCO3− are independent variables. In reality, only Pco2 is independent. When a primary increase in Pco2 occurs, proteins (notably hemoglobin) buffer the hydrogen ions that are produced by dissociation of H2CO3, and the HCO3− concentration increases secondarily. Furthermore, an understanding of the effects of changes in other electrolytes (e.g., Na+, K+, Cl−) and plasma proteins on acid-base balance is not facilitated by the traditional approach. The nontraditional approach allows the clinician to better understand the complexity of the acid-base disturbances in some patients.
Stewart formulated a model of acid-base chemistry in biologic systems governed by three physical laws: (1) maintenance of electroneutrality; (2) satisfaction of dissociation equilibria for incompletely dissociated solutes; and (3) conservation of mass.63,64 The equations that satisfy these laws were solved simultaneously to identify variables that control [H+]. Independent variables are those that may be altered from outside the system, whereas dependent variables are internal to the system and change only in response to changes in independent variables. Simultaneous solution of Stewart’s equations identified three independent variables: strong ion difference (SID), the total concentration of weak acid (HA + A−) or [Atot], and Pco2.
The SID changes if the difference between the sum of strong cations and the sum of strong anions changes. Ions are considered strong if they are almost completely dissociated at the pH of body fluids. The strong cations consist of sodium, potassium, calcium, and magnesium. Of these, only Na+ is present at high enough concentration in ECF that a change in its concentration is likely to have a substantial effect on SID. The strong anions consist of chloride and several other anions that are not routinely measured clinically, and they collectively are referred to as unmeasured strong anions (e.g., lactate, acetoacetate, β-hydroxybutyrate, sulfate). Chloride and some unmeasured strong anions can be sufficiently altered in certain disease states to have a substantial effect on SID. The average concentrations of all cations and anions in the plasma of normal dogs and cats are presented in Table 9-7.
The weak anions in ECF are HCO3−, plasma proteins, and phosphate. Of these, plasma proteins and phosphate constitute the independent variable Atot, whereas HCO3− is a dependent variable. Hypoproteinemia has been shown to be associated with metabolic alkalosis in critically ill human patients in whom a decrease in serum albumin concentration of 1 g/dL caused an increase in standard BE of +3.7 mEq/L.44 Serum phosphorus concentration (normally approximately 2 mEq/L) cannot decrease enough to cause alkalosis, but hyperphosphatemia in patients with renal failure can make a substantial contribution to Atot and metabolic acidosis. The nontraditional approach to acid-base evaluation is considered in detail in Chapter 13.
The Concept of external hydrogen ion balance
External balance for hydrogen ions is maintained by renal excretion of a number of hydrogen ions equal to that consumed in the diet and produced each day by metabolic processes. The majority of hydrogen ions originate from metabolic processes, and little fixed acid originates as such from the diet. A small amount of base is lost each day from the gastrointestinal tract (primarily as organic anions), and this is equivalent to a gain of fixed acid. These processes result in a net daily gain of 50 to 100 mEq of hydrogen ions. Bicarbonate ions that have been titrated by these hydrogen ions must be regenerated. The kidneys are the only regulated route for H+ loss from the body.
Metabolic processes that convert cationic compounds to neutral products generate hydrogen ions, whereas those that convert anionic compounds to neutral products consume hydrogen ions.15,21,73 The main sources of acid are oxidation of the sulfur-containing (e.g., cysteine, methionine) and cationic (e.g., lysine, arginine) amino acids and hydrolysis of organic phosphate diesters, such as phospholipids and nucleic acids. Oxidation of the sulfur-containing amino acids is the major source of acid produced each day:
The main sources of base are metabolism of anionic amino acids (e.g., glutamate, aspartate) and the oxidation or use for gluconeogenesis of other organic anions (e.g., lactate, citrate).
Whole-body regulation of acid-base balance
Acid-base balance requires the cooperation of three major organs: liver, kidneys, and lungs. By the process of alveolar ventilation, the lungs remove the tremendous amount of volatile acid (10,000 to 15,000 mmol CO2) produced each day by metabolic processes. The liver metabolizes amino acids derived from protein catabolism to glucose or triglyceride and releases NH4+ in the process. When urea is synthesized in the liver from NH4+ and CO2, H+ is produced and HCO3− is titrated. Consequently, the liver produces much of the fixed or nonvolatile acid that must be excreted each day. The kidneys excrete NH4+ in the urine, thus diverting it from ureagenesis and producing a net gain of HCO3− and net loss of H+.
Renal regulation of acid-base balance
The kidneys maintain normal ECF HCO3− concentration by reabsorbing virtually all filtered HCO3− and by regenerating HCO3− that has been titrated during the daily endogenous production of fixed, or nonvolatile, acid. The latter process is accomplished by excretion of titratable acidity (primarily phosphate salts) and ammonium salts. The term net acid excretion is defined as the sum of titratable acidity and ammonium minus HCO3− in the urine. Normally, there is a negligible amount of HCO3− in urine.
All three of the functions described above are accomplished by renal tubular secretion of H+. Approximately two thirds of hydrogen ion secretion occurs by means of a luminal Na+-H+ antiporter (NHE3) and approximately one third by a luminal vacuolar or V-type H+-adenosinetriphosphatase (H+-ATPase).33 The H+, K+-ATPase found in the luminal membranes of the type A intercalated cells of the collecting ducts is quantitatively less important for H+ secretion but mediates K+ reabsorption. These transport mechanisms depend on the presence of carbonic anhydrase in tubular cells. Carbonic anhydrase II is found in the cytoplasm, where it catalyzes the recombination of CO2 and H2O into H2CO3, and carbonic anhydrase IV is tethered to the luminal membrane where it facilitates conversion of H2CO3 to CO2 and H2O in tubular fluid (Fig. 9-6). Of the filtered HCO3−, 80% is reabsorbed in the proximal tubule, 10% in the thick ascending limb of Henle’s loop. 6% in the distal convoluted tubule, and 4% in the collecting duct (Fig. 9-7).
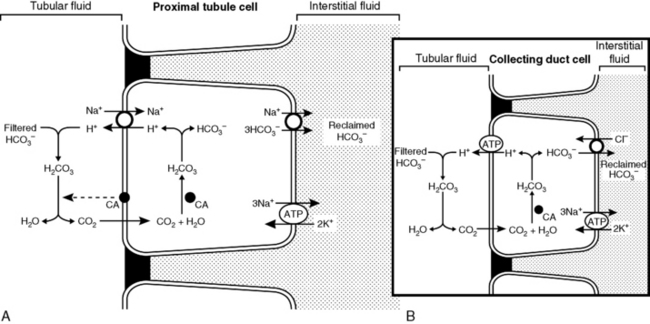
Figure 9-6 A and B, Reabsorption of filtered HCO3− by H+ ion secretion in the proximal tubule. CA, Carbonic anhydrase.
(Drawing by Tim Vojt.)
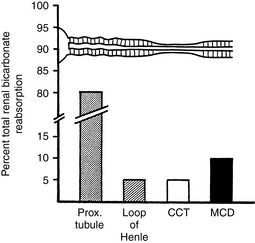
Figure 9-7 Segmental reabsorption of bicarbonate along the nephron. The major portion of filtered bicarbonate is reabsorbed proximally. Fine-tuning of bicarbonate reabsorption occurs in distal nephron segments, including the medullary and cortical collecting ducts, as well as the thick ascending limb of Henle’s loop.
(From Kokko JP, Tannen RL. Fluids and electrolytes, 3rd ed. Philadelphia: WB Saunders, 1996: 208.)
If secreted H+ titrates filtered HCO3−, HCO3− is effectively reabsorbed because one HCO3− is added to ECF for each filtered HCO3− titrated by a secreted H+ (see Fig. 9-6). This process occurs primarily in the proximal tubules. Net acid excretion and generation of “new” HCO3− occur whenever secreted H+ titrates phosphate in tubular fluid or whenever NH4+ is excreted in the urine with Cl−or in exchange for Na+ (Figs. 9-8 and 9-9). These processes occur primarily in the distal nephron.
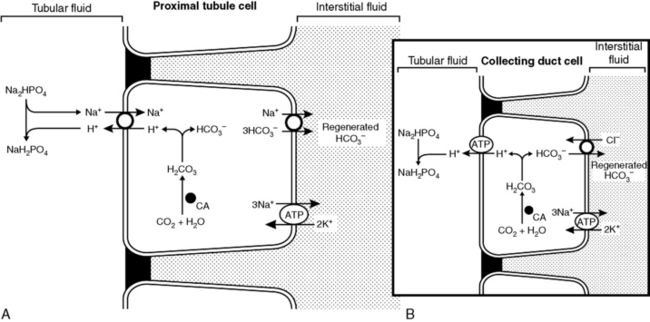
Figure 9-8 A and B, Regeneration of new HCO3− by titration of phosphate by secreted H+ ion in renal tubule. CA, Carbonic anhydrase.
(Drawing by Tim Vojt.)
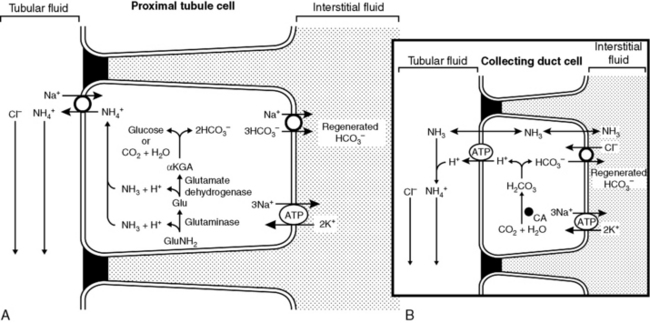
Figure 9-9 A and B, Regeneration of new HCO3− by ammonium excretion in renal tubules. CA, Carbonic anhydrase.
(Drawing by Tim Vojt.)
Factors affecting renal bicarbonate reabsorption
If the glomerular filtration rate (GFR) and ECF volume (ECFV) are constant, the amount of HCO3− reabsorbed by the kidneys is equal to the filtered load. Under these conditions, HCO3− appears to have a tubular maximum (TM) of approximately 3 mEq/min and a renal threshold of 25 mEq/L. However, renal reabsorption of HCO3− is closely tied to reabsorption of sodium and defense of ECFV. A primary expansion of ECFV leads to natriuresis and a transient decrease in renal HCO3− reabsorption. Contraction of the ECFV increases renal tubular reabsorption of sodium and HCO3−. When hypovolemia is induced experimentally, renal HCO3− reabsorption continues to increase even at extremely high plasma HCO3− concentrations.43,61 Thus, the apparent TM for HCO3− changes depending on renal sodium avidity, being increased during volume depletion and decreased during volume expansion.
The anionic composition of glomerular ultrafiltrate determines, to a large extent, the effect that sodium avidity has on the electrolyte composition of the reabsorbed tubular fluid. If an adequate amount of chloride is present in the filtrate, the kidneys reabsorb chloride with sodium, and alkalosis does not develop. If there is insufficient chloride in the filtrate, however, sodium is reabsorbed with HCO3−, and alkalosis develops. The prevailing acid-base status of the ECF can be viewed as a consequence of factors governing sodium and chloride reabsorption in the kidneys.54 At a given rate of renal sodium reabsorption, a change in the reabsorption of either Cl− or HCO3− must be accompanied by a reciprocal change in reabsorption of the other anion.
Renal HCO3− reabsorption is increased by an increase in arterial Pco2 and decreased by a decrease in arterial Pco2. This effect may be mediated by a decrease (or increase) in pH within renal tubular cells and increased (or decreased) availability of H+ for secretion. There is an inverse relationship between serum chloride concentration and the rate of renal HCO3− reabsorption that results from the requirement for electroneutrality during sodium reabsorption (see preceding paragraph). When serum chloride concentration is reduced, the filtered load of chloride decreases, and the kidneys reabsorb more sodium with HCO3−. When serum chloride concentration is increased, the filtered load of chloride increases, and the kidneys reabsorb more sodium with chloride and less with HCO3−. The fact that chloride and HCO3− are the only important resorbable anions in tubular fluid is important in understanding the pathophysiology of chloride-responsive metabolic alkalosis (see Chapters 4 and 10).
Hyperkalemia is associated with decreased renal HCO3− reabsorption in the distal nephron, and hypokalemia is associated with increased HCO3− reabsorption. During hypokalemia, transcellular shifting of potassium ions out of renal tubular cells into ECF occurs in exchange for hydrogen ions. This results in greater availability of H+ for secretion by the tubular cells. When H+ is secreted into tubular fluid, HCO3− is added to ECF. The opposite effect occurs with hyperkalemia, and there are fewer hydrogen ions in tubular cells available for secretion into tubular fluid. Aldosterone increases HCO3− reabsorption in the collecting ducts directly by stimulating the luminal H+-ATPase responsible for H+ secretion and indirectly by increasing lumen electronegativity by enhancement of sodium reabsorption.
Titratable acidity
Titratable acidity refers to the amount of strong base needed to titrate a 24-hour urine sample back to a pH of 7.40 and represents the amount of H+ excreted in the urine in combination with weak acid anions, primarily phosphate. When urine pH is very low (e.g., 5.0 to 5.5), other weak acids such as creatinine (pKa = 5.0) and urate (pKa = 5.8) contribute to titratable acidity. Frequently, however, the term titratable acidity is considered synonymous with urinary phosphate (pKa = 6.8). Of the daily 50 to 100 mEq of fixed or nonvolatile acid produced by metabolic processes, approximately 20 to 40 mEq (40%) is excreted as titratable acidity.
The pKa of a weak acid is the pH at which one half of the buffer is in the salt and one half in the acid form (i.e., the ratio of salt to acid is 1.0), and buffers are most effective within 1.0 pH unit of their pKa. Phosphate is a very effective urinary buffer because its pKa (6.8) falls between the pH of distal tubular fluid (6.0) and that of glomerular filtrate (7.4). The amount of phosphate available for buffering tubular fluid is the product of serum phosphorus concentration and the GFR (i.e., the filtered load of phosphate). The filtered load of phosphate is relatively constant in a normal individual in phosphorus balance.
Ammonium excretion
Excretion of ammonium by the kidneys is essential for eliminating the daily fixed acid load and regenerating titrated bicarbonate. Most of the ammonium to be excreted is produced from glutamine in the proximal tubule by action of the enzyme glutaminase20,21:


It can be seen from these reactions that two H+ are consumed when the α-ketoglutarate produced from glutamine is either oxidized or converted to glucose. This results in the simultaneous generation of two new bicarbonate ions. If the liver uses an equal number of ammonium ions for urea synthesis, two H+ are produced, two HCO3− are titrated, and there is no net gain of HCO3−. If the NH4+ is excreted in the urine along with Cl−or in exchange for Na+, however, a net gain of HCO3− occurs.
The classical theory of ammonium excretion by the kidney suggests that NH3 diffuses passively through the luminal membrane of the tubular cell into tubular fluid. Hydrogen ions derived from the dissociation of carbonic acid could then combine with NH3 to form NH4+ because the pKa for this reaction is 9.2. In the pH range of tubular fluid (6.0 to 7.0), only 0.1% to 1% of this buffer pair would exist as NH3. Thus, the associated H+ is strongly attached to NH3 by forming NH4+ and does not affect urine pH (Fig. 9-10).
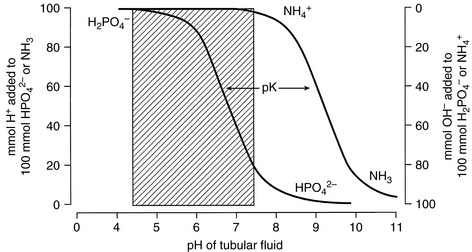
Figure 9-10 Explanation of how NH4+ excretion allows removal of acid without affecting urine pH.
(Drawing by Tim Vojt.)
The classical theory of ammonium excretion by the kidneys was based on diffusion trapping of NH3 in tubular fluid. According to this theory, the lipid-soluble, nonionized NH3 diffuses passively into tubular fluid, where it is trapped by combination with H+ to form less permeant NH4+. This theory dictates that diffusion equilibrium occurs for NH3 and that renal tubular cells do not transport NH4+.
Several renal transport mechanisms contribute to the ultimate appearance of NH4+ in urine. Ammonium arises from the metabolism of glutamine and glutamate in the proximal tubules. The ammonium ions that are produced can substitute for H+ on the luminal Na+/H+ antiporter (NHE3) and be secreted into the tubular lumen. When the α-ketoglutarate resulting from the deamination of glutamine and glutamate is metabolized either to CO2 and H2O via the Krebs cycle or to glucose via gluconeogenesis, there is a net gain of 2HCO3−, and these “regenerated” bicarbonate ions are returned to the interstitial fluid via an electrogenic basolateral 3HCO3−/Na+ cotransporter (NBCe1). The secreted NH4+ travels down the lumen of the descending limb of Henle’s loop and is reabsorbed in the thick ascending limb by substituting for K+ in the luminal Na+-K+-2Cl− cotransporter (NKCC2) in this nephron segment. The lumen-positive transepithelial potential difference in the thick ascending limb also may drive some reabsorption of NH4+ by the paracellular route. The cytoplasm of the tubular cells has a higher pH than the tubular fluid, which allows some NH3 to form that then can diffuse across the basolateral membranes into the medullary interstitium where it reaches a high concentration. The NH3 does not escape back across the luminal membranes into the tubular fluid because the luminal membranes of the thick ascending limb are impermeable to NH3. The interstitial NH3 then diffuses into segments of the nephron that lack luminal carbonic anhydrase and consequently have the lowest luminal pH (i.e., the S3 segment of the proximal tubule, the cortical collecting duct, and most of the medullary collecting duct). In these segments, the low luminal pH facilitates trapping of NH3 in the lumen as NH4+. In the S3 segment of the proximal tubule, the NH4+ that is formed is reabsorbed (i.e., recycled) in the thick ascending limb of Henle’s loop. The cell membranes of the collecting ducts are highly permeable to NH3 (but not NH4+), which facilitates diffusion of interstitial NH3 across the basolateral membranes into the cells and across the luminal membranes into the tubular fluid where it is trapped as NH4+. The NH4+ trapped in the collecting ducts is excreted in urine and represents a major avenue for elimination of hydrogen ions from the body and for regenerating titrated bicarbonate ions. Rhesus (Rh) glycoproteins RhBG and RhCG are expressed in the distal convoluted tubule, connecting tubule, and collecting duct and function as transporters of ammonia.33,72,74 RhCG (but not RhBG) expression is increased by chronic acidosis reflecting the important role of RhCG in ammonia secretion and net acid excretion.
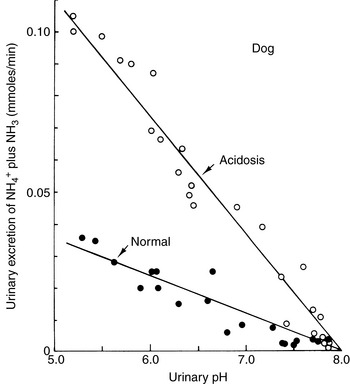
The ability of the kidneys to excrete an acid load despite their inability to reduce urine pH below 5.0 (in dogs and cats) is explained by the high pKa (9.2) of the NH3-NH4+ buffer pair68 (see Fig. 9-10). In the normal animal, 30 to 60 of the 50 to 100 (60%) mEq of the fixed or nonvolatile acid produced each day is excreted in urine as ammonium, either as the chloride salt or in exchange for sodium. The more acidic the urine, the greater the proportion of ammonium that exists as NH4+. The kidneys can also increase their production of ammonium from glutamine during acidosis. At any given urine pH, the rate of ammonium salt excretion is higher in the presence of acidosis,68 and renal ammonium excretion can increase fivefold to tenfold (from basal ammonium excretion of 30 to 60 mEq to as much as 300 mEq per day) in response to chronic metabolic acidosis (Fig. 9-11).
Potassium and acid-base balance
The distribution of potassium ions between intracellular fluid and ECF may be affected by acid-base disorders. When HCl was infused acutely into nephrectomized dogs, approximately 50% of the H+ load was buffered intracellularly.55,65 Intracellular sodium and potassium ions entered ECF in exchange for the H+ entering cells, and serum potassium concentration increased. These early animal studies and observations in a small number of human patients10 led to the prediction that metabolic acidosis would be associated with a 0.6-mEq/L increase in serum potassium concentration for each 0.1-U decrease in pH. A review of animal studies demonstrated that the change in serum potassium concentration observed during acute metabolic acidosis caused by mineral acids (e.g., HCl, NH4Cl) was variable.3 Furthermore, an increase in serum potassium concentration does not occur in acute metabolic acidosis caused by organic acids (e.g., lactic acid, ketoacids).* Acute infusion of β-hydroxybutyrate in normal dogs caused an increase in insulin in portal venous blood and hypokalemia, presumably as a result of potassium uptake by cells.2 Acute infusion of HCl led to hyperkalemia and increased portal vein glucagon concentration.2 These acute changes in serum potassium concentration are not the result of changes in renal excretion of potassium.2,49
The hyperkalemia associated with acute metabolic acidosis caused by mineral acids is transient. In a study of acute and chronic metabolic acidosis induced in dogs by administration of HCl or NH4Cl, hyperkalemia was observed after acute infusion of HCl, but hypokalemia developed after 3 to 5 days of NH4Cl administration.41 The observed hypokalemia was associated with inappropriately high urinary excretion of potassium and increased plasma aldosterone concentration.41 Similar findings in rats with chronic metabolic acidosis induced by NH4Cl have been reported.53 Acute metabolic acidosis induced by administration of mineral acid decreases renal proximal tubular reabsorption of sodium, leading to volume contraction and increased distal delivery of sodium. Increased Na+-H+ and Na+-K+ exchange then occurs in the distal nephron, mediated by increased distal tubular fluid flow and hyperaldosteronism. These findings suggest that mild hypokalemia and potassium depletion are likely to develop during chronic metabolic acidosis caused by administration of a mineral acid. The observation of hyperkalemia during chronic metabolic acidosis should prompt consideration of impaired renal potassium excretion or some other cause of hyperkalemia (see Chapter 5).
1 Adrogue H.J., Brensilver J., Madias N.E. Changes in the plasma anion gap during chronic metabolic acid-base disturbances. Am J Physiol. 1978;235:F291.
2 Adrogue H.J., Chap Z., Ishida T., et al. Role of the endocrine pancreas in the kalemic response to acute metabolic acidosis in conscious dogs. J Clin Invest. 1985;75:798.
3 Adrogue H.J., Madias N.E. Changes in plasma potassium concentration during acute acid base disturbances. J Clin Invest. 1981;71:456.
4 Aguilera-Tejero E., Fernandez H., Estepa J.C., et al. Arterial blood gases and acid-base balance in geriatric dogs. Res Vet Sci. 1997;63:253.
5 Astrup P. New approach to acid-base metabolism. Clin Chem. 1961;7:1.
6 Astrup P., Jorgensen K., Siggaard-Andersen O., et al. Acid-base metabolism: new approach. Lancet. 1960;1:1035.
7 Atkins C.E., Tyler R., Greenlee P. Clinical, biochemical, acid-base, and electrolyte abnormalities in cats after hypertonic sodium phosphate enema administration. Am J Vet Res. 1985;46:980.
8 Bleich H.L., Berkman P.M., Schwartz W.B. The response of cerebrospinal fluid composition to sustained hypercapnia. J Clin Invest. 1964;43:11.
9 Burnell J.M. Changes in bone sodium and carbonate in metabolic acidosis and alkalosis in the dog. J Clin Invest. 1971;50:327.
10 Burnell J.M., Villamil M.F., Uyeno B.T., et al. The effect in humans of extracellular pH change on the relationship between serum potassium concentration and intracellular potassium. J Clin Invest. 1956;35:935.
11 Chew D.J., Leonard M., Muir W.W. Effect of sodium bicarbonate infusion on serum osmolality, electrolyte concentrations, and blood gas tensions in cats. Am J Vet Res. 1991;52:12.
12 Ching S.V., Fettman M.J., Harnar D.W., et al. The effect of chronic dietary acidification using ammonium chloride on acid-base and mineral metabolism in the adult cat. J Nutr. 1989;119:902.
13 Christopher M.M., Eckfeld J.H., Eaton J.W. Propylene glycol ingestion causes d-lactic acidosis. Lab Invest. 1990;62:114.
14 Cohen J.J., Brackett N.C., Schwartz W.B. The nature of the carbon dioxide titration curve in the normal dog. J Clin Invest. 1964;43:777.
15 Cohen R.M., Feldman G.M., Fernandez P.C. The balance of acid, base and charge in health and disease. Kidney Int. 1997;52:287.
16 Constable P.D., Stämpfli H.R. Experimental determination of net protein charge and Atot and Ka of nonvolatile buffers in canine plasma. J Vet Intern Med. 2005;19:507.
17 Cornelius L.M., Rawlings C.A. Arterial blood gas and acid base values in dogs with various diseases and signs of disease. J Am Vet Med Assoc. 1981;178:992.
18 Emmett M., Narins R.G. Clinical use of the anion gap. Medicine (Baltimore). 1977;56:38.
19 Gabow P.A. Disorders associated with an altered anion gap. Kidney Int. 1985;27:472.
20 Halperin M.L. How much “new” bicarbonate is formed in the distal nephron in the process of net acid excretion? Kidney Int. 1989;35:1277.
21 Halperin M.L., Jungas R.L. Metabolic production and disposal of hydrogen ions. Kidney Int. 1983;24:709.
22 Harrington J.T., Cohen J.J., Kassirer J.P. Introduction to the clinical acid-base disturbances. In: Cohen J.J., Kassirer J.P., editors. Acid-base. Boston: Little, Brown; 1982:119.
23 Haskins S.C. An overview of acid-base physiology. J Am Vet Med Assoc. 1977;170:423.
24 Haskins S.C. Sampling and storage of blood for pH and blood gas analysis. J Am Vet Med Assoc. 1977;170:429.
25 Haskins S.C. Blood gases and acid-base balance: clinical interpretation and therapeutic implications. In: Kirk R.W., editor. Current veterinary therapy VIII. Philadelphia: WB Saunders; 1983:201.
26 Herbert D.A., Mitchell R.A. Blood gas tensions and acid-base balance in awake cats. J Appl Physiol. 1971;30:434.
27 Hutchison A.S., Ralston S.H., Drybaugh F.J., et al. Too much heparin: possible source of error in blood gas analysis. BMJ. 1983;287:1131.
28 Ilkiw J.E., Davis P.E., Church D.B. Hematologic, biochemical, blood gas, and acid base values in greyhounds before and after exercise. Am J Vet Res. 1989;50:583.
29 Ilkiw J.E., Rose R.J., Martin I.C.A. A comparison of simultaneously collected arterial, mixed venous, jugular venous and cephalic venous blood samples in the assessment of blood gas and acid base status in dogs. J Vet Intern Med. 1991;5:294.
30 James K.M., Polzin D.J., Osborne C.A., et al. Effects of sample handling on total carbon dioxide concentrations in canine and feline serum and blood. Am J Vet Res. 1997;58:343.
31 Kilborn S.H., Bonnett B.N., Pook H.A. Comparison of three different methods of total carbon dioxide measurement. Vet Clin Pathol. 1995;24:22.
32 King L.G., Anderson J.G., Rhodes W.H., et al. Arterial blood gas tensions in healthy aged dogs. Am J Vet Res. 1992;53:1744.
33 Koeppen B.M. The kidney and acid base regulation. Adv Physiol Educ. 2009;33:275.
34 Madias N.E., Adrogue J.H., Cohen J.J. Effect of natural variations in Paco2 on plasma HCO3− in dogs: a redefinition of normal. Am J Physiol. 1979;236:F30.
35 Madias N.E., Ayus J.C., Adrogue H.J. Increased anion gap in metabolic alkalosis: the role of plasma protein equivalency. N Engl J Med. 1979;300:1421.
36 Madias N.E., Bossert W.H., Adrogue H.J. Ventilatory response to chronic metabolic acidosis and alkalosis in the dog. J Appl Physiol. 1984;56:1640.
37 Madias N.E., Cohen J.J. Acid-base chemistry and buffering. In: Cohen J.J., Kassirer J.P., editors. Acid-base. Boston: Little, Brown; 1982:13.
38 Madias N.E., Cohen J.J. Acid-base chemistry and buffering. In: Cohen J.J., Kassirer J.P., editors. Acid-base. Boston: Little, Brown; 1982:17.
39 Madias N.E., Schwartz W.B., Cohen J.J. The maladaptive renal response to secondary hypocapnia during chronic HCl acidosis in the dog. J Clin Invest. 1977;60:1393.
40 Madiedo G., Sciacca R., Hause L. Air bubbles and temperature effect on blood gas analysis. J Comp Pathol. 1980;33:864.
41 Magner P.O., Robinson L., Halperin R.M., et al. The plasma potassium concentration in metabolic acidosis: a re-evaluation. Am J Kidney Dis. 1988;11:220.
42 Malnic G., Giebisch G. Mechanism of renal hydrogen ion secretion. Kidney Int. 1972;1:280.
43 Malnic G., Mellow Aires M. Kinetic study of bicarbonate reabsorption in proximal tubule of the rat. Am J Physiol. 1971;220:1759.
44 McAuliffe J.J., Lind L.J., Leith D.E., et al. Hypoproteinemic alkalosis. Am J Med. 1986;81:86.
45 McCullough S.M., Constable P.D. Calculation of the total plasma concentration of nonvolatile weak acids and the effective dissociation constant of nonvolatile buffers in plasma for use in the strong ion approach to acid-base balance in cats. Am J Vet Res. 2003;64:1047-1051.
46 Middleton D.J., Ilkiw J.E., Watson A.D.J. Arterial and venous blood gas tensions in clinically healthy cats. Am J Vet Res. 1981;42:1609.
47 Oh M.S., Carrol J.H. The anion gap. N Engl J Med. 1977;297:814.
48 Oster J.R., Perez G.O., Castro A., et al. Plasma potassium response to acute metabolic acidosis induced by mineral and nonmineral acids. Miner Electrolyte Metab. 1980;4:28.
49 Oster J.R., Perez G.O., Vaamonde C.A. Relationship between blood pH and potassium and phosphorus during acute metabolic acidosis. Am J Physiol. 1978;235:F345.
50 Polzin D.J., Stevens J.B., Osborne C.A. Clinical evaluation of the anion gap in evaluation of acid-base disorders in dogs. Compend Contin Educ Pract Vet. 1982;4:102.
51 Pruden E.L., Siggaard-Andersen O., Tietz N.W. Blood gases and pH. In: Burtis C.A., Ashwood E.R., editors. Tietz fundamentals of clinical chemistry. Philadelphia: WB Saunders; 1996:506.
52 Rodkey W.G., Hannon J.P., Dramise J.G., et al. Arterialized capillary blood used to determine the acid-base and blood gas status of dogs. Am J Vet Res. 1978;39:459.
53 Scandling J.D., Ornt D.B. Mechanism of potassium depletion during chronic metabolic acidosis in the rat. Am J Physiol. 1987;252:F122.
54 Schwartz W.B., Cohen J.J. The nature of the renal response to chronic disorders of acid-base equilibrium. Am J Med. 1978;64:417.
55 Schwartz W.B., Orning K.J., Porter R. The internal distribution of hydrogen ions with varying degrees of metabolic acidosis. J Clin Invest. 1957;36:373.
56 Schwartz W.B., Relman A.S. A critique of the parameters used in the evaluation of acid-base disorders: “whole blood buffer base” and “standard bicarbonate” compared with blood pH and plasma bicarbonate concentration. N Engl J Med. 1963;268:1382.
57 Severinghaus J.W. Siggard-Andersen and the “Great Transatlantic acid-base debate”. Scand J Clin Lab Invest. 1993;54(Suppl. 214):99.
58 Shull R.M. The value of anion gap and osmolal gap determinations in veterinary medicine. Vet Clin Pathol. 1978;7:12.
59 Siggaard-Andersen O., Engel K., Jorgensen K., et al. A micro method for determination of pH, carbon dioxide tension, base excess and standard bicarbonate in capillary blood. Scand J Clin Lab Invest. 1960;12:172.
60 Singer R.B., Hastings A.B. An improved clinical method for the estimation of disturbances of the acid-base balance of human blood. Medicine (Baltimore). 1948;27:223.
61 Slatopolsky E., Hoffsten P., Purkerson M., et al. On the influence of extracellular fluid volume expansion and of uremia on bicarbonate reabsorption in man. J Clin Invest. 1970;49:988.
62 Solter P.F., Haskins S.C., Patz J.D. Comparison of PO2, PCO2 and pH in blood collected from the femoral artery and a cut claw of cats. Am J Vet Res. 1988;49:1882.
63 Stewart P.A. How to understand acid-base. New York: Elsevier; 1981.
64 Stewart P.A. Modern quantitative acid-base chemistry. Can J Physiol Pharmacol. 1983;61:1444.
65 Swan R.C., Pitts R.F. Neutralization of infused acid by nephrectomized dogs. J Clin Invest. 1955;34:205.
66 Tobin R.B. Varying role of extracellular electrolytes in metabolic acidosis and alkalosis. Am J Physiol. 1958;195:687.
67 Valtin H., Gennari F.J. Acid-base disorders: basic concepts and clinical management. Boston: Little, Brown; 1987.
68 Valtin H., Schafer J.A. Renal function. Boston: Little, Brown; 1995.
69 van Leeuwen A.M. Net cation equivalency (“base binding power”) of the plasma proteins: a study of ion-protein interaction in human plasma by means of in vivo ultrafiltration and equilibrium dialysis. Acta Med Scand. 1964;422(Suppl.):1.
70 van Sluijs F.J., de Vries H.W., de Bruijne J.J., et al. Capillary and venous blood compared with arterial blood in the measurement of acid-base and blood gas status of dogs. Am J Vet Res. 1983;44:459.
71 van Slyke D.D., Hastings A.B., Hiller A., et al. Studies of gas and electrolyte equilibria in blood. XIV. The amounts of alkali bound by serum albumin and globulin. J Biol Chem. 1920;79:769.
72 Wagner C.A., Devuyst O., Bourgeois S., et al. Regulated acid-base transport in the collecting duct. Pfulgers Arch – Eur J Physiol. 2009;458:137.
73 Walser M. Roles of urea production, ammonium excretion, and amino acid oxidation in acid-base balance. Am J Physiol. 1986;250:F181.
74 Weiner I.D., Hamm L.L. Molecular mechanisms of renal ammonia transport. Annu Rev Physiol. 2007;69:317.
75 Whitehair K.J., Haskins S.C., Whitehair J.G., et al. Clinical applications of quantitative acid-base chemistry. J Vet Intern Med. 1995;9:1.
76 Zweens J., Frankena H., van Kampen E.J., et al. Ionic composition of arterial and mixed venous plasma in the unanesthetized dog. Am J Physiol. 1977;233:F412.