Anesthetic Monitoring
After completion of this chapter, the reader will be able to:
• Explain the principles of anesthetic monitoring, including the reasons for and goals of monitoring.
• List the physical monitoring parameters, and classify each in one of the following categories: (1) vital signs; (2) reflexes; (3) other indicators of anesthetic depth.
• List and describe each of the classic stages and planes of anesthesia.
• List the monitoring parameters used primarily to determine whether or not the patient is safe, and group them according to whether they primarily assess circulation, oxygenation, or ventilation.
• Explain and demonstrate assessment of each of the vital signs, reflexes, and other indicators of anesthetic depth.
• List normal values for each physical monitoring parameter, and identify values that should be reported to the veterinarian-in-charge (VIC).
• Explain setup, operation, care, maintenance, and troubleshooting of an esophageal stethoscope, electrocardiograph, Doppler monitor, oscillometric blood pressure monitor, pulse oximeter, apnea monitor, and capnograph.
• Interpret output and data from an esophageal stethoscope, electrocardiograph, Doppler monitor, oscillometric blood pressure monitor, pulse oximeter, apnea monitor, and capnograph.
• Describe how to determine the blood pressure using a Doppler monitor, oscillometric blood pressure monitor, or arterial catheter and transducer.
• Identify the following rhythms on an electrocardiographic tracing: normal sinus rhythm (NSR); sinus arrhythmia (SA); sinus bradycardia and tachycardia; first-, second-, and third-degree atrioventricular (AV) heart block; supraventricular premature complexes (SPCs) and ventricular premature complexes (VPCs); supraventricular and ventricular tachycardia; atrial and ventricular fibrillation; and QRS and T-wave configuration changes.
• Identify machine-generated data that should be reported to the VIC.
• Identify abnormal monitoring parameters, and list common causes of abnormal monitoring parameters.
• Use monitoring parameters to determine anesthetic depth.
• Explain adverse consequences of hypothermia, and identify strategies to prevent hypothermia.
INTRODUCTION TO MONITORING
The word monitor comes from the Latin word monere, which means “to warn.” This is a fitting definition for this aspect of anesthesia, as the main purpose of monitoring is to warn the anesthetist of changes in anesthetic depth and patient condition in enough time to permit intervention before they become dangerous.
Throughout any anesthetic event, a delicate balance must be maintained. There must be sufficient central nervous system (CNS) depression, analgesia, muscle relaxation, and immobility for the procedure to be performed, yet cardiopulmonary function must not be dangerously compromised. Monitoring is therefore necessary for two reasons. First, it is necessary to keep the patient safe; and second, it is necessary to regulate anesthetic depth. To keep the patient safe, the anesthetist must monitor the patient at many points in time to ensure that vital signs remain within acceptable limits. Failure to monitor and maintain vital signs within acceptable limits may lead to devastating consequences such as permanent brain damage or even death. The anesthetist also must maintain the animal at an appropriate anesthetic depth (i.e., one that is neither too light nor too deep) by monitoring reflexes and other indicators. Failure to maintain an adequate depth of anesthesia may result in perception of pain and premature arousal from anesthesia. On the other hand, maintaining an animal at an excessive depth of anesthesia may lead to anesthetic overdose or slow recovery.
 TECHNICIAN NOTE
Monitoring is necessary for two reasons. First, it is necessary to keep the patient safe; and second, it is necessary to regulate anesthetic depth.
When monitoring, the anesthetist must observe various parameters that can be separated into three classifications: (1) vital signs, (2) reflexes, and (3) other indicators of anesthetic depth. Although information from all these monitoring parameters is used to determine the depth of anesthesia and patient well-being, some are more helpful in determining anesthetic depth, and others are more helpful in determining whether the patient is safe.
The term vital signs refers to those variables that indicate the response of the animal’s homeostatic mechanisms to anesthesia, including heart rate (HR), heart rhythm, respiratory rate (RR) and depth, mucous membrane color, capillary refill time (CRT), pulse strength, blood pressure (BP), and temperature. The patient’s vital signs indicate how well the patient is maintaining basic circulatory and respiratory function during anesthesia and therefore are the best indicators of patient well-being. Although vital signs also generally reflect the anesthetic stage and plane, they are not reliable indicators of anesthetic depth.
The term reflex refers to an involuntary response to a stimulus (such as an eye blink in response to touching the skin at the corner of the eye or a kick in response to a tap on the patellar tendon). Reflexes used in veterinary anesthesia include the palpebral, corneal, pedal, swallowing, and laryngeal reflexes as well as the pupillary light reflex (PLR). Other indicators of anesthetic depth include spontaneous movement, eye position, pupil size, muscle tone, nystagmus, salivary and lacrimal secretions, and response to surgical stimulation. Both reflexes and other indicators are useful for determining anesthetic depth but are not useful for assessing cardiopulmonary function or homeostasis.
In 1995 the American College of Veterinary Anesthesiologists (ACVA) published guidelines for anesthetic monitoring in the Journal of the American Veterinary Medical Association, intended to maximize quality of care and assist veterinary professionals in making sound anesthetic monitoring decisions. In 2009 these guidelines were substantially updated to reflect important changes in the profession (see Appendix A). In this document, the ACVA indicates that, when compared with the status of the profession at the time of the original publication of these guidelines, the general standard of care has increased, client expectations are higher, and equipment is more widely available that permits earlier detection of adverse effects such as hypotension, hypoxemia, and severe hypercapnia. These changes supported a shift from a model centered on minimizing the risk of anesthetic deaths to one centered on decreasing anesthetic complications of all types. In the revised document the ACVA offers recommendations in each of the following categories:
• Assessment of circulation, oxygenation, ventilation, and body temperature
• Monitoring of patients under, and recovering from, neuromuscular blockade
• Monitoring during the recovery period
The focus of these recommendations is assessment of vital signs, and therefore the recommendations address the problem of keeping the patient safe. Determining the depth of anesthesia is accomplished primarily by monitoring reflexes and other indicators of depth listed previously and is covered later in this chapter.
For monitoring to be effective, the patient must be evaluated frequently during any anesthetic procedure. Although continuous monitoring of any anesthetized patient by a veterinary technician is ideal, it is not practical in many veterinary clinics. Therefore, in lieu of continuous monitoring of all patients, the ACVA recommends that class P1 and P2 patients should be monitored at least once every 5 minutes. In contrast, class P3, P4, and P5 patients, as well as horses receiving inhalant anesthetics or that have been anesthetized for more than 45 minutes, should be monitored continuously.
TECHNICIAN NOTE
Anesthetic monitoring is based on the principle that in the average patient each monitoring parameter is expected to show a predictable response at any given anesthetic depth.
Anesthetic monitoring is based on the principle that in the average patient, each monitoring parameter is expected to show a predictable response at any given anesthetic depth. For instance, swallowing and pedal reflexes are expected to be present when the patient’s anesthesia level is too light but are absent during surgical anesthesia. Muscle tone, HR, and RR are expected to be high during light anesthesia and to gradually decrease as anesthetic depth increases. Eyes are in a central position during light anesthesia, generally rotate into a ventromedial position during surgical anesthesia, and return to a central position as anesthetic depth increases.
Interpretation of these indicators is quite challenging in practice, however, because a number of factors including drugs, disease, and individual variation may alter expected responses, producing contradictory evidence. In other words, a patient may show some signs that indicate one stage of anesthesia and other signs that indicate another. For instance, a dog that received an opioid agonist may have a smaller than expected pupil size while in surgical anesthesia. A patient with preexisting heart failure may have a higher HR than expected at a given depth. A patient given an alpha2-agonist such as dexmedetomidine may have significant hypotension and bradycardia, whereas another given atropine may have tachycardia, even though both are in the same plane. Therefore is it important to observe multiple parameters and make decisions based on the predominant evidence. This requires careful observation, rapid decision-making, and safe and appropriate action. (See p. 177 for examples of depth assessment.)
STAGES AND PLANES OF ANESTHESIA
During World War I, Arthur Guedel, MD, a U.S. army doctor, developed a classification system of stages and planes of anesthesia based on observation of patient responses to the inhalant anesthetic diethyl ether. Under this system, general anesthesia was divided into four stages (I to IV), and stage III was subdivided into four planes (1 to 4) (Figure 5-1). Development of this system gave anesthetists a basis to accurately assess depth of anesthesia based on detailed observation. Although responses to modern general anesthetics differ somewhat from responses to ether, this system is still used today in a slightly altered form.
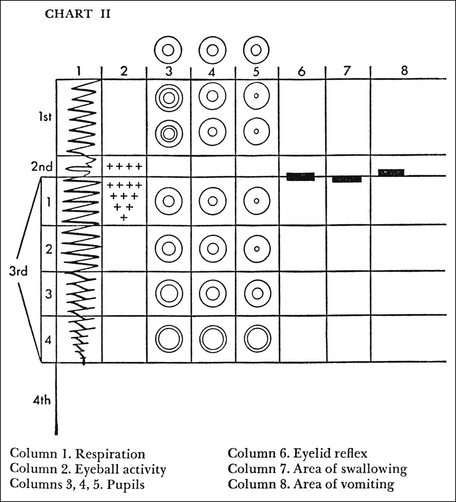
FIGURE 5-1 Guedel’s stages and planes of anesthesia. (From Arthur E. Guedel Commemorative Issue of the California Society of Anesthesiologists Bulletin, 1975. Used with permission of the Guedel Anesthesia Center, Health Sciences Library, California Pacific Medical Center.)
Overview of Anesthetic Stages and Planes
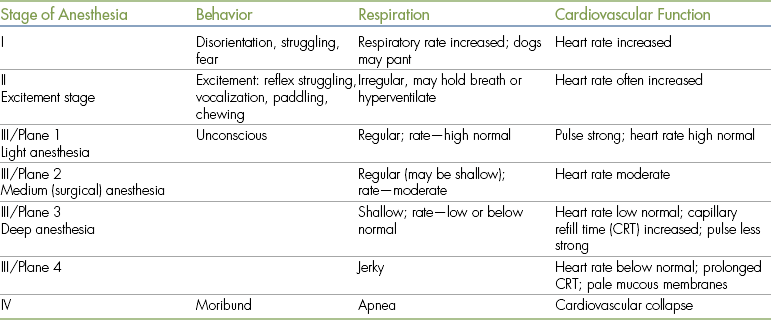
As an induction agent is given, the patient passes through stage I; and as it loses consciousness, it enters stage II. The loss of consciousness marks the border between these stages. As the anesthetic depth increases, the patient then enters stage III, the period of surgical anesthesia. The loss of spontaneous muscle movement marks the border between stages II and III. If the depth continues to increase, the patient will enter stage IV. The loss of all reflexes, widely dilated, unresponsive pupils, flaccid muscle tone, and cardiopulmonary collapse mark this stage, which, if not aggressively managed, is closely followed by cardiopulmonary arrest and death of the patient. As the animal passes through each stage, there is a progressive decrease in pain perception, motor coordination, consciousness, reflex responses, muscle tone, and eventually cardiopulmonary function. Expected responses of selected monitoring parameters during each stage and plane are summarized in Table 5-1.
Stage I—Period of Voluntary Movement
During stage I, the patient begins to lose consciousness. This stage is usually characterized by fear, excitement, disorientation, and struggling. The HR and RR increase, and the patient may pant, urinate, or defecate. A patient in stage I is typically difficult to handle. Near the end of stage I, the patient loses the ability to stand and becomes recumbent.
Stage II—Period of Involuntary Movement
During stage II, also known as the excitement stage, the patient loses voluntary control and breathing becomes irregular. This stage is usually characterized by involuntary reactions in the form of vocalizing, struggling, or paddling. The HR and RR are often elevated, pupils are dilated, muscle tone is marked, and reflexes are present and in fact may appear exaggerated. Although animals in stage II may appear to be “fighting” the anesthesia, the actions are not under conscious control. Rather, they are thought to occur because the anesthetic selectively depresses neurons in the brain and spinal cord that normally inhibit and control the function of motor neurons. Stage II ends when the animal shows signs of muscle relaxation, slower RR, and decreased reflex activity.
This stage is unpleasant and potentially hazardous for both the animal and hospital personnel. There is a risk of epinephrine release and the possibility of cardiac arrhythmias or arrest. The struggling patient may injure itself, the restrainer, or the anesthetist. Therefore it is desirable to plan the procedure such that the patient passes through this stage as quickly as possible, by additional administration of anesthetic until stage III is reached.
Premedicated animals in which anesthesia is rapidly induced with an injectable anesthetic often appear to pass from consciousness directly to stage III. Although these patients pass through stages I and II, they are not clinically evident. In contrast, stages I and II are often very pronounced in animals in which anesthesia is mask or chamber induced without premedication, sometimes creating a challenging and unpleasant situation for the anesthetist and patient.
Stage III—Period of Surgical Anesthesia
During stage III, which is subdivided into four planes, the patient is unconscious and progresses gradually from light to deep surgical anesthesia. It is characterized by progressive muscle relaxation, decreasing HR and RR, and loss of reflexes. The pupils gradually dilate, tear production decreases, and the PLR is lost. The increase in HR, BP, and RR seen in response to surgical stimulation during light anesthesia is also gradually lost.
In plane 1, the respiratory pattern becomes regular, and involuntary limb movements cease. The eyeballs often start to rotate ventrally, the pupils may become partially constricted, and the pupillary response to bright light is diminished. The gagging and swallowing reflexes are depressed such that an endotracheal tube may be successfully passed, allowing the patient to be connected to a gas anesthetic machine. Other reflexes (such as the pedal and palpebral reflexes) are present; however, responses are less brisk than in stage II. Although unconscious, the patient will not tolerate surgical procedures at this light plane of anesthesia and will move and exhibit increased HR, RR and respiratory depth, and BP, in response to painful stimuli. This plane is inadequate for surgery.
Plane 2 is suitable for most surgical procedures. Surgical stimulation may evoke a mildly increased HR, or RR, but the patient remains unconscious and immobile. The PLR is sluggish, and the pupil size is moderate. The respirations are regular but shallow, and the RR, HR, and BP are mildly decreased. The skeletal muscle tone is more relaxed, pedal and swallowing reflexes are absent, and laryngeal and palpebral reflexes are diminished or lost. So loss of the pedal and swallowing reflexes marks entry into plane 2, and ventromedial eye rotation also generally occurs at this time.
In plane 3, the patient is deeply anesthetized. Significant depression of circulation and respiration is often present, and for this reason plane 3 is considered to be excessively deep for most surgical procedures. In the dog or cat, the HR and RR are low and the tidal volume (VT) is decreased. Manual or mechanical ventilation may be necessary in some small animal patients and most large animal patients. HR is also notably reduced even in the presence of surgical stimulation. Pulse strength may be reduced because of a fall in BP. The CRT may be increased to 1.5 to 2 seconds. The PLR is poor throughout this plane and may be absent. The eyeballs are often central, and the pupils are moderately dilated. Reflex activity is often totally absent. Skeletal muscle tone is so relaxed that no resistance occurs when the mouth is opened (i.e., jaw tone is flaccid or slack).
Plane 4 is the period of early anesthetic overdose. It is characterized by abdominal breathing, which occurs as the thoracic muscles progressively become less active and abdominal muscles are increasingly responsible for ventilation. Abdominal breathing is recognized by a “rocking” motion, in which the abdomen expands and contracts in an attempt to move air into and out of the lungs. Plane 4 is also characterized by fully dilated pupils and the absence of all reflexes. The eyes may be dry because of an absence of lacrimal secretions. Muscle tone is flaccid. The cardiovascular system is markedly depressed, with a dramatic drop in HR and BP, accompanied by pale mucous membranes and a prolonged CRT. The patient in this plane is too deeply anesthetized and is in danger of respiratory and cardiac arrest.
Stage IV—Stage of Anesthetic Overdose
If anesthetic depth is increased past stage III, plane 4, the animal enters stage IV anesthesia. At this stage there is a cessation of respiration, which may be followed by circulatory collapse and death. Immediate resuscitation is necessary to save the patient’s life.
This system can be somewhat confusing, because not all anesthetic agents produce signs that fit into these classic stages and planes. Consequently, many authors now divide stage III into three planes called light, medium, and deep surgical anesthesia, with light surgical anesthesia indicating an inadequate depth, medium surgical anesthesia indicating the optimum depth for most procedures, and deep surgical anesthesia indicating an excessive depth. These levels correspond to the classic planes as follows: light roughly corresponds to stage III, plane 1; medium to stage III, plane 2 and early plane 3; and deep to stage III, later in plane 3, and plane 4.
Finding the Optimum Depth
So what is the optimum depth of anesthesia? This question has no easy answer, because what is “optimum” differs for every patient depending on the procedure it is undergoing and the interaction of a complex set of factors. The anesthetist may be guided in discovering an optimum depth for each patient, however, by seeing that the objectives of surgical anesthesia are fulfilled.
The objectives of surgical anesthesia are that the patient does not move, is not aware, does not feel pain, and has no memory of the procedure afterward. At the same time, the anesthetist must avoid excessive anesthetic depth, which will result in a dangerous depression of the cardiovascular and respiratory systems.
Studies in human patients suggest that with increasing depth of anesthesia, most patients lose memory of the procedure first, awareness during the procedure second, unconscious movement in response to a painful stimulus third, and an increase in BP, HR, or RR in response to a painful stimulus fourth. So although a patient that moves in response to a painful stimulus such as a surgical incision (in light surgical anesthesia) may or may not feel pain depending on the anesthetic depth, these studies support the assumption that a patient that does not move in response to a painful stimulus (in medium surgical anesthesia) is not aware, does not perceive pain, and will have no memory of the procedure afterward. Therefore a lack of unconscious movement is evidence of sufficient depth to fulfill the objectives of surgical anesthesia. Although a lack of increase in the HR, RR, or BP in response to a painful stimulus is further evidence that these objectives are fulfilled, some patients will have adverse cardiopulmonary effects that prevent this depth from being maintained. Thus some reflex increase in these vital signs is not uncommon, and is even expected when the patient is at optimal depth.
Maintaining the delicate balance required to fulfill the objectives of surgical anesthesia can be challenging. There are times in any procedure that even the experienced anesthetist will feel unsure. When in doubt, it is usually safer to err on the side of caution and to maintain the patient at the least depth required to fulfill the objectives. In any case, gauging anesthetic depth is a dynamic process that requires frequent reassessment with subsequent adjustments in the rate of anesthetic administration throughout the procedure.
DETERMINING WHETHER OR NOT THE PATIENT IS SAFE
Determining whether or not the patient is safe during any anesthetic procedure is accomplished primarily by assessing vital signs. Vital signs may be assessed either by physical means (i.e., touch, hearing, and vision) or through the use of various instrumentation and machines such as an electrocardiograph, BP monitor, capnograph, Doppler blood flow detector, or pulse oximeter. These vital signs can be grouped according to whether they reflect circulation (HR and heart rhythm, pulse strength, CRT, mucous membrane color, and BP); oxygenation (mucous membrane color, hemoglobin saturation, measurement of inspired oxygen, measurement of arterial blood oxygen [Pao2]; or ventilation (RR and respiratory depth, breath sounds, end-expired CO2 levels, arterial carbon dioxide [Paco2], and blood pH).
Although a competent technician can safely monitor most patients without the use of specialized instruments, the use of monitoring devices may be of significant benefit. Instruments offer continuous monitoring, whereas the technician in a busy veterinary practice is seldom able to sit with the patient constantly. Instruments also allow precise measurement of variables that are impossible to determine by observation alone, such as BP and the percent oxygen saturation of the hemoglobin.
On the other hand, monitoring instruments are subject to malfunction, failure, and artifacts and are not able to completely capture the full range of information that is required for safe and effective monitoring. No matter how sophisticated, expensive, convenient, or complex, instruments cannot replace a skilled and conscientious anesthetist.
This section describes indicators of circulation, oxygenation, and ventilation, including vital signs, and instruments that can be used to monitor the following variables: BP (Doppler blood flow detector, oscillometer, and transducer with arterial line), central venous pressure (CVP) (manometer), heart rhythm (electrocardiograph), HR (esophageal stethoscope), Pao2 and Paco2 (blood gases), oxygen saturation (pulse oximeter), and expired carbon dioxide (capnograph). Note that electrocardiographs, BP monitors, and pulse oximeters also measure HR, and the capnograph also measures RR.
Indicators of Circulation
The objective of the ACVA monitoring guidelines for circulation is “to ensure adequate circulatory function.” To meet this objective, the ACVA makes the following recommendations:
“Continuous awareness of heart rate and rhythm during anesthesia, along with gross assessment of peripheral perfusion (pulse quality, [mucous membrane] color and CRT) are mandatory. Arterial blood pressure and ECG should also be monitored. There may be some situations where these may be temporarily impractical, e.g., movement of an anesthetized patient to a different area of the hospital.”
Heart Rate
HR may be physically assessed by palpation of the apical pulse through the thoracic wall, palpation of a peripheral pulse, or auscultation with a stethoscope or with the assistance of an esophageal stethoscope, which is a device that amplifies the heart sounds. It may be measured mechanically with an electrocardiograph, a BP monitor (Doppler blood flow detector or oscillometric monitor), or an intraarterial line attached to a transducer. Most mechanical monitors generate an audible beep, flashing light, or other visual indicator to make each heartbeat detectable from a distance. Many also show a digital readout of the HR in beats per minute (bpm). Some monitors can be adjusted to sound an alarm when the HR moves above or below limits set by the anesthetist.
When assessing the HR with a stethoscope during anesthesia, be aware that the heartbeat can be harder to hear than when the patient is awake for two reasons: first, because of a decreased strength of contraction often associated with anesthesia, and second, because the heart will gravitate to the lowest aspect of the thoracic cavity, making the heartbeat hard to hear if the stethoscope is placed in the customary locations. For instance, if the patient is in dorsal recumbency, as are many anesthetized patients, the heartbeat is often difficult to hear at all through the chest wall, especially in cats or obese patients. If the patient is lying in lateral recumbency, the heartbeat can generally be heard but is often audible only on the dependent side because of the effect of gravity on the position of the heart.
HRs are typically decreased in anesthetized animals owing to the depressant effect of most anesthetics. Alpha2-agonists and opioids are particularly likely to cause bradycardia. Some drugs (e.g., anticholinergics, cyclohexamines) have the opposite effect and can elevate HRs. The minimum acceptable, maximum acceptable, and typical HRs for anesthetized patients are listed in Table 5-2. Bradycardia is commonly caused by excessive anesthetic depth or adverse effects of drugs, and common causes of tachycardia are inadequate anesthetic depth, pain during light surgical anesthesia, hypotension, blood loss, shock, hypoxemia, and hypercapnia.
TABLE 5-2
Normal Vital Signs during Anesthesia
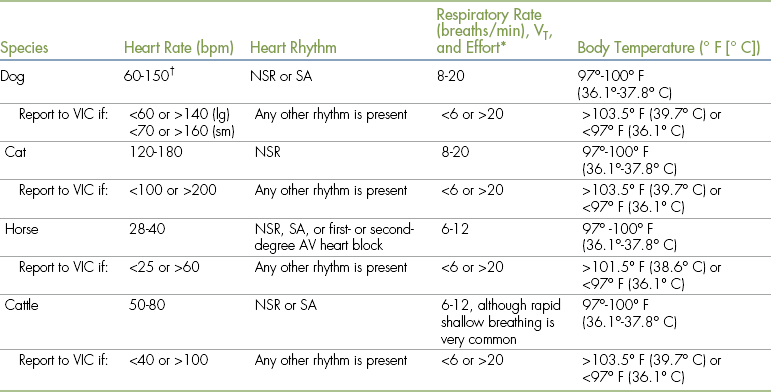
AV, Atrioventricular; lg, large; NSR, normal sinus rhythm; SA, sinus arrhythmia; sm, small; VIC, veterinarian-in-charge; VT, tidal volume.
∗Respiratory effort should be normal, and VT is typically decreased approximately 25%. Any increase in effort or >25% decrease in VT should be reported to the VIC.
†Owing to the extreme variability of size, large dogs tend to have lower rates, whereas small dogs and puppies have higher rates.
Heart Rhythm
The heart rhythm is assessed along with the HR. During anesthesia, normal sinus rhythm (NSR) is the most common rhythm in normal dogs, cats, and other small animals. Some normal dogs, however, especially if young and fit, have an SA that can at times be quite pronounced and that can easily be mistaken for a cardiac arrhythmia. The anesthetist can usually differentiate SA from an abnormal rhythm by looking for the cyclic decrease in rate during expiration and increase in rate during inspiration characteristic of SA. Large animals typically have an NSR but may also have an SA. First- or second-degree block is also considered to be normal in the athletic horse, provided that when the patient is conscious the rhythm returns to SA or NSR after gentle exercise or stimulation.
The anesthetist can generally develop a high degree of suspicion of a cardiac arrhythmia by its irregular sound, but some, such as first-degree heart block, defy detection this way. The only certain way to absolutely identify this and other abnormal rhythms is by using an electrocardiographic monitor, which reveals the electrical activity of the heart. Cardiac arrhythmias are not uncommon during anesthesia and are commonly caused by anticholinergics, alpha2-agonists, barbiturates, and cyclohexamines, but they are also caused by a number of states and disease conditions including hypoxia, hypercarbia, heart disease, trauma, and gastric dilatation–volvulus. Disturbances in cardiac rhythm should always be brought to the attention of the veterinarian for assessment because benign arrhythmias can quickly degenerate into dangerous rhythms if not recognized and managed.
TECHNICIAN NOTE
Disturbances in cardiac rhythm should always be brought to the attention of the veterinarian for assessment because benign arrhythmias can quickly degenerate into dangerous rhythms if not recognized and managed.
Instruments used to Monitor Heart Rate and Rhythm:
Esophageal stethoscope: An esophageal stethoscope (Figure 5-2) permits auscultation of the heart from a distance even when the patient’s chest is covered with surgical drapes and conventional auscultation is difficult. The esophageal stethoscope consists of a thin, flexible catheter attached to an audio monitor that electronically amplifies the heart sounds. The catheters come in various sizes (small, medium, and large) to fit small animal patients of varying sizes. There are multiple holes near the patient end, which is covered with a plastic sheath. The opposite end has a hole that fits into a sensor, which in turn transfers the heart sounds to the monitor. A conventional stethoscope tube can also be attached to the catheter as an alternative.
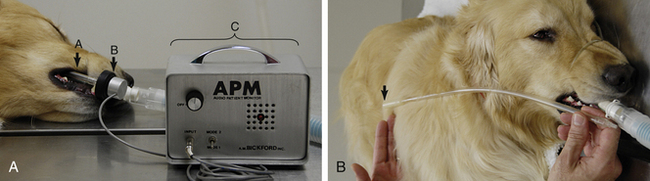
FIGURE 5-2 A, Esophageal stethoscope—a, catheter; b, sensor; c, base unit. B, Measurement of the catheter to the level of the fifth rib or the caudal border of the scapula (arrow).
For an esophageal stethoscope to be used, the catheter tube is lubricated with a small amount of water or lubricating jelly and the patient end is inserted through the oral cavity into the patient’s esophagus to about the level of the fifth rib. The position of the catheter is changed a little at a time, and the volume on the monitor is adjusted until the heartbeat is audible. Although it does not give quantitative information, this relatively simple, reliable, and inexpensive instrument allows the anesthetist or surgeon to easily hear the heart sounds anywhere in the surgical suite.
Esophageal stethoscopes require relatively little maintenance. Catheters must be cleaned with chlorhexidine or other disinfectant after each use. When cleansing, do not immerse the catheter or allow water to enter the hole in the end of the catheter. Some audio monitors use nonrechargeable batteries, which periodically must be changed.
Electrocardiography: Cardiac arrhythmias occur commonly in anesthetized animals. The term cardiac arrhythmia (also known as cardiac dysrhythmia) may be defined as any pattern of cardiac electrical activity that differs from that of the healthy awake animal. Arrhythmias vary in significance from innocuous to life-threatening depending on the cause and the patient’s general condition. Therefore the anesthetist must assess the patient’s heart rhythm at many points during any anesthetic procedure to keep the patient safe.
Only a veterinarian can make an electrocardiographic diagnosis, but as a monitor the technician must be able to differentiate normal from abnormal, and dangerous from nondangerous rhythms. Although an alert anesthetist may strongly suspect an arrhythmia based on careful auscultation and palpation of the pulse, electrocardiography is the only monitoring tool that allows definitive identification of the heart rhythm. Electrocardiography not only is used to monitor anesthetized animals, but is also used to guide treatment of cardiac arrest (see p. 341 in Chapter 12).
The normal electrocardiographic tracing (electrocardiogram [ECG]) is a graphic representation of the electrical activity of the heart as it travels through the cardiac conduction system (Figure 5-3) and heart muscle. The wave of electrical activity starts in the sinoatrial node and travels through the internodal tracts, causing atrial contraction. Next it is conducted to the atrioventricular (AV) node, where it briefly slows down to allow the ventricles to fill with blood. It then travels to the ventricles via the bundle of His, bundle branches, and Purkinje fibers, causing ventricular contraction. Although the precise appearance of the ECG varies according to the lead, the patient position, the species, and other factors, it always has the same general pattern of waveforms, intervals, and segments (Figure 5-4). Box 5-1 reviews electrode placement for both small animal and large animal patients.
BOX 5-1 Standard Electrode Placement for Electrocardiography
Small Animals (Figure 1)
Large Animals (Figure 2)
• Obtain ECG before anesthesia with the patient in a standing position, as long as the patient is cooperative.
• If monitoring for patients undergoing procedures, position does not matter.
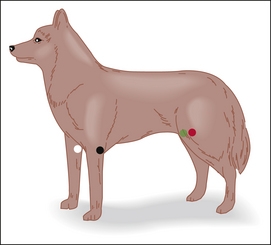
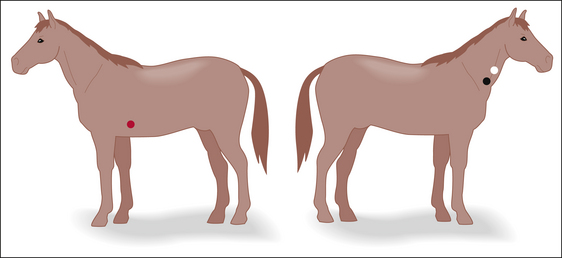
FIGURE 2
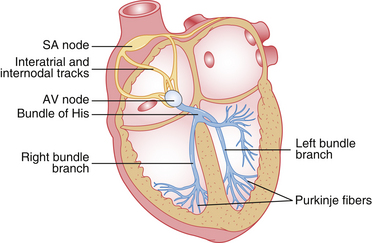
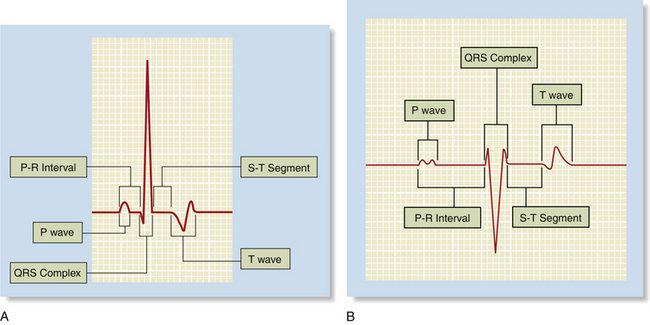
FIGURE 5-4 Appearance of the normal waveforms, intervals, and segments in A, the dog and B, the horse.
TECHNICIAN NOTE
Only a veterinarian can make an electrocardiographic diagnosis, but as a monitor the technician must be able to differentiate normal from abnormal, and dangerous from nondangerous rhythms.
The P wave, the first waveform, represents contraction of the atria. It is normally small, rounded, and positive and is often “double-humped” (also known as bifid) in adult large animals. It is separated from the QRS complex by the PR interval, which represents the time required for the impulse to move from the sinoatrial node to the Purkinje fibers. In normal patients, the PR interval must be within a range of 0.6 to 0.13 seconds in a dog, 0.05 to 0.09 seconds in a cat, and 0.22 to 0.56 seconds in a horse (see Figure 5-4). The QRS complex represents contraction of the ventricles and follows the PR interval. It is the largest waveform, is pointed (peaked), and is primarily positive in small animals when lead II is used and negative in large animals when the base apex lead is used. The T wave, which follows the QRS complex, represents repolarization of the ventricles in preparation for the next contraction. It is variable in appearance but is normally no more than one fourth the size of the QRS complex.
Although detailed interpretation of ECGs is complex and beyond the scope of this text, the anesthetist should be familiar with the following rhythms, which are commonly encountered in anesthetized patients.
• Normal sinus rhythm. NSR is a regular rhythm in which the HR is normal and the distance between each heartbeat (each QRS complex) is approximately equal (Figure 5-5). NSR is normal in anesthetized dogs, cats, horses, and cattle.
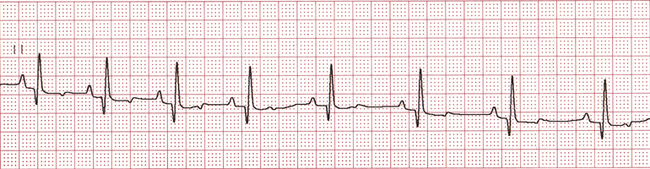
• Sinus arrhythmia. SA is a cyclic change in the HR coordinated with respirations, in which the HR decreases (recognized by an increased distance between QRS complexes) during expiration and increases (recognized by a decreased distance between QRS complexes) during inspiration (Figure 5-6). SA is normal in dogs, especially if young and healthy, is normal in horses and cattle, but is not normal in cats.
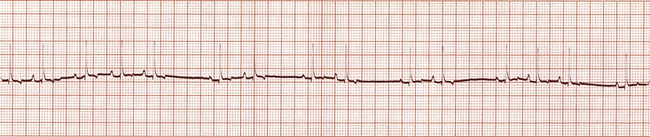
FIGURE 5-6 Sinus arrhythmia (dog—lead II; 25 mm/sec; 1 cm/mV). Note the regular acceleration and slowing of the heart rate. This waxing and waning correlate with breathing.
• Sinus bradycardia. Sinus bradycardia (an abnormally slow HR) is common during anesthesia and has a variety of causes including excessive anesthetic depth and drug reactions (see Chapter 12, p. 337). Treatment, if necessary, may include administration of appropriate reversal agents or anticholinergics.
• Sinus tachycardia. Sinus tachycardia (an abnormally fast HR) is less common than bradycardia during anesthesia. It has a variety of causes including inadequate anesthetic depth, drug reactions, and surgical stimulation (see Chapter12, p. 336). Treatment depends on the underlying cause.
• AV heart block. AV heart block involves a delay or interruption in conduction of the electrical impulse through the AV node. There are three types (first-degree, second-degree, and third-degree), which vary in appearance, but all involve a change in the relationship between the P wave and QRS complex (in other words, a changed PR interval).
• First-degree AV block is recognized by a prolonged PR interval (Figure 5-7). It is often abnormal but is seen in normal resting horses.
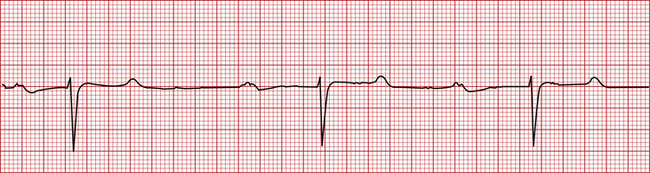
FIGURE 5-7 First-degree atrioventricular heart block (horse—base apex lead; 25 mm/sec; 1 cm/mV). This tracing was recorded at 25 mm/sec. Therefore each box = 0.04 seconds. Note the wide PR interval at approximately 0.72 seconds (normal 0.22 to 0.56 seconds).
• Second-degree AV block appears as occasional missing QRS complexes. In other words, not all P waves are followed by QRS complexes (Figure 5-8). Like first-degree AV block, it is often abnormal but is also seen in normal resting horses as long as no more than one beat is skipped in a row, and it resolves with exercise or stimulation. It decreases cardiac output but may or may not require treatment, depending on how severe it is. Both first- and second-degree AV heart block are commonly seen after the administration of alpha2-agonists such as dexmedetomidine. Other causes include high vagal tone, hyperkalemia, and cardiac disease.
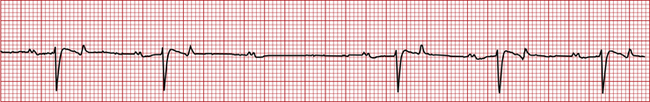
FIGURE 5-8 Second-degree AV heart block (horse—base apex lead; 25 mm/sec; 1 cm/mV). Note that there is a missing QRS complex after the third P wave from the left.
• Third-degree AV block is an abnormal rhythm in which the atrial and ventricular contractions occur independently. It is recognized by a complete loss of the normal relationship between the P waves and QRS complexes and is characterized by randomly irregular PR intervals (Figure 5-9). This rhythm indicates cardiac disease and is infrequently seen in anesthetized patients, but when present, decreases cardiac output and requires treatment.
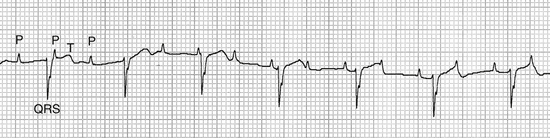
FIGURE 5-9 Third-degree AV heart block (cat—25 mm/sec; 1 cm/mV). Note that the P waves are regular and are occurring independently of the QRS complexes. (From Bonagura JD, Twedt DC: Kirk’s current veterinary therapy XIV, St Louis, 2009, Elsevier.)
• Premature complexes. A premature complex is one that occurs too early. If the premature complex is associated with a heartbeat or pulse it may be referred to as a premature contraction.
• Supraventricular premature complexes (SPCs) appear as one or more normal QRS complexes that closely follow the previous QRS, interrupting an otherwise regular rhythm (Figure 5-10). P waves may or may not be present, but if present are almost always different from normal P waves. Atrial premature complexes (APCs) are a specific type of SPC.
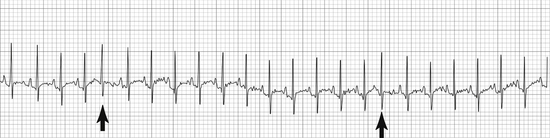
FIGURE 5-10 Supraventricular premature complexes (cat—25 mm/sec; 1 cm/mV). Note the early complexes with normal QRS morphology. (From Bonagura JD, Twedt DC: Kirk’s current veterinary therapy XIV, St Louis, 2009, Elsevier.)
• Supraventricular tachycardia (Figure 5-11) is a series of three or more SPCs in a row. SPCs are abnormal but may or may not require treatment, depending on the frequency.
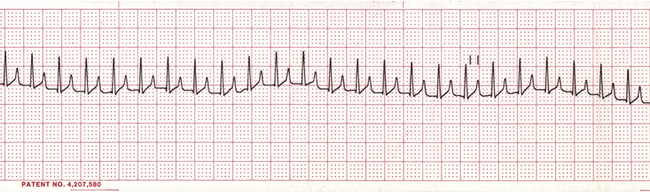
FIGURE 5-11 Supraventricular tachycardia (dog—lead II; 25 mm/sec; 1 cm/mV). Note the very rapid heart rate with normal QRS complexes. P waves are superimposed over the T waves and so are not easily visualized.
• Ventricular premature complexes (VPCs) appear as one or more wide and bizarre QRS complexes that closely follow the previous QRS, interrupting an otherwise regular rhythm (Figure 5-12). So like SPCs they are early, but unlike SPCs they appear different from normal QRS complexes. Isolated VPCs are commonly seen in anesthetized animals. They have a variety of causes including heart disease, drugs, hypoxia, and acid-base or electrolyte disorders. Epinephrine release in fearful patients is also a potent stimulus of VPCs. This is one reason why it is unwise to forcibly restrain a struggling animal during induction, as release of epinephrine may potentiate severe and even fatal arrhythmias (particularly in patients given arrhythmogenic agents). VPCs may or may not require treatment, depending on the frequency.
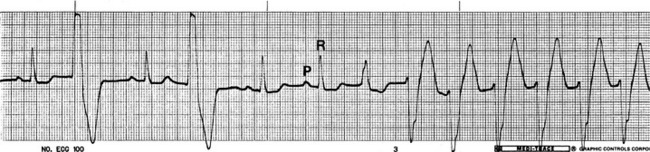
FIGURE 5-12 Ventricular premature complexes (dog—lead II; 50 mm/sec; 1 cm/mV). Note the early wide, bizarre QRS complexes, second and fourth from the left (ventricular premature complexes [VPCs]), and the last six complexes (which represent an episode of ventricular tachycardia). (From Birchard SJ, Sherding RG: Saunders manual of small animal practice, ed 3, St Louis, 2006, Elsevier.)
• Ventricular tachycardia (Figure 5-13) is a series of three or more VPCs in a row. It is a dangerous rhythm that significantly compromises cardiac output and requires intervention. Intravenous (IV) lidocaine is the most common treatment for severe VPCs.
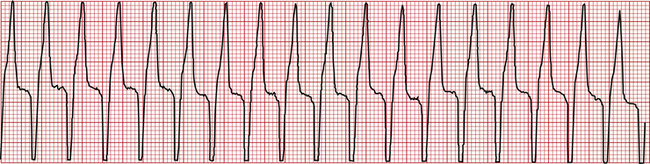
FIGURE 5-13 Ventricular tachycardia (dog—lead II; 25 mm/sec; 1.6 cm/mV). This is a series of wide, bizarre QRS complexes followed by T waves.
• Fibrillation. Fibrillation is the chaotic, uncoordinated contraction of small muscle bundles within the atria or ventricles that appears as an undulating baseline with or without QRS complexes.
• Atrial fibrillation appears as fine undulations of the baseline (often referred to as f waves), an absence of P waves, a high HR, and normal QRS complexes with irregular intervals between them (Figure 5-14). This rhythm, which is usually caused by heart disease, decreases cardiac output and requires treatment.
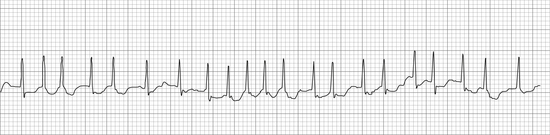
FIGURE 5-14 Atrial fibrillation (cat—25 mm/sec; 1 cm/mV). Note the absence of P waves, the undulating baseline (f waves), and the irregular ventricular rate. (From Bonagura JD, Twedt DC: Kirk’s current veterinary therapy XIV, St Louis, 2009, Elsevier.)
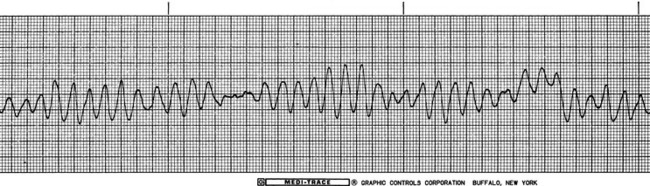
• Ventricular fibrillation appears as an irregular undulating baseline, with complete absence of recognizable QRS complexes (Figure 5-15). Ventricular fibrillation is associated with cardiac arrest and requires emergency treatment.
A change in the configuration of the QRS complex or T wave over time indicates hypoxia of the cardiac muscle, is dangerous, and requires immediate intervention.
Pulseless electrical activity (PEA) is the cessation of heart contractions and/or palpable pulses in the presence of a normal or nearly normal ECG and is associated with cardiac arrest. As the ECG is not a sure indicator of mechanical activity of the heart, electrocardiographic monitoring must always be accompanied by physical monitoring of the heartbeat, apical pulse, and arterial pulses.
Capillary Refill Time
The CRT is the rate of return of color to oral mucous membranes after the application of gentle digital pressure (Figure 5-16) and is indicative of the perfusion of the peripheral tissues with blood. The pressure applied to the mucous membranes compresses the small capillaries and temporarily blocks blood flow to that area. When the pressure is released, the capillaries rapidly refill with blood and the color returns, provided perfusion is adequate. Normal capillary refill is not always a reliable indicator of adequate circulation, however (e.g., CRT may appear normal shortly after euthanasia in some animals).
FIGURE 5-16 Capillary refill time. A, Application of digital pressure. B, Blanching of the mucous membranes. C, Return of color, which in a normal patient should occur in 2 seconds or less.
A prolonged CRT (greater than 2 seconds) indicates that tissues in the area tested have reduced blood perfusion. This may be a result of vasoconstriction caused by epinephrine release. Poor perfusion may also be a result of low BP caused by anesthetic drugs (including acepromazine, alpha2-agonists, propofol, and inhalation agents), hypothermia, cardiac failure, excessive anesthetic depth, blood loss, or shock. Poor perfusion will also result in reduced temperature of the affected part.
Blood Pressure
BP is the force exerted by flowing blood on arterial walls. This monitoring parameter is used during anesthesia to evaluate tissue perfusion. BP is determined by complex interactions among HR, stroke volume (the volume of blood ejected by the heart on each beat), vascular resistance (the diameter of the vessels), arterial compliance (elasticity), and blood volume. Therefore it is altered by anything that affects these factors, including drugs, disease, surgical stimulation, and hydration status.
Normal BP varies throughout the cardiac cycle as the ventricles contract and relax. Systolic blood pressure is produced by the contraction of the left ventricle as it propels blood through the systemic arteries. Diastolic blood pressure is the pressure that remains in the arteries when the heart is in its resting phase, between contractions. Mean arterial pressure (MAP) is the average pressure through the cardiac cycle and is the most important value from the anesthetist’s standpoint because it is the best indicator of blood perfusion of the internal organs. MAP is automatically calculated by some instruments or can be mathematically calculated as follows:

TECHNICIAN NOTE
MAP is the average pressure through the cardiac cycle and is the most important value from the anesthetist’s standpoint because it is the best indicator of blood perfusion of the internal organs.
All BP monitoring instruments are able to measure systolic BP, and some are able to measure diastolic pressure and MAP as well (transducers and oscillometric BP monitors). Because BP can be difficult to measure accurately, changes rapidly, and is subject to many influences, it is best to monitor trends rather than a single value. BP that is below normal limits is called hypotension, and BP that is above normal limits is termed hypertension. BP may be decreased by anything that decreases HR, stroke volume, vascular resistance, or blood volume and increased by anything that increases these parameters. Box 5-2 lists common causes of hypotension in anesthetized patients. Because of the complexity of the interactions among these parameters, interpretation of the significance of BP changes is not always straightforward. For example, under normal circumstances, the body compensates for MAP values between 60 and 150 mm Hg by changing vascular resistance to maintain blood flow. So the MAP can fall to as low as 60 mm Hg without a significant change in tissue perfusion. In contrast, in situations when vascular resistance is high and cardiac output is low, BP may remain normal even though perfusion is poor. So under normal circumstances, in an awake animal, BP does not always reflect tissue perfusion.
During anesthesia, however, BP is a good indicator of tissue perfusion. This is because when inhalant anesthetics are used, the body’s ability to compensate decreases as anesthetic depth increases, so that tissue perfusion is essentially directly determined by MAP. If MAP falls below 60 mm Hg, blood flow to internal organs is reduced, and tissues may become hypoxic. The kidneys are particularly sensitive to reduced perfusion and can fail postoperatively if the MAP is inadequate during anesthesia. This risk is increased by preexisting disease and by some drugs including nonsteroidal antiinflammatory drugs (NSAIDs). In horses, a MAP below 70 mm Hg decreases blood flow to the muscle, predisposing the patient to postanesthetic myopathy.
TECHNICIAN NOTE
During anesthesia MAP is a good indicator of tissue perfusion. If MAP falls below 60 mm Hg, blood flow to internal organs is reduced, and tissues may become hypoxic. Every effort should be made to maintain a MAP of 60 mm Hg or greater in small animals and ruminants, and 70 mm Hg or greater in horses.
Hypotension is common during anesthesia because most anesthetic drugs, with the exception of dissociatives, decrease BP, and because many common complications of anesthesia and surgery, including blood loss, also decrease it. Although a modest drop in BP is acceptable during anesthesia, every effort should be made to maintain a MAP of 60 mm Hg or greater (70 mm Hg or greater in horses). Changes in BP over the course of an anesthetic procedure give the anesthetist valuable information that can be used to warn of situations that may endanger the patient, including excessive blood loss, excessive anesthetic depth, decreased heart function, or changes in blood vessel tone. BP lower than minimum safe levels signals the need for intervention to support perfusion of vital tissues. Box 5-3 lists strategies to prevent hypotension.
Pulse Strength: Pulse strength is a physical parameter that can be used as a rough indicator of BP. It is assessed by palpating a peripheral artery in one of several locations. Peripheral arteries appropriate to assess pulse strength include the lingual (dogs only), (Figure 5-17, A) dorsal pedal (Figure 5-17, C), femoral (small animals and small ruminants only) (Figure 5-17, B), carotid, facial (horses only), and aural (large animals only). A normal pulse should be strong and should occur shortly after each apical beat or S1 heart sound. During anesthesia in most cases the pulse strength naturally decreases, but the pulse should still be palpable during all stages.
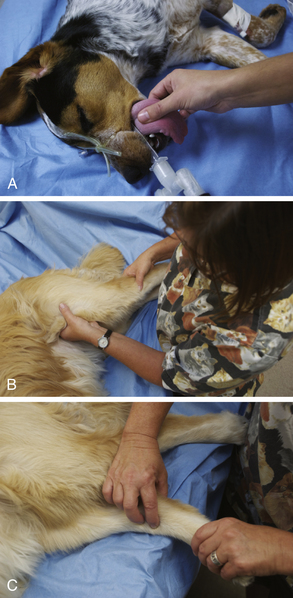
FIGURE 5-17 Assessment of pulse strength. A, Lingual artery (dog). Place the forefinger firmly but gently over the ventral aspect of the midline of the tongue. B, Femoral artery (dog). Cup the hand under the thigh from a cranial approach. Place the forefinger or second finger firmly but gently over the caudomedial aspect of the proximal femur. C, Dorsal pedal artery (dog). Place the forefinger over the dorsomedial aspect of the tarsus.
Caution must be used when interpreting pulse strength because interpretation is subjective and normal pulse strength among healthy animals varies widely. Also, pulse strength does not always correlate well with BP because pulse strength is determined by the difference between systolic and diastolic BP, vessel diameter, and other factors that do not always correlate with MAP or with tissue perfusion.
For example, the pressure difference between a systolic BP of 100 mm Hg and a diastolic pressure of 30 mm Hg is 70 mm Hg. This relatively large difference will produce a strong pulse that will be subjectively interpreted as normal, even though the MAP in this patient is approximately 55 mm Hg, which is inadequate. In contrast, the pressure difference between a systolic pressure of 100 mm Hg and a diastolic pressure of 70 mm Hg is 30 mm Hg, which will feel weak and will be interpreted as indicative of hypotension even though the MAP is about 80 mm Hg, which is within the normal range.
Despite these inaccuracies, by comparing pulse strength during the preanesthetic period with the pulse strength throughout the anesthetic period, many relative changes in BP can be detected that may indicate a problem and require further assessment by instrumentation.
Instruments Used to Monitor Blood Pressure: There are two general types of BP monitors; direct and indirect. When BP is monitored directly, the reading is obtained by means of a catheter inserted into an artery and attached to a pressure transducer (sensor) and monitor. In the case of indirect BP monitoring, the reading is obtained by using an external sensor and cuff.
Direct BP monitoring is infrequently performed in small animal veterinary practice but is used commonly in equine practice and in research and referral institutions. An indwelling catheter is placed in the femoral or dorsal pedal artery (small animals) or the facial or auricular arteries (large animals) by means of a surgical cutdown or percutaneous insertion technique. The catheter is connected by a length of fluid-filled tubing to a manometer or pressure transducer, which displays the pressure as directly measured from within the artery. Direct BP monitoring gives the anesthetist a continuous reading of the BP throughout the cardiac cycle and is more accurate than indirect methods. More detail concerning direct BP monitoring may be found in Chapter 9. In general practice, BP is more commonly determined by indirect methods, which are noninvasive and technically less demanding than direct monitoring. There are two basic types of indirect methods (Doppler and oscillometric), both of which use a cuff to sequentially occlude and release blood flow in a major artery of a limb or the tail. These systems differ in the way the pressure is measured.
TECHNICIAN NOTE
In general practice, indirect monitors are most commonly used to measure BP. There are two basic types of indirect monitors (Doppler and oscillometric), both of which use a cuff to sequentially occlude and release blood flow in a major artery of a limb or the tail. These systems differ in the way the pressure is measured.
The photoplethysmograph is another method used to provide indirect BP measurements. This method uses infrared light to measure changes in volume caused by pulse pressure. This instrument, designed for humans, is not in common use in veterinary patients but may be especially useful for dogs and cats weighing less than 10 kg. It creates a continuous waveform tracing in real time, and so is able to display systolic, diastolic, and mean pressures.
In human patients BP is routinely determined by using a stethoscope to listen for blood flow in a peripheral artery, as a cuff is sequentially inflated until flow stops, and deflated until the flow resumes. As the cuff is slowly deflated, the point at which flow is first audible (because of turbulent blood flow through a partially occluded artery) represents the systolic BP, and the point at which it is no longer audible (because of restoration of normal flow) represents the diastolic pressure. This method is not practical in domestic animals because arterial flow is not audible with a stethoscope.
Doppler blood flow detector: The Doppler blood flow detector is a monitoring device that consists of an ultrasonic probe and an electronic monitor. The Doppler probe contains a crystal that emits ultrasound frequency waves and another crystal that receives the returning echoes. Outgoing waves bounce off red blood cells (RBCs) traveling inside a pulsating artery and return to the probe, where they are sent to an electronic monitor for processing. The monitor converts the returning echoes into a “whooshing” sound audible to the attendant via a speaker or earphones. The frequency (or pitch) of the sound changes in proportion to the velocity of the RBCs, and the intensity changes in proportion to the number of RBCs detected. This device can be used to continuously monitor HR and heart rhythm or can be used with a conventional cuff and sphygmomanometer to determine the systolic BP. Diastolic pressure and MAP cannot be measured by most Doppler systems.
Use and operation: Choose a location to place the probe over a peripheral artery. In small animal patients, the ventral surface of a paw just proximal to the metacarpal or metatarsal pad (over the median palmar or median plantar artery), the dorsomedial surface of the tarsus (over the dorsal pedal artery), the ventral surface of the tail base (over the coccygeal artery), or over the medial surface of the thigh in patients weighing under 5 kg (over the femoral artery) are all possible locations. In large animal patients the ventral tail is the most frequently used site. Figure 5-18 shows common locations for placement of the probe.
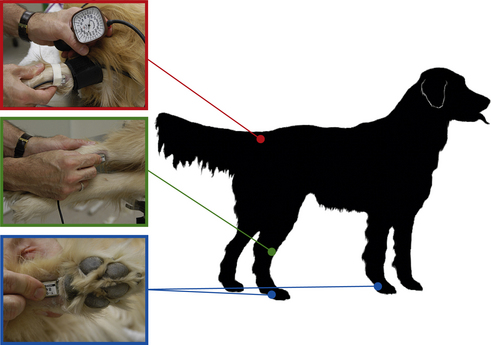
FIGURE 5-18 Locations for Doppler probe placement. Red, Determination of systolic blood pressure by use of a sphygmomanometer with the cuff placed around the tail base and the probe placed on the ventral surface of the tail distal to the cuff. Green, Probe over the dorsomedial surface of the hock. Blue, Probe proximal to the metatarsal pad or metacarpal pad.
After choosing the location, clip a 1- to 2-cm square patch of hair over the artery, gently cleanse the skin, and apply a generous amount of ultrasonic gel. Avoid lubricating jelly and gels containing electrolytic substances such as those used for electrocardiographic leads. The concave surface of the probe must be oriented parallel to and precisely over the artery and must make firm but not excessive contact. Acquiring a good signal requires very fine changes in position of the probe, sometimes of only a millimeter or two. This can be a challenge, so the technician must be prepared to persevere until an audible signal is found. Once a signal has been found, the probe can be manually held in place by the technician if it is going to be used for only a short time (Figure 5-19), but if it is to be used as a heart monitor for the duration of an entire procedure, it may be carefully taped in place.
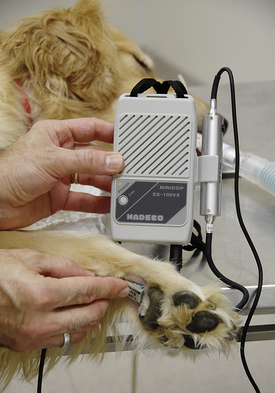
FIGURE 5-19 Doppler monitor base unit with the probe positioned over the ventral surface of the metacarpus proximal to the metacarpal pad.
Doppler probes are expensive and can easily be damaged. They must therefore be handled gingerly. After use, clean the probe by wiping it gently with a gauze sponge. Gentle cleaning with tap water is acceptable, but the probe must not be immersed, scrubbed, or autoclaved. It should be stored in a protective case.
Determining the blood pressure: When used with a cuff and sphygmomanometer, the Doppler monitor can be used to determine BP (see Figure 5-18). A sphygmomanometer is an instrument, much like the pressure manometer on an anesthetic machine, which measures pressure within a cuff. The principle by which this system operates is as follows: When the cuff is inflated with a rubber bulb, an artery lying beneath the cuff is compressed. When the cuff pressure exceeds the systolic BP, blood flow through the artery stops and the sound is no longer audible. When the cuff pressure is slowly released, blood flow resumes and is again audible when the cuff pressure equals the systolic BP.
TECHNICIAN NOTE
When the BP is measured, the width of the cuff should be 30% to 50% of the circumference of the extremity, and the cuff should be placed firmly but not too tightly over a peripheral artery. The cuff should be wrapped slightly more tightly in large animals than in small animals and should ideally be at the same horizontal plane as the heart.
To determine the systolic pressure, fit a cuff to the extremity. The width of the cuff should be 30% to 50% of the circumference of the extremity (Figure 5-20, inset). Place the cuff firmly, but not too tightly, proximal to the site where the probe is positioned. The cuff should be wrapped slightly more tightly in large animals than in small animals and should ideally be at the same horizontal plane as the heart (the level of the sternum when in lateral recumbency or the shoulder when in dorsal recumbency). All cuffs contain a balloon inside that inflates as the cuff is pressurized. Some cuffs require that the balloon be centered over the artery, but others do not, as specified in the manufacturer’s equipment manual. After establishing a good Doppler signal, use the bulb to inflate the cuff until the signal can no longer be heard. While reading the manometer, gradually decrease the pressure until the pulsing signal first returns. This represents the systolic pressure. Diastolic pressure is the pressure indicated just before the sound becomes continuous, but is difficult to determine reliably with this instrument. Procedure 5-1 (p 180) describes the technique for measuring BP with a Doppler device.
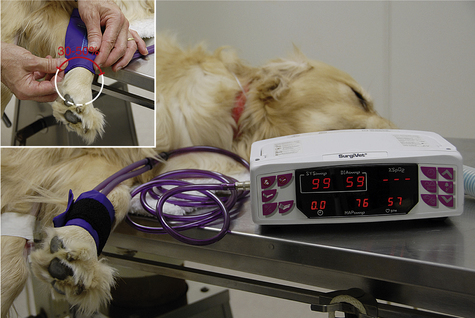
FIGURE 5-20 Oscillometric blood pressure (BP) monitor with a cuff placed on the metacarpus. The following measurements are indicated: systolic BP, 99 mm Hg; diastolic BP, 59 mm Hg; mean arterial pressure (MAP), 76 mm Hg; heart rate 57 bpm. Inset, Selecting an appropriately sized blood pressure cuff, the width of which should be 30% to 50% of the circumference of the extremity.
Specific locations in which adequate superficial arteries are located include the medial aspect of the proximal forelimb (radial artery), over the palmar aspect of the metacarpus (median palmar artery—Figure 5-21, blue), proximal to the tarsus over the dorsomedial aspect of the limb (cranial tibial artery), below the tarsus over the dorsomedial aspect of the limb (dorsal pedal artery—Figure 5-21, green), and over the ventral aspect of the tail base (coccygeal artery—Figure 5-21, red).
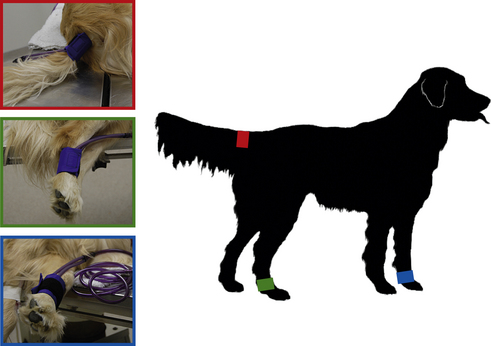
FIGURE 5-21 Locations for placement of a blood pressure cuff. Red—base of the tail. Green—metatarsus. Blue—metacarpus.
Doppler systems are accurate over a wide range of pressures and are the preferred instrument for cats and small dogs. They are labor-intensive instruments, however, because there is no automatic readout, and like most instruments they are subject to various unique technical problems and artifacts, including the following:
• Doppler monitors underestimate the systolic BP in cats by about 15 mm Hg but are fairly accurate in dogs and large animals. Therefore when taking a cat’s BP, add 15 mm Hg to the pressure indicated on the manometer.
• Values are affected by patient position in relationship to the probe and blood flow to the extremity and can be altered by ropes used to tie the patient to the table as well as many other factors. Therefore several readings should be taken and averaged.
• The signal is difficult to maintain over time and is commonly lost if the patient is moved, the patient is shivering, the probe shifts, or the contact pressure is not exactly right.
• Finding the right location and tightness for the cuff can be challenging and requires experience.
• The use of a cuff that is too narrow will give falsely high readings, and a cuff that is too wide will give falsely low readings.
Oscillometric blood pressure monitors: An oscillometric BP monitor (oscillometer) consists of a cuff with an internal pressure-sensing bladder, connected to a computerized monitor (see Figure 5-20). The machine inflates and deflates the cuff, and the computer measures the oscillations in intracuff pressure caused by the subtle volume changes of the extremity resulting from pulsations of the artery beneath the cuff. It then calculates the systolic, mean, and diastolic pressures, and the HR from the pressure changes.
Oscillometers are more expensive than Doppler devices but offer two significant advantages: they work automatically, and they determine the diastolic pressure and MAP in addition to systolic pressure.
Use and operation: The cuff is selected in the same way, and placed in the same locations, as a Doppler cuff. Currently available machines are technologically sophisticated and will automatically inflate the cuff at preprogrammed intervals (such as every 5 minutes) or on demand (when a button is pushed). Alarm limits can be programmed for any of the parameters, and the computer often can store or print patient data. These machines contain rechargeable batteries and require very little maintenance other than cleansing and periodic recharging.
As with Doppler detectors, oscillometers are subject to artifacts and technical problems, as follows:
• These instruments are relatively accurate in animals weighing over 7 kg in body weight but may have difficulty detecting pulsations in cats and other animals with small superficial arteries.
• They tend to underestimate high pressures and overestimate low pressures.
• They are also inaccurate in animals with significant hypotension, arrhythmias, or fast HRs.
• Systolic pressures measured by these instruments are generally 10 to 15 mm Hg lower than those obtained by direct BP monitoring in dogs.
• The instrument may not work if the patient moves, if the patient is shivering, or if the cuff slips.
• If the cuff is too loose the machine may be unable to measure the pressure. If too tight, the values will be inaccurate.
Central Venous Pressure: CVP is the BP in a large central vein such as the anterior vena cava. This value allows the veterinarian to assess blood return to the heart and heart function. This value is especially helpful in monitoring animals for right-sided heart failure because it can detect the increased pressure in the vena cava that results from this condition. It is also useful in preventing overhydration in animals receiving IV fluids, because CVP values rise when blood volume is excessive.
CVP can be directly measured by inserting a long catheter percutaneously into the jugular vein or by cutting down into the jugular vein. The catheter is advanced into the anterior vena cava and toward the heart so that the tip of the catheter lies close to the right atrium. The catheter is connected to a water manometer to obtain a measurement. The manometer should be positioned so that “0” on the manometer is at the same horizontal plane as the right atrium (halfway between shoulder and sternum in sternally recumbent patients, level with the sternum in laterally recumbent patients, and level with the shoulder in dorsally recumbent patients). If the catheter is correctly positioned, the meniscus of the fluid in the manometer should rise and fall with each breath. Normal CVP in dogs and cats is less than 8 cm H2O. Pressures over 12 to 15 cm H2O (taken during exhalation) are considered elevated. As with arterial BP, it is usually more valuable to monitor trends over time rather than base an assessment on a single reading.
Indicators of Oxygenation
The objective of the ACVA monitoring guidelines for oxygenation is “to ensure adequate oxygenation of the patient’s arterial blood.” To meet this objective, the ACVA makes the following recommendation: “Assessment of oxygenation should be done whenever possible by pulse oximetry, with blood gas analysis being employed when necessary for more critically ill patients.”
Mucous Membrane Color
Mucous membrane color is most commonly assessed by observing the gingiva (see Figure 5-16, C). Normal mucous membrane color is sometimes referred to as “bubblegum pink,” although the color varies from patient to patient. For this reason, mucous membrane color should be assessed before each procedure so that the anesthetist knows what is normal for the patient and can use this as a point of comparison. This parameter gives the anesthetist a crude assessment of both oxygenation and tissue perfusion. In patients with pigmented gums, alternative sites may be used to assess mucous membrane color, including the tongue, the conjunctiva of the lower eyelid, or the mucous membrane lining the prepuce or vulva.
Pale mucous membranes indicate intraoperative blood loss, anemia from any cause, or poor capillary perfusion (as may occur with vasoconstriction, excessive anesthetic depth, or prolonged anesthesia). Cyanosis (purple or blue discoloration of the mucous membranes or skin) indicates very low blood oxygen concentration (a partial pressure [Pao2] of approximately 35 to 45 mm Hg) in patients with a normal packed cell volume (PCV). Some common causes of cyanosis are respiratory arrest, oxygen deprivation (such as when the oxygen tank is empty or the flow meters are inadvertently turned off), and severe pulmonary disease.
Mucous membrane color is not a reliable indicator of perfusion because many other factors affect it including body temperature, vascular resistance, and gum disease. It is a crude indicator of oxygenation for two reasons. First, in animals with a normal PCV the blood oxygen concentration is so low by the time cyanosis occurs that the situation is already a medical emergency. Second, there must be a minimum concentration of deoxygenated hemoglobin for cyanosis to occur. Consequently animals with severe anemia may not have enough hemoglobin to reach this threshold and may not become cyanotic even though tissues are hypoxic.
Before examination of the ways in which oxygen is measured, it is important to understand how oxygen is carried in the bloodstream.
Physiology of Oxygen Transport
As discussed previously, tissues must have adequate oxygen at all times to perform metabolic processes. This need is paramount in the brain and heart, which use the highest proportion of oxygen, and which will be damaged within seconds or minutes when oxygen levels are decreased. Consequently, assessment of blood oxygen levels is a critical component of patient monitoring.
The total oxygen content of the blood is carried in two forms: as free, unbound O2 molecules dissolved in plasma, and as oxygen that is chemically bound to the hemoglobin contained in RBCs. Each hemoglobin molecule has four oxygen binding sites, each of which can bind one molecule of O2. Thus each hemoglobin molecule can carry four oxygen molecules if all the binding sites are full. When all available binding sites are occupied with oxygen, the hemoglobin is said to be 100% saturated.
In healthy patients, dissolved oxygen in plasma represents a small amount of the total blood oxygen content, whereas bound oxygen represents the majority. For example, in a healthy animal breathing room air (with approximately 21% oxygen), the amount of oxygen dissolved in arterial blood is about 1.5% of the total content, and the remaining 98.5% is bound to hemoglobin. Thus the majority of oxygen necessary for normal cell function is carried by hemoglobin. That is why PCV is such an important determinant of oxygen available to the tissues.
Blood oxygen is measured in one of three ways.
1. Calculated oxygen content measures the total volume of oxygen in the blood, including both dissolved and bound forms, expressed in milliliters per deciliter (mL/dL). This system of measurement accurately measures total oxygen available to the tissues. Arterial oxygen content is calculated by using the following formula: Cao2 = (Hb × 1.39 × Sao2/100) + (Pao2 × 0.003), where Hb = hemoglobin in grams per deciliter (g/dL), Sao2 = oxygen saturation, and Pao2 = partial pressure of oxygen in arterial blood.
In a healthy animal breathing room air (with approximately 21% oxygen), with 15 g/dL of hemoglobin that is 100% saturated, each deciliter of arterial blood contains about 21.15 mL of oxygen (0.3 mL dissolved in plasma and 20.85 mL bound to hemoglobin). So in this situation oxygen availability is largely dependent on hemoglobin concentration and saturation. Therefore in nonanemic animals (with normal hemoglobin concentration), saturation alone gives the anesthetist a good estimate of oxygen available to the tissues. In contrast, a patient with anemia may have severely decreased oxygen availability even though saturation is normal.
2. Partial pressure of oxygen (Po2), measures the unbound O2 molecules dissolved in the plasma and is expressed in millimeters of mercury (mm Hg). Partial pressure differs depending on whether arterial, capillary, or venous blood is measured. Oxygen content is the highest after oxygen is picked up by blood in the lungs, decreases as it is consumed by the tissues, and is lowest as the blood travels back to the heart before reoxygenation in the lungs. Normal partial pressure of oxygen in arterial blood (Pao2) in an animal breathing room air is about 90 to 110 mm Hg (100 mm Hg for practical purposes). In contrast, the partial pressure of oxygen in venous blood (Pvo2) is about 40 mm Hg owing to extraction of the difference (60 mm Hg) by the tissues. Partial pressure represents only a small portion of the total amount of oxygen available to tissues (1.5%), because it does not measure bound oxygen at all.
3. Percent oxygen saturation (So2) measures the percentage of the total number of hemoglobin binding sites occupied by oxygen molecules. Like partial pressure, oxygen saturation varies depending on whether it is sampled in the arterial blood, capillary blood, or venous blood. Normal arterial oxygen saturation (Sao2) is 97% or above. Normal venous saturation (Svo2) is about 75%. Unlike partial pressure, percent oxygen saturation measures the majority of oxygen available to tissues (98.5%).
The Relationship between Partial Pressure and Oxygen Saturation: The partial pressure of oxygen in the plasma is dependent almost exclusively on the amount of oxygen in the alveoli and the health of the lungs. Decreased inspired oxygen or lung disease will decrease partial pressure. Partial pressure in turn influences saturation of the hemoglobin because there must be an adequate level of dissolved oxygen in the blood for binding to occur. Thus, partial pressure and oxygen saturation are directly related (when one goes up, the other does also). This relationship is relatively predictable in healthy patients, so knowing one allows the anesthetist to estimate the other.
However, this direct relationship between the two is not linear, but looks rather more like the first big hill on a roller coaster. This means that as the partial pressure decreases, the saturation decreases very slowly at first, but the decrease gradually accelerates. For example when a patient is breathing 100% oxygen, the Pao2 is about 500 mm Hg and hemoglobin is nearly 100% saturated (Box 5-4, Figure 1). When the Pao2 drops from 500 mm Hg to 100 mm Hg (a drop of 400 mm Hg), as for a patient breathing room air, saturation drops only from 100% to about 98% (Box 5-4, Figure 2). As Pao2 drops from 100 to 80 mm Hg (a drop of 20 mm Hg), the saturation decreases from 98% to 95% (Box 5-4, Figure 3). Below this point, the saturation drops more quickly. As Pao2 drops from 80 to 60 mm Hg (also a drop of 20 mm Hg), the saturation drops from 95% to 90% (Box 5-4, Figure 4). When Pao2 drops from 60 to 40 mm Hg (again, a drop of 20 mm Hg), the saturation drops much more quickly from 90% to 75% (Box 5-4, Figure 5). So in animals with normal hemoglobin, total oxygen available to the tissue decreases very little at partial pressures above 80 mm Hg (saturation above 95%), whereas total oxygen available to the tissues decreases much more rapidly below this level.
BOX 5-4 How to Read Oxygen Dissociation Curves
At the top of each figure is the oxygen dissociation curve, which illustrates the relationship between partial pressure of oxygen and oxygen saturation (with Po2 on the x-axis and So2 on the y-axis).
When the amount of dissolved oxygen (Po2) is above 100 mm Hg (after oxygenation in the lungs), nearly all (at least 98%) of the binding sites on the hemoglobin molecules are occupied. But as the blood reaches the systemic capillaries, oxygen diffuses into the tissues causing the Po2 to decrease. As the Po2 decreases, oxygen separates or “dissociates” from the hemoglobin to meet tissue needs.
The red rectangle represents a blood vessel containing dissolved O2 and O2 bound to hemoglobin. Each O2 floating in the plasma represents 10 mm Hg of dissolved, unbound oxygen, with the exception of figure 1 in which each O2 represents 20 mm Hg of dissolved, unbound oxygen. Each “leg” of an “H” represents 2.5% of the available binding sites. So the relative proportion of binding sites occupied represents the So2. Thus if all available site are occupied with O2, the So2 is 100%. If nine out of ten of the available sites are occupied, the So2 is 90%, and so on. Note that as the number of sites occupied decreases, the color of the hemoglobin and the blood gradually changes (representing the change in light absorption associated with decreased saturation). Although exaggerated in these illustrations, a change in color actually occurs in live non-anemic patients, leading to visible cyanosis in patients with dangerously decreased saturation.
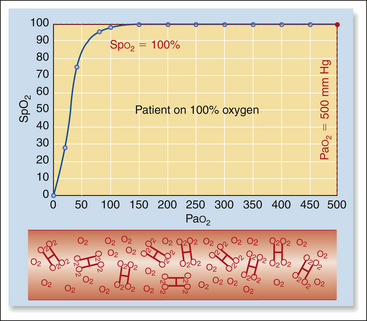
FIGURE 1 Oxygen dissociation curve for a normal patient breathing 100% oxygen. Generally accepted values for Pao2 (500 mm Hg) and Spo2 (100%) in a normal patient when breathing 100% oxygen. Note that all binding sites are occupied, and the blood is bright red.
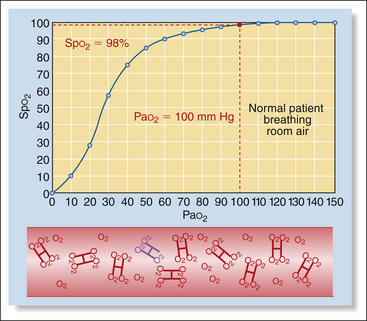
FIGURE 2 Oxygen dissociation curve for a normal patient breathing room air. Generally accepted values for Pao2 (100 mm Hg) and Spo2 (98%) in a normal patient breathing 21% oxygen. Note that one out of 40 (approximately 2%) of the available binding sites is unoccupied, and the color is subtly changed.
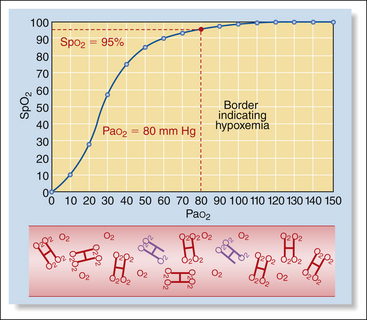
FIGURE 3 Oxygen dissociation curve for a patient with early hypoxemia. Generally accepted values for Pao2 (80 mm Hg) and Spo2 (95%) in a patient with early hypoxemia. Note that two out of 40 (5%) of the available binding sites are unoccupied, and the color is changed to a slightly greater degree.
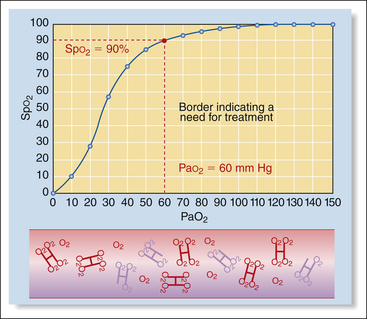
FIGURE 4 Oxygen dissociation curve for a patient requiring treatment. Generally accepted values for Pao2 (60 mm Hg) and Spo2 (90%) in a patient requiring treatment. Note that four out of 40 (10%) of the available binding sites are unoccupied, and the color is noticeably changed.
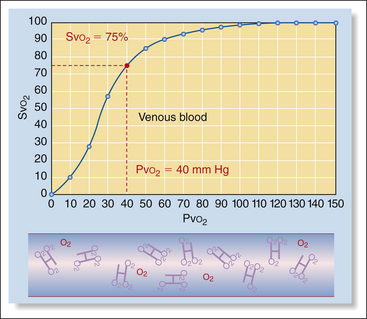
FIGURE 5 Oxygen dissociation curve for venous blood. Generally accepted values for Pvo2 (40 mm Hg) and Svo2 (75%) in venous blood. Note that 10 out of 40 (25%) of the available binding sites are unoccupied, and the color is significantly changed. If the oxygen content of arterial blood decreases approximately to this level in a patient with a normal packed cell volume (PCV), cyanosis will occur, indicating a critically low oxygen level, which will rapidly lead to death if not immediately corrected.
In contrast, when hemoglobin is low (the patient is anemic), neither of these parameters gives an accurate measure of oxygen availability. This is because even if the partial pressure and/or saturation are normal, the carrying capacity of the blood is severely decreased owing to the decrease in the number of hemoglobin binding sites. For example, a patient with a hemoglobin of 5 g/dL (equivalent to a very anemic patient with a PCV of about 15%) breathing room air or 100% oxygen will have a total blood oxygen content of only slightly more than one third of the normal level, even though percent saturation and partial pressure are both normal. So with anemic patients, the value of these parameters in predicting patient tissue oxygenation is limited.
TECHNICIAN NOTE
When a patient is anemic, neither Pao2 nor Spo2 gives an accurate measure of oxygen availability. This is because even if the Pao2 and/or Spo2 are normal, the carrying capacity of the blood is severely decreased owing to the decrease in the number of hemoglobin binding sites.
Once hemoglobin is 100% saturated, as occurs when the partial pressure is near 120 mm Hg, any further increase in inspired oxygen will have almost no effect on the oxygen-carrying capacity of the blood, and thus will be of little benefit to the patient. When the partial pressure of oxygen decreases to values lower than about 80 mm Hg, as could occur with lung disease, lack of oxygen, inadequate ventilation, or shunting, the saturation begins to decrease more quickly. Saturation is therefore an early warning system that can alert the anesthetist to a potentially devastating decrease in the oxygen content of the blood.
When patients are breathing pure oxygen from an anesthetic machine, the amount of dissolved oxygen (Pao2) can increase markedly (up to about 500 mm Hg). But as dissolved oxygen represents only a very small proportion of the total oxygen content, and because hemoglobin is already nearly 100% saturated when the patient is breathing room air, this extra oxygen contributes only about a 10% increase in the total oxygen content of the blood.
Both Po2 and So2 can be measured, although by different instruments. Blood gas analyzers measure Pao2; pulse oximeters measure Spo2. Both values reflect inspired oxygen and how well the lungs deliver oxygen to the blood. Most anesthetized animals show a greatly elevated Pao2 (up to 500 mm Hg compared with the normal 90 to 110 mm Hg for an awake patient breathing room air) because they are breathing almost 100% oxygen from the anesthetic machine, whereas the conscious animal breathes approximately 21% oxygen in room air. Similarly, Spo2 readings on anesthetized animals breathing pure oxygen are usually high (97% to 99%).
Low Pao2 and Spo2 values are sometimes observed during anesthesia. A Pao2 value below 80 mm Hg (Spo2 95%) indicates hypoxemia, and a value below 60 mm Hg (Spo2 90%) indicates the need for oxygen supplementation and possibly assisted ventilation.
Pulse Oximeter
A pulse oximeter estimates the saturation of hemoglobin (So2), expressed as a percentage of the total binding sites. Pulse oximeters are readily available, relatively inexpensive, noninvasive, portable, and relatively easy to use. A pulse oximeter is equipped with a probe, which is sensitive to both the absorption of light by hemoglobin and to blood pulsations in the small arterioles (Figure 5-22).
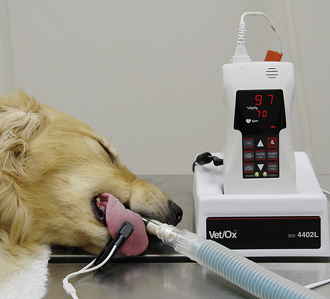
FIGURE 5-22 Pulse oximeter with transmission lingual probe. The upper number (97) represents the percent oxygen saturation (Spo2). The lower number (70) represents the heart rate in beats per minute.
Red- and infrared-wavelength light emitted by the probe is passed through or reflected off the tissue bed, and the frequency of the emergent light is read by a sensor and analyzed. The machine determines the oxygen saturation (Spo2) by calculating the difference between levels of oxygenated and deoxygenated hemoglobin based on subtle differences in absorption of light. The HR is determined by detecting pulsations in the small arterioles. Both the HR and the oxygen saturation are digitally displayed.
Normally when pure oxygen is breathed, hemoglobin in the lungs is at least 97% saturated with oxygen. Therefore during oxygen administration the oxygen saturation should be greater than 95%. A pulse oximeter reading of 90% to 95% must be investigated, because it indicates that the patient’s hemoglobin is not fully saturated and the patient is hypoxemic. Saturation less than 90% indicates a need for therapy. Saturation less than 85% for longer than 30 seconds is a medical emergency.
TECHNICIAN NOTE
• During oxygen administration the oxygen saturation should be greater than 95%.
• A pulse oximeter reading of 90% to 95% must be investigated because it indicates that the patient is hypoxemic.
• Saturation less than 90% indicates a need for therapy.
• Saturation less than 85% for longer than 30 seconds is a medical emergency.
Use and Operation: Pulse oximeters usually come with a variety of probes, each of which analyzes light either passed through or reflected off a tissue bed. The probes are classified as transmission or reflective. Transmission probes are constructed in a “clothespin” type configuration. One of the jaws houses a light source, and the other houses a sensor that detects the transmitted light. Transmission probes must be applied over a nonpigmented tissue bed that is thin enough to allow light transmission through the tissue. In anesthetized animals the tongue is commonly used, but the probe may also be applied to the pinna, toe web, vulvar fold, prepuce, Achilles tendon, lip, or any other area that is thin, relatively hairless, and nonpigmented. Although these probes are able to function through a thin hair coat, excessive hair will prevent operation. Figure 5-23 shows examples of probe types and placement.
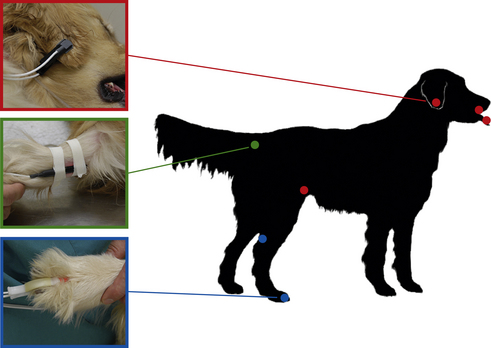
FIGURE 5-23 Examples of pulse oximeter probes and locations for placement. Red—transmission probe on the ear flap. Additional red dots show alternate placement locations for this probe (tongue, lip, and flank fold). Green—reflective probe taped to the ventral surface of the tail base. Blue—“C-probe” (a transmission probe) on the toe web. The other blue dot shows an alternate placement location for this probe (the skin fold between the Achilles tendon and the tibia).
Reflective probes reflect light off a tissue bed. The light source and sensor are located next to each other on one side of the probe. These probes are placed inside a hollow organ such as the esophagus or rectum, or against the ventral surface of the tail with the light source and sensor in contact with a tissue bed. During placement of a reflective probe in the rectum, care must be taken to digitally displace the feces from the wall of the rectum and place the side of the probe that houses the light source and sensor against the tissue.
Pulse oximeter probes can be frustrating to work with because the probes are temperamental and often give inaccurate readings or lose the signal altogether. When this happens, values will no longer appear on the display, the numbers will be incorrect, or an alarm may sound. Tissue pigmentation, motion, excessive pressure, orientation in relation to ambient light, and patient conditions such as anemia, icterus, vasoconstriction, or edema will all decrease accuracy or result in signal loss. Box 5-5 contains suggestions for troubleshooting signal loss.
Pulse oximeters require little maintenance but must be handled with care. Transmission probes should be cleaned with alcohol or other mild disinfectant after use. Reflective probes should be covered with a plastic sleeve supplied by the manufacturer before insertion into the rectum or esophagus. None of the probes can be immersed, scrubbed, or autoclaved.
If pulse oximeter readings are abnormally low during anesthesia, the anesthetist should consider the following questions:
• Is the instrument working correctly? Readings may be affected by factors such as probe placement, external light sources, and motion.
• Does the agent cause vasoconstriction? Some anesthetic agents (especially alpha2-agonists such as dexmedetomidine) cause vasoconstriction and decreased peripheral perfusion, which may significantly lower Spo2 values.
• Is the tissue under the probe adequately perfused? Regardless of the anesthetic agents used, perfusion of an extremity such as the tongue may decrease gradually with time and give artificially reduced Spo2 readings. If this is the case, readings may improve if the probe is moved to a different location. If higher readings cannot be obtained, the patient should be evaluated for hypothermia, hypotension, blood loss, and other causes of reduced perfusion.
• Is adequate oxygen being delivered to the patient? Inadequate oxygen delivery may result from esophageal intubation, an oxygen flow rate that is too low, an empty oxygen tank, endotracheal tube blockage or disconnection, or respiratory failure.
• Is oxygen being transferred from the alveoli to the blood? This process may be impeded by inadequate ventilation or preexisting lung disease.
• Is circulation adequate? Heart disease, bradycardia, severe arrhythmias, or pulmonary embolism may decrease oxygenation.
Regardless of the cause, patients with subnormal Pao2 or Spo2 readings may require supplemental oxygen delivery, or ventilation through bagging or use of a ventilator.
Pulse oximeters can be used not only on anesthetized patients but also on animals that are in intensive care because of trauma, heart failure, respiratory difficulty, or unconsciousness. Their chief limitation is the difficulty of finding a suitable probe site in alert and mobile patients.
Indicators of Ventilation
The objective of the ACVA monitoring guidelines for ventilation is “to ensure that the patient’s ventilation is adequately maintained.” To meet this objective, the ACVA makes the following recommendations:
“Qualitative assessment of ventilation is essential as outlined in either [of the following statements:] (1) Observation of thoracic wall movement or observation of breathing bag movement when thoracic wall movement cannot be assessed… [or] (2) Auscultation of breath sounds with an external stethoscope, an esophageal stethoscope, or an audible respiratory monitor; and capnography is recommended, with blood gas analysis as necessary.”
The term ventilation refers to the movement of gases in and out of the alveoli, whereas respiration is a more general term that means the processes by which oxygen is supplied to and used by the tissues, and carbon dioxide is eliminated from the tissues. The following monitoring parameters and indicators give the anesthetist information about ventilation.
Respiratory Rate
RR is the number of breaths per minute (breaths/min). It is most often monitored by watching the chest wall. In situations in which the chest excursions are not visible, such as when the patient is covered by a surgical drape, it may also be monitored by observing movements of the reservoir bag. Auscultation of breath sounds is not a particularly good way to determine the RR because the low VT typically seen during anesthesia renders respiratory sounds inaudible or nearly so in many anesthetized patients. RR may also be monitored mechanically with an apnea monitor or capnograph. The apnea monitor generates an audible beep with each breath, and a capnograph displays a digital readout of the RR in breaths per minute. The minimum acceptable, maximum acceptable, and typical RR for anesthetized patients are listed in Table 5-2. During anesthesia, there is normally a decrease in the RR. Inhalant anesthetics, opioids, and alpha2-agonists are particularly likely to cause respiratory depression. Propofol and thiopental sodium typically cause bradypnea or apnea during induction, especially if given quickly or at higher doses.
An increase in RR is called tachypnea. Tachypnea must be differentiated from panting, in which breaths are rapid but shallow and air is taken in through an open mouth. Panting (only seen in conscious, nonintubated patients) is a common side effect of neuroleptanalgesia. True tachypnea has many possible causes including hypercapnia, pulmonary disease, or a response to a mild surgical stimulus. For example, tachypnea is often apparent when the surgeon pulls on the suspensory ligament of the ovary during an ovariohysterectomy. An elevated RR may also indicate a progression from moderate to light anesthesia and is one of the first signs of arousal from anesthesia. Some patients (particularly obese dogs) breathe rapidly even at a moderate depth of anesthesia.
Tidal Volume
VT is the amount of air inhaled during a breath. As with RR, VT is monitored by watching the chest wall or movement of the reservoir bag. Normal VT is generally considered to be 10 to 15 mL/kg but decreases by at least 25% in most anesthetized animals, largely because most preanesthetic and general anesthetic drugs decrease the contraction of the intercostal muscles on inspiration. As the animal’s breaths become more shallow (i.e., as VT decreases), some alveoli in the lungs may not receive amounts of air adequate for normal gas exchange. As a result the alveoli will partially collapse (a condition called atelectasis). This is most pronounced in the “down” lung (also called the dependent lung) of a patient that is lying on its side and in the dorsal lung fields of a patient lying on its back. In its early stages atelectasis can be reversed by gentle inflation of the lungs by the anesthetist. In this procedure, called bagging or sighing the patient, the reservoir bag of the anesthetic machine is carefully squeezed, forcing air into the patient’s breathing passages. When bagging a patient, the anesthetist should closely observe the animal’s chest to ensure that it rises only slightly, as with a normal breath, to prevent overinflation of the lungs. Some anesthetists routinely bag every patient under inhalation anesthesia once every 5 to 10 minutes. Alternatively, hypoventilation and atelectasis may be prevented by use of a mechanical ventilator (see Chapter 6).
Anesthetized patients may occasionally have increased VT (hyperventilation). As with tachypnea, hyperventilation may result from hypercapnia or surgical stimulation.
VT can be measured by using a respirometer, which is placed between the expiratory hose of a rebreathing circuit and the anesthetic machine. When the patient breathes out, vanes within the respirometer turn small dials on the front of the device. One dial (one complete circuit of the needle) turns with every breath and is noncumulative. The other dial is cumulative, so the patient’s minute volume (breaths/min × VT) can be monitored. The respirometer dials are easily reset to zero by depressing the buttons at the top, much like a stopwatch.
TECHNICIAN NOTE
In its early stages, atelectasis can be reversed by gentle inflation of the lungs. In this procedure, called bagging or sighing the patient, the reservoir bag of the anesthetic machine is carefully squeezed, forcing air into the patient’s breathing passages, until the animal’s chest rises as with a normal breath.
Respiratory Character
Respiratory character refers to the effort required to breathe, the relative length of inhalation and exhalation, and regularity. Respiratory character is monitored by watching the chest wall.
The anesthetized animal’s breathing should be smooth and regular, with both thoracic and diaphragmatic components (i.e., the chest wall and the diaphragm should move). Gasping, difficult, or labored breathing (dyspnea) indicates a problem requiring intervention, including airway blockage, respiratory disease, pressure buildup in the breathing circuit, or hypoxemia, and must be brought to the veterinarian’s attention.
The time relationship between inspiration and expiration may vary also. Normal inspiration lasts 1 to 1.5 seconds, and expiration lasts at least 2 to 3 seconds. Expiration is usually followed by a pause before the next inspiration begins. Animals anesthetized with ketamine may exhibit an apneustic respiratory pattern in which there is a prolonged pause between inspiration and expiration.
Auscultation of the chest is useful to assess respiratory function. Normal respiratory sounds are almost inaudible in the dog and cat. Harsh noises, crackles, gurgling, whistles, or squeaks may indicate narrow or obstructed airways or the presence of fluid in the airways or alveoli and should be brought to the veterinarian’s attention.
Apnea Monitor
The apnea monitor (Figure 5-24) monitors respirations and warns the anesthetist when the patient has not taken a breath. The sensor, which is placed between the endotracheal tube connector and the breathing circuit, detects temperature changes between the cool inspired and warm expired air in the breathing circuit. The base unit emits an audible beep each time the patient breathes and will sound an alarm when no breath is detected for a preset time period.
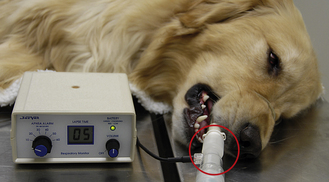
FIGURE 5-24 Apnea monitor. The sensor (circled) is located between the breathing circuit and the endotracheal tube connector. The lapse time indicates the time in seconds since the previous breath. This alarm is set to sound if the interval between breaths exceeds 10 seconds.
The sensor increases mechanical dead space, which can be significant, especially in small patients. For this reason, special endotracheal tube connectors are available that accommodate the sensor and minimize dead space. Although apnea monitors do not warn of inadequate respiratory depth, they may have difficulty detecting respirations if the patient’s VT is significantly decreased or the patient becomes hypothermic, and will sound the apnea alarm. Consequently, as with any monitor, alarm signals must be confirmed by physical examination of the patient.
Capnograph (End-Tidal CO2 Monitor)
A capnograph measures the amount of CO2 in the air that is breathed in and out by the patient. Capnography is a noninvasive, continuous, and practical method of monitoring CO2 levels in anesthetized patients without the need to catheterize an artery, as is necessary with blood gas analysis. Although this monitoring device does not measure blood CO2 directly, expired CO2 closely mirrors arterial CO2 (Paco2). Specifically, end-tidal CO2 (ETco2) is about 2 to 5 mm Hg less than Paco2
A capnograph consists of a sensor and a computerized monitor with a digital readout (Figure 5-25). The sensor measures infrared light absorption, which is directly proportional to the CO2 level. Sensors are of two general types. A mainstream capnograph is an instrument in which the sensor chamber is placed directly between the endotracheal tube and the breathing circuit. A sidestream capnograph is one in which the sensor chamber is located in the computerized monitor and air is pulled into it through a tube attached to a fitting placed between the endotracheal tube and breathing circuit. Both systems measure the CO2 in the air that passes into and out of the endotracheal tube on both inspiration and expiration and display this information as a waveform (called the capnogram) and as a numeric display of the ETco2.
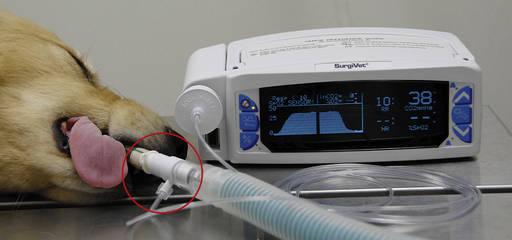
FIGURE 5-25 A sidestream capnograph registering an end-tidal CO2 level of 38 mm Hg and a respiratory rate of 10 (upper right). The fitting (circled) is located between the breathing circuit and the endotracheal tube connector. The graph indicates the carbon dioxide levels throughout the respiratory cycle, which in normal patients is 35 to 55 mm Hg during expiration and 0 mm Hg during inspiration.
The fitting on sidestream samplers (placed between the endotracheal tube and breathing circuit) is very lightweight and small, adding relatively little mechanical dead space to the circuit. These units often come with special endotracheal-tube connectors for very small patients, which, when used in place of the regular endotracheal-tube connector, effectively produce no increase in dead space. There is a 2- to 3-second delay in the display of CO2 levels with these units, however. Also, these units sample 50 to over 400 mL of air per minute from the circuit, which may cause a significant loss of gas and false readings when very low oxygen flow rates are used.
Mainstream samplers produce an immediate reading with no delay. But the sensor chamber, which is placed between the endotracheal tube and the breathing circuit, is relatively large and heavy and is heated to prevent condensation. This results in increased dead space, a greater risk that the endotracheal tube will kink, and a risk that the patient may be burned.
Generation of the Capnogram: Carbon dioxide is produced in the cells as a byproduct of cellular metabolism. After diffusing into venous blood, CO2 is transported from the cells to the lungs, where it is eliminated on expiration. Blood CO2 levels are determined by the following three factors:
1. The rate of production by the cells (determined by cellular metabolism)
2. The rate of transport to the lungs (determined by cardiovascular output and pulmonary perfusion)
3. The rate of elimination from the lungs (determined by respiratory system health, RR, and VT)
The ETco2 level as well as the configuration of the waveform are thus influenced by the interaction among all three of these factors (metabolism, perfusion, and ventilation), as well as equipment function. Interpretation of a capnogram requires knowledge of normal and abnormal ETco2 values, common abnormal waveform configurations, and causes of each abnormality. Therefore, interpretation is somewhat complex and may be confusing until the anesthetist acquires some experience. Once mastered however, the capnogram is an extremely valuable tool that can alert the anesthetist to a wide variety of anesthetic problems.
Appearance of a Normal Capnogram: On the capnogram, the x-axis displays time, and the y-axis displays the CO2 level (Figure 5-26). The configuration of the waveform is determined by the levels of CO2 passing through the machine end of the endotracheal tube. Provided the anesthetic machine is working correctly and appropriate oxygen flow rates are used, during inspiration the inspired CO2 is 0 mm Hg. This period during which the CO2 level is 0 is called the baseline. During expiration, the CO2 level abruptly increases to about 40 mm Hg (35 to 45 mm Hg is considered normal in a non-anesthesized patient), increases slightly until the end of the expiratory effort, then abruptly decreases back to 0 at the beginning of the subsequent inspiratory effort.
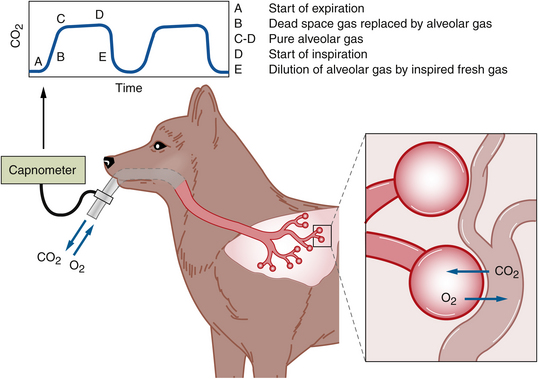
FIGURE 5-26 Normal capnogram. The capnograph measures the partial pressure of the CO2 in the air moving between the endotracheal tube and the breathing circuit. As long as the patient is not rebreathing expired gases, and the CO2 absorbent is not exhausted, CO2 is 0 mm Hg during inhalation. Shortly after the beginning of exhalation (point A), CO2 rapidly increases to about 40 mm Hg (point C), then continues to increase slightly until immediately before the next inhalation (point D). This represents the ETco2. Immediately after the beginning of the next inhalation, the CO2 again rapidly decreases to 0 mm Hg.
The shape of the resulting waveform can be described as a modified rectangle. It is called an “end-tidal” monitor because the displayed CO2 value at the end of the expiration is most reflective of arterial CO2 levels.
Effective interpretation requires evaluation of four distinct aspects of the capnogram:
TECHNICIAN NOTE
Effective interpretation of the capnogram requires evaluation of four distinct aspects:
Appearance of an Abnormal Capnogram: A change in metabolism, perfusion, or ventilation, as well as equipment malfunction, will affect ETco2 levels and/or the waveform configuration. In most normal patients, provided metabolism and perfusion are normal, abnormal CO2 levels are most commonly a result of changes in ventilation (hyperventilation, hypoventilation, apnea) or equipment problems. Following are some common abnormalities:
• Hyperventilation caused by increased RR or VT or overzealous mechanical or manual ventilation will cause CO2 to be exhaled more quickly than it is produced and will consequently cause a gradual decrease in the ETco2 (a shorter rectangle).
• Hypoventilation (decreased RR or VT or inadequate mechanical or manual ventilation) will cause a gradual increase in ETco2 (a taller rectangle).
• Detachment of the endotracheal tube from the sensor fitting, esophageal intubation, a blocked endotracheal tube, or apnea will cause a sudden loss of the waveform (a flat line), because in each of these circumstances, no CO2 will reach the sensor.
• A malfunctioning exhalation unidirectional valve or exhausted CO2 absorbent will cause the baseline to rise above 0, reflecting rebreathing of CO2 in the inspired air (a failure of the baseline to return to 0 during inspiration) and increased ETco2.
• A leaky cuff or partially kinked endotracheal tube will cause a sloppy up-stroke and down-stroke (rounding of the edges of the rectangle).
Many other conditions not related to ventilation or equipment can also cause abnormal ETco2 values or waveforms, including pulmonary or heart disease, shock, changes in BP and body temperature, cardiac arrest, blood loss, and pulmonary thromboembolism.
Following are examples of these abnormalities:
• Cardiac arrest will cause a rapid loss of the waveform because CO2 is no longer circulated to the lungs, and the waveform will rapidly reappear with the return of spontaneous circulation (ROSC) if cardiopulmonary cerebrovascular resuscitation (CPCR) is successful.
• Hypotension or a sudden decrease in cardiac output will cause a rapid decrease in the ETco2 (a shorter rectangle).
• Hypothermia will cause a gradual decrease in the ETco2 because of a decrease in the metabolic rate and subsequent CO2 production (a shorter rectangle). Hyperthermia will cause a gradual increase (a taller rectangle).
Other, subtler changes in the configuration of the waveform may occur as a result of high or low gas flow, the type of breathing circuit used, the amount of dead space, and other factors. Also, capnograph malfunctions will affect the waveform, including excess moisture in the sampling line, blockage of the line, or a leak in the system. Table 5-3 shows common changes in the capnogram and associated causes.
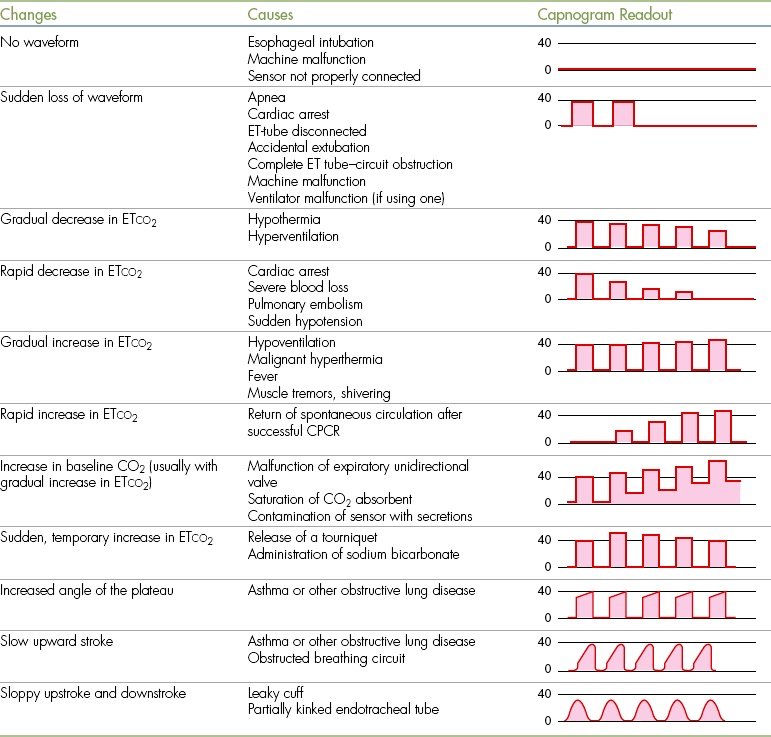
Blood Gas Analysis
Blood gas analysis refers to the measurement of blood pH, and dissolved oxygen and carbon dioxide gas in arterial (Pao2 and Paco2) or venous (Pvo2 and Pvco2) blood. It is therefore an indicator of both oxygenation and ventilation as well as acid-base status. Each of these variables is influenced by respiratory function, which can be roughly evaluated by observation of the rate, depth, and character of the patient’s respirations. However, physical monitoring may give an inaccurate impression of the patient’s status because although respirations may appear normal, oxygenation and ventilation may in fact be abnormal.
Blood gas monitoring is most commonly used for large animal patients and is seldom used in small animal practice outside of specialty practices for several reasons. First, sample collection may be difficult because blood intended for blood gas analysis is most often obtained from an artery (as opposed to routine blood samples, which are taken from a vein). In certain situations, a venous sample may be used. For example, the lingual vein has extensive anastomoses with arteries in the tongue, the blood gas values obtained from lingual vein samples are close to arterial values, and the head is often easily accessed by the anesthetist during surgery. Second, sample handling is labor-intensive. Once obtained, the blood sample must be stored on ice, and values should be measured within 2 hours. Many veterinary reference laboratories and some veterinary hospitals are equipped to perform these tests, and some human hospital laboratories may be willing to accept samples from nonhuman patients. Portable analyzers have recently been introduced to the veterinary market.
Carbon dioxide (CO2) is transported through the blood in three ways. About 20% to 30% is bound to hemoglobin in the RBCs. About 5% to 10% is dissolved in plasma and is measurable as Pco2 (the CO2 partial pressure in the vessels). The remainder (about 60% to 70%) reacts with water to form carbonic acid, which is quickly converted into bicarbonate and hydrogen ions according to the following reaction:

The anesthetist can evaluate how well the patient is eliminating CO2 by measuring Paco2 through blood gas determination. Paco2 is often elevated during anesthesia (45 to 60 mm Hg compared with less than 45 mm Hg in the awake patient) because the respiratory depression produced by most anesthetics causes the body to retain CO2. In other words, the patient does not breathe often enough or deeply enough to eliminate the normal amount of CO2. A Paco2 greater than 60 mm Hg indicates that the patient is hypoventilating. If this happens, the anesthetist needs to determine if the patient is in trouble by assessing the oxygenation, cardiac rhythm, BP, and anesthetic depth. It may be necessary to assist ventilation by compressing the reservoir bag or using a ventilator (see Chapter 6).
TECHNICIAN NOTE
Paco2 is often 45 to 60 mm Hg during anesthesia because the respiratory depression produced by most anesthetics causes the body to retain CO2. A Paco2 greater than 60 mm Hg indicates that the patient is hypoventilating.
Because of high CO2 levels, anesthetized patients may also become mildly acidotic (i.e., excess hydrogen ions are produced from CO2 according to the previous equation). Blood pH in anesthetized animals usually reflects this mild respiratory acidosis and is commonly 7.2 to 7.3, compared with the normal animal’s blood pH of 7.35 to 7.45. Cellular enzymes do not work well outside certain pH ranges, so when acid-base disturbances are suspected or present, maintaining pH between 7.2 and 7.5 is advisable. The correction of the underlying cause often results in improvement of acid-base status, thus treatment should be discussed with the veterinarian-in-charge (VIC). Blood pH measurement can be performed at the same time blood gas determinations are made, to help the anesthetist determine the acid-base status of the body and the adequacy of the patient’s respiration. In the absence of elevated Paco2, a decreased pH is evidence of metabolic acidosis, which should be brought to the attention of the VIC. Blood pH that is elevated (greater than 7.45) when Paco2 is decreased (less than 35 mm Hg) indicates hyperventilation, which may be caused by light anesthetic depth, overzealous ventilation, pain, or hypoxemia. Blood pH that is elevated with a normal Paco2 indicates metabolic alkalosis, which may be caused by obstruction of outflow from the pylorus of the stomach or by excessive administration of NaHCO3.
Pao2 is the partial pressure of dissolved oxygen in arterial blood. This should be approximately five times the inspired concentration of oxygen. Therefore when a patient is breathing room air, which is approximately 21% O2, Pao2 is approximately 100 mm Hg, and when it is breathing 100% O2 under general anesthesia, Pao2 is approximately 500 mm Hg. Clinically significant hypoxemia is present if Pao2 is below 80 mm Hg, and Pao2 below 60 mm Hg requires intervention such as mechanical ventilation (see Chapter 6). Causes of hypoxemia are hypoventilation, decreased fraction inspired oxygen, shunting of blood flow (blood bypasses the lungs and is returned, unoxygenated, to the systemic arteries), and decreased ability of oxygen to diffuse from the lung into the bloodstream (diseases such as pneumonia or pulmonary edema). In the absence of disease, small animals and ruminants are rarely hypoxemic during anesthesia. Anesthetized horses are commonly hypoxemic, regardless of health status (see Chapter 9).
Indicators of Body Temperature
The objective of the ACVA monitoring guidelines for body temperature is “to ensure that patients do not encounter serious deviations from normal body temperature.” To meet this objective, the ACVA makes the following recommendations: “Temperature should be measured periodically during anesthesia and recovery and if possible checked within a few hours after return to the wards.”
Core body temperature is another vital sign that, although not an indicator of circulation, oxygenation, or ventilation, is nonetheless important for reasons indicated below. Body temperature should be monitored at least every 15 to 30 minutes during anesthesia, using a rectal thermometer or an esophageal or rectal probe attached to a continuous display monitor.
Body temperature is regulated by a physiologic process called thermoregulation, in which changes in a variety of physiologic processes including shivering, metabolic rate, and peripheral blood flow keep the temperature within the normal range. The hypothalamus of the brain is the “control center” for thermoregulation. With few exceptions, anesthetics decrease the body temperature by depressing the hypothalamus, reducing muscular activity, and slowing the metabolic rate. For this reason, hypothermia is a frequent and even an expected response to general anesthesia that if not prevented, recognized, and controlled will cause a variety of adverse effects including prolonged recovery. In severe cases of hypothermia, depressed CNS and heart function will endanger the patient. Temperature loss is greatest in the first 20 minutes, and can be 3° C or more during the course of a prolonged procedure. (See Table 5-2 for common body temperatures during anesthetic procedures.) Several factors contribute to this effect:
• Animals are routinely shaved before surgery, and the skin is often prepared with antiseptic and alcohol solutions that cool the skin by evaporation.
• An anesthetized animal is incapable of generating heat by shivering or muscular activity.
• The metabolic rate of an anesthetized animal is less than that of a conscious animal, resulting in less heat generation.
• During the course of surgery, a body cavity may be opened and the viscera exposed to air at room temperature.
• Some preanesthetic and general anesthetic agents cause peripheral vasodilation, resulting in an increased rate of heat loss.
• Pediatric and geriatric animals are less able to maintain thermoregulation and are therefore even more predisposed to hypothermia then adult animals.
• Small patients lose heat faster because the body surface area is proportionately greater than the surface area of larger patients.
• Administration of room temperature IV fluids will further decrease body temperature.
• Patients placed on non-rebreathing systems constantly breathe fresh gas, which is cold and dry; they therefore expend energy warming and humidifying this gas.
TECHNICIAN NOTE
During anesthesia, body temperature loss is greatest in the first 20 minutes. Body temperatures in the range of 32° to 34° C (89.6° to 93.2° F) prolong anesthetic recovery and significantly decrease the dose of anesthetic agents required. Temperatures below 32° C (89.6° F) cause dangerous CNS depression and changes in heart function.
The magnitude of hypothermia determines the effects, but temperatures as low as 36° C (96.8° F) do not cause significant harm.
There are several potential problems associated with hypothermia during the maintenance and recovery periods. Body temperatures in the range of 32° to 34° C (89.6° to 93.2° F) prolong anesthetic recovery and significantly decrease the dose of anesthetic agents required to maintain surgical anesthesia by slowing the rate at which liver enzymes metabolize the drugs. This predisposes the patient to anesthetic overdose if the rate of administration is not reduced. Shivering during recovery will increase the patient’s oxygen demands by as much as six times. This can cause significant complications when the patient is unable to respond to this increase in demand (as may be the case in a patient not receiving adequate oxygen or with cardiopulmonary disease). Temperatures below 32° C (89.6° F) cause dangerous CNS depression and changes in heart function. To avoid these problems the anesthetist should endeavor to monitor the patient’s temperature and to maintain it as much as possible within the normal range. A variety of techniques can be used to minimize heat loss.
• Avoid excessively cold temperatures in the surgery suite or treatment room.
• Always place a barrier between the patient and tabletops, especially those made of stainless steel.
• Warm IV fluids to 37.5° C (approximately 100° F) before administration, or place a segment of the fluid line in a bowl of warm (37.5° C [approximately 100° F]) water to warm the fluids as they travel through the IV line. Realize that warming fluids in a microwave can result in excessively hot regions or can easily overheat the fluids. Fluids over 42° C (107.6° F) cause hemolysis and damage to the vascular endothelium and organs. For this reason, fluids must be mixed and the temperature always checked before they are administered to the patient.
• Place a circulating warm water blanket between the patient and the table. These quilted, vinyl blankets are attached to a unit that circulates warm water through the blanket.
• Place the patient on a forced warm-air blanket. These devices consist of a quilted plastic blanket (similar to a pool floater) that is placed under and sometimes over the patient. A device is attached that circulates warm air through the blanket.
The same techniques can be used to manage hypothermic patients. Additional rewarming techniques include the following:
• Place warm water bottles containing 37.5° C (approximately 100° F) water next to the patient. These bottles will lose heat quickly, however, and if left near the patient too long will worsen the hypothermia. Consequently, they must be checked and reheated on a regular basis.
• Place the patient under infrared heating lamps at a distance of 75 cm (30 inches).
Never use electric heating pads, because they are not usually temperature regulated and often exceed the maximum safe operating temperature of 42° C (107.6° F). Thus, severe burns can result from their use. Also, avoid rapid warming of very cold patients because dilatation of the peripheral vasculature may decrease BP and release cardiotoxic substances that may accumulate in hypoxic tissues.
Hyperthermia (increased body temperature) is occasionally seen in anesthetized animals. Hyperthermia may occur for several reasons, including excessive administration of external heat, drug-induced reactions (e.g., opioid administration in some cats, excessive muscular activity after drugs such as ketamine), inability to dissipate heat (e.g., large dogs with thick coats under surgical drapes and/or placed on low-flow or closed system anesthesia in which the rebreathed gases are warmer). Hyperthermia in these cases is often noted during or just before recovery. Cooling methods should be applied, such as administering cold fluids intravenously, intraperitoneally, or rectally and performing surface cooling with fans and ice or alcohol. When opioids have been given to cats, administration of acepromazine (0.03 to 0.05 mg/kg) or reversal using naloxone should be considered. If the patient is still anesthetized, increasing the flow rate of oxygen to non-rebreathing levels will also help.
One particular type of hyperthermia, malignant hyperthermia (MH), is most commonly seen in pigs, although there are reports of susceptible individuals in other species. In pigs this is caused by a genetic defect that results in excess muscle metabolism in the presence of some anesthetic drugs such as halothane and the muscle relaxant succinylcholine. Restraint can also precipitate this syndrome, so stress should be minimized during handling of susceptible swine. Clinically, the anesthetized pig will become hot and stiff to the touch, pink pigs will turn red, large amounts of CO2 are produced, and tachyarrhythmias occur. Anesthesia should be halted immediately, 100% oxygen administered, and cooling methods applied. The only medical treatment for MH is dantrolene, which is typically available only at large veterinary or human hospitals.
ASSESSMENT OF ANESTHETIC DEPTH
Reflexes and Other Indicators of Anesthetic Depth
At all times during an anesthetic procedure, the anesthetist must accurately assess the patient’s anesthetic depth. Like many things, this is more complex than it first seems and requires detailed observation and interpretation of subtle changes in physical signs. In practice, the subtleties of anesthetic monitoring are all too often neglected for a variety of reasons including a lack of adequate skill, a sense of complacency borne of past experience with many successful anesthetic procedures (and a subsequent attitude that can be summarized by the statement “it’s not a big deal—my patients never have any problems”), or more job demands than the technician can reasonably handle. When not given due attention, monitoring is turned into a crude and alarmingly simplified system consisting of the following three stages of anesthesia: “awake,” “asleep,” and “dead.”
Obviously the anesthetist needs considerably more detail than that. The goal of monitoring is to ensure throughout the entire procedure that the patient is at a depth that provides immobility, unconsciousness, and lack of awareness of pain while avoiding conditions that endanger the patient such as hypoventilation, hypoxemia, hypotension, and hypothermia. Achieving this balance is not always easy and requires timely and effective response to changes in monitoring parameters. Although vital signs provide some help, reflexes, muscle tone, pupil size, eye position, and response to surgical stimulation are the best indicators of anesthetic depth (Table 5-4).
TECHNICIAN NOTE
In practice, the subtleties of anesthetic monitoring are all too often neglected for a variety of reasons. When not given due attention, monitoring is turned into a crude and alarmingly simplified system consisting of the following three stages of anesthesia: “awake,” “asleep,” and “dead.”
TABLE 5-4
Indicators of Anesthetic Depth
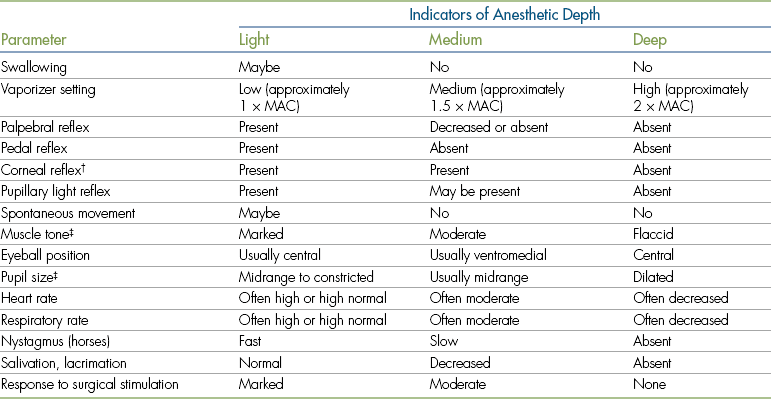
MAC, Minimum alveolar concentration.
†The corneal reflex is not reliable in small animals.
‡Strongly influenced by anesthetic protocol and signalment.
Modified from Haskins SC: General guidelines for judging anesthetic depth, Vet Clin North Am Small Anim Pract 22:432-434, 1992.
Reflexes
A reflex is an unconscious response to a stimulus. All healthy, conscious animals demonstrate predictable reflex responses. One example is the cough reflex, which is a response to the presence of foreign material in the airways. Reflex responses help protect the animal from injury (in the case of the cough reflex, by clearing upper airway obstructions and preventing aspiration of harmful material). These protective reflexes gradually decrease in response to an increasing depth of anesthesia, such that by stage III, plane 3, few to no reflex responses remain. The reflexes most commonly monitored in veterinary anesthesia include the swallowing, laryngeal, pedal, palpebral, and corneal reflexes as well as the PLR. When describing the status of these reflexes verbally to other surgical team members, or in written records, the terms “present,” “decreased” or “depressed,” and “absent” are often used.
Swallowing Reflex: The swallowing reflex is a response to the presence of saliva or food in the pharynx. This reflex is monitored by watching for swallowing motions in the ventral neck region. The swallowing reflex is present in light surgical anesthesia, is lost in medium surgical anesthesia, and returns during recovery just before the patient regains consciousness. The return of the swallowing reflex during recovery is the main indicator used to determine when it is safe to remove the endotracheal tube. Animals that vomit after this point usually will swallow rather than aspirate the vomited material, and the endotracheal tube is therefore no longer needed to protect the airway. In fact, if the endotracheal tube is not removed at this point, the patient will begin to chew on it.
Laryngeal Reflex: The laryngeal reflex is an immediate closure of the epiglottis and vocal cords when the larynx is touched by any object. This reflex protects the animal from tracheal aspiration. The laryngeal reflex may be observed during intubation, is present if the animal is in a lighter plane of anesthesia, and can make it difficult to pass the endotracheal tube. It is strong in cats, pigs, and small ruminants. A sustained or exaggerated laryngeal reflex, referred to as laryngospasm, is most commonly seen in these species and is a complication of endotracheal intubation.
TECHNICIAN NOTE
The palpebral reflex should be absent during surgical anesthesia in small animals maintained with isoflurane or sevoflurane. In most horses a very slight response indicates a surgical plane of anesthesia. Ruminants tend to have a slightly stronger reflex than horses, although spontaneous blinking is almost always associated with a plane of anesthesia that is too light.
Palpebral Reflex: The palpebral reflex (blink reflex) is a blink in response to a light tap on the medial or lateral canthus of the eye (Figure 5-27). In the conscious animal, this reflex helps protect the eye from injury. When eliciting this reflex, it is important to use a “light touch,” because vigorous tapping may artificially cause the eyelid to move, giving the anesthetist a false-positive response. Some anesthetists prefer to test this reflex by lightly stroking the hairs of the upper eyelid. As with most reflexes, the palpebral reflex is gradually lost as anesthetic depth increases. Most animals retain the palpebral reflex in light anesthesia and lose it during medium anesthesia, although the exact point at which it is lost varies among individuals, species, and agents. In small animals maintained with isoflurane or sevoflurane, this reflex should be absent during optimum and deep levels of anesthesia. Therefore when gas anesthetics are used in small animal patients, the presence of this reflex indicates that the anesthetic depth is inadequate, although the absence of the reflex cannot be used to determine if the anesthetic depth is excessive. In most horses a very slight palpebral response (very slow closure of the eyelid) indicates a surgical plane of anesthesia. Ruminants tend to have a slightly stronger eyelid reflex than horses, although spontaneous blinking is almost always associated with a plane of anesthesia that is too light. During recovery, return of the reflex usually indicates impending arousal.
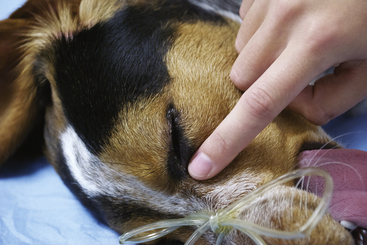
Pedal Reflex: The pedal reflex is flexion or withdrawal of the limb in response to vigorous squeezing and twisting or pinching of a digit or pad (Figure 5-28). This reflex is useful only in small animal patients. The pedal reflex varies depending on the anesthetic depth, from a very subtle contraction of muscles to a full withdrawal of the limb. Because false-negative responses are common, accurate assessment of this reflex requires a stimulus of a surprisingly high intensity (a really hard squeeze and twist), although obviously it must not be so forceful as to injure the patient. This is an important point when learning to elicit this reflex, because many novices are often surprised at how much force is required to obtain an accurate response.
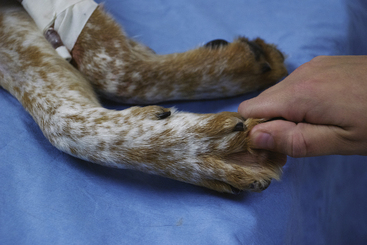
FIGURE 5-28 Assessing the pedal reflex by vigorously squeezing and twisting or pinching a digit or pad.
This reflex is present during light anesthesia, is lost during optimum anesthesia, and is particularly important in animals undergoing mask inductions, in which the presence of a mask makes assessment of other reflexes or jaw tone somewhat difficult. Once the patient is in medium surgical anesthesia, this reflex is not useful in detecting the onset of excessive anesthetic depth, because the reflex is absent in both optimum and deep anesthesia.
Corneal Reflex: The corneal reflex is a retraction of the eyeball within the orbit and/or a blink in response to stimulation of the cornea. It is tested by touching the cornea with a sterile object (a drop of saline or artificial tear solution is commonly used) (Figure 5-29). This reflex is most useful in large animals but is very difficult to elicit in small animals, except when the patient is in very light anesthesia. Retraction of the eye is often subtle and best seen by positioning oneself so that the line of sight is near the same horizontal plane as the cornea.
FIGURE 5-29 Assessing the corneal reflex by touching the cornea with a drop of sterile artificial tears.
This reflex should be present in light and medium planes of anesthesia and is lost when the anesthetic depth is excessive but is unreliable in small animals. It is therefore used primarily to tell the anesthetist when a large animal patient is too deeply anesthetized and should be reserved for this purpose only so that damage to the cornea is avoided.
Pupillary Light Reflex: The PLR is a constriction of the pupils in response to a bright light shined on one of the retinas. It is elicited by following the steps described on p. 19 in Chapter 2. This reflex gradually diminishes with increasing anesthetic depth, should be present in light and medium surgical anesthesia, but is lost during deep surgical anesthesia.
Other Indicators of Anesthetic Depth
Spontaneous Movement: Spontaneous movement in an unconscious patient indicates a very light plane of anesthesia and often indicates imminent arousal. This may manifest as shivering, alternating flexion and extension of the limbs, muscle twitching, or tremors. However some drugs, including etomidate, propofol, and opioids, may be associated with focal muscle twitching even in a medium plane of anesthesia.
TECHNICIAN NOTE
When assessing jaw tone, it is important to avoid opening the patient’s mouth too wide, because when the mouth is open to the maximum extent the anesthetist will feel resistance regardless of the muscle tone and will thus falsely interpret the muscle tone as being greater than it actually is.
Muscle Tone: Assessment of muscle tone gives the anesthetist an indication of the degree of skeletal muscle relaxation. Muscle tone is usually assessed by attempting to open the jaws from a closed position and estimating the amount of passive resistance (referred to as jaw tone) (Figure 5-30). When assessing jaw tone, it is important to avoid opening the patient’s mouth too wide, because when the mouth is open to the maximum extent the anesthetist will feel resistance regardless of the muscle tone and will thus falsely interpret the muscle tone as being greater than it actually is. If the anesthetist does not have access to the mouth, muscle tone can also be assessed by noting the size of the anal orifice (referred to as anal tone).
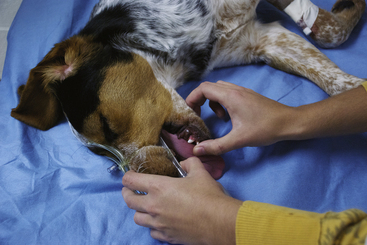
FIGURE 5-30 Assessing jaw tone by attempting to open the jaws from a closed position and estimating the amount of passive resistance.
With increasing depth of anesthesia, the resistance to movement of the jaw will progressively decrease and the anal orifice will progressively increase in size. Tone generally is “marked” in light anesthesia, “moderate” in medium anesthesia, and “flaccid” in deep anesthesia.
The degree of muscle relaxation observed in the patient depends not only on anesthetic depth but also on the patient signalment and the agents used. For example, dogs with very strong muscles of mastication (such as Rottweilers) will have higher tone than dogs with smaller jaw muscles. This reflex is unreliable in pediatric patients (which normally have little tone regardless of the plane). Tone is generally decreased in patients receiving benzodiazepines, alpha2-agonists, and other muscle relaxants, absent in patients receiving neuromuscular blockers, and increased in patients receiving cyclohexamines.
Jaw tone is not useful in large animal patients as their large masseter muscles (for chewing and grinding plant material) and relatively small mouth opening make it impossible to detect changes in muscle tone.
TECHNICIAN NOTE
In small animals and ruminants the eye is generally central during light anesthesia, ventromedial during medium anesthesia, and central during deep anesthesia. In horses the eye can rotate in any direction, and sometimes the eyes will rotate in opposite directions. Generally rotation of one or both eyes indicates adequate anesthetic depth for surgery.
Eye Position: Eye position refers to the orientation of the cornea in relation to the palpebral fissure. Eye position changes from central to ventromedial (the patient appears to be looking toward its chin) and back to central with increasing anesthetic depth, although there is considerable variation among individuals in exactly when these changes occur (Figure 5-31). When the eye is ventromedial, only the sclera and conjunctiva are visible, which precludes assessment of the pupil size and the PLR. In small animals the eye is generally central during light anesthesia, ventromedial during medium anesthesia, and central during deep anesthesia. Some anesthetics (e.g., ketamine) do not cause eye rotation, even at moderate anesthetic depth. Eye position in ruminants is often similar to that in dogs, and the eyes rotate ventromedially during surgical anesthesia. In horses the eye can rotate in any direction, and sometimes the eyes will rotate in opposite directions. Generally rotation of one or both eyes indicates adequate anesthetic depth for surgery. The eyes of swine are quite sunken and are often unhelpful when trying to determine depth of anesthesia in pigs.
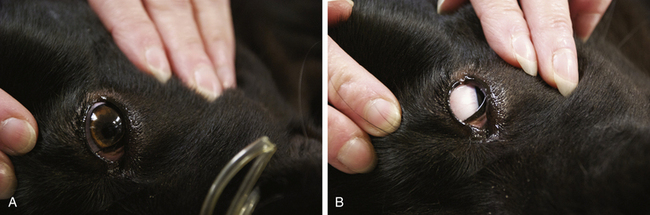
Pupil Size: The size of the pupil also varies with anesthetic depth; pupils are dilated (mydriatic) during stage II anesthesia, are normal or constricted (miotic) during light surgical anesthesia, progressively dilate as anesthetic depth increases, and are widely dilated during deep anesthesia (Figure 5-32). This indicator is influenced by drugs, however, including opioids, cyclohexamines, and parasympatholytics.
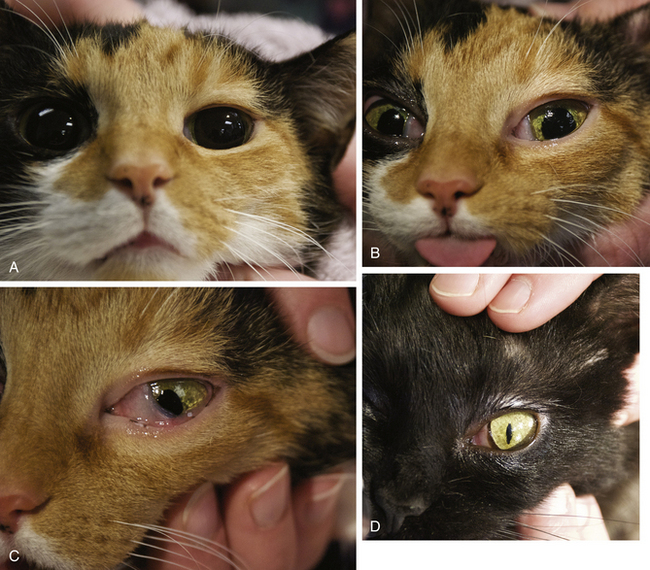
Nystagmus: Nystagmus is an oscillation of the eyeballs that is commonly seen in horses during certain planes of anesthesia. Fast nystagmus occurs in very light anesthesia (including recovery) and gradually slows as the anesthetic depth increases (or once anesthesia wears off at the end of the procedure). Very slow nystagmus may still be present as a “roving eye” during medium anesthesia. In horses in which this occurs, one eye is rotated either rostrally or caudally, and the other eye remains central or rotated in the opposite direction (“divergent eye signs”). After a period of time the eyes will then very slowly rotate to the alternate position. This eye movement pattern is typically associated with an adequate plane of anesthesia for surgery.
Ruminants and small animals rarely show nystagmus under anesthesia.
Salivary and Lacrimal Secretions: The presence or absence of salivary and lacrimal secretions may give clues about anesthetic depth, particularly in an animal that has not received anticholinergics. Normal production of tears and saliva diminishes with increasing anesthetic depth and is totally absent in deep surgical anesthesia. A lack of production is recognized as a dry appearance to the cornea, in which it loses its glistening appearance, and tacky mucous membranes. Because of the relative absence of tears, the use of ophthalmic artificial tear drops or ointment every hour is advised for all animals undergoing general anesthesia. Note that application of ointment may decrease the ability to test the corneal reflex. Atropine ointment should not be used because it causes significant pupil dilation. In horses, increased lacrimation and salivation indicate light anesthesia.
Heart and Respiratory Rates: Although not reliable indicators of anesthetic depth, HR and RR can be used to supplement other data. Both values tend to decrease as anesthetic depth increases, and increase as anesthetic depth decreases. Caution should be used in interpreting both HR and RR because each is subject to many influences in addition to anesthetic depth. For example, HR increases in response to a fall in BP. HR and RR may also increase in response to surgical stimulation or to a painful stimulus.
Some anesthetic drugs and adjuncts (e.g., cyclohexamines and parasympatholytics) increase HR, whereas most other agents decrease HR. Bradycardia may be induced by endotracheal intubation or manipulation of the eye as would occur during ocular surgery. Hypercarbia (high Paco2) and hypoxemia (low Pao2) can also increase RR.
TECHNICIAN NOTE
An increase in HR, RR, or BP in response to surgical stimulation does not usually reflect a conscious perception of pain. The anesthetist should not necessarily interpret these signs as an indication that the animal’s anesthetic depth is inadequate unless other evidence supports this conclusion.
Response to Surgical Stimulation: Surgical stimulation (e.g., incising the tissue, manipulating viscera, manipulating bones during fracture repair, or pulling on the suspensory ligament of the ovary may cause an increase in HR, RR, or BP. These responses do not usually reflect a conscious perception of pain. The anesthetist should not necessarily interpret these signs as an indication that the animal’s anesthetic depth is inadequate unless this conclusion is supported by other evidence. Minor changes in HR during surgery are considered normal, and in fact are absent when anesthetic depth is excessive.
Judging Anesthetic Depth
During the course of anesthesia, the anesthetist should monitor as many variables as possible and weigh all available evidence before judging the anesthetic depth of the patient. No one piece of information is unfailingly reliable, and it is unwise to determine the anesthetic plane by monitoring only one or two reflexes or vital signs. In addition, each animal is unique and has an individual response to increasing anesthetic depth. For example, many animals develop bradypnea and hypoventilation shortly after induction with injectable general anesthetics, while still in a light plane of anesthesia. If RR is used as the sole criterion for judging anesthetic depth, the animal that develops respiratory depression may be incorrectly judged to be too deeply anesthetized. Decreasing the concentration of anesthetic delivered to such a patient might easily result in the patient’s becoming dangerously lightly anesthetized. Observation of the other indicators of anesthetic depth would likely give the anesthetist a more balanced view of the situation and a more accurate assessment of true anesthetic depth. Examples of the use of judgment in interpreting anesthetic depth are given in Box 5-6.
Similarly, observation of the amount of anesthetic being delivered to the patient (e.g., the vaporizer setting) does not in itself indicate the patient’s anesthetic depth. Although high vaporizer settings result in increased delivery of anesthetic to the patient and, subsequently, an increase in anesthetic depth, there is tremendous variation in patient response. This variation results in part from the patient’s response to the anesthetic and in part from the influence of other drugs given to the animal. One animal may be maintained at stable surgical anesthesia with a vaporizer setting of 3% isoflurane, whereas another animal may require 2%, and still another may be satisfactorily maintained at 1.5%. The concentration of anesthetic gas received by the animal also is not necessarily the concentration indicated by the vaporizer setting; it may vary with the oxygen flow rate, the quality of respirations, and other factors (see Chapter 4). Nevertheless, the vaporizer setting and the length of time for which the animal has been anesthetized are additional evidence that must be considered. The basic rule is that if there is doubt about the level of anesthesia in a particular patient, one should decrease the vaporizer setting and continue to monitor the animal closely.
RECORDING INFORMATION DURING ANESTHESIA
The objectives of the ACVA monitoring guidelines for record keeping are as follows:
To meet these objectives, the ACVA makes the following recommendations:
“1. Record all drugs administered to each patient in the peri-anesthetic period and in early recovery, noting the dose, time, and route of administration, as well as any adverse reaction to a drug or drug combination.
2. Record monitored variables on a regular basis (minimum every 5 to 10 minutes) during anesthesia. The minimum variables that should be recorded are heart rate and respiratory rate, as well as oxygenation status and blood pressure if these were monitored.
3. Record heart rate, repiratory rate, and temperature in the early recovery phase.
4. Any untoward events or unusual circumstances should be recorded for legal reasons, and for reference should the patient require anesthesia in the future.”
Complete and accurate medical records are a legal requirement in veterinary practice. Most jurisdictions require that some form of anesthetic record be maintained during anesthesia. In many cases this record can be in the form of a logbook in which information is listed, such as the date, client and patient identification, preoperative physical status, nature of the procedure performed with the patient under anesthesia, and the anesthetic protocol. A brief description of the animal’s response to anesthesia should also be given. Records of this type allow the veterinarian to review the total number of anesthetic procedures that have been carried out in a given period and determine the frequency and nature of complications. This information may be helpful in assessing the anesthetic protocols. Controlled substance logs must be meticulously maintained to document use of benzodiazepines, opioids, cyclohexamines, barbiturates, and other controlled drugs.
In addition, medical information regarding the anesthetic procedure must be written in the patient’s record. This allows the veterinarian to quickly review the animal’s anesthetic history and may be helpful in determining the best anesthetic protocol to use for future procedures. For example, if the record indicates that the animal was anesthetized with a barbiturate agent and experienced a lengthy recovery, the veterinarian may choose to anesthetize the patient with an alternative agent in the future. On the other hand, if a patient with a preexisting disease was recently anesthetized without incident with a particular agent, the veterinarian would be justified in using the same agent for the next anesthesia.
In some practices, an anesthesia form such as shown in Figure 5-33 is used to record a detailed description of an anesthetic procedure. This type of record contains information on the patient’s preoperative status (e.g., vital signs and the results of diagnostic tests), the anesthetic protocol used (including fluids administered and the amounts of drugs given), the patient’s vital signs throughout anesthesia (e.g., pulse, respiration, BP, temperature, and laboratory results), the time at which anesthesia commenced and was terminated, the beginning and end of surgery, and the time required for recovery. Typically, the information is recorded chronologically to allow an overview of the patient’s responses at every point throughout the procedure. Figure 5-34 is an example of a completed record. Detailed records of this type are not commonly used in veterinary practice; however, they are common in teaching, referral, or research institutions.
FIGURE 5-33 Anesthesia record. This is an example of an anesthesia record used to document the anesthetic procedure.
FIGURE 5-34 Completed anesthesia record. Looking at this finished record permits all details of this procedure to be easily reviewed, including patient data; doses, times, and routes of administration of all agents, adjuncts, and fluids; physical and machine-generated monitoring parameters; and detailed observations about the procedure.
KEY POINTS
1. The American College of Veterinary Anesthesiologists (ACVA) has published guidelines for anesthetic monitoring intended to help veterinary anesthetists make sound monitoring decisions.
2. During any anesthetic procedure, the anesthetist must monitor the animal closely to ensure that the patient is safe and that the degree of central nervous system (CNS) depression or anesthetic depth is appropriate.
3. Effective monitoring is based on the principle that at any given anesthetic depth, monitoring parameters show predictable responses. Much discernment is required on the part of the anesthetist to interpret the significance of these parameters, however.
4. Knowledge of the anesthetic stages and planes give the anesthetist a framework for meaningful interpretation of monitoring parameters.
5. The objectives of surgical anesthesia are that the patient does not move, is not aware, does not feel pain, has no memory of the procedure afterwards, and has stable cardiopulmonary function.
6. Physical monitoring parameters can be grouped into one of the following three classifications: 1, vital signs; 2, reflexes; and 3, other indicators of anesthetic depth.
7. Vital signs (including heart rate and rhythm, pulse strength, capillary refill time, mucous membrane color, respiration rate and depth, and temperature) are most helpful to determine if the patient is safe.
8. Reflexes (including the laryngeal, swallowing, pedal, palpebral, corneal, and pupillary light reflex) and other indicators (including spontaneous movement, muscle tone, eye position, pupil size, response to surgical stimulation, lacrimation, salivation, and nystagmus) are most helpful to determine if the anesthetic depth is appropriate.
9. Physical and machine monitoring parameters can be grouped according to whether they assess circulation, oxygenation, ventilation, or anesthetic depth.
10. Monitoring equipment, although not mandatory for effective patient monitoring, generates data (including oxygen saturation, arterial blood pressure, cardiac electrical activity, inspired and expired CO2 levels, blood gases, heart rate [HR], respiratory rate [RR], and tidal volume [VT]) that help the anesthetist accurately assess patient status. This equipment often warns of impending problems early, so that the anesthetist can take action before they reach crisis level.
11. Effective monitoring requires the anesthetist to memorize normal monitoring parameters and to know what levels signal a need to inform the veterinarian-in-charge (VIC).
12. The anesthetist must keep accurate and complete records of anesthetic procedures, the nature of which will vary depending on the clinical situation.
REVIEW QUESTIONS
1. With most injectable and inhalant anesthetics, there is generally a progressive depression of cardiovascular and respiratory function as the depth of anesthesia increases.
2. The plane of anesthesia most suitable for surgical procedures is generally considered to be:
3. Breath holding, vocalization, and involuntary movement of the limbs are most likely an indication that the animal is in what stage or plane of anesthesia?
4. Anatomic dead space is considered to be the:
a. Air within the breathing circuit
b. Air within the digestive tract
c. Air within the trachea, pharynx, larynx, bronchi, and nasal passages
5. The minimum acceptable heart rate for an anesthetized large breed dog is __________ bpm.
6. If the ECG is normal, the heart must be beating normally.
7. In general, a respiratory rate of less than __________breaths/min in an anesthetized dog should be reported to the veterinarian.
a. An increase in respiratory depth (tidal volume)
b. An increase in respiratory rate
9. A patient that has been anesthetized will often have a:
10. An animal that is in a surgical plane of anesthesia should not respond in any way to any procedure that is being done to it (e.g., pulling on viscera should not change heart rate).
11. A 20-kg dog has been anesthetized by mask induction with isoflurane and after intubation is maintained on 2% isoflurane with a flow rate of 2 L of oxygen per minute. The heart rate is 80 bpm, respiratory rate is 8 breaths/min and shallow, the jaw tone is relaxed, and all reflexes are absent. This animal is most likely in what stage of anesthesia?
12. Pulse oximetry allows accurate estimation of:
13. During anesthesia, a mean arterial blood pressure of less than 60 mm Hg indicates:
14. A pulse oximeter reading of 89% indicates:
15. An ETco2 level of 65 would commonly be caused by:
16. Regarding oxygen transport:
a. Most oxygen travels in the blood dissolved in plasma.
b. Spo2 is an accurate indicator of oxygen available to the tissues even in anemic animals.
c. Pao2 is closely related to Spo2 (as one goes up, the other does also).
d. When a patient is breathing 100% oxygen, the Pao2 is expected to be in the range of 100 to 120 mm Hg.
For the following questions, more than one answer may be correct.
17. Which of the following statements about body temperature is/are correct?
a. Body temperatures of 32° to 34° C (89.6° to 93.2° F) cause prolonged anesthetic recovery.
b. Dangerous CNS depression and changes in cardiac function may be seen at body temperatures less than 32° C (89.6° F).
c. Ideally, IV fluids should be warmed to about 37.5° C (approximately 100° F) before administration to surgery patients.
d. Circulating warm water blankets should be set at 45° C (approximately 111° F).
18. Which of the following statements about nystagmus as a monitoring tool is/are accurate?
a. Nystagmus is commonly seen in horses in very light anesthesia.
b. Nystagmus is not a useful indicator of anesthetic depth in small animals.
c. In a horse, a “divergent eye sign” is typically associated with an adequate plane of anesthesia for surgery.
19. Pale mucous membranes commonly indicate:
20. An animal under stage III, plane 2, anesthesia would exhibit which of the following signs?