Chapter Twenty Four Synthesis of research evidence
Introduction
The research papers published in scientific and professional peer-reviewed journals contain the basic information currently available for understanding the causes and consequences of health problems. Each research publication contributes to the overall knowledge regarding a health problem. However, given the problems of generalization, an individual research project is usually insufficient for firmly deciding the truth of a hypothesis or the efficacy of a clinical intervention. In order to understand the progress of a research programme (Ch. 1) we need to compare, contrast and synthesize the results of related research papers. Consistent results across diverse research reports are the most appropriate bases for justifying the delivery of health services.
The term literature refers to the set of publications containing the network of theories, hypoth-eses, practices and evidence representing the current state of knowledge in a specific area of the health sciences. A literature review contains both the critical evaluation of the individual publications and the identification of emergent trends and patterns of evidence. The literature review is a synthesis of the available knowledge in an area and therefore constitutes the strongest foundations for initiating further advances in theory and practice.
The overall aim of this chapter is to outline the basic strategies used for synthesizing evidence and producing a literature review.
Basic principles
The first thing to consider is that writing a literature review is a demanding intellectual challenge. The facts do not ‘speak’ for themselves. Rather, the evidence has to be extracted, critically evaluated, organized and synthesized into a logical, coherent representation of the current state of knowledge. For example, consider the review by Olanow (2004) tilted ‘The scientific basis for the current treatment of Parkinson’s disease’. This relatively brief 15-page review is based on only 75 references, although there are thousands of research papers, articles and reports available on the anatomy, physiology and treatment of Parkinson’s disease. In writing the review, the author had to make a series of expert judgments regarding which were the nine key papers, containing the most salient, up-to-date information for understanding the medical treatment of Parkinson’s disease.
Second, the outcome of the review process is influenced by the theoretical orientation and professional background of the reviewer. Olanow, a leading neurologist, provided an authoritative review written from a biomedical perspective. In contrast, a physiotherapist working in neurological rehabilitation might take a different conceptual approach to the causes and treatment of Parkinson’s disease. He or she might place more emphasis on psychological and social factors as integral components of the etiology and treatment of Parkinson’s disease.
Third, the selection, analysis, critique and synthesis of the materials is an active, interpretive process drawing on the personal experiences, interests and values of the reviewer. Even if their professional backgrounds were identical, there are no guarantees that two reviewers interpreting the evidence from the same set of publications will arrive at exactly the same conclusions. Depending on how these reviewers approached the subject matter, they might emphasize different aspects of the evidence or select different patterns in the data as being important, resulting in different syntheses. In Chapter 1, we discussed the post-positivist position that theories and preconceptions can influence our perceptions of what is happening in the world, and therefore shape the way in which we construct knowledge.
Last, the notion that we all have our experiences, opinions and prejudices does not imply that ‘anything goes’ when writing health sciences reviews. On the contrary, we need to apply the principles of scientific methodology to ensure that we provide an accurate overview of the literature. In other words, there are principles which we must follow in preparing a literature review.
As stated before, in preparing literature reviews and evaluating research findings, a multiplicity of papers must be considered, at least according to the following general steps:
Systematic reviews
There are several approaches to conducting health sciences reviews. For example, the previously mentioned review by Olanow (2004) can be classified as a ‘narrative’ review. This approach entails producing a ‘story-like’ overview of the state of current evidence and theories. Although reviewers adhere to the principles of science and logic in conducting a narrative review, there have been concerns about bias and lack of clarity. More recently, systematic reviews and meta-analyses have been introduced to enhance the rigour for combining and interpreting the state of the literature. Systematic reviews rely on the explicit use of the methodological principles discussed in previous chapters. In effect, systematic reviews follow the problem-solving approach as used for conducting empirical research (Schwartz & Polgar 2003, Ch. 14). Let us examine a published example (Polgar et al 2003) to illustrate the logic and principles underlying the conduct of systematic reviews.
Research questions
When conducting a systematic review, we are expected to formulate a clear research question which will be answered by the outcomes of the review. You might have read about the current research using embryonic or stem cells for reconstructing the brains of people suffering from neurological conditions such as stroke and Parkinson’s disease. We were interested in reviewing the evidence for answering the research question ‘How effective is reconstructive neurosurgery (i.e. the grafting of immature cells) for improving the signs and symptoms of Parkinson’s disease?’ (Polgar et al 2003).
Theoretical framework
Although this principle is not adhered to by all reviewers, it is very useful to specify the theoret-ical framework(s) which guides a specific review. The theoretical framework used for conducting the review was identified as the ‘Repair Model’. This is a purely biomedical, quantitative view of neural reconstruction based on the notion that recovery is due to the replacement of dopaminergic cells damaged in Parkinson’s disease. An explicit theoretical framework is essential for understanding a given area of health as a coherent research programme (Ch. 1).
Search strategy
The next step is to identify the relevant publications. For example, in Polgar et al (2003) we conducted the following search:
A search of MEDLINE (1994–2000 and 2000/01–2000/10) using the exploded terms fetal tissue transplantation, Parkinson’s disease, human or fetal tissue transplants, Parkinson’s disease, human, also using the author Kopyov was conducted. In conjunction with this search, abstracts from the American Society for Neural Transplantation and Repair conferences (1999; 2000) were hand searched for authors that may have been overlooked. The reference lists of key papers were searched to identify papers that might not have been identified through on-line search mechanisms. An additional electronic search was conducted using the following databases: Medline (1966–March Week 2, 2001), Embase (1994–April Week 1, 2001), CINAHL (1982–March Week 2, 2001).
The general point here is that reviewers must be diligent in identifying all the publications which constitute the literature in the area targeted for review. The search should include both ‘electronic, on-line searches’ and ‘hand’ searches of key journals for cross-checking if the relevant papers were identified by the search engines. It is essential to have a working knowledge of who the key researchers are in a particular field and what critical issues exist in a research programme before we can undertake a formal published review.
Selection of key papers
Depending on the area of health sciences being reviewed, literature searches might yield any number of publications, from one or two to many hundreds. Relying on the outcome of the search, the reviewers might restate the research questions and redefine the scope of the proposed systematic review. This will expand or restrict the number of studies for further searchers. In addition, explicit inclusion/exclusion criteria are used to identify the most relevant sources. For example, Polgar et al (2003) used the following criteria for including a study in a review. In order to be included in the review, a study had to:
It would be tedious in the present context to explain the specific reasons for each of the above selection criteria; interested readers will find that they were justified in the original review. The point is that we must have explicit, objective criteria for including or excluding studies.
The key papers function as a sample of the best available information accessible in the literature. Parallel to empirical research, we use the evidence from key papers to draw inferences about the state of knowledge in the area under review. The use of diagnostic searches and explicit inclusion/exclusion criteria ensure that the ‘sample’ of papers produces a representative, rather than biased, sample of the overall knowledge.
Coding the research studies
When the process of selecting and collecting the publications is complete, we have the available evidence relevant to answering our research question. The information that we seek is embedded in the text of research publications. We need to extract the key information from the text of each of the papers selected for the review. We can approach the analysis of the meaning of this information in a way that is similar to qualitative data analysis (Ch. 21). Similarly to the predetermined codes used in content analysis, reviewers use the constant features of quantitative research for identifying the categories appropriate for analysing the key papers (Schwartz & Polgar 2003). These features include:
Other dimensions or features might also be coded or the above features can be modified according to the judgments of the authors. These aspects of the research process are often presented in a table form, as shown in Table 24.1. We used a hypothetical example rather than the previous published review.
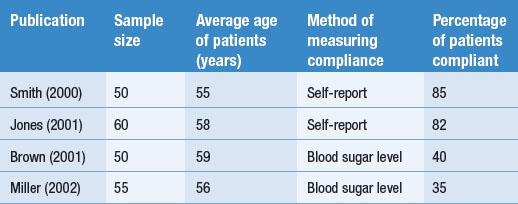
To illustrate coding, consider a set of four hypothetical studies reporting on levels of diabetics’ compliance to insulin administration. The results and key features of the hypothetical studies are tabulated in Table 24.1.
Table 24.1 represents how findings from several publications might be tabulated. Key information about each study, as well as the outcomes, is presented in the table, enabling the emergence and demonstration of an overall pattern.
Interpretation of the evidence
The coding of the hypothetical studies enables the reviewer to answer the research question: ‘How compliant are patients with diabetes with using insulin?’ The hypothetical summarized evidence illustrates that sometimes no clear overall trends emerge from the tabulated findings.
In the simple hypothetical example shown in Table 24.1, the percentage of compliance reported by Smith (2000) and Jones (2001) is over twice that reported by Brown (2001) and Miller (2002). Clearly, there is an inconsistency in the literature. A possible explanation for this discrepancy might emerge by the inspection of Table 24.1. Neither differences in sample size nor the average ages of the patients provide an explanation for the difference. However, the method by which compliance was measured emerges as a plausible explanation. The investigators Smith and Jones relied on the patients’ self-reports and might have overestimated compliance levels, in contrast to Brown and Miller, who used a more objective method and found poor levels of compliance. Of course, this explanation is not necessarily true, but is simply a hypothesis to guide future investigations of the problem. There are other possibilities which might account for the pattern of findings. It appears that more research is needed.
Meta-analysis
Dooley (1984) discussed the availability of two general types of strategies for summarizing research findings from multiple papers:
Although many statistical procedures can be used for synthesizing data, meta-analysis also refers to an active area of statistics examining strategies most suitable for synthesizing published evidence. Statisticians have developed software packages such as ‘Comprehensive Meta-Analysis’ which expedite the computational difficulties entailed in synthesizing evidence from diverse studies (http://www.metaanalysis.com, info@metaanalysis.com).
Combining data from diverse studies
How are results synthesized? Let us look at a simple example for combining data. Say that you are interested in the average age of the participants in three related studies: A, B and C (Table 24.2).
Table 24.2 Participants’ ages in three hypothetical studies
| Study | Number of participants (n) | Average age ( ) ) |
|---|---|---|
| A | 80 | 40 |
| B | 50 | 45 |
| C | 100 | 60 |
Say we wish to calculate the average age for all the 230 participants in the three studies. Could we calculate the overall mean, , simply by adding up the three means and dividing by three? The answer is no, because there are different numbers of participants across the groups. We must give a weight to each of the statistics depending on ‘n’, the sample size for each study. The equation which we use is:
The point here is that, in order to calculate the correct overall statistics, we must give a weight to each study. In general, the weight assigned to a study represents the proportion of information the study contributes to the overall analysis. For the above calculation, weight was determined by the sample size used in each study. In general the weight assigned to a study represents the proportion of the information contributing to the calculation of the overall statistic.
Even the calculation of a simple statistic like ‘average overall age’ can be useful for understanding the state of a research programme. For instance, in Polgar et al (2003) we found that the mean age of Parkinson’s disease sufferers was 56 years, with the mean overall duration of the illness being 13 years. These results indicated that the average age of onset of the disease was only about 43 years, indicating that experimental reconstructive neurosurgery has been offered to an unrepresentative sample of Parkinson’s disease sufferers. Typically people with Parkinson’s disease are in their late sixties or early seventies.
Of course we need to synthesize other clinically and theoretically relevant statistics appearing across the papers constituting a research programme, including the overall pooled standard deviation, the overall statistical significance, the overall effect size and the confidence intervals for the overall effect sizes. These analyses are best carried out using statistical software packages. You can check the Internet for further information regarding the logic of meta-analysis and currently available software packages.
Interpreting the results of a meta-analysis
There are different ways for conducting and reporting the results of meta-analyses which have become quite frequent in the health sciences literature. A typical way of presenting the results is shown in Figures 24.1 and 24.2, which show the hypothetical outcome of a computer-assisted meta-analysis (modified from www.metaanalysis.com). The graphics shown in these figures are referred to as ‘forest plots’. A forest plot is a visual representation of the results of a meta-analysis.
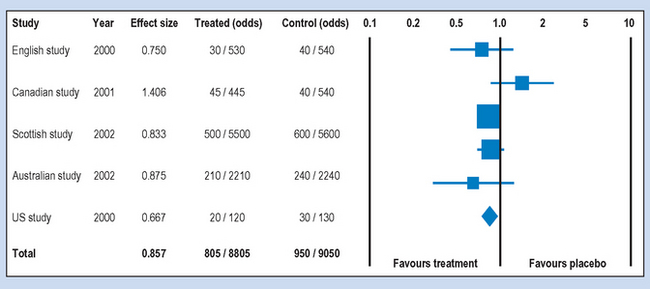
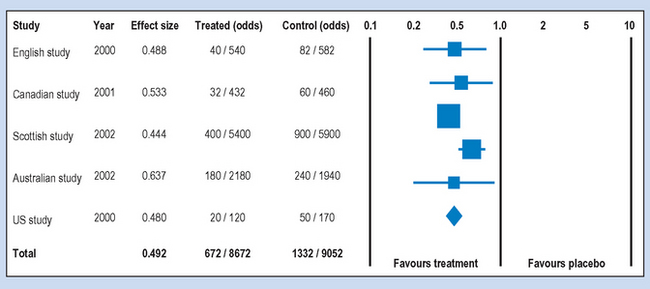
Say that the printout showed the results of five randomized double-blind trials (see Ch. 5) aiming to demonstrate the effectiveness of a vaccine for influenza. In each of the studies volunteers were given either the vaccine (treated) or a placebo (control) injection. The following features of Figures 24.1 and 24.2 are important for interpreting the outcomes of a meta-analysis.
Studies
Following searching and critical analysis of the relevant literature, as discussed previously, the reviewer selected the five papers shown. If you look carefully at the sample sizes in each of the groups under Treated (odds) and Control (odds), you will find that the sample sizes are not equal. If they represent randomized trials, you might ask why the groups were unequal in the studies. Sometimes unequal groups represent people dropping out because of harmful side effects to the treatment.
Effect
The effect size was represented as an odds ratio (OR), which is a commonly used statistic for outcomes measured on a nominal scale. For this measure the outcome is: diagnosed with influenza following vaccination or placebo over, say, 6 months: ‘yes’ or ‘no’. Looking at the first (English) study, the odds of ‘yes’ to ‘no’ are 30/530 for the treated group and 40/540 in the control group. The statistical software package computed an OR of 0.750, indicating a slight reduction in the odds of contracting influenza. Note that an OR = 1 means equal odds or no difference at all, while decreasing OR under 1.0 favours treatment. For example, an OR of 0.5 would indicate that the vaccination halved the odds for contracting influenza in the sample.
Confidence intervals
As we discussed in Chapter 17, a 95% confidence interval contains the true population parameter at p = 0.95. The lines produced from the ‘squares’ containing the sample OR represent the 95% confidence intervals. You can see in Figure 24.1 that all the confidence intervals for the five studies overlap with 1.0, indicating that we cannot infer that the studies favour the treatment.
Weights and totals
When you look at the ‘odds’ columns in Figures 24.1 and 24.2, you can see that there is a variation in the sample sizes used in the hypothetical studies. For example, the ‘Scottish’ study included 12200 participants, while the ‘US’ study included only 300 participants. These differences contribute to the relative ‘weight’ of the study represented graphically by the area of the ‘squares’ in the forest plots. Clearly, the larger the square, the greater the sample size. You will also note that the confidence intervals are wider with the smaller squares in comparison to the larger squares. As discussed in Chapter 20, the larger the sample size, the more ‘power’ we have for making accurate inferences.
The ‘Totals’ in Figures 24.1 and 24.2 refer to the overall statistics synthesized from the results of the five hypothetical studies. These statistics are represented by the diamond shapes on the forest plots. In Figure 24.1 the total OR was 0.857, indicating a very weak effect for the vaccination. The OR is close to one or equal ‘odds’ for having influenza. For the results shown in Figure 24.2, the total OR was 0.492. This represents a strong effect, indicating that the odds for contracting influenza would have been more than halved by the vaccination. Such results are suggestive of the clinical or practical significance of introducing the treatment.
Validity of systematic reviews
The interpretation of the results of published meta-analyses is far more difficult than indicated in the above example. Let us look at some of the sources of difficulties.
Sampling
The results reported in the papers selected for review generally represent a sample of the total information published in a field. This leads us to the first problem: studies that do not report statistically significant findings are often not submitted or accepted for publication. By not having access to these ‘negative’ findings, the selection of papers becomes biased towards those with reported ‘positive’ outcomes. Also, in published research papers where outcomes for multiple dependent variables are reported, only the statistically significant outcomes are reported, undermining attempts to synthesize the evidence accurately (Polgar et al 2003).
In addition, the exclusion/inclusion criteria used for selecting the studies can result in a sampling bias. Some practitioners of evidence-based medicine (e.g. Sackett et al 2000) are reluctant to include studies which have not adopted a ran-domized experimental design. While this approach has strong methodological justifications, valuable information can be lost by using highly selective inclusion criteria. Of course, the more information that is lost, the weaker the external validity of the review or meta-analysis in relation to the ‘population’ of research results constituting a research programme. The reduced external validity is a trade-off for including only methodologically stronger studies in the review.
Extracting the data
Another source of error arises when extracting the data from an individual meta-analysis. Some authors report very clear, descriptive statistics but others report their results in an obscure, uninterpretable fashion. Also, some journals and authors only discuss the statistical significance of the results. Obscure and incomplete reporting of the evidence leads to errors in synthesizing overall statistics.
The state of the research programme
The validity of a systematic review or meta-analysis is limited by the methodological rigour and statis-tical accuracy of the studies selected for review. To put it bluntly, many health-related problems cannot be resolved and questions cannot be answered on the basis of the currently available evidence. An inconclusive systematic review or meta-analysis is not necessarily a waste of time. Although inconclusive attempts to synthesize data cannot be used to make valid clinical decisions, they provide strong evidence for gaps in knowledge and provide objective grounds for identifying further research required to advance the research programme (e.g. Polgar et al 2003). Until better evidence becomes available we simply provide the best practices suggested by tradition and experience.
The Cochrane Collaboration
Cochrane (1972), a Scottish medical practitioner, was one of the first influential practitioners in the modern era to advocate the systematic use of evidence to inform clinical practice.
In recognition of Cochrane’s pioneering work, the Cochrane Collaboration, the Cochrane Library and the Cochrane Database of Systematic Reviews were established. The Cochrane Collaboration is now a large international venture with a series of special-interest groups commissioning and maintaining reviews on a wide range of topics. There are also detailed protocols that have been established for the conduct and presentation of Cochrane systematic reviews. Although the scope of the Cochrane database is very broad, much of it is quite focused on intervention research, i.e. what intervention approaches work best for specific health problems and populations. The database is now expanding into other areas but there is a strong intervention focus.
The Cochrane approach adheres to a hierarchy of evidence. There are five levels of evidence, with systematic reviews of multiple randomized controlled trials at the top, followed by single randomized controlled trials, evidence from trials without randomization but with pre–post, cohort or time series measurement, evidence from non-experimental studies and, at the bottom level, opinions of respected authorities. Many reviews, however, only focus on the top two levels of the evidence categories. Obviously, because of the intervention-oriented nature of many Cochrane reviews, qualitative research, case study and policy research do not yet figure prominently in this system.
The Cochrane Database of Systematic Reviews is available on a wide range of websites in different countries. Access arrangements for the reviews vary widely from country to country. In some countries some fees are payable, but in others, such as Australia, the government has taken out a national subscription so that access may be freely available. In order to access the database, we suggest that you use a search engine to search for ‘Cochrane Collaboration’ and follow the links or consult your librarian.
Evidence-based practice
Although the name of evidence-based medicine or evidence-based practice is relatively new, the idea of using research evidence to inform the design of clinical interventions is very old. Muir Gray (1997) provides a very good review of this approach. The quality movement in health care, at which commentators such as Donabedian (1990) have been at the forefront, has also been influential in promoting the need for the systematic use of evidence to promote the delivery of high-quality health care.
As Muir Gray (1997) notes, evidence-based practice has at its centre three linked ideas. These are how to find and appraise evidence, how to develop the capacity for evidence-based decision making and how to get research evidence implemented into practice. The finding and appraising of evidence draw heavily upon systems such as the Cochrane Collaboration approach where evidence is systematically collected and appraised according to pre-defined principles and protocols. However, the facilitation and implementation elements of evidence-based practice are important additions to the basic establishment of research evidence to support particular approaches in the provision of health services. The evidence-based practice movement is based upon the recognition that the mere existence of evidence for the effectiveness of particular interventions does not mean that it will necessarily be effectively implemented. This is the new element of evidence-based practice, the systematic implementation of programmes based upon sound research evidence.
Summary
We have seen in this chapter that the advancement of knowledge and practice depends not only on the results of individual research projects but also on the information provided by the synthesis of the results across the literature. Where the projects share the same clinical aims and theoretical frameworks, they are said to constitute a research programme. In this chapter we outlined the process of identifying and selecting publications which contain theoretically or practically relevant research findings. We argued that reviewing a research programme is an active, creative process which is influenced by our expectations and attitudes. While absolute objectivity is not a realistic requirement of a reviewer, there are basic rules to ensure that the review of the evidence is carried out with a minimal degree of bias.
A systematic review of the literature proceeds by identifying the basic components of research papers for organizing the evidence. We use these dimensions to identify patterns or trends which enable us to synthesize the information and answer the research questions. When studies are sufficiently similar, their results can be condensed into single statistics such as overall effect size. In this chapter, we examined how the results of meta-analyses are interpreted.
The relationships between the state of a research programme and practice are very complex. We examined hypothetical situations where there was a strong consistency in the research findings and clear trends emerging in the literature could be identified. In these cases, applying the results is relatively straightforward in that we can either adopt or reject the use of a treatment on the basis of the evidence. Systematic reviews and meta-analyses are essential means for identifying best practices available for our patients. However, even well-conceived reviews and meta-analyses can fail to identify clear trends or clinically meaningful effect sizes. When the evidence is inconclusive, we simply continue with traditional practices and identify further research required for resolving unanswered questions concerning improved efficacy. In this way research in the health sciences is a continuous process, producing better information for advancing theory and practice, as we discussed in Chapter 1 of this book.
Self-assessment
Explain the meaning of the following terms: