Preparing and Organizing Data
After learning about various strategies that researchers use to collect information, you may be asking what exactly the investigator does with all this collected information.
When you begin to collect information, you will find that you quickly obtain a massive amount of data and that you need to organize and account for every piece of it in a meaningful way. In experimental-type research, even a small survey study may yield more than 100 variables or data points for analysis. Think about all the items you need to
ask about even if your study is small or a pilot. Information concerning the person's age, gender, other relevant personal characteristics, and living status are all important and common data points. Likewise, in naturalistic inquiry, a 1-hour interview may yield up to 50 or more pages of single-spaced typed narrative.
Organizing, or what we refer to as “managing,” all this information, whether the data take a numerical or narrative form, is an important action but is not usually discussed or written about by researchers. Most researchers learn to manage data through trial and error or by participating in the research process as mentored students or in graduate or postdoctoral training programs. Nevertheless, researchers in both traditions must engage in specific actions to prepare information for analyses that can be described and learned. This chapter discusses this specific action process—the action of preparing and managing information in each of the research traditions.
Managing data in experimental-type research
If you are conducting an experimental-type study, what type of data will you be collecting? Because you will be primarily interested in obtaining a quantitative understanding of phenomenon, your data will be numerical. The analysis of numerical data is an action process that is performed after all the data have been collected for the study. That is, at the conclusion of collecting data, you will have many numerical responses to each of your questionnaires, interviews, and observations.
 Consider a small study involving a survey of 100 students in a college of health professions. Assume the survey is designed to examine student satisfaction with the quality of health profession education. The survey will likely include a number of background questions, such as gender, level of education, financial assistance, marital status, and living arrangement of students. The survey will also include a scale that measures satisfaction with education, as well as a series of questions about other aspects of college life. As you will see, this type of study may have 50 to 100 items or variables that will be measured. In a study involving 100 students, this may represent a total of 10,000 data points that will be submitted to statistical analysis. Thus, even in a relatively small study, the amount of information obtained can be enormous and requires the assistance of computer technology.
After collecting all this information, what does the researcher do next? For experimental-type researchers, the primary action process is to prepare and organize the data first for entry into a computer program and then for statistical analyses. The researcher follows seven basic steps (Box 18-1).
First, the researcher must examine each interview or data collection form to check for missing information, double-coded responses, or unclear demarcations of responses. This information reflects possible interviewer errors that must be corrected before entering the numerical values into a computer program. The researcher should attempt to address all missing data before data entry. This step may require contacting respondents and seeking answers to missed questions or clarification for double-coded responses.
Second, the researcher must label each variable on the data collection instrument using a convention specified by the statistical package used. Statistical Analysis Software (SAS), Statistica, or the Statistical Package for the Social Sciences (SPSS) are three of the most popular, menu-driven, statistical computer programs that run on personal computers. Each package has a specific convention for labeling variables that is logical and straightforward.
Third, the researcher must decide the order in which the variables will be entered into a data entry computer program. Most researchers use the convention of placing each observation along an 80- to 120-column format (Table 18-1). Usually, each subject or research participant is assigned a unique identification number located in the first 10 columns of a line or row, depending on the length of the case identifier. If there is more than one line of data for a case, the subject identification number is repeated for each row of data. In Table 18-1, each number represents a response to a data collection instrument—in this case, a closed-ended questionnaire. These numbers are often referred to as a “raw data set” and form the foundation from which the experimental-type researcher performs statistical manipulations. A data set merely consists of all the numbers obtained through data collection, which are organized in the data entry program according to the format designed by the researcher. Data are usually entered in the order in which the items are sequenced on the data collection form.
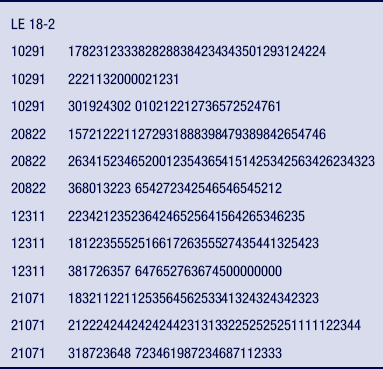
In Table 18-1, the first column on each line refers to the subject's group assignment (i.e., experimental or control group). Columns 02 through 04 refer to the personal identification number. Column 05 indicates the subject's gender (1 = male; 2 = female). Column 06 is blank, and 07 refers to the line number.
In the fourth step, the researcher establishes a computer-based control file that consists of a list of the variable labels. Also, a written or electronic record can be generated, referred to as a codebook or “data definition record.” This written record is a hard or electronic copy of the variable labels and the range or values that they represent. Some software statistical programs provide a separate window in which you can prepare a codebook simply by entering code information about your data set into menu-driven formats.
The fifth step involves entering the numerical values into a computer-based program by a scanner, automatically from Web-based data collection protocols, or by manual entry. Although there are a variety of data entry programs, they are basically similar. For small data sets (e.g., those under 50 variables), data entry can be conducted using a spreadsheet or database management program (e.g., Lotus 1-2-3, Microsoft Excel, FoxPro, Microsoft Access). For large data sets, it is preferable to use a computer-based program that has been specifically developed for the purpose of entering data. Most data entry computer programs enable the investigator to check for out-of-range codes, and some programs provide double verification. These are important quality-control features. Wild codes and out-of-range codes refer to errors in entering data in which characters or numbers entered in the program do not reflect the possible numerical scores assigned to the variable.
Assume the only responses to a question regarding marital status are 1 for “not married” or 2 for “married.” The data entry operator, however, inadvertently types a 3. A data entry program can be created that will signal the operator that an error has been made or that will not permit the score of “3” to be entered.
For manual entry, it is preferable to enter data twice, on two separate occasions. Then a comparative program can compare each numerical entry against itself, referred to as double verification. The program either alerts the key operator when a discrepancy between two entries occurs, or it allows the operator to inspect the two entries visually to determine discrepancies. For discrepant entries, the keyed responses must be manually checked against the original hard copy of the instrument to determine the correct value. Scanning data or direct entry of information at the moment it is being gathered eliminates the need for double verification. However, these approaches are not 100% accurate either, and the data that is entered stills needs to be checked to ensure accuracy.
The sixth step in preparing experimental-type data involves a process of “cleaning” the data that have been entered into the computer, regardless how data entry occurs. Cleaning data is an action process in which the investigator checks the inputted data set to ensure that all data have been accurately transcribed from the data collection instrument to the computer entry program. This action step is essential to determine the extent of missing information, to ensure that each response has been correctly coded, and to confirm that no errors were made in entering the numerical scores into the computer. For scanned data or direct entry of data at time of data collection, conducting logical checks of the data is one way to ensure accuracy. For example, let's suppose you enrolled only individuals 70 years of age or older. Checking the range of ages entered in the data set would be one way to detect potential errors.
If the age of a subject was entered in a data entry program as 27 years rather than the true age of 57, this error would certainly skew an understanding of the mean age and range of ages represented in the study sample.
Thus, one important way to inspect the data for errors is computing the frequencies of responses for each variable in the data set. In addition to checking frequencies, some researchers manually check a random number of lines of data against the original hard copy of the data collection instrument. Others use these methods in combination with printing raw data files sorted both by line and subject identification numbers. These printouts allow the researcher to visually inspect for misaligned data, as well as for wild and out-of-range codes. However, this kind of quality check is not possible or necessary when data is directly entered into a Web-based or other data entry program.
In Chapter 15, we discussed the possibility of having either random or systematic errors. Data entry represents a possible source of random error.
Think about a particular study you plan to conduct or about which you have just read in a journal. Consider the way in which you will enter the information you will collect. What are the possible data errors that might occur with the method you chose? How can the researcher address them? Researchers use many techniques to clean data and reduce sources of random error.
Assume you use a scale to ascertain the level of dependence in basic activities of daily living of the study sample. The possible responses for each self-care item range from 4 for “completely independent” to 1 for “completely dependent.” When you compute the frequencies for each self-care item, you discover that “bathing” has two responses with a value of 5. You will immediately know by inspecting the frequencies that the data are not correct. You will need to identify the subject identification numbers of the two individuals with the out-of-range values, then manually check their interview forms to determine the source of the error. The error may have been made inadvertently by the interviewer or data entry operator.
As you can see, there are a number of ways to ensure quality of the data that are collected and entered and minimizing the possibility of random error at this stage of the research process. At the minimum, it is important for the investigator to conduct a careful and systematic examination of the raw data set and the initial frequencies of key variables. Although this examination is often a time-consuming task, it minimizes random error and increases the accuracy of the data set. You should not perform any statistical manipulations until the data have been thoroughly cleaned and are error free. Unfortunately, not every researcher will spend time cleaning data, but we recommend that, as in every other thinking and action process, careful thought be given to this action process as well.
The seventh step and final action to prepare data for analysis involves reducing the vast quantity of information to general categories, summated scores, or single numerical indicators. As you can see from the small excerpt of a larger data set (see Table 18-1), most studies generate an enormous amount of information. One of the first statistical actions taken by experimental-type researchers is to summarize information. Index development and descriptive statistical indicators, such as the mean, mode, median, standard deviation, variance, and other statistically derived values, reduce and summarize individual responses and scores. This summary process is often referred to as data reduction and is discussed in greater detail in Chapter 19. These scores are submitted to other types of statistical manipulations to test hypotheses and make inferences and associations.
Before the popular use of desktop computers, only huge data sets were analyzed on mainframe computers. Since the late 1980s, however, superior hardware and software have made computerized data analysis available to most researchers. There are many statistical analytical programs on the market, some more “user-friendly” than others and some more capable of complex computations. Among the most popular and powerful are SPSS (McGraw-Hill, New York) and SYSTAT (SYSTAT, Evanston, Ill.). SPSS is a software program that can run many types of statistical computations on large data sets. Both SPSS and SYSTAT are menu driven and relatively easy to use. In SPSS and SYSTAT, the user selects a statistical computation from a menu and is then prompted with a series of branches to perform the next step. Each program has its advantages and disadvantages.
There are many other statistical programs. You can even find statistical software online for free. We advise that you carefully select one with the assistance of a statistician that fits your data analysis needs. Even with the use of computers, it is necessary to have a conceptual understanding of the range of available statistics offered in software programs.
Quantitative approaches to the analysis of data are well developed (see Chapter 19). Each statistical test has been developed and refined as computer technologies and the field of mathematics have advanced. There are clear and explicit rules as to when, how, and under what circumstances specific statistical analyses can be used. Because data must fit specific criteria for any analytical technique, you must be concerned with how you intend to measure concepts. As discussed in Chapter 16, the measurement process will determine the type of data you will obtain and, subsequently, the type of analyses you can perform.
Managing data in naturalistic inquiry
As you can see, preparing a data set in experimental-type research involves a set of action processes that proceeds in a linear or step-by-step fashion and is somewhat independent from analytical actions. Although certain analytical actions require the data to be set up in specific ways, data sets represent a necessary action step before analytical actions, and as such, they are relatively independent of analysis. This is not the case for naturalistic inquiry. In this tradition, organizing data is integral to the analytical process and is in fact an analytical action.1 Thus the separation of data setup from analysis, as we have shown here, is an artifact of book writing rather than a representation of what actually occurs in the conduct of naturalistic inquiry. As such, we discuss aspects of organizing information and return to this action in Chapter 20, which focuses on analysis.
Therefore, as you can surmise, if your research involves naturalistic inquiry, your approach to data management, data cleaning, and data reduction and analysis is different from that used in experimental-type research. In what ways do you think naturalistic data management will differ from quantitative approaches?
First, you will be primarily interested in obtaining a qualitative understanding of phenomena. Your data will be primarily narrative, or text based, but can also include other types of data, such as artifacts, physical or virtual images, video frames of nonverbal behaviors, films, and so forth. Second, the process of analysis will be ongoing and linked to the process of collecting information. The integration of the actions of data collection and analysis is a critical aspect of naturalistic designs and is referred to as the “interactive process.” Third, you must manage the enormous amounts of information that you obtain as you conduct fieldwork and engage in the process of collecting information. The type of analysis that will be conducted influences how the data are set up and managed.
The analytical strategies employed by researchers who use naturalistic inquiry are varied and explored in Chapter 20. Most analytical strategies are designed to transform the volumes of interview transcripts, audio recordings, video recordings, field notes, images, and other electronic and observational information into meaningful categories, taxonomies, or themes that explain the meaning and underlying patterns of the phenomenon of interest. Other analytical strategies are designed to explicate the essence of personal experiences as told to the investigator. As discussed in previous chapters, the information gathered in the various forms of naturalistic inquiry is not numerical but verbal and nonverbal manifestations that have been transcribed from a variety of information-gathering techniques and sources.
As shown in Chapters 15 and 17, there are many sources of data in naturalistic inquiry and, likewise, many analytical strategies. Furthermore, each data source and analytical strategy requires a somewhat different approach to managing the information that is gathered. For example, information that is derived from audio recordings is usually transcribed into written text or narrative, whereas data involving video recordings or images are visually examined and usually marked in terms of frames for repeated reviewing and interpretation. The most frequent approach to analysis, however, involves the written word or narrative; thus, the transcription of voice recording from interviews or field notes is an important aspect of most types of designs involving naturalistic inquiry.
Let us examine the process of managing the voluminous amount of narrative information that is obtained in a naturalistic study. It is important to note that in naturalistic inquiry, managing data is also an essential part of the analytical process. As we discuss here, some of the steps in managing qualitative data involve applying analytical techniques. Transcription is the first step in analyzing narrative and involves transforming an audiotape into a verbatim written record. The interviewer, the investigator, or a professional transcriber may transcribe an interview. One advantage of having the interviewer or investigator do the transcription is that the act immediately immerses the researcher into the narrative and informs the analytical process. Transcribing can be tedious, however, and a slow typist or someone unfamiliar with the transcription process may find it difficult and not a good use of his or her time. Although there are voice-to-text software packages available, it is important to evaluate their accuracy for rigorous transcription before using them. We expect that as the software technology is perfected, it will be used in transcription with greater frequency, significantly reducing the time burden of this important action process.
Transcription can be a time-consuming activity. You can expect an average of 6 to 10 hours of typing for each hour of interview recording, depending on the clarity of the tape, the density of the interview, and the typist's familiarity with the task, including, for example, names and subject matter. Explicit directions need to be given to a typist on how to handle the components of the voice recording. For example, you may want to record the number and length of pauses, silences, laughter, or repetitive phrases such as “uh huh.” The decision as to what to transcribe will depend on the purpose of the study and represents an analytic decision concerning the importance of such utterances.
After the completion of a transcription, you must check its accuracy; you will want to ensure that the typed version accurately represents the voice recording verbatim. In checking the transcription, you will also need to resolve misspellings and missing sections attributed to poor sound reproduction.
After cleaning the transcription, the investigator must become immersed in the data; that is, the transcription must be read multiple times to begin the analytical process. In the initial stages of any type of fieldwork, most investigators transcribe all voice recordings. As fieldwork progresses, however, the investigator may transcribe a random selection from each voice recording or a sample for complete transcription.2 Random selection is particularly useful for large-scale projects, such as in the tradition of classic ethnography in which the investigator increasingly selects which voice-recorded interviews are to be transcribed as the study unfolds.
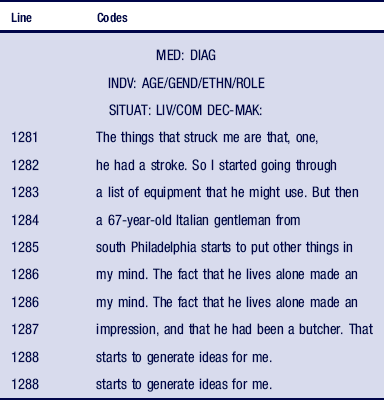
The short excerpt in Box 18-2 is taken from more than 100 pages of narrative derived from a transcription of a 2-hour voice recording. The voice recordings were generated from a focus group discussion involving six occupational therapists practicing in rehabilitation hospitals in Pennsylvania.3 In the focus group, therapists were asked to review a case vignette that involved an older man in rehabilitation after experiencing a cerebrovascular accident (CVA). Therapists were specifically asked to discuss the process by which they would select and provide instruction to this patient in the use of assistive devices.
These excerpts represent precoded, corrected versions of the transcript and illustrate one type of data in naturalistic inquiry. Consider this transcript and the other types of data that could have been collected from in-depth interviews and personal field notes. Think about all these written words; you can quickly obtain an appreciation of the volume of information that is generated in this type of research. These written forms of data can quickly become voluminous, and the researcher must set up multiple files that are cataloged to facilitate cross-referencing and easy access to its “bits and pieces.”
Transcription is only one aspect of preparing data for analysis. It is also critical to establish a system to organize information. On the most basic level, you will need to establish a log of each voice recording and the date of its recording. As you begin to identify categories of information, you will need to establish a system for easy retrieval of key passages that reflect these categories. It is also important to keep track of coding and analytical decisions as you read and review materials. Researchers use a variety of organizational schemes, depending on their personal style and preferences and the scope and needs of the research project. Some researchers use note cards and hand-code collected information. Others prefer to use word-processing programs or computer-assisted coding programs (e.g., Nudist, Zyindex, Ethnograph, Acculine).
In experimental-type research, computer-based statistical programs are a necessity and have facilitated the development of more sophisticated statistical tests. In naturalistic inquiry, computer-based coding programs assist the investigator in organizing, sorting, and manipulating the arrangement of materials to facilitate the analytical process. Obviously, the programs cannot develop an analytical scheme or engage in the interpretive process. Nothing can replace the need for the investigator to be immersed in reading and coding the narrative. Word-processing programs and specially designed qualitative software packages only enable the researcher to catalog, store, and rearrange large sets of information in different sorted files more efficiently. Even when computer assistance is used, many investigators also depend on index cards or loose-leaf notebooks with tabs to separate and identify major topics and emerging themes. Some investigators establish multiple copies of narratives and cut and paste materials to organize and reorganize each written segment into meaningful categories.
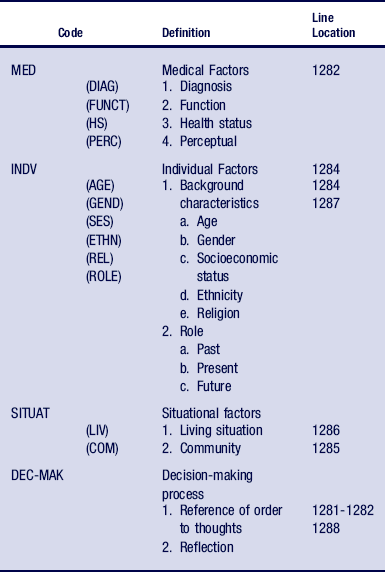
In any case, researchers usually maintain a codebook in the form of paper or electronic index cards, word-processing files, or an electronic notebook that summarizes the codes that are used to describe major passages and themes and their location in a transcript. An index or codebook system can be developed in many ways and can even be located on an MP3 player or cell phone for quick reference.
A code, its definition, and its line location in the transcript are recorded in Table 18-2. This excerpt from a codebook reflects three broad analytical categories (medical, individual, and situational) that emerged from the focus group study. Each category has subcodes; the category of “individual” considerations involved up to 14 subcategories, such as self-care, previous roles, and future roles. The listing of the location of each code in the transcript provides a quick guide to the text. The text can then be sorted by codes, and smaller files can be created that reflect any category of interest (Table 18-3).
As part of the information collection and storage process, the researcher may keep personal notes and diary-like comments and emerging insights that provide a context from which to view and understand field notes at each stage of engagement in the field. This is an example of how data management and data analysis are interrelated in naturalistic research. In most forms of naturalistic inquiry, the investigator is an integral part of the entire research process. It is through the investigator and his or her interaction with informants in the field that knowledge emerges and develops. Thus, these personal comments are critical to the investigator's self-reflections, which occurs as part of both the management and the analytical processes. Taking field notes and using them in data collection and analysis are important areas of study.4
Reflecting on personal feelings, moods, and attitudes at each juncture of data collection and recording, the investigator can begin to understand the lens through which to interpret the cultural scene or slice of behavior at that point in the fieldwork. The organization of these notes and their emergent interpretations is an important technique. The investigator can develop questions to guide further data collection and to explain observations as they occur. Summarizing or memoing4 as the researcher proceeds is both a management and an analytical technique that produces an “audit trail.”5 An audit trail indicates the key turning points in an inquiry in which the researcher has uncovered and revealed new understandings or meanings of the phenomenon of interest. Others can review the audit trail as a way to determine the credibility of the investigator's interpretations (see Chapter 17).
Practical considerations
Another part of the action process of preparing data for analysis, whether for naturalistic or quantitative-type research, involves practical considerations in managing data that can potentially affect the science of your investigation. One consideration is finding a safe place to store data in your office. Data (e.g., questionnaires, voice recordings, electronic databases, transcripts) should be stored in fireproof or metal cabinets that can be secured by lock and key. Locked filing cabinets or a locked office suite is essential because it is an ethical and legal responsibility to ensure the confidentiality of the information you have collected from human subjects and that only members of the research team have access to such information. Also, you should derive office policies as to who has access to your data, whether the data can be taken out of the office, and by whom. Even within an office, data can be lost. Identify a safe drop-in box, and establish a storage system for completed interviews and those that have been entered and cleaned. Be sure that all virus and spyware programs are up to date and that your computer is password protected so that no one can access electronic data.
Another consideration is to develop a backup disaster plan. You should always have a backup of all data that have been entered or transformed. Keep one backup file in a fireproof metal cabinet and one backup file at home or in a location other than the office. Also, choose a safe place to keep your field notes and other ongoing documentation you may need to use in the field. If theft is a threat, you might want to establish the rule that interviewers should not keep data in their cars. Also, interviews can easily be lost, so you may want to establish a rule as to how soon following the completion of an interview it must be brought into the office or storage location.
Besides a backup and disaster recovery plan, you also must make sure that you keep any identifying information and informed consents separate from and not traceable to the data. Your office may in fact be audited by your institutional review board or research committee to make sure that you are compliant with all Health Insurance Portability and Accountability Act and human subject regulations (see Chapter 12).
Although these are very practical considerations, they are part of the action of research. Consider the consequences for the analytical and reporting stages of your research if your completed audiotapes or interviews are mislabeled, misplaced, or lost.
Summary
Organizing or managing the information collected in a study is an important research task that is not often explicitly discussed in the research literature. Techniques for effectively organizing information for analysis tend to be learned through mentorship opportunities. Nevertheless, data management represents a potential source of random error in both naturalistic inquiry and experimental-type research and therefore warrants careful consideration.
Researchers in experimental-type research proceed with a series of actions to manage and prepare data for statistical analysis. As in all previous research steps, the approach in experimental-type research is linear; it follows data collection and precedes statistical testing, and it involves a series of actions that occur in a stepwise fashion. In contrast, analysis is an ongoing and integral part of data collection actions in naturalistic inquiry. Likewise, the management of data and its cleaning and reduction into meaningful interpretive categories occur iteratively, first as part of data collection and then as part of a more formal analysis and report-generating process. In keeping with the different philosophical foundations that make up naturalist inquiry, researchers pursue diverse ways of storing, managing, and preparing information for ongoing analysis and final report writing.
References
1. Glaser, B., Strauss, A. The discovery of grounded theory: strategies for qualitative research. Chicago: Aldine, 1967.
2. Fetterman D: Ethnography: step by step, ed 3, Thousand Oaks, Calif, Sage
3. Gitlin, L.N., Burgh, D., Durham, D. Factors influencing therapists selection of adaptive technology for older adults in rehabilitation: legacies and lifestyles for mature adults. Philadelphia: Temple University Press, 1992.
4. Heider, D. Living virtually: researching new worlds. New York: Peter Lang, 2009.
5. Guba, E.G. Criteria for assessing the trustworthiness of naturalistic inquiry. Educ Commun Technol J. 1981;29:75–92.