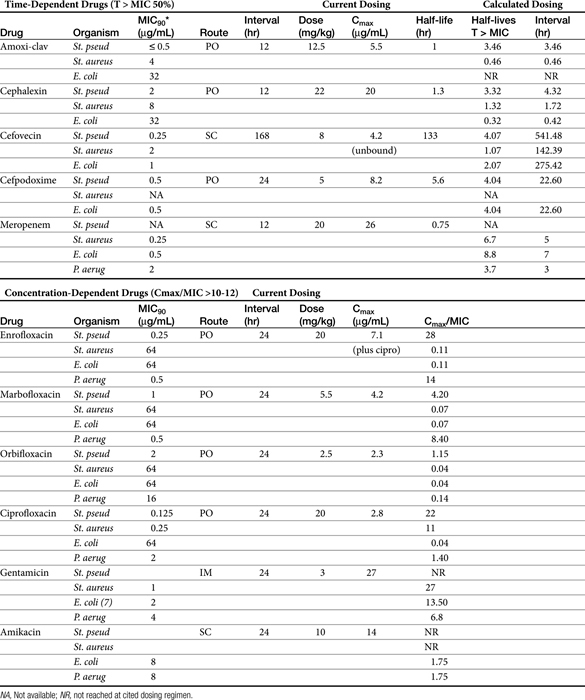
Table 6-4 Integration of Population Pharmacodynamic (PD) and Pharmacokinetic (PK) Data and Its Role in the Design of Dosing Regimens
6 Principles of Antimicrobial Therapy∗
Judicious Antimicrobial Use
“Even experienced practitioners may not realize that giving a patient antibiotics affects not just that patient, but also their environment, and all the other people that come into contact with that environment.” Dancer’s1 statement, intended as a warning to practitioners of human medicine, emphasizes the importance of judicious antimicrobial therapy. It is understood that the goal of antimicrobial therapy is successful treatment of infection. However, the less judicious the approach taken to achieve that goal, the more likely a path to future failure is paved. The goal of antimicrobial therapy must be further modified to include avoidance of resistance, a goal that is not necessarily accomplished with successful resolution of infection. Although it might be tempting to consider that human and veterinary medicine are differentially affected by antimicrobial resistance, in reality both are inexorably linked, and what affects one will affect the other. As early as 1998, the National Foundation for Infectious Diseases estimated the cost of antibiotic-resistant bacteria to be as high as $4.5 billion annually and that they are responsible for more than 19,000 (human) deaths per year.2 The impact is evident globally, nationally, in the community setting, in the hospital environment, and within the hospital, particularly with regard to at-risk patients (e.g., critical care).3 Any antimicrobial used to treat a patient ultimately must be excreted into the environment; the impact of this is just now being addressed scientifically.
Empirical antimicrobial selection may become an approach of the past. As medical communities struggle to assess impact, causes, and means of avoidance, inappropriate antimicrobial use clearly is a consistent contributing factor to antimicrobial resistance. Inappropriate use includes both excessive and unnecessary use, as well as inappropriate dosing regimens. In the United States alone, approximately 350 million pounds of antibiotics are consumed annually in human medicine.2 The numbers in veterinary medicine are less clear, but 20 million pounds were consumed by food animals during the same period.2,4 Approximately 40% of human consumption of antimicrobials is considered unnecessary.2 That we do not have a similar statistic regarding therapeutic antimicrobial use in veterinary patients reflects, perhaps, a somewhat cavalier attitude regarding antimicrobial stewardship both on the part of the manufacturers and the users. The veterinary profession has been intensely scrutinized by the medical community regarding its use of antimicrobial products in animals. This sometimes scientific and frequently emotional focus began with use in food animals but is shifting to companion animals.5 Guardabassie6 has described the role of the family pet as a reservoir of potentially resistant zoonotic organisms. Resistant strains of Staphyloccocus intermedius, Campylobacter, Salmonella, and Escherichia coli were cited as possible zoonotic concerns. At least 1% of annual salmonellosis cases in humans are assumed to be associated with companion animals.6 Approximately 6% of Campylobacter jejuni infections in humans (children) are transmitted from pets.6,7 Methicillin-resistant Staphyloccoccus aureus (MRSA) has been isolated in family members and pets in the same household8-10; methicillin-resistant Staphylococcus intermedius∗ (MRSIG) has been reported in human patients11; and, perhaps disconcertingly, MRSA of animal origin (not previously identified in humans) has been identified in animals, albeit food animals (pigs).12 In dogs E. coli strains are phylogenetically similar to pathogenic strains causing infection in humans; more than 15% of canine fecal deposits in the environment contain E. coli strains related to virulent human strains.6 The concern regarding E. coli relates, in part, to its ability to develop resistance in the presence of antibiotic concentrations considered therapeutic.13,14 Extraintestinal pathogenic E. coli (ExPEC, the “other” bad E. coli) appears to easily colonize the gastrointestinal tract, potentially displacing commensals and eventually emerging as infectious organisms in other body tissues, particularly in the urinary tract.15 Further, E. coli is able to share mechanisms of resistance with other enteric pathogenic coliforms such as Salmonella.13 Evidence exists for the transfer of resistance between E. coli and Salmonella and subsequent transfer of these organisms between animals (pet and farm animals) and humans16
KEY POINT 6-1
Antimicrobial use by veterinarians affects the global medical community; the veterinary hospital, the patient; and, as is increasingly being recognized, the pet owner.
The pernicious advent of resistance over decades of antimicrobial use reveals that, despite their safety to the patient, antimicrobials are not innocuous drugs.17 As in human medicine, antibiotic stewardship (i.e., judicious antimicrobial use) should become the focus for reducing resistance in veterinary medicine.18 Prudent veterinarians and veterinary practices will implement decision-making processes (antimicrobial use paradigms) that minimize the temptation to use antimicrobials as alternative therapies. Designing a dosing regimen on the basis of cost and convenience, rather than on pharmacodynamics and pharmacokinetics, must become a paradigm of the past. Antimicrobial stewardship begins by recognizing the problems and issues and successfully implementing procedures that reasonably minimize the impact of antimicrobial use in the patient while not forfeiting the likelihood of therapeutic success. It is with this appproach this chapter emphasizes the rational basis for decision making in the selection of the proper antimicrobials.
Definitions and Goals
The terms antibiotic, antibacterial, and antimicrobial are often used interchangeably, despite their different meanings. Antibiotics are natural chemicals (e.g., penicillin) produced by organisms intended to suppress other organisms (generally, but not exclusively, bacteria), whereas antimicrobial refers to any compound, whether natural, synthetic, or a combination thereof, that suppresses microbial growth. Antibacterials target bacteria, antifungals target fungi, and so forth. The term microbes usually refers to bacterial organisms but also includes fungal and other (nonviral) organisms. Bacteria can be further categorized on the basis of their Gram-staining characteristics and their morphology (Box 6-1). This classification is helpful when matching bug to drug. In addition to staining characteristics, bacteria can be defined as aerobic—that is, those that generate energy (ATP) by aerobic respiration of oxygen. Some aerobes have minimal capacity to generate energy in the absence of oxygen and can be referred to as obligate aerobes. Although Pseudomonas aeruginosa might be classified as an obligate aerobe, it has the capacity to function, as with many other aerobes, as a facultative anaerobe. Facultative anaerobes prefer an oxygen-rich environment but are quite capable of switching to fermentation in the absence of oxygen. An example environment in which P. aeruginosa is able to survive in reduced oxygen environments (in humans) is cystic fibrosis. Other examples of facultative anaerobes include the families Enterobacteriaceae (e.g., E. coli, Klebsiella pneumoniae, Proteus mirabilis), Vibrionaceae (e.g., Vibrio, Aeromonas), and Pasteurellaceae (Pasteurella, Haemophilus). In contrast, obligate anaerobes cannot tolerate the presence of oxygen more than a few seconds. Examples include members of the family Bacteroides. Clostridia sp. is an example of an anaerobic organism whose oxygen toleration ranges from moderately tolerant (e.g., Clostridia tetani) to highly tolerant (e.g. Clostridia perfringens). Microaerophilic bacteria lie somewhere between aerobic and obligate anaerobes, in that they require low concentrations of oxygen to survive. Examples include Helicobacter and Borrelia spp.19 When collecting a culture sample for such organisms, extreme care must be taken to prevent its exposure to oxygen. Aerotolerant organisms are not affected by either the presence or the absence of oxygen.
Box 6-1 Bergey’s Classification of Medically Relevant Bacteria
(From Krieg NR, Staley JT, Hedlund B et al: Bergey’s manual of systematic bacteriology, ed 2, Volume 4: The Bacteroidetes, Spirochaetes, Tenericutes (Mollicutes), Acidobacteria, Fibrobacteres, Fusobacteria, Dictyoglomi, Gemmatimonadetes, Lentisphaerae, Verrucomicrobia, Chlamydiae, and Planctomycetes, New York, 2010, Springer.)
KEY POINT 6-2
Antibiotics are natural antimicrobials secreted by one microorganism to inhibit another. A microbe that secretes antibiotics also carries the genes for resistance to that antibiotic.
The term organism refers to either the genus or the genus and species of a microrganism. Examples include E. coli, Staphylococcus pseudintermiedius group (SIG), Enterococcus faecalis, and Bacteroides fragilis. For each of these organisms, multiple strains exist. An isolate refers to one colony-forming unit (CFU) of the resident population of that organism. This might be from any site, such as a lake, a feedlot, a surgical table, or the sample collection site of a patient. The cultured isolate is only one among what are likely to be thousands or hundreds of thousands of CFUs that make up the resident population, or inoculum, of the organism in the patient. Whether the inoculum in the patient represents a true infection rather than normal flora is based, in part, on the size of the inoculum—that is, how many CFUs of that organism are present in the animal.
KEY POINT 6-3
An infection is defined by the size of the inoculum, which varies with the tissue and method of culture collection.
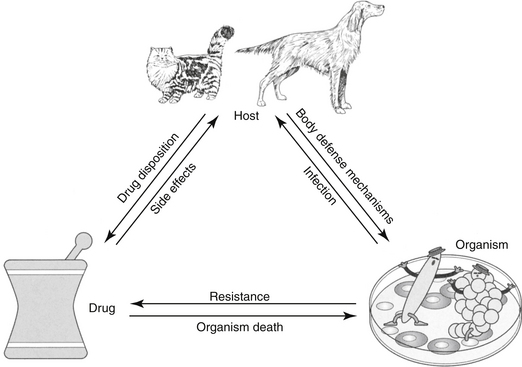
The goal of antimicrobial therapy is to achieve sufficient concentrations of an appropriate drug at the site of infection such that the infecting organism is killed, while simultaneously avoiding side effects of the drug in the patient. In today’s age of emerging resistance, the goal must be modified to include the avoidance of antimicrobial resistance. Therapeutic decisions concerning antimicrobial therapy for the infected patient are among the most challenging (Figure 6-1). Unlike most other drug therapies, antimicrobial therapy must take into account microbe, drug, and patient factors (i.e., the chemotherapeutic triangle), many of which confound successful therapy to the point of causing failure (Figure 6-2). Antimicrobial therapy is most likely to be successful when the target (and thus spectrum of antimicrobial activity) is known such that pharmacodynamics (PD) of the infecting organism can be integrated with the pharmacokinetics (PK) of the drug in the patient.
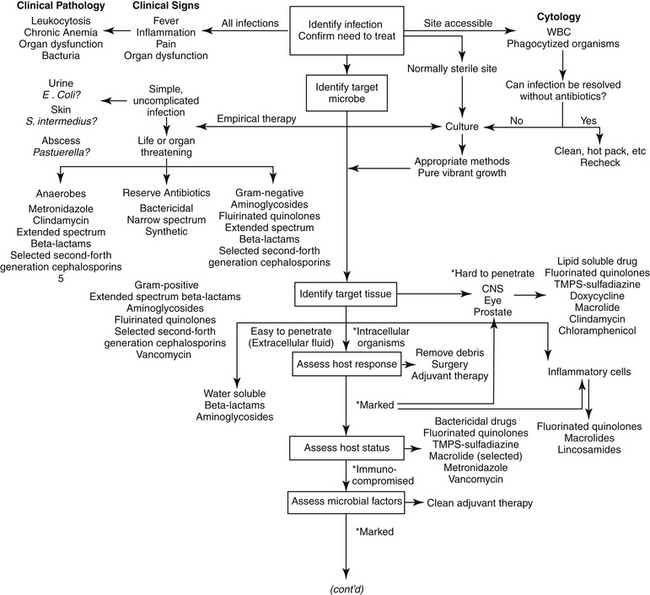
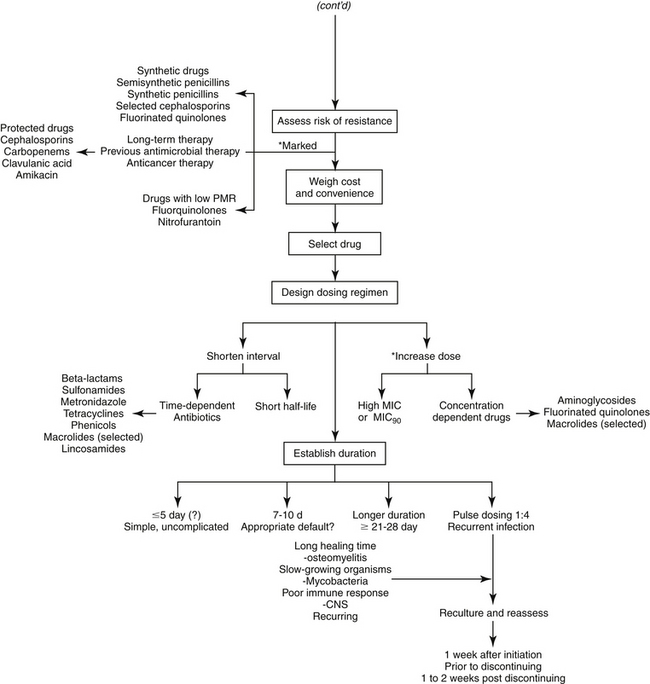
Figure 6-1 Therapeutic decision making for judicious antimicrobial therapy requires multiple steps. Antimicrobials should not be used indiscriminately; whenever possible, the most narrow-spectrum drug that targets the infecting organism should be used. Achieving adequate drug concentrations at the site of infection is critical to successful therapy. Dosing regimens should be modified for the patient; modifications should include changes in the dose and/or interval as is relevant. The asterisk at the ∗Design Dosing Regimen step refer to those indications previously encountered that should also lead to either a shortened interval or an increased dose, depending on whether the drug is concentration versus time dependent.
Identifying the Need for Antimicrobial Therapy
The first decision to be made regarding antimicrobial therapy is determining the need to treat (see Figure 6-1). The decision includes confirming, to the extent possible, the existence of infection; identification of the cause of the infection bacteria (or fungal, etc), the need for treatment of the infection; and, if treatment is deemed necessary, whether antimicrobials should be part of the therapy. This first decision is probably given the least consideration yet may be the most important if resistance is to be avoided. It also may be the most difficult to make. The presence of infections frequently cannot be confirmed for a variety of reasons, such as the lack of (infection-) specific clinical signs, location in an inaccessible site, and costs associated with accurate diagnosis. Infection is supported, but not necessarily confirmed, by clinical signs or laboratory tests indicating fever, inflammation, and organ dysfunction or structural changes detected by imaging techniques such as radiology, ultrasound, and magnetic resonance imaging. Culture may support, but does not necessarily confirm, infection. Newer detection methods based on molecular diagnostic techniques (e.g., polymerase chain reaction) may ultimately prove to be important tools in the rapid bedside diagnosis of infectious diseases, including multidrug-resistant bacteria.20 However, simply documenting the presence of these microbes may not be a sufficient indication of cause and effect. These methods may not discriminate infection (reproducing, pathogenic organisms) and colonization (the presence, growth, and multiplication of the organism without observable clinical symptoms or immune reaction), or pathogens from normal microflora. An exception can be made if cytology reveals organisms phagocytized by white blood cells, but the absence of phagocytosis does not eliminate infection.
KEY POINT 6-4
The first and most critical decision to be made regarding antimicrobial therapy is determining the need to treat. This includes confirming, as much as possible, the existence of infection; deciding if it must be treated; and, if so, whether antimicrobials should be part of the therapy.
Identifying the presence of infection is important in avoiding indiscriminate antimicrobial use. Increased risk of toxicity, cost, and inconvenience are obvious reasons that antimicrobial drugs should not be used indiscriminately. Less obvious reasons are an increased risk of superinfection and the potential emergence of resistant microbes. These latter reasons reflect, in part, the impact of antimicrobial therapy on normal flora.
Internal structures and organs (e.g., bone, heart, kidneys, the lower respiratory tract) are normally sterile. Sterility may be maintained, in part, by secretions, which constantly clean or clear the site. In addition to bulk flow, secretions may contribute to sterility by the presence of endogenous antimicrobial compounds (e.g., tears, saliva, respiratory tract secretions, gastrointestinal acidity). However, in contrast, external (skin and conjunctiva of the eye) and internal (linings of the respiratory, digestive, and urogenital systems) surfaces are characterized by normal microflora. Normal flora may be further defined according to their contribution to host health or well-being. Most normal flora are commensals that appear to neither harm nor help the host. Some commensals, however, are also opportunistic in that they may become pathogenic, particularly if host health is impaired. A pathogen is a microbe that is associated with and capable of causing host damage.21 Pathogens often reflect the normal flora of infected sites, with E. coli, P. aeruginosa, K. pneumoniae, and S. aureus being common examples of opportunistic normal flora that can become pathogenic (Table 6-1). Mutualistic organisms help maintain microbial balance through host–microbe interactions. They provide beneficial effects such as producing acids that lower pH and blocking colonization by more dangerous microbes. Antibiotics secreted by mutualistic organisms help maintain the composition of aerobic and anaerobic commensal bacteria, resulting in a population that is most appropriate for host health and preventing colonization by pathogenic organisms. Opportunistic organisms may not originate from normal microflora but rather may be acquired from the environment (e.g., Aspergillosis, fungal organisms). Nosocomial organisms cause infections as a result of medical treatment, usually in a hospital or clinic setting. As such, a nosocomial infection is defined as one that arises 48 hours after hospital admission. Disruption of the environment, such as might occur with the use of antimicrobials that alter the anaerobic population, will also disrupt the balance of normal microflora, increasing the risk of infection (see the section on antimicrobial resistance). Not only will death of normal flora leave a void that can be filled in with more hardy and potentially pathogenic microbes, but the constant exposure of the microbes to antibiotics leads to ongoing development of mechanisms such that the microbes resist environmental drugs. Therefore the organisms are primed for resistance. Narrowing the spectrum of the chosen antimicrobial will help limit, although probably not prevent, the development of resistance.
Table 6-1 Normal Flora and Clinically Significant Infections by Organ System (Dogs and Cats)
| Organ or Site | Organism | Comment |
|---|---|---|
| Blood | ||
| Staphylococcus intermedius (D: 25%-35%)∗, †, ‡ | ||
| Streptococcus spp. (D: 18%-21%)† | ||
| Enterobacter cloacae (D: 3%-8%, C: 7%)† | ||
| Escherichia coli (D: 35%-45%∗; D: 18%-71% & C: 14%)† | ||
| Klebsiella pneumoniae (D: 25%-35%∗: C: 14%)† | ||
| Proteus (D: 14%)† | ||
| Pseudomonas aeruginosa (D: 10%-20%) | ||
| Salmonella (D: 11%-13%; C: 29%)† | ||
| Obligate anaerobes (D: 10%-20%) | ||
| Endocarditis† | Staphylococcus intermedius (D: 6%-33%) | |
| Streptococcus spp. (D: 12%-26%) | ||
| Escherichia coli (D: 6%-30%) | ||
| Erysipelothrix rhusiopathiae (D: 19%) | ||
| Corynebacterium spp. (D: 19%) | ||
| Respiratory | ||
| Upper | Staphylococcus intermedius (D: 30%-35%)§, ║, ¶ | Have been isolated from nasal swabs, tonsillar and pharyngeal swabs, or tracheal and lung swabs |
| Streptococcus spp. (15%-27%)§, ║, ¶ | ||
| Corynebacterium spp, §, ║, ¶ | ||
| Escherichia coli§ (15%-29%)§, ║ | ||
| Klebsiella pneumoniae (D: 10%-15%)║, ¶ | ||
| Moraxella§, ¶ | ||
| Neisseria§, ║ | ||
| Pasteurella multocida (D: 15%-34%; C: >50%)§, ║ | ||
| Proteus (C: <10%)§, ║ | ||
| Pseudomonas§ (6%-34%)§, ║ | ||
| Bacteroides║ | ||
| Clostridium spp. § | ||
| Fusobacterium║ | ||
| Rhinitis, sinusitis | Escherichia coli | |
| Pasteurella multocida | ||
| Proteus | ||
| Pseudomonas spp. | ||
| Tracheobronchitis∗ | Bordetella | |
| Lower | ||
| Staphylococcus intermedius (D: 10%-15%) | Normal bronchi and lungs sterile distal to first bronchial division | |
| Escherichia coli (D: 30%-40%; C: 15%-20%) | ||
| Bordetella (D: 10%-15%) | ||
| Enterococcus | ||
| Klebsiella pneumoniae (D: 15%-20%; C: <10%) | ||
| Pasteurella multocida (C: >50%) | ||
| Pseudomonas | ||
| Proteus mirabilis (D: <10%) | ||
| Pleuritis | Actinomyces, Bacteroides, Corynebacterium, Fusobacterium, Nocardia, Pasteurella, Staphylococcus, Streptococcus | |
| Gastrointestinal | ||
| Oral cavity | Beta-hemolytic Streptococcus | Isolates from healthy dogs§ |
| Staphylococcus epidermidis§ | ||
| Acinetobacter§ | ||
| Escherichia coli§ | ||
| Moraxella§ | ||
| Neisseria§ | ||
| Pasteurella§ | ||
| Proteus§ | ||
| Pseudomonas§ | ||
| Obligate anaerobes (80%-90%) | ||
| Small intestine | Escherichia coli, Klebsiella,¶ | Enteropathogenic bacteria in the stomach or small intestine associated with enterotoxin¶ or mucosal invasion |
| Enterobacteriaceae§ | Campylobacter fetus¶ | |
| Moraxella | ||
| Neisseria | ||
| Proteus spp. | ||
| Pseudomonas spp. | ||
| Salmonella typhimurium§, ¶ | ||
| Shigella§ | ||
| Vibrio cholerae¶ | ||
| Vibrio parahaemolyticus§ | ||
| Yersinia enterocolitica¶ | ||
| Clostridium perfringens (type A) ¶ | ||
| Bacillus§, ¶ | ||
| Large intestine | Enterobacteriaceae∗ | ∗Normal microflora; anaerobic make up 90% of microflora |
| Enterobacteriaceae§ | Anaerobes | |
| Peritonitis | ||
| Hepatobiliary | ||
| Enterobacteriaceae | ||
| Escherichia coli | ||
| Enterobacter | ||
| Klebsiella | ||
| Genital | ||
| Staphylococcus intermedius (D: 15%-25%)§ | Normal microflora of distal urethra and prepuce§ | |
| Acinetobacter§ | ||
| Escherichia coli (30%-35%)§ | ||
| Klebsiella§ | ||
| Moraxella,§ Haemophilus§ | ||
| Pasteurella multocida (10%-25%)§ | ||
| Proteus sp.§ | ||
| Pseudomonas aeruginosa (<10%) | ||
| Obligate anaerobes (C: 10%-25%) | ||
| Mycoplasma spp.§ | ||
| Ureaplasma spp.§ | ||
| Staphylococcus intermedius (D: 15%-25%)§ | Normal microflora of canine vagina§ | |
| Staphylococcus epidermidis§ | ||
| Streptococcus canis, S. faecalis, S. viridans, S. zooepidemicus§ | ||
| Corynebacterium§ | ||
| Acinetobacter§ | ||
| Citrobacter§ | ||
| Enterobacter§ | ||
| Enterococcus§ | ||
| Escherichia coli (30%-35%)§ | ||
| Haemophilus§ | ||
| Klebsiella§ | ||
| Micrococcus§ | ||
| Moraxella,§ Neisseria§ | ||
| Pasteurella multocida (15%-25%) | ||
| Proteus§ | ||
| Pseudomonas aeruginosa (<10%)§ | ||
| Obligate anaerobes (C: 10%-25%) | ||
| Mycoplasma§ | ||
| Ureaplasma§ | ||
| Urinary Tract | ||
| Staphylococcus intermedius (D: <10%) | ||
| Enterococcus faecalis (D: <10%) | ||
| Escherichia coli (40%-50%) | ||
| Klebsiella pneumoniae (10%-15%) | ||
| Pasteurella multocida (C: 10%-15%) | ||
| Proteus mirabilis (10%-15%) | ||
| Pseudomonas aeruginosa (C: <10%) | ||
| Central Nervous System | ||
| Brucella | ||
| Pasteurella | ||
| Ocular | ||
| Conjunctiva | Staphylococcus intermedius,§, ¶ S. albus¶ | Cultured from the conjunctival sac of clinically normal dogs or cats§¶ |
| Beta-hemolytic Streptococcus (C: 15%-25%)§, ¶ | ||
| Corynebacterium§, ¶ | ||
| Escherichia coli¶ | ||
| Moraxella§ | ||
| Neisseria§ | ||
| Pasteurella multocida (C: 10%-20%) | ||
| Pseudomonas§ | ||
| Proteus | ||
| Bacillus§, ¶ | ||
| Chlamydia psittaci (C: 50%-75%) | ||
| Mycoplasma¶ | ||
| Eye | Leptospira | |
| Brucella canis | ||
| Clostridium tetani | ||
| Mycobacterium bovis | ||
| Otitis externa | Staphylococcus intermedius (D: 25%-30%) | |
| Escherichia coli (D: 10%-20%) | ||
| Proteus mirabilis (D: 20%-25%) | ||
| Pseudomonas aeruginosa (D: 15%-25%) | ||
| Skin | Staphylococcus intermedius (D: 60%-70%) | |
| Escherichia coli (20%-30%) | ||
| Pasteurella multocida (C: >50%) | ||
| Proteus mirabilis (<10%) | ||
| Pseudomonas aeruginosa (D: <10%) | ||
| Wounds, abscesses | Staphylococcus intermedius (D: 25%-50%) | |
| Escherichia coli (D: 20%-30%; C: 10%-20%) | ||
| Pasteurella multocida (C: 30%-40%) | ||
| Proteus mirabilis (D: 10%-20%; C: <10%) | ||
| Pseudomonas aeruginosa (D: 10%-20%) | ||
| Obligate anaerobes (25%-35%) | ||
| Musculoskeletal | ||
| Osteomyelitis | Staphylococcus intermedius (D: 40%-50%) | |
| Staphylococcus aureus | ||
| Escherichia coli (D: 10%-20%) | ||
| Enterococcus faecalis (D: 10%-20%) | ||
| Proteus mirabilis (10%-20%) | ||
∗∗Organisms that are cultured from clinically healthy animals may be difficult to distinguish from those that cause infection.
∗ Numbers in parentheses refer to probable percentages of infections in this tissue that are caused by the organism, as cited by Aucoin (1993). Unless noted otherwise, the percentages refer to both dogs and cats (D = dog; C = cat). Note that the probable percentage is likely to vary geographically and may be biased toward patients referred to a specialty service.
† Numbers in parentheses refer to probable percentages of infection in this tissue that are caused by the organism, as cited by Greene (1990).
‡ Number in parenthesis reflects the range of percent cited by both Aucoin (1993) and Greene (1990).
§ ¶ For each tissue, the symbol is defined in the Comment column.
Identifying the Target Organism
Empirical Antimicrobial Therapy
After it has been determined that infection does exist and warrants medical management with antimicrobial drugs, identification of the target is the second critical decision to be made. Antimicrobial selection is probably most often made empirically—that is, on the basis of assumptions regarding the infecting organism and its susceptibility to drugs. These assumptions are based on historic data that identify organisms most commonly associated with infections of various body systems (see Table 6-1).22 However, older data may not have discriminated between commensals and pathogens — indeed even today such discrimination often is not possible — which complicates the accuracy of prediction. More problematic, as resistance has emerged, the risk of incorrectly identifying the susceptibility pattern of an infecting microbe has increased. Thus the clinician should carefully balance the risk of therapeutic failure, including recurrence of infection with a resistant microbe, with the cost associated with more accurate diagnostic procedures.
The utility of Gram staining in the selection of an antimicrobial should not be overlooked as a means to narrow the spectrum of the chosen antimicrobial. Gram stain characteristics differ on account of differences in the layers penetrated by the Gram (purple) stain. The cell wall is many layers thicker in gram-positive organisms than in gram-negative ones thus rendering them more susceptible to some drugs that target the cell wall; further, the gram-positive isolates do not have an external lipopolysaccharide (LPS) covering that is present in gram-negative organisms (Figure 6-3). Whereas the LPS layer is the source of endotoxin responsible for the morbidity and mortality associated with many gram-negative infections, just as this external covering precludes stain movement into the cell wall, it also serves as a barrier to drug movement into the organism (see Figure 6-3).23 Movement, particularly of water-soluble drugs, is generally restricted to outer membrane proteins that span the breadth of the covering (porins); however, changes in porin size and efflux pumps are mechanisms by which gram-negative organisms overcome drug movement through porins.
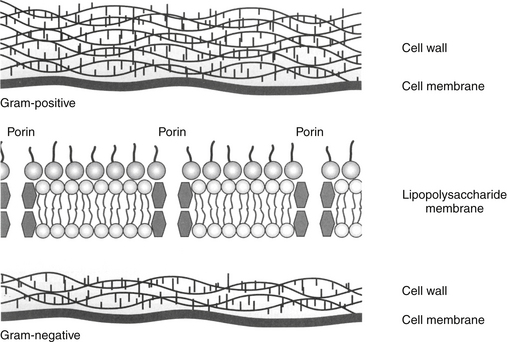
Figure 6-3 The gram-positive cell wall is thicker than the gram-negative cell wall, but the gram-negative cell wall is protected by an outer membrane including a layer of lipopolysaccharides. Endotoxin, derived from the lipopolysaccharides, contributes to the mortality and morbidity of gram-negative infections. The membrane also presents a challenge to drug movement. Although lipid-soluble drugs can diffuse through the membrane, movement of water-soluble drugs must occur through channels in outer membrane proteins called porins, which form aqueous channels that filter unwanted molecules. These porins are also associated with efflux pump proteins (the latter are also present in gram-positive organisms). Reduction in porin size or increased efflux pump activity are important mechanisms by which gram-negative organisms develop multidrug resistance.
In addition to Gram staining, determining the source of infection may help identify the microbe because some organisms are more likely than others to infect certain body systems. For example, genitourinary tracts are often infected with gram-negative aerobes, whereas abdominal infections generally are caused by gram-negative aerobes initially, followed by anaerobes after several days (see Table 6-1).24,25 Skin is most commonly infected with Staphylococcus pseudintermedius (to be referred to as S. intermedius group, or SIG), abscesses with anaerobes and Pasteurella spp., and the urinary tract with E. coli. Indeed, E. coli is one of the more common pathogens, infecting many tissues. One study of 674 E. coli isolates collected from dogs found the vast majority (n=424) associated with urinary tract infections (UTIs) (n=424); however, 61 were also collected from skin, respiratory tract (52), ear (43), female (42) and male (25) reproductive tracts, and other organ systems (23). However, although E. coli may indeed be the most common isolate associated with UTIs, it does not necessarily represent the majority of UTIs. In a study by the author, only 50% of UTIs were caused by E. coli, with the remaining 50% caused by Staphylococcus spp., Enterococcus spp., Proteus, and others. For critical patients, organisms generally represent the normal flora of the alimentary canal or a nosocomial organism.26 Granulocytopenic or otherwise immunoincompetent patients also are more likely to be infected by aerobic gram-negative organisms.
Even if the organism is correctly identified, the greater risk of failure associated with empirical treatment lies in the inability to correctly predict susceptibility patterns. This is not a new concern: As early as 1996, a study of critical-care patients revealed that empirical selection of antimicrobials was incorrect, on the basis of cultures collected before antimicrobials were started, in nearly 45% of patients.27 Further, isolates of four organisms collected between 1998 and 2000 (P. aeuriginosa, P. mirabilis, E. coli, Staphylococcus spp.) widely considered to be susceptible to enrofloxacin (which had been approved for approximately 10 years) were characterized by a higher than expected incidence of resistance (28% for E. coli).28 More recently, a high level of resistance was ascribed to drugs used empirically to treat otitis interna29 and pyothorax.30 Finally, our laboratory has demonstrated that more than 40% to 60% of E. coli associated with UTIs in dogs are characterized by resistance to first- and second-choice drugs (amoxicillin/clavulanic acid, cephalexin, potentiated sulfonamides, and enrofloxacin).31 These differences may be regional but the absence of a robust surveillance program for dogs and cats limits empirical antimicrobial selection. These studies suggest culture and susceptibility (C&S) testing will become increasingly important.
Culture and Susceptibility Testing
C&S data can be a powerful guide for judicious antimicrobial use. However, C&S testing is only one of several tools that should support antimicrobial therapy. Among the advantages of culture is facilitation of input from a veterinary diagnostic microbiologist. As such, it has multiple roles in antimicrobial therapy: identifying the potential pathogen, providing a list of potentially effective drugs, offering guidance regarding the most effective drug, and serving as a basis for design of a dosing regimen of that drug through integration of pharmacokinetics (PK) and pharmacodynamics (PD).32
KEY POINT 6-6
The more at risk a patient is for resistance to be present or emerge, the more important culture and susceptibility testing becomes in the support of drug selection and design of the dosing regimen.
To date, not all infections require C&S testing to be effectively treated. Indeed, basing treatment on C&S does not guarantee therapeutic success. However, C&S can be particularly prudent for at-risk patients. It is particularly important for patients that have been treated with antimicrobials in the past several months. Testing is important to critical patients; although empirical therapy will begin before its receipt, culture of blood, urine, respiratory secretions (collected by bronchoscopy) and other pertinent body fluids (i.e., pleural, peritoneal, or cerebrospinal fluid [CSF]) should be carefully sampled before antimicrobial therapy is begun. Testing is also critical if infection by nosocomial organisms is of concern because their complex resistance patterns often require more expensive and potentially toxic drugs.33
Among the disadvantages of C&S testing is the time that often elapses between sample collection and receipt of results. Ideally, antimicrobial therapy will be withheld until the information is received and the accuracy of empirical choices is confirmed. The more a patient is at risk for developing resistance, the more important it may be to withhold therapy until results are received. However, treatment generally cannot be withheld. Still, if the data indicate that an incorrect choice may have been made regarding empirical antimicrobial selection, the data may no longer accurately reflect either the current infecting population or the susceptibility pattern. The clinician has several options, given that scenario (see Figure 6-1). If the patient has responded to therapy, the most prudent approach may be to stay the course, or perhaps add a second (nonantagonistic) drug to which the isolate is susceptible. If the patient has not responded sufficiently to therapy, therapy might be changed in light of the new data. However, the more prudent approach might be to reculture and wait until the new data arrive before changing course.
As with any tool, C&S data can be detrimental if misused. Contributing to improper use are the many pitfalls of testing, which begin with sampling, continue through the testing procedures and interpretation of results, and end with the design of the dosing regimen.
Culture data are only as good as the sampling methods of collection; the importance of proper culture techniques cannot be overemphasized (Box 6-2). For skin wounds the surface always contains commensals; normal flora, regardless of the site of collection, will cause background noise that must be filtered out. Swabs are often not ideal for sampling for a variety of reasons,34 the most compelling of which is that only 3 out of 100 CFUs will actually make it to the culture stage. For anaerobes in particular, air between the fibers inhibits growth. Despite the greater level of difficulty in sample acquisition, tissue is the preferred sample. This might be an aspirate of fluids or macerated tissues (the laboratory may prefer to perform the macerating). Cleansing before sample collection is indicated, particularly for contaminated sites. For the same reason, cystocentesis is the most acceptable sample for interpretation of bacteriuria; catheterized sample often contain microbes colonizing the catheter and associated biofilm. The properly collected obligate anaerobic sample is particularly difficult to achieve and the absence of anaerobes may simply reflect improper techniques. An anerobic infection should be suspected if clinical signs are supportive (e.g., foul smell, adjacent to mucosal membranes or gas). Note that facultative anaerobes may be cultured and tested as susceptible under aerobic conditions but fail to respond to therapy as expected if the infection in the patient occurs under anaerobic conditions.
Box 6-2 Techniques in Culture Sampling
Commonalities Regardless of Site∗
Respiratory Tract
Urine
Blood Culture
Ocular
Gastrointestinal Tract
∗ Harry W. Boothe
Even a properly collected culture may not confirm infection or identify the infecting pathogenic microbe. Cytology coupled with Gram staining should be considered when possible, with phagocytosis of the organism indicative of pathogenicity. Pathogenicity reflects virulence, which is often misconstrued as resistance. The chances of proper identification of the cultured isolate pathogen are greatest if vibrant growth is obtained in an otherwise sterile environment. However, for tissues characterized by a normal flora, culture may not be able to discriminate colonization and infection by normal opportunistic organisms that have become pathogenic. Most normal flora comprises commensals that are opportunistic, i.e., able to cause disease without the support of virulence factors. A population shift from colonization to infection by such organisms is more likely to occur in at-risk patients, such as the critical-care patient, or at sites for which local immunity is compromised. Infection generally reflects normal flora, such as E. coli, P. aeruginosa, K. pneumoniae, and S. pseudintermedius., although opportunistic organisms also may be acquired from the environment.
The culture may give some indication as to the quality of the sample based on evidence of contamination. If C&S data indicate contamination, the site should be resampled (tissue collection rather than swab) after proper cleansing. For example, selected organisms, such as Bacillus sp. and Corynebacterium spp. are common contaminants, and their presence in wounds may be indicative of contamination and thus, potentially, a poorly representative sample. The location of culture may also be important in identifying the organism as a contaminant. For example, whereas beta-hemolytic Streptococcus sp. (e.g, S. canis) collected from a wound may be important, it is a likely contaminant if cultured from the ear. Streptococcus sp. pathogenicity (i.e., the likelihood of infection) can be associated with its ability to hemolyze hemoglobin, with alpha designation (hemoglobin is simply reduced) being the least and beta (red blood cells disrupted) potentially the most hemolytic and pathogenic designation. Gamma hemolysis is actually the absence of hemolysis and is demonstrated by Enterococcus spp. (previously a subset of Streptococcus spp.). However, alpha-hemolytic also can be pathogenic under the right circumstances, such as in the patient that has undergone invasive procedures such as intubation (e.g., S. pneumonia in humans). Enterococcus also has expressed beta hemolysis.The laboratory may choose not to implement susceptibility testing for those isolates considered nonpathogenic, with the interpretation of pathogenicity by the microbiologist depending on the host circumstances, including sampling site. Such decision making can only be improved with effective communication between clinician and microbiologist.
The number of organisms may be helpful in identifying the cause and effect of microbial presence and infection. Isolation of multiple organisms from a site that is easily contaminated by normal flora may represent floral colonization rather than a polymicrobial infection.24 In contrast, pure growth generally indicates infection and the potential need for therapy. For example, Pasteurella as one of several organisms collected from a nasal swab may not be relevant, but if cultured as a pure isolate, it is probably indicative of infection. A related indicator of infection is the intensity of growth. For countable tissues, the number of CFUs per mL of tissue should be considered when assessing whether the inoculum represents an infection (see previous discussion of inoculum size). Vibrant growth of a single organism generally is indicative of infection by a pathogen, even in an environment that is easily contaminated. If multiple organisms are cultured and the culture was improperly collected, cleansing of the site (if possible) and reculture may facilitate correct identification of the pathogen. If the culture was a properly collected sample, those isolates characterized by lighter growth might be deemphasized in favor of organisms with significant growth. Controlling the heavier growth may facilitate the patient’s capacity to eradicate the less dense population. For example, E. coli, SIG, or alpha-hemolytic Streptococcus are rapid growers, and if present together, the organisms with the greater growth might be targeted. However, P. aeruginosa is an example of a slow grower that is easily overwhelmed by other organisms. The impact on different growth rates exemplifies the importance of post-collection sample handing (e.g., the need to refrigerate). The presence of slow-growing organisms in a properly collected sample generally indicates the need for treatment. Specialized procedures may be necessary to identify growth in tissues normally sterile (e.g., blood culture, cerebrospinal fluid, or well-collected bronchial alveolar lavage). Thus as few as two colonies of Pseudomonas sp. cultured from a properly collected bronchial alveolar lavage might be considered significant, whereas the need for antimicrobial therapy might be reconsidered if growth is less than 105 CFUs from a site that is easily contaminated (e.g., wounds, clean-catch or catheterized urine). Patient health also should be considered: whereas, up to 103 CFU/mL of urine collected by cystocentesis may not be significant in normal dogs, it may be indicative of infection in a patient that is not concentrating urine (e.g., because of renal disease, diuretic or fluid therapy).
Although the susceptibility patterns of an isolate may offer clues as to pathogenicity of the cultured isolate, care must also be taken with this approach. Contaminants are often characterized by patterns of susceptibility rather than resistance. However, such an isolate may yet be a pathogen, particularly in a patient with no previous history of antimicrobial exposure. Complex patterns of resistance may suggest the isolate is an infecting pathogen rather than a colonizing commensal. This is exemplified by nosocomial organisms associated with medical treatments (arising within 48 hours of hospital admission). However, Stenotrophomona and Serratia are common contaminants of antiseptics or disinfectants that are characterized by complex patterns of resistance. Multidrug resistance (discussed later) must also be considered in the context of the inherent susceptibility of the organism, being relevant only if expressed toward drugs to which the organism should be susceptible. For example, P. aeruginosa may be tested toward drugs to which it is inherently resistant, yielding results that appear to suggest the isolates as multidrug resistant. However, multidrug resistance should not be considered unless expressed toward ticarcillin, carbapenems, or aminoglycosides.
The clinical microbiologist can be a powerful ally in determining the significance of isolates yielded from a sample culture. The microbiologist that is trained in veterinary medicine will be of most benefit in providing guidance regarding the relevance of the isolated microbe. However, the contributions of the clinical microbiologist will be markedly curtailed if an insufficient history of the patient from which the sample was collected is provided.
Interpreting Culture and Susceptibility Test Results
The in vitro data generated by C&S testing eventually must be applied to in vivo patient conditions. Testing methods themselves may influence results such that the data are misinterpreted. The complex nature of C&S procedures mandates standardization and a well-documented quality control program. The Committee on Laboratory Standards Institute (CLSI; previously the National Committee for Clinical Laboratory Standards [NCCLS])35-39 validates method protocols, guidelines, and interpretive standards for C&S and molecular testing; one of its subcommittees promulgate veterinary-specific standards.37,38 These standards and guidelines, which are applicable throughout the nation, and are often used internationally, reflect careful and exhaustive review of PD (microbial response to drug) and PK (host handling of drug) data. Because microbial populations are dynamic, standards and guidelines addressing their culture and susceptibility are likewise dynamic. Intermittent re-examination results in new guidelines and adjusted criteria, as is appropriate for changing microbial trends. CLSI publishes its findings so that clinical microbiological laboratories can access and implement the standards. An important caveat to C&S testing is that manufacturers supplying materials to the laboratory may not implement recommended changes in their materials in a timely fashion. Further, some veterinary diagnostic micribiological laboratories do not necessarily adhere to these standards but rather generate their own guidelines. Yet only CLSI standards undergo national peer review assessment and discussion among unbiased experts representing government, industry, academia, and clinical practice.
CLSI has generated guidelines for a variety of C&S testing methods. The PD information varies with the susceptibility procedures, with disk diffusion (Figure 6-4) and broth dilution (Figure 6-5) offering excellent examples of contrasts in advantages.40 It is the latter that provides the minimum inhibitory concentrations (MICs) necessary for comparison among drugs and design of dosing regimens. The data generated from culture and susceptibility testing represents the PD portion of PK–PD integration in that it indicates what is needed to target the microbe.
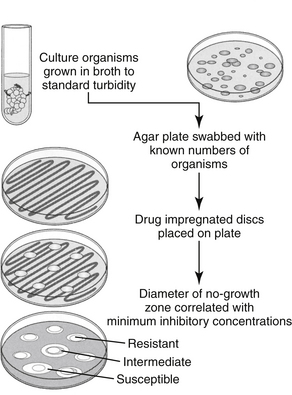
Figure 6-4 The disk diffusion method of culture and susceptibility testing. Drug diffusion from the disk results in concentrations that are higher close to the disk and gradually decrease as the diameter of the zone surrounding the disk increases. Resistant organisms can grow close to the disk despite high drug concentrations in the agar, whereas susceptible organisms will be inhibited at a standard distance from the disk. Concentrations in the agar correlate with the minimum inhibitory concentration (MIC) of the drug.
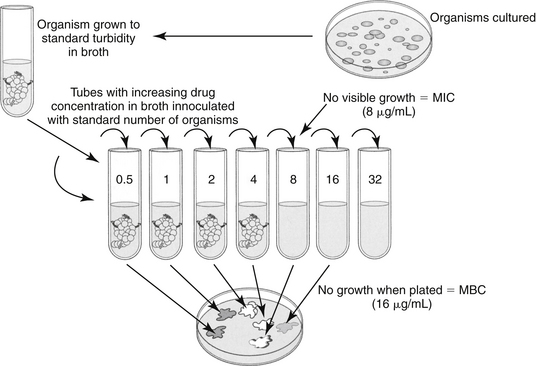
Figure 6-5 The broth dilution method of susceptibility testing provides a drug concentration to be targeted in the patient. Tubes containing serially increasing concentrations of drug are inoculated with a standard amount of the bacterial organism. At the proper time, tubes are observed for evidence of growth. The first tube (i.e., the one with the lowest concentration) that shows no evidence of growth contains the minimum inhibitory concentration (MIC) of the drug. The MIC can be used to evaluate relative drug efficacy and development of resistance and to calculate dosing regimens. This method is also one means by which the minimum bactericidal concentration (MBC) of a drug is determined. If the tubes exhibiting no growth are then used to inoculate solid agar, those tubes that yield no bacterial growth contained sufficient drug to kill, rather than simply inhibit, bacteria. The test tube that contains the lowest concentration of drug that yields no growth contains the MBC. If the MBC approximates the MIC, then the drug can be considered bactericidal.
KEY POINT 6-7
The veterinary clinical microbiologist is a powerful ally in the interpretation of culture and susceptibility testing data.
Disk Diffusion Versus Broth Dilution Techniques
Both methods of susceptibility testing require rapid growth of organisms and therefore may not be available for all organisms. Broth dilution data are particularly dependent on rapid growth, and for some organisms disk diffusion may be the only available means of obtaining data. The disk diffusion method (e.g., Kirby–Bauer) involves disks that contain a known amount of the drug of interest. The agar is streaked with a standardized inoculum of the isolated organism, and the disks are placed in standardized positions on the inoculated gel. Drug diffuses from the disk into the agar at a known rate (see Figure 6-4),40 such that, at a standard time, the concentration in the agar correlates with the minimum inhibitory concentration (MIC) of the drug as would be determined by the broth dilution procedures (the most common method serving as a gold-standard to other methods). At the prescribed time (i.e., as specified by CLSI35-37), a zone of no microbial growth (in mm) is measured around the disk. Because the concentration of the drug decreases with the distance (zone) diameter from the disk, the larger the zone, the lower the concentration of drug necessary to inhibit the growth of the organism and the more likely effective drug concentrations will be achieved at the site of the infection. A susceptible (“S”) designation is given if the zone is sufficiently large. Growth up to the designated zone indicates that the concentration of drug necessary to inhibit the organism is too high to achieve in the patient, leading to a resistant (“R”) designation. Intermediate (“I”) designation is provided for some drugs. Zone sizes necessary for an organism to be considered susceptible as opposed to resistant to a specific drug are variable and are very sensitive to disruptions in protocols, which underscores the importance of following standards. An advantage to the disk diffusion method is that multiple drugs might be simultaneously tested on one plate. This is in contrast to the more tedious and costly, yet more informative, broth dilution methods. Because disk diffusion results are reported as S, I, or R, it is described as semiquantitative.
In contrast to the disk diffusion method, the broth dilution method provides quantitative data regarding the amount of drug necessary to inhibit microbial growth (see Figure 6-5).41 For each drug of interest, tubes of liquid media are spiked with concentrations of the drug of interest, with the highest concentration generally being that just below the CLSI threshold of susceptibility (resistant MIC breakpoint). Subsequent test tubes containing serially diluted (by half) concentrations of the drug. As such, MICs are generally reported out as logarithmic fractions or multiples of 1 μg/mL (i.e., from lowest to highest 0.0312, 0.0615, 0.125, 0.25, 0.5, 1, 2, 4, 8, 16, 32, 64, 128, 256, 512; see Figure 6-5). Each drug to be tested must involve multiple test tubes or wells. The low and high range of concentrations tested for each drug will vary depending on concentrations achieved in tissues (including blood) when administered at recommended dosing regimens to the target species. For example, the ranges tested for ticarcillin would be expected to be much higher than the concentrations tested for enrofloxacin because the maximum concentration achieved in serum after administration of a recommended dose will be much higher for ticarcillin than for enrofloxacin (see Chapter 9). Occasionally, the MIC for some drugs deviates from the aforementioned tested concentrations; generally, these are drugs marketed as combinations (e.g., trimethoprim/sulfonamide combination). PD data generated for package inserts or scientific reports also may incorporate dilutions other than those delineated by CLSI. It is important to remember that CLSI guidelines are intended only to support clinical microbiological laboratories that provide direct support for patient care.
The tubes that contain broth (standardized type and amount) of the appropriate dilutions of the drug of interest must be inoculated with a standard number of the isolated bacterial organism during the logarithmic phase of growth. Microbial growth continues under standardized conditions for the standardized period (as set by CLSI35-37). At the end of the incubation period, each tube is observed for evidence of growth. Evidence of growth is determined visually or using computer systems that allow miniaturized automation (see Figure 6-5 and Figure 6-6) The tube with the lowest concentration of drug that exhibits no detectable growth contains the MIC (in μg/mL), or the minimum amount of antimicrobial necessary to (in vitro) inhibit the growth of the organism cultured from the patient.23,41 Because of the complexities of the procedures, laboratories that provide clinical C&S testing may find MIC results on the same isolate that vary, even if CLSI guidelines and interpretive standards are followed. Generally, variations within 1 broth dilution are not considered significant. Laboratories ensure that quality standards of testing are met by performing drug MIC determination for control isolates (i.e., obtained from American Testing Cell Culture: e.g, E. coli ATCC 25922, Staphylococcus intermedius ATCC 45222).41 Research publications that address bacterial PD likewise should demonstrate adherence to CLSI guidelines, including quality-control procedures.
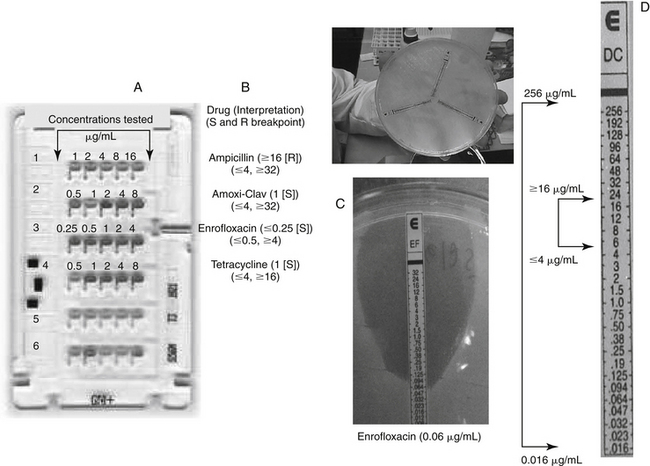
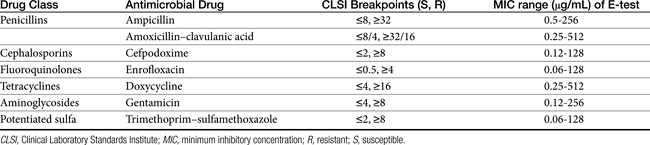
Figure 6-6 A, A commercially available antibiogram card and an E-test (C-D) with interpretation. The commercially available antibiogram card is a miniaturized broth dilution procedure that generates minimum inhibitory concentration (MIC) using a microwell design. Generally, one card is made for gram-negative isolates and another for gram-positive isolates. The size of the card limits testing of the number of drugs and the range of concentrations, with concentrations approximating the susceptible and resistant breakpoints (indicated under each drug). Some cards test only the susceptible and resistant breakpoints. Growth is indicated by a color change (all wells had growth in row 1, indicating resistance to ampicillin, but no wells had growth in row 3, indicating susceptibility to enrofloxacin). The ranges tested (above the wells) and interpretations (to the right of each drug) are provided for four of the drugs tested on the card. None of the isolates tested intermediate. A limitation of the cards is ability to indicate how susceptible an isolate is. This limitation is largely overcome with the E-test system (C; strip is enrofloxacin). Each strip releases the drug into the medium at logarithmic rates. Growth in susceptible isolates follows a tear-shaped pattern, with the point of the tear indicating the MIC. Advantages of the E-test include a very broad range of test concentrations (over16,00-fold) indicated by outer bracket (see Table 6-3), exceeding both the susceptible and resistant breakpoints (indicated by inner bracket) by several magnitudes, thus allowing assessment of how susceptible or resistant the isolate might be to the drug of interest. The MIC of this isolate is 0.06 μg/mL; for comparison, the lowest concentration that would be tested on the antibiogram. The E-test suggests that this isolate is moderately susceptible to doxycycline. The differences in the MIC between the microwell dilution and the E-test may reflect subtle differences in methodology but also the lipophilic nature of doxycline (better penetrability), thus highlighting a caveat of susceptibility testing: model drugs do not always represent the drug of interest well. Another advantage of the E-test is the smaller increments of change, and thus greater precision provided compared with tube dilution procedures. A more precise dosing regimen can thus be designed. For example, with standard tube dilution, concentrations increased from 8 to 16, whereas with E-testing, concentrations increased from 8 to 12 to 16 μg/mL. Finally, the individual nature of the test strips allows a “pick and choose” approach to individualizing drug therapy. This also, however, is a disadvantage in that costs are higher when multiple drugs are tested.
Broth dilution reports provide both the MIC (a concentration, reported in μg/mL) and (assuming CLSI procedures are followed), the CLSI interpretation of S, I, or R for that MIC. The basis of the interpretation (S, I, or R) for broth dilution procedures is addressed later in this chapter. The MIC for selected drugs may be accompanied by a “≤” or “≥”. Using Figure 6-7 as an example, Pseudomonas have an MIC for amikacin of ≤4 μg/mL. The ≤ indicates the absence of growth in the lowest concentration of amikacin tested by this laboratory (8 μg/mL); this lowest concentration may be different among laboratories that use different systems. However, often the lowest dilution tested is at or just below the lower threshold of susceptibility (the susceptible MIC breakpoint; see later definition) set by CLSI. Testing at concentrations at or very close to the susceptible breakpoint of a drug is a major disadvantage of current susceptibility testing methods: either isolate may be very susceptible to amikacin such that their actual MIC may be several tube dilutions below the lowest concentration tested (see below). As such, the closest approximation to the actual MIC for either isolate will be the concentration below the lowest dilution tested by the laboratory (i.e., ≤4 μg/mL or <8 μg/ml both indicate the same result). The isolate will be accompanied by an “S” designation, indicating susceptibility because the MIC is at or below the susceptible breakpoint determined by CLSI (Table 6-2). At the other end of the testing range, an MIC accompanied by ≥ indicates that growth was present in the highest concentration tested by the laboratory. Generally, for most automated procedures, the highest concentration tested is 1 tube dilution below the upper threshold of susceptibility (the resistant MIC breakpoint) set by CLSI for each drug (Table 6-2). For example, for cephalothin (the model drug for cephalexin in this example), the upper threshold of susceptibility (the resistant MIC breakpoint) set by CLSI is 8 μg/mL. Thus for Pseudomonas, growth was present in the well containing 4 μg/mL, indicating that the actual MIC is equal to or higher than 8 μg/mL (≥16 μg/mL or >8 μg/mL both indicate the same result). However, again the testing range limitations of the current procedures emerges in that level of resistance of the isolate cannot be assessed. The isolate may be characterized by low-level resistance, although this is unlikely for P. aeruginosa and first-generation cephalosporins (indeed, testing of P. aerugniosa toward cephalothin is not appropriate). However, unless the range tested extends beyond the resistant breakpoint, all that is known is that the isolate is resistant, and the MIC will be accompanied by an R designation.
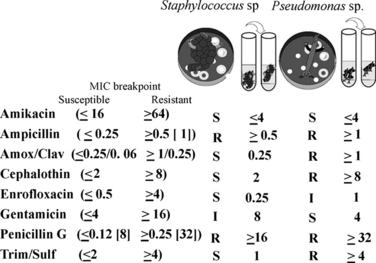
Figure 6-7 An example of a C&S report for broth dilution. The breakpoints have been added in parantheses this report; for ampicillin and penicillin, a second breakpoint in [brackets] is for the gram-negative organisms (see text and Table 6.2). The relative in vitro efficacy of antibiotics to which an organism is susceptible can be evaluated by comparing the minimum inhibitory concentration (MIC) of the organism. For Staphylococcus, the resistant MIC breakpoint to MIC ratio is 64/4, whereas that for gentamicin is 16/4 or two tube dilutions from the breakpoint. Although the isolate is considered susceptible to both drugs, amikacin presumably would be more effective (although neither generally should be used alone to treat Staphylococcus). Differences greater than one tube dilution should be considered significant. For the beta-lactams, effective treatment of Staphylococcus with cephalothin (the model drug for cephalexin) may be more easily achieved (ratio of 8/2) compared to amoxicillin clavulanic acid (ratio of 0.25/0.25). However, as time-dependent drugs, elimination half-life of both drugs would need to be considered. All values (concentrations) are in μg per mL. S = susceptible; R = resistant; I = intermediate.
Table 6-2 Interpretive Standards for Disk Diffusion Equivalent Minimum Inhibitory Concentration Breakpoints for Selected Antimicrobials
| Drug | Breakpoint μg/mL Susceptible1 | Breakpoint MIC (μg/mL) Resistant1 |
|---|---|---|
| Amikacin | ≤16 | ≥64 |
| Amoxicillin with clavulanic acid∗ | ≤ 0.25/0.12/≤8/2∗ | ≥ 1/0.5 |
| Ampicillin4∗ | ≤0.252,9 ≤0.253 |
≥0.5 ≥ 1 |
| Azithromycin | ≤4 | ≥8 |
| Carbenicillin | ≤16 | ≥64 |
| Cefazolin7 | ≤8 | ≥32 |
| Cefotaxime | ≤8 | ≥64 |
| Cefoxitin | ≤8 | ≥32 |
| Cefpodoxime | ≤2 | ≥8 |
| Ceftazidime | ≤8 | ≥32 |
| Ceftiofur10∗ | ≤2 | ≥8 |
| Ceftizoxime | ≤8 | ≥32 |
| Ceftriaxone | ≤ 8 | ≥64 |
| Cefuroxime | ≤4 | ≥32 |
| Cephalexin∗ | ≤ 2 | ≥8 |
| Cephalothin7 | ≤2 | ≥8 |
| Chloramphenicol | ≤ 8 ≤ 89 |
≥32 ≥16 |
| Ciprofloxacin16 (see also enrofloxacin) | ≤1 | ≥4 |
| Clarithromycin | ≤1 ≤8 |
≥8 ≥32 |
| Clindamycin8∗ | ≤0.5 | ≥4 |
| Difloxacin∗ | ≤0.5 | ≥4 |
| Doxycyline | ≤4 | ≥16 |
| Enrofloxacin∗ | ≤0.5 | ≥4 |
| Erythromycin | ≤0.5 ≤0.259 |
≥8≥1 |
| Florfenicol10∗ | ≤2 | ≥8 |
| Gentamicin∗ | ≤4 | ≥16 |
| Imipenem/cilastin | ≤4 | ≥16 |
| Kanamycin | ≤16 | ≥64 |
| Levofloxacin | ≤2 | ≥89 |
| Linezolid | ≤42 ≤415 |
≥ 8 |
| Lincomycin | ≤0.5 | ≥4 |
| Marbofloxacin | ≤1 | ≥4 |
| Meropenem | ≤4 | ≥16 |
| Metronidazole | ≤8 | ≥32 |
| Nitrofurantoin | ≤32 | ≥128 |
| Orbifloxacin∗ | ≤1 | ≥8 |
| Oxacillin6 | ≤2 | ≥4 |
| Penicillin G | ≤83 ≤0.122 |
≥16 ≥0.25 |
| Piperacillin | ≤162 ≤645 |
≥128 ≥128 |
| Rifampin | ≤1 | ≥4 |
| Sulfadiazine | ≤2 | ≥4 |
| Tetracycline14 | ≤4 ≤29 |
≥16 ≥8 |
| Ticarcillin | ≤645 ≤164 |
≥128 ≥128 |
| Ticarcillin with clavulanic acid | ≤64/25 ≤16/23 |
≥128/2 ≥128/2 |
| Trimethoprim/Sulfamethoxazole11 | ≤2/3813 ≤0.5/9.59 |
≥4/76 ≥4/76 |
| Vancomycin | ≤415 ≤19 ≤4 |
≥32 ≥32 |
MIC, Minimum inhibitory concentration.
∗ Old breakpoints replaced by Clinical Laboratory Standards Institute (CLSI) for amoxicillin–clavulanic acid for all organisms were, for Staphylococcus ≤4/2 = S, and ≥ 8/4 = R and for non-staphylococci, ≤8/2,=S and ≥ 32/16 = R. The provision of a separate breakpoint of ≤8 μg/mL for UTI is new.
1 Clinical Laboratory Standards replaced by CLSI for cephalexin were ≤ 8 = S, and ≥ 32 = R. The new breakpoints were becoming official at the time of publication. Institute Interpretive standards that are based on animal pathogens are designated by an asterisk.
2 When testing Staphyloccocus organisms
3 When testing gram-negative enteric organisms
4 Ampicillin is used to test amoxicillin
5 When testing Pseudomonas organisms
6 Oxacillin is used to treat methicillin, cloxacillin
7 Cephalothin is used to test all first-generation cephalosporins. Does not represent cefazolin, which should be tested separately if a gram-negative organism.
8 Clindamycin is used to test lincomycin, which is less susceptible to Staphylococcus.
9 When testing Streptococcus (S. pneumoniae for levofloxacin)
10 When testing pathogens associated with food animal respiratory disease
11 Trimethoprim–sulfamethoxazole is used to test trimethoprim–sulfadiazine and ormetoprim–sulfadimethoxine 12For urinary tract infections
14 Used to test chlortetracycline, oxytetracycline, minocycline, doxycycline
15 When testing Enterococcus organisms
16 A human criteria deemed relevant to dogs and cats. Note reduced oral bioavailability (mean of 40%) in dogs and negligible (0%-20%) in cats.
KEY POINT 6-8
Culture and susceptibility testing ideally is performed following the guidelines of the Clinical Laboratory Standards Institute (CLSI).
Among the pitfalls of C&S testing are the stepwise dilutions and the range of concentrations tested for each drug. The twofold dilutions at which MIC are tested affect the design of dosing regimens at the higher MIC. Precision in the design of dose would be facilitated if MICs could be determined between the tube dilutions. For example, the dose to target 64 μg/mL would be substantially cheaper and potentially safer than that necessary to target 128 μg/mL. The limited range of concentrations tested for each drug negatively affects the ability to identify the drug to which the isolate is most susceptible (see Figure 6-6).41 Ideally, concentrations tested by broth dilution procedures should span the range of drug concentrations that characterize the range of MICs established in a sample population of isolates of the organisms, with the highest concentration being at least one dilution above the highest drug concentration acheived in target biological fluids.41 However, automated systems test in a very narrow range. As previously noted, because the lowest concentrations are at or just below the lower limit of susceptibility, isolates that are very susceptible to the drug of interest cannot be indentified (see Table 6-2). Therefore standard antibiograms are more indicative of resistance rather than susceptibility.
A third testing system approved by the Food and Drug Administration (FDA) offers advantages to the standard commercial broth dilution card. The “E test” (Epsilon test) combines the simplicity of disk diffusion with the informative nature of broth dilution, but goes beyond standard broth dilution procedures. (see Figure 6-6). In general, MICs generated by the E-test correlate well with MICs generated from broth dilution procedures.42 A disadvantage of the E-test is that the length of the test strip limits the number of drugs that can be tested on a large plate (three strips for a large plate, one for a small plate), which contributes to the cost of the testing. However, because the drugs can be chosen for each patient, the method lends itself well to expanded susceptibility testing in the presence of a multidrug-resistant isolate. Although E tests are tedious and expensive, the wider range of concentrations tested (up to 1600-fold differences; Table 6-3) includes MICs well below the lower and higher thresholds of susceptibility, thus allowing identification of very susceptible isolates. Further, isolates with low-level resistance might be identified, potentially justifying the use of the drug, albeit at a higher dose or in combination with another drug.
KEY POINT 6-9
The E-test, but not current broth dilution procedures, allows identification of very susceptible isolates and isolates with low-level resistance.
Because of the inherent risks of inaccuracy associated with any C&S testing procedure, results yielded from procedures that are not based on CLSI standards should be interpreted with caution. Aspects subject to variability include pH; cation content and osmolality of the media; inoculum size; media volume; temperature and duration of incubation; humidity; and, for broth dilution, the method of observing growth.41 Accordingly, in practice, culture methods should be considered less than ideal unless CLSI protocols are followed. Further, preliminary data, quick “snap” tests, or other methods intended to generate rapid results must be interpreted cautiously; the role of the organisms in causing infection and the susceptibility of the organisms (unless identified as a multidrug-resistant microbe) may require full C&S testing. Whereas the FDA is responsible for approval of diagnostic tests for human medicine, such a pathway is not required for veterinary diagnostic tests.
Population Pharmacodynamic Statistics
Agar Gel Versus Broth Dilution Pharmacodynamics
A nonquantitative but helpful summary of PD data is an antibiogram that indicates the proportion of isolates that are susceptible (or resistant) to the drug of interest (Figure 6-8). Although it does not provide information regarding the level of susceptibility, it can provide direction regarding empirical drug selection by indicating the likelihood that an organism is susceptible to the drug of choice. The antibiogram might be generated for each practice on the basis of cumulative data summarized on an annual basis.
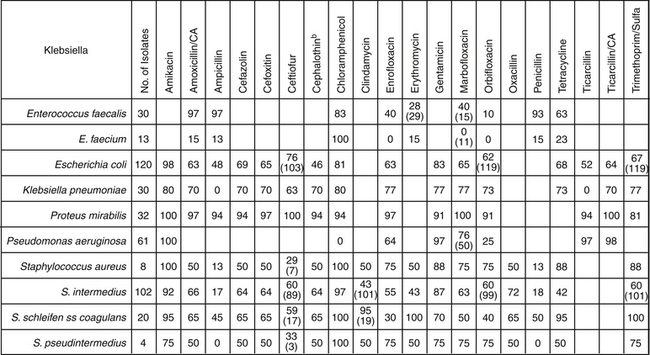
Figure 6-8 A cumulative antibiogram generated for the target species can be helpful in identifying drugs to which acquired resistance has emerged. The data will be specific to the facility (i.e., hospital). The number in each cell refers to the number of tested isolates designated as susceptible to the drug. When present, the number in parentheses in each cell refers to the number of isolates tested for that drug; otherwise, the number of isolates tested is indicated in the second left-hand column. Note that the data indicate that one species in a genera may not be well represented by another species in the same genera, particularly for Enterococcus and Staphylococcus genera.
Population statistics generated from MICs can provide even more useful information. They are particularly helpful if MIC data is not available for an isolate infecting a patient. Population MIC statistics can be generated from a sample population of the same organism; ideally, at least 100 isolates will be collected from different patients. Pertinent PD (MIC) statistics that describe the population distribution include the range (lowest and highest MICs recorded for any isolate representing the organism), mode (the most frequently reported MIC), median (the middle MIC, the 50th percentile or MIC50), and the MIC90 (or the 90th percentile MIC; the MIC at which 90% of the organisms are inhibited (see Figures 6-9 to 6-11). The two-fold dilution nature of MIC determination mandates that the geometric mean (converted to account for the noncontinous nature of MIC) be reported rather than arithmetic mean. If an MIC is not available for an organism infecting a patient, the MIC90 (or even more ideally, the MIC100) of a drug for an organism is the preferred surrogate indicator of “what is needed” by the author. For example, if S. pseudintermedius is a known or suspected cause of pyoderma in a patient and the drug to be chosen empirically is cephalexin, the MIC90 of S. intermedius for cephelexin43 can be used as an indicator of “what is needed”—that is, the PD target for therapy in the patient. PD information can be found on many package inserts scientific literature43,44 or textbooks (veterinary for animal drugs, human if not), and other resources (see Table 6-4 and Chapter 7). However, the dynamic nature of microbes in response to the presence of antimicrobials may render some population data obsolete even within several years of collection. In addition to the species, a number of host factors are likely to affect the sample population statistics and its applicability to the patient. Among the more important factors is previous exposure to antimicrobials, which is likely to be associated with higher MICs compared with MICs of isolates collected from antimicrobial-naïve animals (i.e., not pathogens). Ideally, separate statistics might be promulgated for isolates collected from animals not previously exposed to antimicrobials.
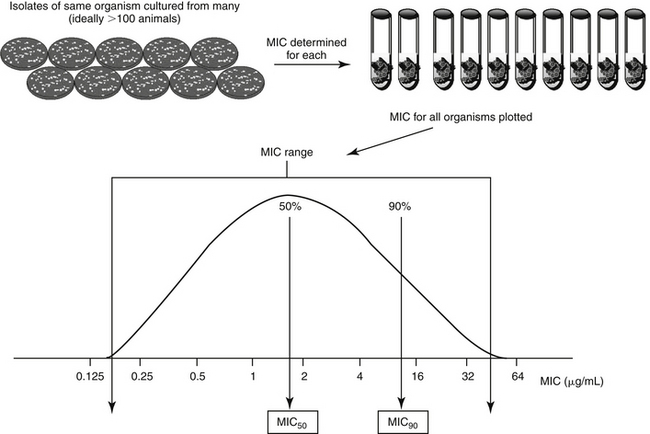
Figure 6-9 Population pharmacodynamic data. Each sample collected from a different animal (same species) yields an isolate of the organism of interest. Ideally, at least 100 representative isolates will be tested. The minimum inhibitory concentration (MIC) of each isolate is determined, and all are plotted in a distribution curve. The range represents the lowest and highest MIC determined for the isolate; the mode would be the most frequent MIC reported and the median represents the middle MIC or the 50th percentile (which, for normally distributed data, also represents the MIC) The MIC90 is the 90th percentile MIC. A representative package insert demonstrating the presentation of population pharmacodynamic data can be found in Figure 6-11.
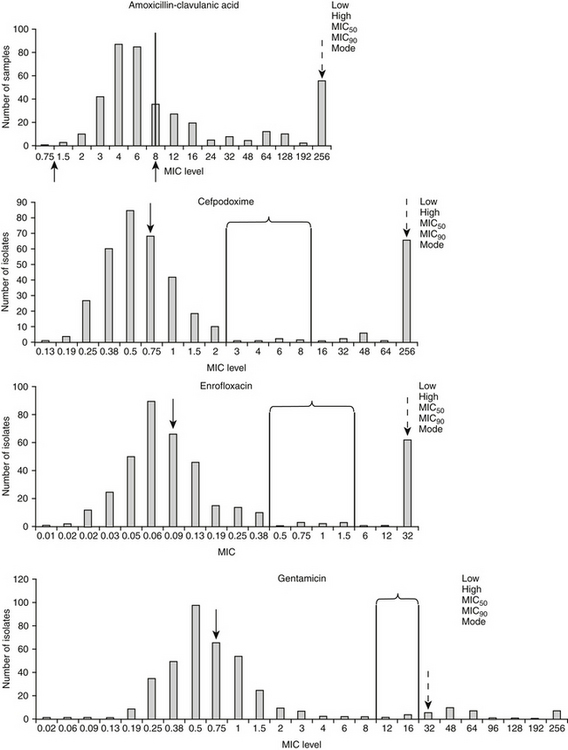
Figure 6-10 Population distributions of canine and feline Escherichia coli pathogens’ minimum inhibitory concentration (MIC) based on E-testing for two time-dependent drugs (amoxicillin–clavulanic acid, and cefpodoxime, upper plots) and two concentration-dependent drugs (enrofloxacin, and gentamicin, lower plots). The susceptible (left) and resistant (right) breakpoints, as identifed by Committee on Laboratory Standards Institute, are indicated in brackets and lines except for amoxicillin. CLSI’s new breakpoints are indicated by arrows (≤8 μg/mL for the susceptible breakpoint for isolates collected from the urinary the resistant breakpoint for other isolates; indicated by arrows below x axis). The distribution is bimodal for all drugs except gentamicin, as is indicated by a second distribution of isolates with an MIC well above the resistant breakpoint. This second population of isolates will cause the MIC90 (dashed arrow) to exceed the breakpoint. The range is represented by the lowest and highest MIC recorded (either may be limited by the range tested), the median is the 50th percentile (or MIC50) (solid arrow) the MIC90 is the 90th percentile, and the mode is the most common MIC reported for that isolate and drug. Because an E-test was used, the MIC tested are not limited to two-fold dilutions. Because these isolates are pathogens that have been cultured from dogs or cats with spontaneous disease, they may represent isolates already exposed to antimicrobials which may explain the bimodal distribution (i.e., these isolates may have undergone stepwise mutations). The population distribution of drug-naïve only isolates is likely to be somewhat lower.
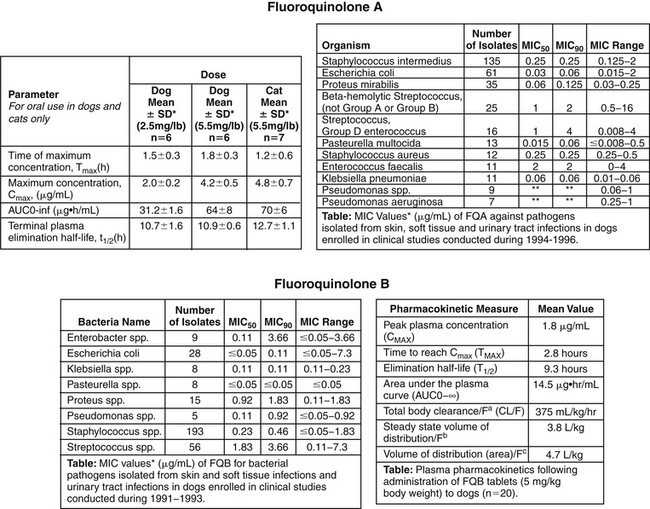
Figure 6-11 Package insert information two fluoroquinolones, FQA (top) and FQB (bottom). Comparison of MIC90 among isolates for FQA suggests that Pasteurella sp. should be more easily treated compared with Escherichia coli for both drugs. Integration of pharmacokinetic data (Cmax for these concentration-dependent drugs) and pharmacodynamic data (MIC90) can be used to identify which drug is best used to treat each microbe and which dose might be used to treat the microbe. For example, for FQA at the low dose of 2.5 mg/kg, when treating E. coli (and no patient-specific MIC is available), the Cmax is 2 μg/mL and the MIC90 is 0.06 μg/mL, resulting in a Cmax/MIC90 ratio of 25. For Proteus, the ratio is 2/0.125, or 16. For concentration-dependent drugs, the target ratio is ≥10, suggesting the low dose may be effective for both, but the large dose might be considered for Proteus if the patient is considered at risk. The number of isolates of P. aeruginosa is not sufficient to represent the population. If the process is repeated for FQB with a Cmax of 1.8 μg/mL at the low dose, the MIC90 for E. coli is 0.11 μg/mL, resulting in a ratio of 16. For Proteus, the MIC90 is 1.8 μg/mL, resulting in a ratio of only 1. Although the dose might be sufficient for E. coli, the target ratio could not be reached even at the higher dose for Proteus. Note that the number of organisms on which the data are based for each organism often does not reach the ideal target of 100. The smaller the sample size, the more caution is indicated when extrapolating this data to the general population. (From Pfizer, Package Insert and Fort Dodge, Package Insert)
KEY POINT 6-10
Recent population pharmacodynamic data such as the MIC90 can serve as a reasonable surrogate for patient data.
Comparing PD data of a drug reveals differential susceptibility among organisms toward each drug. For example, using the antimicrobial package insert, comparison of MIC90 among different organisms reveals that P. aeruginosa tends to be susceptible (if at all) only at high concentrations compared with the more susceptible Pasteurella multocida (see Figure 6-11). The MIC90 of P. aeruginosa more often than not approaches or surpasses the upper threshold of susceptibility for most drugs. Thus achieving effective antimicrobial concentrations is more likely to be difficult in the patient infected with P. aeruginosa compared with one infected with Pasteurella. A review of the antimicrobial package insert reveals other differential susceptibilities.
The distribution of the MICs of organisms for drugs can help identify emerging resistance. For example, the distribution of E. coli for several drugs (see Figure 6-10) is bimodal, representing two different populations. The majority of isolates in the first population are characterized by an MIC well below the susceptible threshold of susceptibility (i.e., susceptible MIC breakpoint). This data demonstrates that even isolates considered susceptible are characterized by MIC that are close to the susceptible breakpoint. Further, a substantial portion of the population is higher than the upper threshold of susceptibility—that is, the MIC90 exceeds the resistant MIC breakpoint. It is very possible that the second population, characterized by higher MICs, probably represents isolates previously exposed to antimicrobials; as such, culture would be prudent for those animals previously exposed to antimicrobials. Finally, detecting increasing MICs determined from sequential cultures of the same organisms in a patient with recurrent infections might indicate emerging resistance, likewise, comparison of the MIC90 of a sample population of an organism across time can reveal emerging resistance.
The Minimum Inhibitory Concentration: Determining Susceptibility Versus Resistance
Susceptibility data based on broth dilution procedures that are reported for a patient will include the MIC, as well as a susceptible, intermediate, or resistant (SIR) interpretation.
KEY POINT 6-11
Simplistically, the MIC is the pharmacodynamic target of antimicrobial therapy, indicating the minimum concentration to be achieved at the site of infection. However, it is only a starting point.
The clinical microbiology laboratory provides the interpretation on the basis of CLSI interpretive criteria. The criteria for broth dilution procedures are presented as thresholds or breakpoint MICs (MICBP) whose values will also be in terms of the concentrations tested for each drug (i.e., multiples or fractions of 1 μg/mL) (see Table 6-2). Two breakpoints are provided for each drug. An isolate inhibited at a concentration at or below the lower threshold or susceptible MIC breakpoint will be designated “S,” whereas an isolate that is able to grow after in vitro exposure to a drug concentration that equals the upper threshold or the resistant MIC breakpoint will be designated “R.” The susceptible breakpoint is at least one broth dilution below the resistant breakpoint for all drugs; for some drugs the susceptible breakpoint is 2 or more broth dilutions below the resistant breakpoint, allowing for an intermediate, or “I,” designation (see Figure 6-6). For example, for enrofloxacin, the susceptible and resistant MICBP are ≤0.5 and ≥4 μg/mL, respectively. Thus an isolate whose growth (under in vitro conditions specified by CLSI) is inhibited with as little as 0.5 μg/mL or less will be designated as “S.” On the other hand, if growth is present in the well that contains 2 μg/mL, then 4 μg/mL (the next broth dilution) or more will be necessary to inhibit the growth of the isolate, and the isolate will be designated as “R,” or resistant to enrofloxacin. An additional broth dilution occurs between 0.5 and 2 μg/mL. Isolates that are inhibited by enrofloxacin at 1 μg/mL will be designated as intermediate, or “I.” An isolate with an “I” designation has developed some level of resistance, and such isolates should be treated with that drug only cautiously, at higher doses, or in combination with a complementary antimicrobial drug. The more prudent approach would be to consider “I” isolates as “R” for that drug. Use might also be considered in circumstances in which the drug accumulates in active (i.e., unbound) form at the site of infection such that concentrations exceed that achieved in plasma. Examples might include urine (produced by the normally functioning kidney) or accumulation in phagocytic white blood cells (selected drugs). Note, however, that such concentrations may yet be insufficient.
KEY POINT 6-12
Interpretive criteria for susceptibility testing by CLSI is dynamic, changing across time as microbes acquire resistance. However, once generated, the data is applicable for all laboratories in the United States.
CLSI determines the thresholds of susceptibilities—that is, the lower (susceptible) and upper (resistant) breakpoint MICBP for each drug after exhaustive evaluation of both PK data in the target species and PD data for the drug of interest toward the microbes of interest. For animal drugs approved in the last several decades (only since then have MIC become standard testing procedures), it is likely that some of the data were collected by the drug manufacturer during the approval process. However, both PK and PD data may be drawn from peer-reviewed literature or other sources, particularly for drugs not approved for use in the target species, or for drugs whose susceptibility thresholds are being re-evaluated by CLSI.
Three criteria must be met for CLSI to establish an MICBP for each drug. The primary and initial consideration is the population distributions, with a focus on both the statistics as well as the type (i.e., modal or bimodal; see Figure 6-10). Obvious patterns of low versus high MICs can be used to identify susceptible “cutoffs” or breakpoints. Statistics will be compared among different strains of the same species being tested. Note that some organisms may be much more susceptible to the drug of interest—that is, they have MIC50 and MIC90 that are much lower compared with other organisms (e.g., pasteurella and pseudomonas). However, CLSI generally provides only one set of criteria for all susceptible isolates.
The second consideration upon which criteria are based is, the clinical pharmacology of the drug, ideally in the target species. Among the more important PK parameters evaluated by CLSI are the peak and trough plasma drug concentrations (Cmax and Cmin), area under the curve (AUC) for a 24-hour dosing period, and the drug elimination half-life (see later discussion of PD indices) (Figure 6-12).41,45-51 Volume of distribution; protein binding; and, when available, tissue (including urine) concentrations are also considered. Presumably, the MIC of an isolate considered susceptible should be below the peak plasma or tissue drug concentrations or Cmax of a given drug when administered at a recommended dose. Indeed, selected resistant breakpoints correlate with Cmax, as is demonstrated for amikacin when administered to dogs at 22 mg/kg. The Cmax of 65 μg/mL (see Chapter 7) is similar to the resistant breakpoint for amikacin. However, for some breakpoints, the correlation does not exist, as is exemplified by amoxicillin/clavulanic. The Cmax of the labeled dose of 13.5 mg/kg, administered orally, will generate a Cmax of approximately 4 to 6 μg/mL of amoxicillin in dogs, yet the resistant breakpoint for nonstaphylococcal organisms has been ≥32 μg/mL, well beyond the concentrations that can be achieved in plasma at any reasonable dose. (In response to this disparity, CLSI has recently re-examined and readjusted the breakpoint for amoxicillin-clavulanic acid as is discussed below; see Table 6-2).Another limitation of setting breakpoints based on peak plasma drug concentrations is their lack of precision: breakpoints are limited to concentrations used for susceptibility testing and thus will be reported using twofold dilutions. As such, a resistant breakpoint concentration may be considerably higher or lower than the actual concentration achieved at the recommended dose. As such, the actual MIC reported for an infecting isolate should be compared to Cmax reported in a sample population of the target species is an ideal default when selecting drugs (and the dosing regimen; see later discussion). The original veterinary fluoroquinolones were approved with “flexible labels” (multiple doses); for those drugs, the susceptible and resistant breakpoints reflect the Cmax resulting from the lowest and highest labeled doses of the drug.
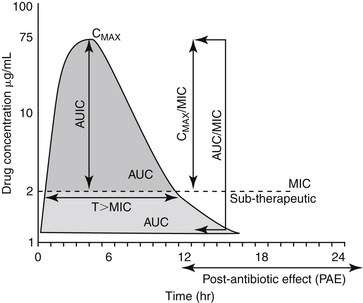
Figure 6-12 Pharmacodynamic indices (PDI) resulting from integration of pharmacokinetic (PK) data (from sample population of target or closely related surrogate species), represented here by Cmax (μg/mL; target of 10 to 12) or area under the curve (AUC) (μg∗hr/mL; target of 100-125), and microbial or pharmacodynamic (PD) data, represented here by minimum inhibitory concentration (MIC). Note that the PDI are based on (Mouton 2005 47 and Amsterdam 200541). Note that activity should be based on free (unbound) drug. The pertinent PK parameters for this hypothetical drug and infecting microbe would be as follows: Cmax of 75 μg/mL, half-life of approximately 2 hours and AUC of 159 μg∗hr/mL. The PD parameter, or MIC of the infecting organism, is 2 μg/mL. The PDI for this drug and microbe combination would be as follows: Cmax/MIC = 37.5 (surpasses target for a concentration-dependent drug); AUC/MIC = 80 (insufficient for a gram-negative organism if a fluorinated quinolone but potentially sufficient for a gram-positive organism); and T > MIC = 8 hours, which would allow a 12, 16, or 24- (32 hr is not a reasonable interval) hour dosing interval for a time-dependent drug if the target T > MIC were 75%, 50%, or 25%, respectively. The AUIC (area under the inhibitory curve) is the integrated area of the curve above the MIC. Although somewhat similar to AUC/MIC, its use among investigators has caused confusion, leading experts in the field to focus on AUC/MIC as the area-based PDI of choice.
The third criteria that must be met as CLSI determines thresholds of susceptibility is one of clinical relevance. The MICBP must be clinically relevant—that is, the microorganisms defined as susceptible should respond clinically to the drug, and in vitro data must correlate adequately with in vivo findings.46,51 The MICBP values established by CLSI for each drug are generally not included in the susceptibility reports. However, having this information would be helpful because the MIC of the infecting organism might then be compared with the MICBP of the drug, allowing an assessment of “level” of susceptibility of the isolate to the drug of interest (discussed in more detail later). Breakpoints set by CLSI are based on isolates collected from across the country and accordingly are relevant for any clinical microbiology laboratory that uses CLSI protocols. As such, CLSI breakpoints generally can be obtained by any microbiology laboratory that uses CLSI criteria for its testing procedures (the preferred choice). Interpretive standards generally also are delineated on package inserts (including sources such as Physicians’ Desk Reference for human-marketed drugs or similar veterinary compendiums).
In order to simplify the use of interpretive criteria, when possible, CLSI breakpoints are generally inclusive to organisms whose spectrum is included in the drug, regardless of the site of infection. However, notable exceptions occur for both organisms and tissues. Organism exceptions generally are those either very susceptible to the drug or for organisms that easily develop in vivo resistance. For example, lower or more stringent penicillin breakpoints have been promulgated for Staphylococcus spp. because their beta-lactamases are particularly destructive toward penicillins compared to cephalosporins. Because destructive activity decreases the amount of drug at the site, a second set of lower breakpoints are provided. A higher breakpoint has been established for other susceptible isolates (e.g., gram-negative organisms; see Table 6-2). In contrast to Staphylococcus, P. aeruginosa is particularly susceptible to ticarcillin; accordingly, while another coliform is considered resistant if it is inhibited at 16 μg/mL P. aeruginosa is still considered susceptible even if, in vitro, it grows in the presence of 64 μg/mL (see Table 6-2). Another consideration regarding inclusivity is the generation of tissue specific breakpoints. Interpretive criteria are based on plasma drug concentrations. However, renally excreted drugs achieve much higher concentrations in urine compared to plasma. New interpretive criteria for ampicillin and amoxicillin–clavulanic acid includes a separate breakpoint that is tissue dependent: a higher breakpoint (≤8 μg/mL) has been set for E. coli-associated urinary tract infections, compared to much lower breakpoints for other tissues. However, caution is recommended when selecting a drug for treatment of a UTI when the “S” designation for a urinary isolate is based on breakpoints that differ from plasma (see Chapter 8) as it assumes, among other considerations, that infection occurs only in the bladder, that urine is concentrated by the patient, and the duration of exposure fulfills the needs of a time-dependent drug (see later discussion). Just as resistance can be detected in an infecting organism collected from a patient, across time, statistics may also indicate resistance (i.e., the MIC and MIC statistics [mode, median, MIC50, and MIC90]). Because CLSI reviews new data intermittently, their criteria for interpretive standards should result in new MICBP, and laboratories will implement these changes. The sequelae of increasing MICs in certain populations should result in an increasing number of isolates designated as “R” for drugs to which the organisms traditionally have been considered susceptible. An example is amoxicillin–clavulanic acid, whose susceptible breakpoint was recently decreased by CLSI (see Table 6-2).
Integration of Pharmacokinetics and Pharmacodynamics: How Much Is Needed Versus How Much is Achieved?
The information provided on the C&S report can be used effectively beyond the simple identification of “S” drugs. The MIC is an indicator of what is needed to target the organism and thus provides the PD information for the infecting isolate. Often, an organism will be designated as susceptible to several drugs. One advantage to the broth dilution method compared with the disk diffusion method of C&S is the ability of the
KEY POINT 6-13
The closer the MIC (or MIC90) of an organism is to the Cmax, the greater the risk of therapeutic failure and the more important the need to modify the dosing regimen for the patient.
former to rank the drugs according to relative efficacy based on MIC. However, the relative efficacy of antimicrobials designated as “S” against a specific pathogen should not be determined by directly comparing MICs among different drugs, even drugs in the same class. The MIC varies among the drugs for a number of reasons beyond susceptibility. These include, but are not limited to, differences in molecular weight (one drug is simply heavier than another), the ability of the drug to penetrate the organism, the number of molecules necessary to “neutralize” the target, and differences in the mechanisms of action. Further, each drug achieves different concentrations in the patient as a result of differences in disposition. Thus antimicrobials differ in potency and MIC.47 Rather than direct comparison to an isolate MIC for one drug to an MIC for another drug, one should also consider the concentration of drug that will be achieved in the patient when the drug is administered at the recommended dose (i.e., what is achieved; Cmax). A less than ideal method of standardizing MIC is to compare how far the MIC of the drug of interest is from the resistant breakpoint (i.e., ratio of resistant MIC breakpoint of the drug to MIC of the organism). This is less ideal, as was previously discussed, because the resistant breakpoint does not always equate with the Cmax.
The limitations in using MIC breakpoint as an indicator of what will be achieved in the patient reflect the serial concentration used for susceptibility testing. If a drug achieves a Cmax of 24 μg/mL at the recommended dose, this concentration falls between 16 and 32 μg/mL serial dilutions. A susceptible breakpoint of 16 μg/mL might underestimate while a resistant breakpoint of 32 μg/mL would over overestimate what will be achieved at the recommended dose. Thus, a more relevant choice among the susceptible drugs might be based on comparing what is needed to what is achieved—in plasma (e.g., the Cmax) when the drug is administered at the recommended dose. The ratio of Cmax to MIC, however, requires that PK information be available for the drug of interest, ideally in the species of interest. This information often is available on package inserts for animal-approved drugs but must be collected from the literature for other drugs (see Chapter 7). The United States Pharmacopiea antimicrobial monographs published by the Journal of Veterinary Pharmacology and Therapeutics (2007) offers a compilation of PK information for a variety of antimicrobials and animal species. The integration of PD and PK is the first step in selecting a drug. However, this step is preliminary in that it does not take into account other factors that affect tissue concentrations, including host and microbial factors.
The relationship between the MIC of the infecting organism (what is needed) and the Cmax also should be used as a basis for designing a dosing regimen.48-50 The closer the MIC (or MIC90) to the Cmax (or the MICBP), the higher the dose and for time-dependent drugs, the shorter the interval that is indicated. For a more specific design of a dose, the MIC can serve as the targeted drug concentration (see Enhancing Antimicrobial Efficacy). If MIC data is not available from the isolate collected in the patient, population PD [MIC90] data might be used as a surrogate PD indicator of how much is needed; (see Figure 6-11).
Caveats to Culture and Susceptibility Interpretation
Despite the usefulness of C&S testing, the information nonetheless reflects in vitro testing that must be applied to in vivo situations.40,41 Results can be misleading or misinterpreted, despite ideal sampling and C&S techniques. Some of the pitfalls reflect the limitations presented by practicalities in testing (e.g., economics, technology), whereas others reflect limitations of applying in vitro data to an in vivo system. Examples include the following:
Drug Factors that Affect Antimicrobial Efficacy
The conditions of C&S testing cannot mimic conditions of in vivo drug behavior. Most notably, drug concentrations in the host are not static, as occurs in the in vitro system, but are dynamic, with duration of exposure dependent on elimination half-life. The importance of the PK of the drug will be addressed with discussion of concentration- and time-dependent drugs. In addition to the static exposure to drugs, in vitro systems currently do not take into account binding of drug to circulating proteins (e.g., doxycycline, cefovecin). Because only unbound drug is free to enter the microbe, and protein is not present in culture media, MICs generated from C&S should be compared with unbound, not total Cmax. Finally, the in vitro system cannot take into account a variety of host (e.g., immunoglobulins, cytokines, secretory proteins, etc) or microbial (e.g., biofilm or other virulence factors) activities oriented toward defense.
Bactericidal Versus Bacteriostatic Antimicrobials
The MIC is a drug concentration that inhibits but does not necessarily kill the target microbe. The MIC is a reasonable clinical outcome target because the success of antimicrobial therapy usually depends on host defenses that sequester and ultimately kill the microbial population after its inhibition by the drug. Antibacterials are frequently classified according to their ability to kill (bactericidal) rather than inhibit (bacteriostatic) microbial growth. Whereas bacteriostatic activity is indicated by the MIC, bactericidal activity of a drug is indicated by its minimum bactericidal concentration (MBC). However, this classification is based on in vitro methods. The MBC can be determined in several ways. For example, those tests tubes in which no visible sign of growth was observed following the broth dilution procedures can be reinoculated on nutrient-rich agar plates (see Figure 6-5). Those test tubes that yield no growth contained concentrations that killed, rather than inhibited, the microbe. Thus the test tube with the lowest concentration that yielded no growth contained the MBC of the drug. All antimicrobial drugs are characterized by an MBC; however, those drugs whose MBC approximates the MIC (e.g., within one broth dilution) might also be considered bactericidal. The MBC is most appropriately determined based on killing curves, which measure the number of surviving bacteria after exposure to fixed concentrations of drug; the concentrations are based on those achieved in serum at defined time intervals.41 For organisms noted as “S” to bacteridical drugs, achieving sufficient drug at the site to kill, rather than simply inhibit, the infecting pathogen is possible. For bacteriostatic drugs achieving the concentration necessary to kill the organisms without causing harm to the patient is much more difficult.23,41 Exceptions might occur for drugs that are accumulated (in an unbound state) at the site of infection (e.g., urine or phagocytic white blood cells); in selected instances bactericidal concentrations of a bacteriostatic drug can be achieved.
KEY POINT 6-15
Bactericidal and bacteriostatic activities are defined according to vitro conditions, which may not necessarily translate to the patient.
Categorization of static versus cidal activity of a drug can be associated with its mechanism of action (Table 6-5). In general, drugs that target cell walls (beta-lactams, glycopeptides), cell membranes (polymixin B, colistin), or DNA (fluorinated quinolones) tend to act bactericidal in vitro. Ribosomal inhibitors that target more than one subunit (i.e., 30s and 50s; or 70s) also tend to be bactericidal. In contrast, drugs that target a single ribosomal subunit (tetracyclines, macrolides, lincosamides) or metabolic pathway (sulfonamides) tend to act bacteriostatic. Combinations of two bacteristatic antimicrobials that act in an additive or synergistic fashion may also result in bactericidal effects (e.g., a sulfonamide combined with a potentiating dipyrimidine). However, the distinction between bactericidal and bacteriostatic effects of a drug depends on the concentration; a bactericidal drug can be rendered nonbactericidal if concentrations sufficient to kill the organism are not reached at the site of infection the site of infection, or under conditions that slow the growth of the target organism (e.g., hypoxic environment or if used in combination with drugs that antagonize bactericidal actions). In such instances, the bactericidal drug will act in a bacteriostatic fashion. On the other hand, drugs classified as bacteriostatic may act bactericidal if high enough concentrations can be achieved, as might occur if the drug is accumulated in an unbound form (e.g., WBC or other tissues).
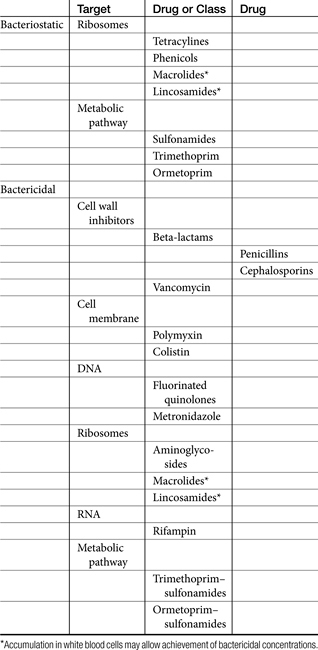
Because host defenses must be effective to kill those organisms whose growth is merely inhibited, achieving bactericidal concentrations of an antimicrobial drug are paramount to therapeutic success in immunocompromised hosts (e.g., viral infections, granulopoietic patients, use of immunohibiting drugs) or immunocompromised sites (septicemia, meningitis, valvular endocarditis, and osteomyelitis).23,26
Integration of Pharmacokinetics and Pharmacodyamics: Pharmacodynamic Indices
Although the MIC of a (presumed) infecting organism offers a target concentration for antimicrobial therapy, simply achieving the MIC of the organism in plasma may not be sufficient to ensure efficacy. Among the relationships that affect efficacy is the PK/PD relationship—that is, the dynamic relationship between the drug concentration to which the organism is exposed throughout the dosing interval (PK) and the response of the infecting organism to the drug, as estimated, for example, by the MIC (PD).55-57 This relationship is affected by many host and microbial factors. Definitions of terms used to describe the integration of PK and PD (PD indices or PDI) are varied, depending on the author. For the purposes of this text, definitions will be drawn from Mouton.47 It is important to note that many of the terms are based on parameters determined through in vitro testing. Therefore host and microbial factors still need to be considered. Further, most PDI are based on a 24-hr-dosing interval, thus modifications in dosing regimens should be based on a 24-hr period (Figure 6-12). The relevance of PDI to drugs with half-lives longer than 24 hr (e.g., azithromycin, cefovecin) is not clear.
Postantibiotic Exposure
Antimicrobials may continue to exert an effect even though the drug is no longer present at concentrations that exceed the MIC. The term postantibiotic exposure has been promoted to refer to the combined definitions that have emerged experimentally. Among the terms is the postantibiotic effect (PAE), which has both an in vitro and an in vivo definition.47 The PAE is exhibited by drugs, and is defined in vitro as the period of suppression of bacterial growth after a short exposure of the organism to the antimicrobial.47 The PAE for a drug, is determined in vitro by exposing a standard inoculum to it, removing the drug and determining the time that elapses (in hours) before the culture CFUs increase by tenfold. In vivo, the PAE is the time it takes for the number of CFUs to increase tenfold in treated animals after concentrations drop below the MIC at the tissue site.47 Clinically, the PAE indicates the ability of a drug to inhibit bacterial growth after the drug is no longer present or is below the MIC of the infecting microbe.49,58-60 As such, it also takes into account an effect a drug might have at subinhibitory concentrations. The impact of the PAE on antimicrobial efficacy can be profound, particularly for concentration-dependent drugs. It is the PAE that allows some drugs to be administered at long intervals despite short half-lives.41,50,52,59,61,62 The PAE may be absent for some organisms or some patients (e.g., some immunocompromised patients).49 The duration of PAEs varies with each drug and each organism and the relationship between PDC and MIC (Table 6-6).63 In general, concentration-dependent drugs appear to exhibit longer PAEs, with the duration of the PAE being proportional to the magnitude of the peak PDC (i.e., longer with higher PDC).64 However, for each drug, and within drug classes, the PAE is markedly variable, depending on the organism.65 Whereas beta-lactams exhibit a substantial PAE toward selected streptococci (i.e., thus making treatment less time dependent for streptococci), their PAE toward gram-negative organisms is minimal.66 Applying information regarding the PAE to clinical patients is complicated by variable results (reflecting marked variability in methods) among investigators. The PAE is enhanced by combination antimicrobial therapy.67-69 The duration of the PAE should be included in estimates of doses or dosing intervals. Some antimicrobials also have been associated with a postantibiotic sub-MIC effect (PASE) that may further prolong the dosing interval70,71; further, a postantibiotic leukocyte enhancement effect (PALE) has been described for some antimicrobials. These are incorporated in in vivo estimates of PAE. However, clinical relevance of measurements of PAE, PASE, and PALE based on in vitro observations is not clear.66,72 These studies do point out the reasons that some antimicrobials are effective at long intervals and indicate the need for a better understanding of the relationship of PDC, MIC, and PAE in the clinical patient.
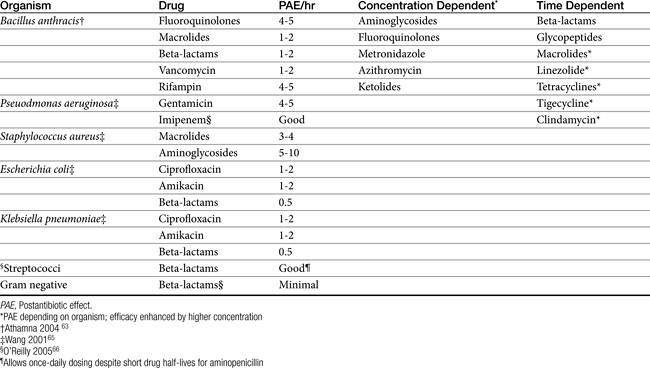
Time- Versus Concentration-Dependent Drugs
The relationship among efficacy, MIC, and the magnitude and time course of PDC can be categorized, in vitro, as either concentration-dependent (sometimes referred to as dose-dependent) or time-dependent (sometimes referred to as concentration-independent) (see Figure 6-13; and Table 6-4).41 A third classification has emerged with characteristics from each of these classes. (e.g., as shown by fluoroquinolones). Although studies that categorize drugs are largely in vitro, the categorizations generally are supported by in vivo studies that include animal models and human clinical trials.57 Concentration-dependent drugs, best represented by the fluoroquinolones and aminoglycosides, are characterized by efficacy that is best predicted by the magnitude of PDC (Cmax) compared to the MIC of the infecting organism (see Figures 6-11 to 6-13)73-79 For such drugs the magnitude of Cmax/MIC (or Cmax/MIC90) generally should be 10 to 12; for more difficult infections (e.g., P. aeruginosa, or infections caused by multiple organisms), the higher index should be targeted.57 The time that PDC is above the MIC—that is, the duration of exposure, (T > MIC or T > MIC90)—is not as important as is the Cmax/MIC; in fact, efficacy may be enhanced (e.g., for the aminoglycosides) by a drug-free period (i.e., a long interval between doses; see Figure 6-13).61,73,74,80-82 This may reflect, in part, the phenomenon of adaptive resistance.83 Adaptive resistance refers to a reversible refractoriness to the bactericidal effects of an antibacterial agent. This phenomenon has been documented particularly for gram-negative organisms and the aminoglycosides, but it appears to occur with the quinolones as well. The resistance appears to reflect a protective phenotypic alteration in the bacteria, such as reversible downregulation of aminoglycoside active transport. Adaptive resistance occurs rapidly (within 1 to 2 hours) of antimicrobial therapy; duration reflects the elimination half-life of the drug. In humans adaptive resistance to aminoglycosides may last for up to 16 hours after a single dose of aminoglycoside, with partial return of bacterial susceptibility at 24 hours and complete recovery at approximately 40 hours.83
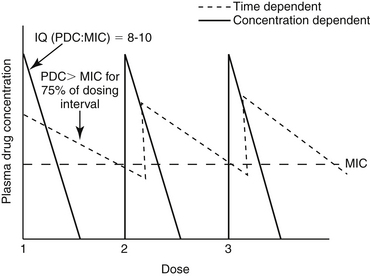
Figure 6-13 The relationship between plasma (tissue) drug concentration, and the minimum inhibitory concentration (MIC) of the organism may determine drug efficacy. The efficacy of concentration-dependent drugs (e.g., aminoglycosides; fluorinated quinolones; and, in some cases, azithromycin or other azalides) depends on a high Cmax to MIC ratio. Doses might be increased to ensure sufficiently high plasma drug concentrations to achieve the target ratio. In contrast, for time-dependent drugs, such as beta-lactams, sulfonamides, and nonaminoglycoside ribosomal inhibitors, efficacy is maximized by ensuring that plasma drug concentration remains above the MIC for most (50% to 75%) of the dosing interval.
For concentration-dependent drugs, a dose that is too low is particularly detrimental. In a mouse model of E. coli peritonitis, the antibacterial efficacy of ciprofloxacin, but not imipenem (or meropenem), was improved by doubling the dose. For some concentration-dependent drugs, efficacy may be both dose- and time-dependent, with the best predictor of efficacy being AUC/MIC. For example, efficacy of fluorinated quinolones can be predicted by both a Cmax/MIC (target 10 to 12) or AUC/MIC (target 100 to 125) (see Figure 6-13).41,84-86 The AUC/MIC may be particularly predictive for fluoroquinolones when treating gram-positive isolates; adding a second full dose may be prudent for some infections. Otherwise, concentration-dependent drugs generally can be administered at longer intervals (e.g., once a day).
In contrast to concentration-dependent drugs, efficacy of time-dependent drugs (e.g., beta-lactams) is best predicted by the time that PDC remains above the MIC. For such drugs PDC should be 2 to 4 times the MIC of the infecting microbe and should be maintained above the MIC (T > MIC) throughout a significant portion of the dosing interval (see Figures 6-12 and 6-13). However, the recommended duration of T > MIC varies from a low of 25% for carbapenems to 50% to 70% for extended-spectrum penicillins to potentially 100% for penicillin and aminopenicillins (an exception being treatment of streptococci).56,57,61,74,87,88 With time-dependent drugs, increasing the dose may be necessary to ensure that PDCs are above (ideally severalfold) the MIC.57 Maintaining T > MIC may be problematic for drugs with a short half-life unless the isolate is extremely susceptible (e.g., most beta-hemolytic streptococci for penicillins). Given that drug concentrations decrease by 50% every drug half-life, a Cmax/MIC of 2 will result in a PDC that will reach the MIC in 1 half-life. The duration of the dosing interval then depends on the desired target duration (i.e., 25% to 100%) of T > MIC. If T > MIC is 100%, then the dosing interval would be 1 half-live. If T > MIC is 50%, the dosing interval would be 2 half-lives, and if T > MIC is 25%, the dosing interval could be as long as 4 half-lives. For each additional half-life to be added to the duration that T > MIC, concentrations, and thus dose, must be doubled again (i.e., quadrupuled if T > MIC = 2 half-lives, increased eightfold if T > MIC=3 half-lives, and so on). Table 6-4 demonstrates the impact of Cmax:MIC and half-life on time-dependent drugs. Although efficacy of time-dependent drugs requires T > MIC for a sufficient time, efficacy might be enhanced by increasing the dose for drugs with a sufficiently long half-life, shortening the interval for drugs with a short half-life, or both. Constant-rate infusion,89 or slow-release products,90 might be ideal for time-dependent drugs with short half-lives. Drugs characterized by longer elimination half-lives might be preferred (e.g., cefovecin43,44). Efficacy also should be enhanced for time-dependent drugs that persist to accumulate in the unbound state in selected tissues (i.e., macrolides, clindamycin,91 or drugs that accumulate in phagocytes.) The downside to using antimicrobial drugs with a very long half-life is that the time to steady-state concentrations and thus peak effects might be prolonged. Moreover, a “hit hard, get out quick” approach to therapy is difficult to implement with such antimicrobials.
The relationship between PDC, MIC, and time- versus concentration-dependency might be explained, in part, by the mechanism of antimicrobial action. Efficacy of the aminoglycosides or fluorinated quinolones depends on drug binding to the target (ribosome and topoisomerase or DNA gyrase, respectively); once sufficient binding occurs, protein synthesis or DNA activity, respectively, is prevented and does not re-initiate. However, beta-lactams substitute as a substrate for cell wall synthesis, and, as long as the organism is growing, it is synthesizing cell wall. Thus, the drug needs to be present as long as the organism is growing. The glycopeptides (e.g., vancomycin), which also target the cell wall, are also time-dependent drugs.
KEY POINT 6-17
Efficacy of concentration-dependent drugs can be enhanced by increasing the dose such that peak concentrations are 10 to 12 times the MIC of the infecting microbe (Cmax/MIC ≥12).
Increasingly, CLSI is using PDI as the basis for determination of breakpoint MIC. However, not surprisingly, the optimal relationship between PDC and MIC that determines efficacy of a drug is not so simple and varies with organisms and drugs. The optimal relationship between PDC and MIC and the parameter that best predicts antimicrobial efficacy (e.g., peak PDC; the ratio of area under the drug concentration versus time curve to the organism’s MIC; duration of PDC above MIC) have not been established definitively for all antimicrobials.52,61,84,85 However, for drugs characterized by inhibition (bacteriostatic drugs), T > MIC may best predict efficacy. For some fluoroquinolones, and particularly for gram-positive organisms, efficacy is best predicted by the ratio of AUC (which is influenced by both dose and interval) to MIC rather than simply the Cmax/MIC. The optimal AUC/MIC also varies with the organism, ranging from as low as 30 to 40 for S. pneumoniae and levofloxacin to greater than 350 for P. aeruginosa and ciprofloxacin. The area under the inhibitory curve (AUIC) reflects the integrated AUC above the MIC during the dosing interval. This parameter is similar to but varies from AUC/MIC in that it is the AUC that is above the MIC (in contrast, AUC/MIC involves the complete area). The AUIC should exceed 125 for fluorinated quinolones to achieve bacterial killing; an AUIC that exceeds 250 results in rapid killing.57 Thus for treatment of some infections with concentration-dependent drugs, the dosing regimen might be designed to maximize both the Cmax/MIC and the AUC/MIC. Some drugs (e.g., macrolides) are characterized by time-dependency for some organisms but concentration-dependency for others.
Table 6-4 offers examples of PDIs that are achieved using current recommended dosing regimens for selected drugs and selected PD data from selected pathogens that cause infection in dogs. The PD data are based on MIC90 obtained from package inserts of drugs approved in dogs or literature that provided PD data specific for canine pathogens that was more recent than package insert data. For some drugs PD was not available for canine pathogens, so PD from human pathogens was used. Doses were chosen from Table 7-1 and generally reflected the highest dose for which PK was available. When possible, nonintravenous routes were chosen because Cmax from intravenous data may not represent Cmax following distribution. Table 6-6 is intended to demonstrate how PDI might be used to assess a dosing regimen. It is not unusual to find that the target Cmax/MIC (>10) often is not reached for concentration-dependent drugs) or T > MIC (50% for most) for time-dependent drugs. One could argue that the MIC90 is an unreasonable PD target; indeed, for some isolates it may be. The preferred PD statistic would be the MIC from the isolate infecting the patient; it can be substituted in this table for the MIC90. Likewise, the 95th lower confidence interval is preferred to the mean Cmax or half-life for the PK component of PDI. For concentration-dependent drugs, doses can be increased (whenever safety permits) to achieve the target Cmax/MIC; for time-dependent drugs, both the dose (increase) and interval (shorten) might be modified. Alternatively, or perhaps in addition to, combination therapy might be considered. Note that the PDIs are based on plasma drug concentrations (PDCs). For some drugs, PDC underestimates concentrations in extracellular fluid. However, for others, PDC frequently overestimates by 25% to 50% or more extracellular fluid drug concentrations. Doses may need to be increased by 25% to 50% to adjust for this difference. As important as PK/PD integration is to the design of the dosing regimen, its application to the clinical patient will be facilitated by an understanding of the microbial and host factors that influence response to the drug.