CHAPTER 2 Diagnostic Tests for the Cardiovascular System
CARDIAC RADIOGRAPHY
Thoracic radiographs are important for assessing overall heart size and shape, pulmonary vessels, and lung parenchyma, as well as surrounding structures. Both lateral and dorsoventral (DV) or ventrodorsal (VD) views should be obtained. On lateral view, the ribs should be aligned with each other dorsally. On DV or VD views, the sternum, vertebral bodies, and dorsal spinous processes should be superimposed. The views chosen should be used consistently because slight changes in the appearance of the cardiac shadow occur with different positions. For example, the heart tends to look more elongated on the VD view in comparison with that on the DV view. In general, better definition of the hilar area and caudal pulmonary arteries is obtained using the DV view. High kilovoltage peak (kVp) and low milliampere (mA) radiographic technique is recommended for better resolution among soft tissue structures. Exposure is ideally made at the time of peak inspiration. On expiration, the lungs appear denser, the heart is relatively larger, the diaphragm may overlap the caudal heart border, and pulmonary vessels are poorly delineated. Use of exposure times short enough to minimize respiratory motion and proper, straight (not obliquely tilted) patient positioning are important for accurate interpretation of cardiac shape and size and pulmonary parenchyma.
The radiographs should be examined systematically, beginning with assessment of the technique, patient positioning, presence of artifacts, and phase of respiration during exposure. Chest conformation should be considered when evaluating cardiac size and shape in dogs because normal cardiac appearance may vary from breed to breed. The cardiac shadow in dogs with round or barrel-shaped chests has greater sternal contact on lateral view and an oval shape on DV or VD view. In contrast, the heart has an upright, elongated appearance on lateral view and a small, almost circular shape on DV or VD view in narrow- and deep-chested dogs. Because of variations in chest conformation and the influences of respiration, cardiac cycle, and positioning on the apparent size of the cardiac shadow, mild cardiomegaly may be difficult to identify. Also, excess pericardial fat may mimic the appearance of cardiomegaly. The cardiac shadow in puppies normally appears slightly large relative to thoracic size compared with that of adult dogs.
The vertebral heart score (VHS) can be used as a means of quantifying the presence and degree of cardiomegaly in dogs and cats, because there is good correlation between body length and heart size regardless of chest conformation. Measurements for the VHS are obtained using the lateral view (Fig. 2-1) in adult dogs and puppies. The cardiac long axis is measured from the ventral border of the left mainstem bronchus to the most ventral aspect of the cardiac apex. This same distance is compared with the thoracic spine beginning at the cranial edge of T4; length is estimated to the nearest 0.1 vertebra. The maximum perpendicular short axis is measured in the central third of the heart shadow; the short axis is also measured in number of vertebrae (to the nearest 0.1) beginning with T4. Both measurements are added to yield the VHS. A VHS between 8.5 to 10.5 vertebrae is considered normal for most breeds. Some variation may exist among breeds; an upper limit of 11 vertebrae may be normal in dogs with a short thorax (e.g., Miniature Schnauzer), whereas an upper limit of 9.5 vertebrae may be normal in dogs with a long thorax (e.g., Dachshund). In some other breeds (e.g., Greyhounds), the VHS also can be above the usual reference range.
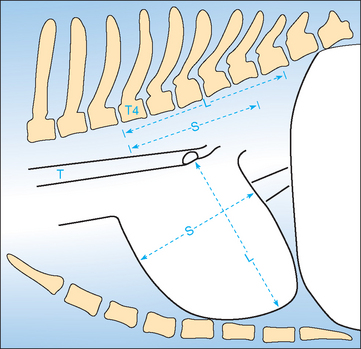
FIG 2-1 Diagram illustrating the vertebral heart score (VHS) measurement method using the lateral chest radiograph. The long-axis (L) and short-axis (S) heart dimensions are transposed onto the vertebral column and recorded as the number of vertebrae beginning with the cranial edge of T4. These values are added to obtain the VHS. In this example, L = 5.8 v, S = 4.6 v; therefore VHS = 10.4 v. T, Trachea.
(Modified from Buchanan JW, Bücheler J: Vertebral scale system to measure canine heart size in radiographs, J Am Vet Med Assoc 206:194, 1995.)
The cardiac silhouette on lateral view in cats is aligned more parallel to the sternum than in dogs; this parallel positioning may be accentuated in old cats. Radiographic positioning can influence the relative size, shape, and position of the heart because the feline thorax is so flexible. On lateral view the normal cat heart is less than or equal to two intercostal spaces (ICS) in width and less than 70% of the height of the thorax. On DV view the heart is normally no more than one half the width of the thorax. Measurement of VHS is useful in cats also. From lateral radiographs in cats, mean VHS in normal cats is 7.5 vertebrae (range 6.7 to 8.1 v). The mean short axis cardiac dimension taken from DV or VD view, compared with the thoracic spine beginning at T4 on lateral view, was 3.4 to 3.5 vertebrae. An upper limit of normal of 4 vertebrae was identified. In kittens, as in puppies, the relative size of the heart compared with that of the thorax is larger than in adults because of smaller lung volume.
An abnormally small heart shadow results from reduced venous return (e.g., from shock or hypovolemia). The apex appears more pointed and may be elevated from the sternum. Radiographic suggestion of abnormal cardiac size or shape should be considered within the context of the physical examination and other test findings.
CARDIOMEGALY
Generalized enlargement of the heart shadow on plain thoracic radiographs may indicate true cardiomegaly or pericardial distention. With cardiac enlargement, the contours of different chambers are usually still evident, although massive right ventricular (RV) and atrial (RA) dilation can cause a round cardiac silhouette. Fluid, fat, or viscera within the pericardium tends to obliterate these contours and create a globoid heart shadow. Common differential diagnoses for cardiac enlargement patterns are listed in Box 2-1.
 BOX 2-1
CARDIAC CHAMBER ENLARGEMENT PATTERNS
Most diseases that cause cardiac dilation or hypertrophy affect two or more chambers. For example, mitral insufficiency leads to left ventricular (LV) and left atrial (LA) enlargement; pulmonic stenosis causes RV enlargement, a main pulmonary artery bulge, and often RA dilation. For descriptive purposes, however, specific chamber and great vessel enlargements are discussed below. Fig. 2-2 illustrates various patterns of chamber enlargement.
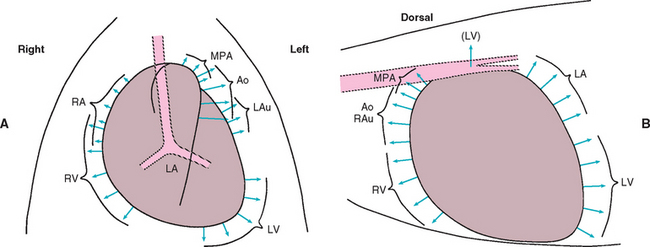
FIG 2-2 Common radiographic enlargement patterns. Diagrams indicating direction of enlargement of cardiac chambers and great vessels in the dorsoventral (A) and lateral (B) views. Ao, Aorta (descending); LA, left atrium; LAu, left auricle; LV, left ventricle; MPA, main pulmonary artery; RA, right atrium; RAu, right auricle; RV, right ventricle.
(Modified from Bonagura JD, Berkwitt L: Cardiovascular and pulmonary disorders. In Fenner W, editor: Quick reference to veterinary medicine, ed 3, Philadelphia, 2000, JB Lippincott.)
Left Atrium
The LA is the most dorsocaudal chamber of the heart, although its auricular appendage extends to the left and craniad. An enlarged LA bulges dorsally and caudally on lateral view. There is elevation of the left and possibly right mainstem bronchi; compression of the left mainstem bronchus occurs in patients with severe LA enlargement. In cats the caudal heart border is normally quite straight on lateral view; LA enlargement causes subtle to marked convexity of the dorsocaudal heart border, with elevation of the mainstem bronchi. On DV or VD view, the mainstem bronchi are pushed laterally and curve slightly around a markedly enlarged LA (sometimes referred to as the “bowed-legged cowboy sign”). A bulge in the 2- to 3-o’clock position of the cardiac silhouette is common in cats and dogs with concurrent left auricular enlargement. Massive LA enlargement sometimes appears as a large, rounded soft tissue opacity superimposed over the LV apical area on DV (VD) view (Fig. 2-3). LA size is influenced by the pressure or volume load imposed, as well as the length of time the overload has been present. For example, mitral regurgitation of slowly increasing severity may cause massive LA enlargement without pulmonary edema if the chamber has had time to dilate at relatively low pressures. Conversely, rupture of chordae tendinae causes acute valvular regurgitation; there can be pulmonary edema with relatively normal LA size because atrial pressure rises quickly.
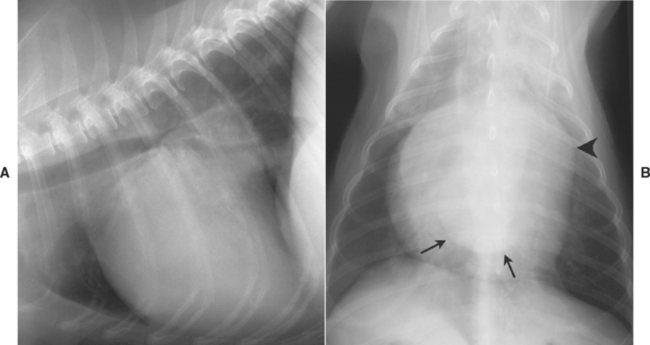
FIG 2-3 Lateral (A) and dorsoventral (B) views from a dog with chronic mitral regurgitation. Marked left ventricular and atrial enlargement are evident. Dorsal displacement of the carina is seen in A; the caudal edge of the left atrium (arrows), superimposed over the ventricular shadow, and a prominent left auricular bulge (arrowhead) are seen in B.
Left Ventricle
LV enlargement is manifested on lateral view by a taller cardiac silhouette with elevation of the carina and caudal vena cava. The caudal heart border becomes convex, but cardiac apical sternal contact is maintained. On DV/VD view, rounding and enlargement occur in the 2- to 5-o’clock position. Some cats with hypertrophic cardiomyopathy maintain the apical point; concurrent atrial enlargement creates the classic “valentine-shaped” heart.
Right Atrium
RA enlargement causes a bulge of the cranial heart border and widening of the cardiac silhouette on lateral view. Tracheal elevation may occur over the cranial portion of the heart shadow. Bulging of the cardiac shadow on DV/VD view occurs in the 9- to 11-o’clock position. The RA is largely superimposed over the RV; although differentiation from RV enlargement is difficult, concurrent enlargement of both chambers is common.
Right Ventricle
RV enlargement (dilation or hypertrophy) usually causes increased convexity of the cranioventral heart border and elevation of the trachea over the cranial heart border on lateral view. With severe RV enlargement and relatively normal left heart size, the apex is elevated from the sternum. The carina and caudal vena cava are also elevated. The degree of sternal contact of the heart shadow is not, by itself, a reliable sign of RV enlargement because of breed variation in chest conformation. On DV/VD view, the heart tends to take on a reverse-D configuration, especially without concurrent left-sided enlargement. The apex may be shifted leftward, and the right heart border bulges to the right.
INTRATHORACIC BLOOD VESSELS
Great Vessels
The aorta and main pulmonary artery dilate in response to chronic arterial hypertension or increased turbulence (poststenotic dilation). Subaortic stenosis causes dilation of the ascending aorta. Because of its location within the mediastinum, dilation here is not easily detected, although widening and increased opacity of the dorsocranial heart shadow may be observed. Patent ductus arteriosus causes a localized dilation in the descending aorta just caudal to the arch, which is where the ductus exits; this “ductus bump” is seen on DV or VD view. A prominent aortic arch is more common in cats than dogs. The thoracic aorta of older cats also may have an undulating appearance. Systemic hypertension is a consideration in these cases.
Severe dilation of the main pulmonary trunk (usually associated with pulmonic stenosis or pulmonary hypertension) can be seen as a bulge superimposed over the trachea on lateral radiograph. On DV view in the dog, main pulmonary trunk enlargement causes a bulge in the 1- to 2-o’clock position. In the cat the main pulmonary trunk is slightly more medial and is usually obscured within the mediastinum.
The caudal vena cava (CaVC) normally angles cranioventrally from diaphragm to heart. The width of the CaVC is approximately that of the descending thoracic aorta, although its size changes with respiration. The CaVC-cardiac junction is pushed dorsally with enlargement of either ventricle. Persistent widening of the CaVC could indicate right ventricular failure, cardiac tamponade, pericardial constriction, or other obstruction to right heart inflow. The following comparative findings suggest abnormal CaVC distention: CaVC/aortic diameter (at same ICS) >1.5; CaVC/length of the thoracic vertebra directly above the tracheal bifurcation >1.3; and CaVC/width of right fourth rib (just ventral to the spine) >3.5. A thin CaVC can indicate hypovolemia, poor venous return, or pulmonary overinflation.
Lobar Pulmonary Vessels
Pulmonary arteries are located dorsal and lateral to their accompanying veins and bronchi. On lateral view, the cranial lobar vessels in the nondependent (“up-side”) lung are more ventral and larger than those in the dependent lung. The width of the cranial lobar vessels is measured where they cross the fourth rib in dogs or at the cranial heart border (fourth to fifth rib) in cats. These vessels are normally 0.5 to 1 times the diameter of the proximal one third of the fourth rib. The DV view is best for evaluating the caudal pulmonary vessels. The caudal lobar vessels should be 0.5 to 1 times the width of the ninth (dogs) or tenth (cats) rib at the point of intersection. Four pulmonary vascular patterns are usually described: overcirculation, undercirculation, prominent pulmonary arteries, and prominent pulmonary veins.
An overcirculation pattern occurs when the lungs are hyperperfused, as in left-to-right shunts, overhydration, and other hyperdynamic states. Pulmonary arteries and veins are both prominent; the increased perfusion also generally increases lung opacity. Pulmonary undercirculation is characterized by thin pulmonary arteries and veins, along with increased pulmonary lucency. Severe dehydration, hypovolemia, obstruction to right ventricular inflow, right-sided congestive heart failure, and tetralogy of Fallot can cause this pattern. Some animals with pulmonic stenosis appear to have pulmonary undercirculation. Overinflation of the lungs or overexposure of radiographs also minimizes the appearance of pulmonary vessels.
Pulmonary arteries larger than their accompanying veins indicate pulmonary arterial hypertension. The pulmonary arteries become dilated, tortuous, and blunted, and visualization of the terminal portions is lost. Heartworm disease often causes this pulmonary vascular pattern, as well as patchy to diffuse interstitial pulmonary infiltrates.
Prominent pulmonary veins are a sign of pulmonary venous congestion, usually from left-sided congestive heart failure. On lateral view, the cranial lobar veins are larger and denser than their accompanying arteries and may sag ventrally. Dilated, tortuous pulmonary veins may be seen entering the dorsocaudal aspect of the enlarged LA in dogs and cats with chronic pulmonary venous hypertension. But pulmonary venous dilation is not always visualized in patients with left-sided heart failure. In cats with acute cardiogenic pulmonary edema, enlargement of both pulmonary veins and arteries can be seen.
PATTERNS OF PULMONARY EDEMA
Pulmonary interstitial fluid accumulation increases pulmonary opacity. Pulmonary vessels appear ill-defined, and bronchial walls look thick as interstitial fluid accumulates around vessels and bronchi. As pulmonary edema worsens, areas of fluffy or mottled fluid opacity progressively become more confluent. Alveolar edema causes greater opacity in the lung fields and obscures vessels and outer bronchial walls. The air-filled bronchi appear as lucent, branching lines surrounded by fluid density (air bronchograms). Interstitial and alveolar patterns of pulmonary infiltration can be caused by many pulmonary diseases, as well as by cardiogenic edema (see Chapter 19). The distribution of these pulmonary infiltrates is important, especially in dogs. Cardiogenic pulmonary edema in dogs is classically located in dorsal and perihilar areas and is often bilaterally symmetric. Nevertheless, some dogs develop an asymmetric or concurrent ventral distribution of cardiogenic edema. The distribution of cardiogenic edema in cats is usually uneven and patchy. The infiltrates are either distributed throughout the lung fields or concentrated in the middle zones. Both the radiographic technique and the phase of respiration influence the apparent severity of interstitial infiltrates. Other abnormalities on thoracic radiographs are discussed in the Respiratory Disease section.
ELECTROCARDIOGRAPHY
The electrocardiogram (ECG) graphically represents the electrical depolarization and repolarization of cardiac muscle. The ECG provides information on heart rate, rhythm, and intracardiac conduction; it may also suggest the presence of specific chamber enlargement, myocardial disease, ischemia, pericardial disease, certain electrolyte imbalances, and some drug toxicities. But the ECG alone cannot be used to make a diagnosis of congestive heart failure, assess the strength (or even presence) of cardiac contractions, or predict whether the animal will survive an anesthetic or surgical procedure.
NORMAL ECG WAVEFORMS
The normal cardiac rhythm originates in the sinoatrial node and activates the rest of the heart via specialized conduction pathways (Fig. 2-4). The ECG waveforms, P-QRS-T, are generated as heart muscle is depolarized and then repolarized (Fig. 2-5 and Table 2-1). The QRS complex, as a representation of ventricular muscle electrical activation, may not necessarily have each individual Q, R, or S wave components (or variations thereof). The configuration of the QRS complex depends on the lead being recorded as well as the pattern of intraventricular conduction.
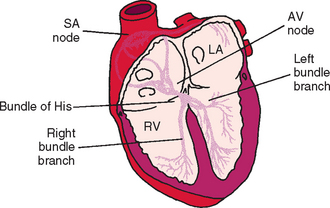
FIG 2-4 Schematic of cardiac conduction system. AV, Atrioventricular; LA, left atrium; RV, right ventricle; SA, sinoatrial.
(Modified from Tilley LE: Essentials of canine and feline electrocardiography, ed 3, Philadelphia, 1992, Lea & Febiger.)
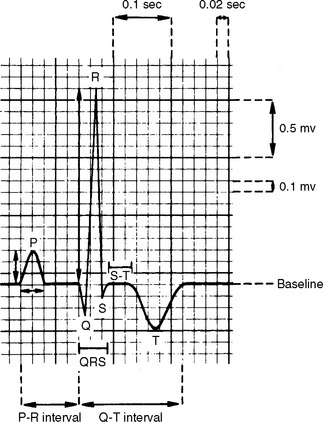
FIG 2-5 Normal canine P-QRS-T complex in lead II. Paper speed is 50 mm/sec; calibration is standard (1 cm = 1 mV). Time intervals (seconds) are measured from left to right; waveform amplitudes (millivolts) are measured as positive (upward) or negative (downward) motion from baseline.
(From Tilley LE: Essentials of canine and feline electrocardiography, ed 3, Philadelphia, 1992, Lea & Febiger.)
 TABLE 2-1 Normal Cardiac Waveforms
| WAVEFORM | EVENT |
|---|---|
| P | Activation of atrial muscle; normally is positive in leads II and aVF |
| PR interval | Time from onset of atrial muscle activation, through conduction over the AV node, bundle of His, and Purkinje fibers; also called PQ interval |
| QRS complex | Activation of ventricular muscle; by definition, negative deflection after the R waveQ is the first negative deflection (if present), R the first positive deflection, and S is the |
| J point | End of the QRS complex; junction of QRS and ST segment |
| ST segment | Represents the period between ventricular depolarization and repolarization (correlates with phase 2 of the action potential) |
| T wave | Ventricular muscle repolarization |
| QT interval | Total time of ventricular depolarization and repolarization |
AV, Atrioventricular.
LEAD SYSTEMS
Various leads are used to evaluate the cardiac activation process. The orientation of a lead with respect to the heart is called the lead axis. Each lead has direction and polarity. If the myocardial depolarization or repolarization wave travels parallel to the lead axis, a relatively large deflection will be recorded. As the angle between the lead axis and the orientation of the activation wave increases toward 90 degrees, the ECG deflection for that lead becomes smaller; it becomes isoelectric when the activation wave is perpendicular to the lead axis. Each lead has a positive and a negative pole or direction. A positive deflection will be recorded in a lead if the cardiac activation wave travels toward the positive pole (electrode) of that lead. If the wave of depolarization travels away from the positive pole, a negative deflection will be recorded in that ECG lead. Both bipolar and unipolar ECG leads are used clinically. A bipolar lead records electrical potential differences between two electrodes on the body surface; the lead axis is oriented between these two points. (Augmented) unipolar leads have a recording electrode (positive) on the body surface. The negative pole of the unipolar leads is formed by “Wilson’s central terminal” (V), which is an average of all other electrodes and is analogous to zero.
The standard limb lead system records cardiac electrical activity in the frontal plane (as depicted by a DV/VD radiograph). In this plane, left-to-right and cranial-to-caudal currents are recorded. Fig. 2-6 depicts the six standard frontal leads (hexaxial lead system) overlying the cardiac ventricles. Unipolar chest (precordial) leads “view” the heart from the transverse plane (Fig. 2-7). Box 2-2 lists common ECG lead systems.
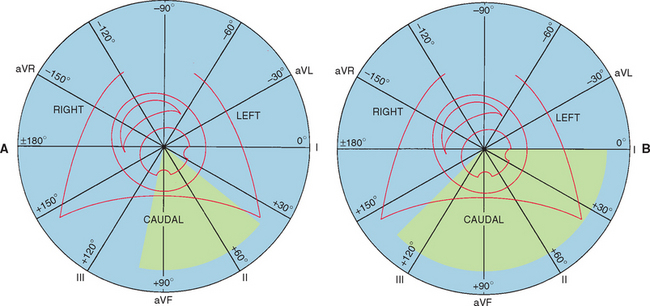
FIG 2-6 Frontal lead system: diagrams of six frontal leads over schematic of left and right ventricles within the thorax. Circular field is used for determining direction and magnitude of cardiac electrical activation. Each lead is labeled at its positive pole. Shaded area represents normal range for mean electrical axis. A, Dog. B, Cat.
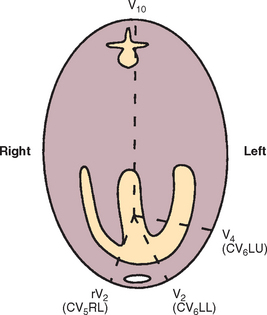
FIG 2-7 Commonly used chest leads seen from cross-sectional view. CV5RL is located at right edge of the sternum in fifth intercostal space (ICS), CV6LL is near sternum at sixth ICS, CV6LU is at costochondral junction at sixth ICS, and V10 is located near seventh dorsal spinous process.
BOX 2-2 Small Animal ECG Lead Systems
RA, Right arm; LA, left arm; LL, left leg; ICS, intercostal space.
Unipolar Chest Leads
| V1, rV2 (CV5RL) | Fifth right ICS near sternum |
| V2 (CV6LL) | Sixth left ICS near sternum |
| V3 | Sixth left ICS, equidistant between V2 and V4 |
| V4 (CV6LU) | Sixth left ICS near costochondral junction |
| V5 and V6 | Spaced as for V3 to V4, continuing dorsally in sixth left ICS |
| V10 | Over dorsal spinous process of seventh thoracic vertebra |
APPROACH TO ECG INTERPRETATION
Routine ECG recording is usually done with the animal placed on a nonconducting surface in right lateral recumbency. The proximal limbs are parallel to each other and perpendicular to the torso. Other body positions may change various waveform amplitudes and affect the calculated mean electrical axis (MEA). However, if only heart rate and rhythm are desired, any recording position can be used. Front limb electrodes are placed at the elbows or slightly below, not touching the chest wall or each other. Rear limb electrodes are placed at the stifles or hocks. With alligator clip or button/plate electrodes, copious ECG paste or (less ideally) alcohol is used to ensure good contact. Communication between two electrodes via a bridge of paste or alcohol or by physical contact should be avoided. The animal is gently restrained in position to minimize movement artifacts. A relaxed and quiet patient produces a better quality tracing. Holding the mouth shut to discourage panting or placing a hand on the chest of a trembling animal may be helpful.
A good ECG recording produces minimal artifact from patient movement, no electrical interference, and a clean baseline. The ECG complexes should be centered and totally contained within the background gridwork so that neither the top nor bottom of the QRS complex is clipped off. If the complexes are too large to fit entirely within the grid, the calibration should be adjusted (e.g., from standard [1 cm = 1 mV] to 1/2 standard [0.5 cm = 1 mV]). The calibration used during the recording must be known to accurately measure waveform amplitude. A calibration square wave (1 mV amplitude) can be inscribed manually during the recording if this is not done automatically. The paper speed and lead(s) recorded also must be evident for interpretation.
A consistent approach to ECG interpretation is recommended. First the paper speed, lead(s) used, and calibration are identified. Then the heart rate, heart rhythm, and MEA are determined. Finally, individual waveforms are measured. The heart rate is the number of complexes (or beats) per minute. This can be calculated by counting the number of complexes in 3 or 6 seconds and then multiplying by 20 or 10, respectively. If the heart rhythm is regular, 3000 divided by the number of small boxes (at paper speed 50 mm/sec) between successive RR intervals equals the instantaneous heart rate. Because variations in heart rate are so common (in dogs especially), determining an estimated heart rate over several seconds is usually more accurate and practical than calculating an instantaneous heart rate.
Heart rhythm is assessed by scanning the ECG for irregularities and identifying individual waveforms. The presence and pattern of P waves and QRS-T complexes are determined. The relationship between the P waves and QRS-Ts is then evaluated. Calipers are often useful for evaluating the regularity and interrelationships of the waveforms. Estimation of MEA is described on p. 28.
Individual waveforms and intervals are usually measured using lead II. Amplitudes are recorded in millivolts and durations in seconds. Only one thickness of the inscribed pen line should be included for each measurement. At 25 mm/sec paper speed, each small (1 mm) box on the ECG gridwork is 0.04 seconds in duration (from left to right). At 50 mm/sec paper speed, each small box equals 0.02 seconds. A deflection from baseline (up or down) of 10 small boxes (1 cm) equals 1 mV at standard calibration. ECG reference ranges for cats and dogs (Table 2-2) are representative of most normal animals, although complex measurements for some subpopulations can fall outside these ranges. For example, endurance-trained dogs can have ECG measurements that exceed the “normal” range, probably reflecting the training effects on heart size. Such changes in nontrained dogs suggest pathologic cardiac enlargement. Manual frequency filters, available on many ECG machines, can markedly attenuate the recorded voltages of some waveforms when activated, although baseline artifact is reduced. The effects of filtering on QRS amplitude may complicate the assessment for ECG chamber enlargement criteria.
TABLE 2-2 Normal ECG Reference Ranges for Dogs and Cats
| DOGS | CATS |
|---|---|
| Heart Rate | |
| 70 to 160 beats/min (adults)* to 220 beats/min (puppies) | 120 to 240 beats/min |
| Mean Electrical Axis (Frontal Plane) | |
| +40 to +100 degrees | 0 to +160 degrees |
| Measurements (Lead II) | |
| P-wave duration (maximum) | |
| 0.04 sec (0.05 sec, giant breeds) | 0.035 to 0.04 sec |
| P-wave height (maximum) | |
| 0.4 mV | 0.2 mV |
| PR interval | |
| 0.06 to 0.13 sec | 0.05 to 0.09 sec |
| QRS complex duration (maximum) | |
| 0.04 sec | |
| R-wave height (maximum) | |
| 0.9 mV in any lead; QRS total in any lead <1.2 mV | |
| ST segment deviation | |
| No marked deviation | |
| T wave | |
| Normally <25% of R wave height; can be positive, negative, or biphasic | Maximum 0.3 mV; can be positive (most common), negative, or biphasic |
| QT interval duration | |
| 0.15-0.25 (to 0.27) sec; varies inversely with heart rate | 0.12 to 0.18 (range 0.07 to 0.2) sec; varies inversely with heart rate |
| Chest Leads | |
| R wave 1.0 mV maximum | |
| V10: negative QRS; negative T wave (except Chihuahua) | R/Q <1.0; negative T wave |
Each small box on the ECG paper grid is 0.02 second wide at 50 mm/sec paper speed, 0.04 second wide at 25 mm/sec, and 0.1 mV high at a calibration of 1 cm = 1 mV.
* Range may extend lower for large breeds and higher for toy breeds.
† May be greater in young (under 2 years old), thin, deep-chested dogs.
SINUS RHYTHMS
The normal cardiac rhythm originates in the sinus node and produces the P-QRS-T waveforms previously described. The P waves are positive in caudal leads (II and aVF) and the PQ (or PR) intervals are consistent. Regular sinus rhythm is characterized by less than 10% variation in the timing of the QRS to QRS (or R to R) intervals. Normally the QRS complexes are narrow and upright in leads II and aVF. However, an intraventricular conduction disturbance or ventricular enlargement pattern may cause them to be wide or abnormally shaped.
Sinus arrhythmia is characterized by cyclic slowing and speeding of the sinus rate. This is usually associated with respiration; the sinus rate tends to increase on inspiration and decrease with expiration as a result of fluctuations in vagal tone. There may also be a cyclic change in P-wave configuration (“wandering pacemaker”), with the P waves becoming taller and spiked during inspiration and flatter in expiration. Sinus arrhythmia is a common and normal rhythm variation in dogs. It occurs in resting cats but is not often seen clinically. Pronounced sinus arrhythmia is associated with chronic pulmonary disease in some dogs.
“Brady-” and “tachy-” are modifying terms that describe abnormally slow or fast rhythms, respectively, without identifying intracardiac origin. Both sinus bradycardia and sinus tachycardia are rhythms that originate in the sinus node and are conducted normally; however, the rate of sinus bradycardia is slower than normal for the species, whereas that of sinus tachycardia is faster than normal. Some causes of sinus bradycardia and tachycardia are listed in Box 2-3.
Sinus arrest is absence of sinus activity lasting at least twice as long as the animal’s longest expected QRS to QRS interval. An escape complex usually interrupts the resulting pause if sinus activity does not resume in time. Long pauses can cause fainting or weakness. Sinus arrest cannot be differentiated with certainty from sinoatrial (SA) block by the surface ECG. Fig. 2-8 illustrates various sinus rhythms.
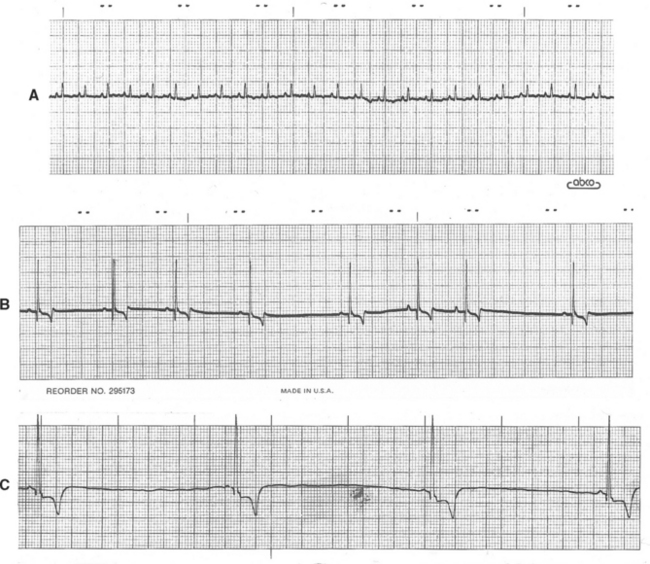
FIG 2-8 Sinus rhythms. A, Sinus rhythm in normal cat. Lead II, 25 mm/sec. B, Sinus arrhythmia with wandering pacemaker in a dog. Note gradual variation in P-wave height associated with respiratory changes in heart rate; this variation is normal in the dog. Lead aVF, 25 mm/sec. C, Sinus bradycardia. Lead II, 25 mm/sec, dog.
ECTOPIC RHYTHMS
Impulses originating from outside the sinus node (ectopic impulses) are abnormal and create an arrhythmia (dysrhythmia). Ectopic impulses are described on the basis of their general site of origin (atrial, junctional, supraventricular, ventricular) and their timing (Fig. 2-9). Timing refers to whether the impulse occurs earlier than the next expected sinus impulse (premature) or after a longer pause (late or escape). Escape complexes represent activation of a subsidiary pacemaker and function as a rescue mechanism for the heart. Premature ectopic impulses (complexes) occur singly or in multiples; groups of three or more constitute an episode of tachycardia. Episodes of tachycardia can be brief (paroxysmal tachycardia) or quite prolonged (sustained tachycardia). When one premature complex follows each normal QRS, a bigeminal pattern exists; the origin of the premature complexes determines whether the rhythm is described as atrial or ventricular bigeminy. Fig. 2-10 contains examples of supraventricular and ventricular complexes.
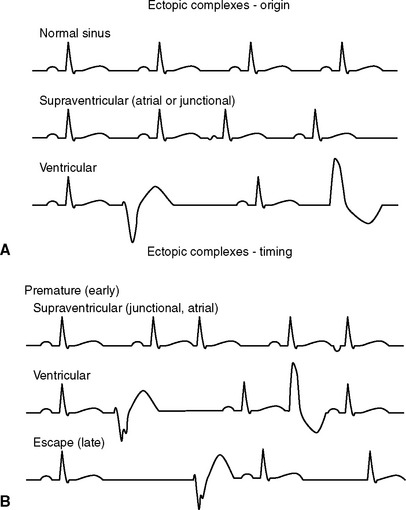
FIG 2-9 Diagrams illustrating the appearance of ectopic complexes. Abnormal impulses can originate (A) above the AV node (supraventricular) or from within the ventricles (ventricular). Supraventricular ectopic complexes have a normal-appearing QRS. An abnormal P wave usually precedes a complex originating in atrial tissue; no P wave (or a retrograde P wave in the ST segment—not shown) is common with an impulse originating from the AV junction. Ventricular-origin QRS complexes have a different configuration from the normal sinus QRS. The timing (B) of ectopic complexes refers to whether they appear before the next expected sinus complex (premature or early) or after a longer than expected pause (escape or late).
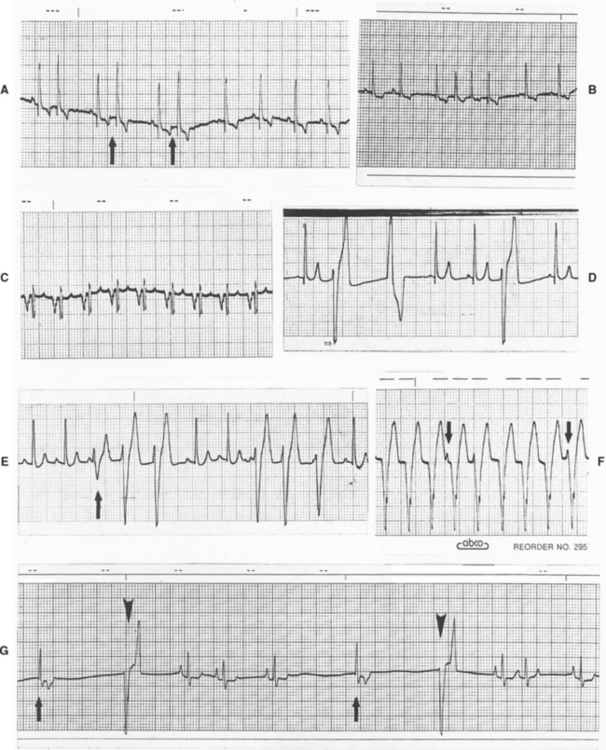
FIG 2-10 Ectopic complexes and rhythms. A, Atrial premature complexes in an old Cocker Spaniel with mitral insufficiency. Note small negative P waves (arrows) preceding early complexes. Slight increase in QRS size is thought to be related to minor intraventricular conduction delay with prematurity (lead III, 25 mm/sec). B, Short paroxysm of atrial tachycardia (lead II, 25 mm/sec, dog). C, Sustained atrial tachycardia in Irish Setter with mitral stenosis. Note negative, abnormal P waves (lead II, 25 mm/sec). D, Multiform ventricular premature complexes (lead II, 25 mm/sec, dog). E, Intermittent paroxysms of ventricular tachycardia demonstrating fusion complex (arrow) (lead II, 25 mm/sec, dog). F, Sustained ventricular tachycardia with several nonconducted P waves (arrows) superimposed (lead aVF, 25 mm/sec, dog). G, Sinus arrhythmia with periods of sinus arrest interrupted by junctional (arrows) and ventricular (arrowheads) escape complexes (lead II, 25 mm/sec, dog). The differentiation between escape and premature complexes is crucial. For legend, see facing page.
Supraventricular Premature Complexes
Supraventricular premature complexes are impulses that originate above the atrioventricular (AV) node, either in the atria or the AV junctional area. Because they are conducted into and through the ventricles via the normal conduction pathway, their QRS configuration is normal (unless an intraventricular conduction disturbance is also present). Premature complexes arising within the atria are usually preceded by an abnormal P wave (positive, negative, or biphasic configuration) called a P’ wave. If an ectopic P’ wave occurs before the AV node has completely repolarized, the impulse may not be conducted into the ventricles (an example of physiologic AV block). In some cases, the premature impulse is conducted slowly (prolonged P’Q interval) or with a bundle branch block pattern. Although P’ waves usually do not precede junctional complexes, retrograde conduction into the atria sometimes causes a negative P’ wave to follow, be superimposed on, or even precede the associated QRS complex. If the specific origin of the ectopic complex(es) is unclear, the more general term supraventricular premature complex (or supraventricular tachycardia) is used. Clinically it is usually more important to determine whether an arrhythmia originates from above the AV node (supraventricular) or below it (ventricular) rather than the more specific localization. Supraventricular premature complexes that also depolarize the sinus node reset the sinus rhythm and create a “noncompensatory pause” (i.e., the interval between the sinus complexes preceding and following the premature complex is less than that of three consecutive sinus complexes).
Supraventricular Tachycardias
Tachycardias of supraventricular origin often involve a reentrant pathway using the AV node (either within the AV node or using an accessory pathway). A premature supraventricular or ventricular impulse can initiate reentrant supraventricular tachycardia (SVT). During episodes of reentrant SVT in animals with ventricular preexcitation, the PR interval usually normalizes or is prolonged, and retrograde P’ waves may be evident. The QRS complexes are of normal configuration unless a simultaneous intraventricular conduction disturbance is present.
Atrial tachycardia is caused by rapid discharge of an abnormal atrial focus or by atrial reentry (repetitive activation caused by conduction of the electrical impulse around an abnormal circuit within the atria). In the dog the atrial activation rate per minute is usually between 260 and 380. The P’ waves are often hidden in the QRS-T complexes. Atrial tachycardia can be paroxysmal or sustained. It is usually a regular rhythm unless the rate is too fast for the AV node to conduct every impulse, in which case physiologic AV block and irregular ventricular activation result. A consistent ratio of atrial impulses to ventricular activation (e.g., 2 : 1 or 3 : 1 AV conduction) preserves the regularity of this arrhythmia. Sometimes the impulses traverse the AV node but are delayed within the ventricular conduction system, causing a bundle branch block pattern on the ECG. Differentiation from ventricular tachycardia may be difficult in these cases.
Atrial Flutter
Atrial flutter is caused by a very rapid (usually greater than 400 impulses/min) wave of electrical activation regularly cycling through the atria. The ventricular response may be irregular or regular, depending on the pattern of AV conduction. The ECG baseline consists of “sawtooth” flutter waves that represent the fast, recurrent atrial activation. Atrial flutter is not a stable rhythm; it often degenerates into atrial fibrillation or may convert back to sinus rhythm.
Atrial Fibrillation
This common arrhythmia is characterized by rapid and chaotic electrical activation within the atria. There are no P waves on the ECG because there is no uniform atrial depolarization wave. Rather, the baseline usually shows irregular undulations (fibrillation waves). Lack of organized electrical activity prevents meaningful atrial contraction. The AV node, being bombarded by chaotic electrical impulses, conducts as many as possible to the ventricles. Ultimately the (ventricular) heart rate is determined by AV conduction velocity and recovery time, which are influenced by prevailing autonomic tone. Atrial fibrillation (AF) causes an irregular heart rhythm that is often quite rapid (Fig. 2-11). The QRS complexes are usually normal in configuration because intraventricular conduction pathway is usually normal. Minor variation in QRS complex amplitude is common, however, and intermittent or sustained bundle branch blocks can occur. AF tends to be a consequence of severe atrial disease and enlargement in dogs and cats; it is usually preceded by intermittent atrial tachyarrhythmias and perhaps atrial flutter. AF sometimes occurs spontaneously in giant breed dogs without evidence of underlying heart disease (“lone” AF). The heart rate can be normal in these dogs.
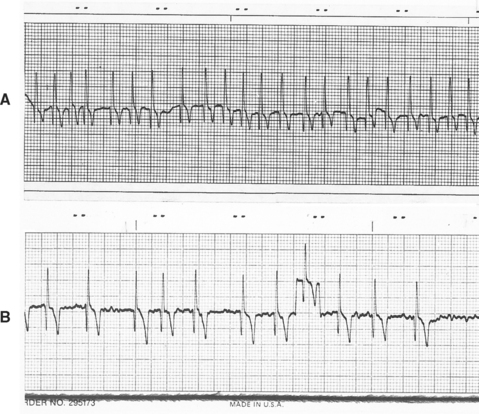
FIG 2-11 Atrial fibrillation. A, Uncontrolled atrial fibrillation (heart rate 220 beats/min) in a Doberman Pinscher with dilated cardiomyopathy (lead II, 25 mm/sec). B, Slower ventricular response rate after therapy in a different Doberman Pinscher with dilated cardiomyopathy showing baseline fibrillation waves. Note lack of P waves and irregular RR intervals. Eighth complex from left superimposed on calibration mark. Lead II, 25 mm/sec.
Ventricular Premature Complexes
Ventricular premature complexes (VPCs or PVCs) originate below the AV node and do not activate ventricular muscle via the normal ventricular conduction pathway. Therefore their QRS configuration differs from the animal’s sinus complexes. Ventricular ectopic complexes are usually wider than sinus-origin complexes because of slower intramuscular conduction. Because VPCs usually are not conducted backward through the AV node into the atria, the sinus rate continues undisturbed; thus the VPC is followed by a “compensatory pause” in the sinus rhythm. When the configuration of multiple VPCs or ventricular tachycardia is consistent in an animal, the complexes are described as being uniform, unifocal, or monomorphic. When the VPCs occurring in an individual have differing configurations, they are said to be multiform or polymorphic. Increased electrical instability may accompany multiform VPCs or tachycardia.
Ventricular Tachycardia
Ventricular tachycardia consists of a series of VPCs (usually at a rate greater than 100 beats/min). The RR interval is most often regular, although some variation can occur. Nonconducted sinus P waves may be superimposed on or between the ventricular complexes, although they are unrelated to the VPCs because the AV node and/or ventricles are in the refractory period (physiologic AV dissociation). The term capture beat refers to the successful conduction of a sinus P wave into the ventricles uninterrupted by another VPC (i.e., the sinus node has “recaptured” the ventricles). If the normal ventricular activation sequence is interrupted by a VPC, a “fusion” complex can result. A fusion complex represents a melding of the normal QRS configuration and that of the VPC (see Fig. 2-10, E). Fusion complexes are often observed at the onset or end of a paroxysm of ventricular tachycardia; they are preceded by a P wave and shortened PR interval. Identification of P waves (whether conducted or not) or fusion complexes helps in differentiating ventricular tachycardia from SVT with abnormal (aberrant) intraventricular conduction.
Polymorphic ventricular tachycardia is characterized by QRS complexes that vary in size, polarity, and often rate; sometimes the QRS configuration appears as if it were rotating around the isoelectric baseline. Torsades de pointes is a specific form of polymorphic ventricular tachycardia associated with Q-T interval prolongation.
Accelerated Ventricular Rhythm
Also called idioventricular tachycardia, accelerated ventricular rhythm is a ventricular-origin rhythm with a rate of about 60 to 100 beats/min in the dog (perhaps somewhat faster in the cat). Because the rate is slower than true ventricular tachycardia, it is usually a less serious rhythm disturbance. An accelerated ventricular rhythm may appear intermittently during sinus arrhythmia, as the sinus rate decreases; the ventricular rhythm is often suppressed as the sinus rate increases. This is common in dogs recovering from motor vehicle trauma. Often this rhythm disturbance has no deleterious effects, although it could progress to ventricular tachycardia, especially in clinically unstable patients.
Ventricular Fibrillation
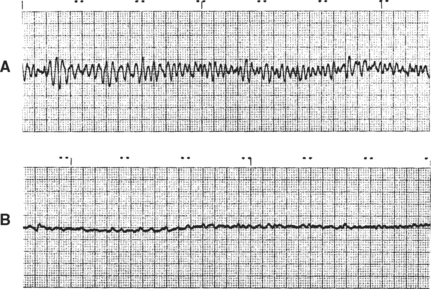
Ventricular fibrillation is a lethal rhythm that is characterized by multiple reentrant circuits causing chaotic electrical activity in the ventricles; the ECG consists of an irregularly undulating baseline (Fig. 2-12). The ventricles cannot function as a pump because coordinated mechanical activity cannot occur in the presence of incoordinated electrical activation. Ventricular flutter, which appears as rapid sine-wave activity on the ECG, may precede fibrillation. “Course” ventricular fibrillation (VF) has larger ECG oscillations than “fine” VF.
Escape Complexes
Ventricular asystole is the absence of ventricular electrical (and mechanical) activity. Escape complexes and escape rhythms are a protective mechanism. An escape complex occurs after a pause in the dominant (usually sinus) rhythm. If the dominant rhythm does not resume, the escape focus continues to discharge at its own intrinsic rate. Escape rhythms are usually regular. Escape activity originates from automatic cells within the atria, the AV junction, or the ventricles (see Fig. 2-10, G). Ventricular escape rhythms (idioventricular rhythms) usually have an intrinsic rate less than 40 to 50 beats/min in the dog and 100 beats/min in the cat, although higher ventricular escape rates can occur. Junctional escape rhythms usually range from 40 to 60 beats/min in the dog, with a faster rate expected in the cat. It is important to differentiate escape from premature complexes. Escape activity should never be suppressed with antiarrhythmic drugs.
CONDUCTION DISTURBANCES
Abnormal impulse conduction within the atrium can occur at several sites. With sinoatrial (SA) block, impulse transmission from the SA node to the atrial muscle is prevented. Although this cannot reliably be differentiated from sinus arrest on the ECG, with SA block the interval between P waves is a multiple of the normal P to P interval. An atrial, junctional, or ventricular escape rhythm should take over after prolonged sinus arrest or block. Atrial standstill occurs when diseased atrial muscle prevents normal electrical and mechanical function, regardless of sinus node activity; consequently, a junctional or ventricular escape rhythm results and P waves are not seen. Because hyperkalemia interferes with normal atrial function, it can mimic atrial standstill.
Conduction Disturbances Within the AV Node
Abnormalities of AV conduction can occur from excessive vagal tone, drugs (e.g., digoxin, xylazine, medetomidine, verapamil, and anesthetic agents), and organic disease of the AV node and/or intraventricular conduction system. Three categories of AV conduction disturbances are commonly described (Fig. 2-13). First-degree AV block, the mildest, occurs when conduction from the atria into the ventricles is prolonged. All impulses are conducted, but the PR interval is longer than normal. Second-degree AV block is characterized by intermittent AV conduction; some P waves are not followed by a QRS complex. When many P waves are not conducted, the patient has high-grade second-degree heart block. There are two subtypes of second-degree AV block. Mobitz type I (Wenckebach) is characterized by progressive prolongation of the PR interval until a nonconducted P wave occurs; it is frequently associated with disorders within the AV node itself and/or high vagal tone. Mobitz type II is characterized by uniform PR intervals preceding the blocked impulse and is thought to be more often associated with disease lower in the AV conduction system (e.g., bundle of His or major bundle branches). An alternative classification of second-degree AV block based on QRS configuration has been described. Patients with type A second-degree block have a normal, narrow QRS configuration; those with type B second-degree block have a wide or abnormal QRS configuration, which suggests diffuse disease lower in the ventricular conduction system. Mobitz type I AV block usually is type A, whereas Mobitz type II frequently is type B. Supraventricular or ventricular escape complexes are common during long pauses in ventricular activation. Third-degree or complete AV block is complete failure of AV conduction; no sinus (or supraventricular) impulses are conducted into the ventricles. Although a regular sinus rhythm or sinus arrhythmia is often evident, the P waves are not related to the QRS complexes, which result from a (usually) regular ventricular escape rhythm.
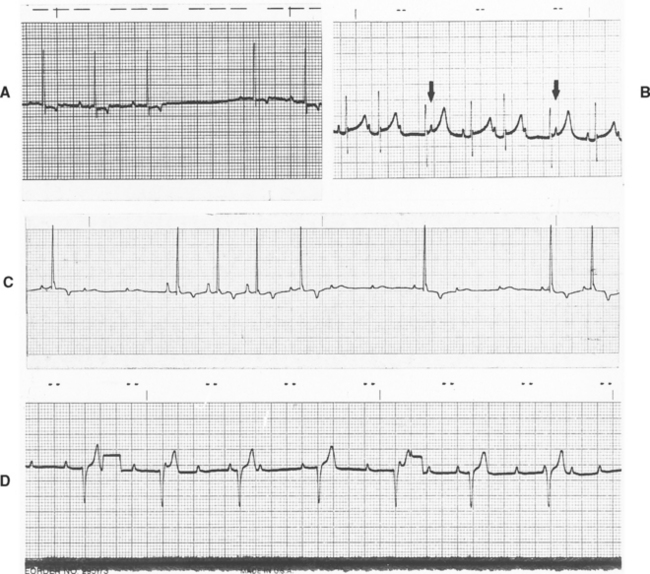
FIG 2-13 AV conduction abnormalities. A, First-degree AV block in a dog with digoxin toxicity (lead aVF, 25 mm/sec). B, Second-degree AV block (Wenckebach) in an old cat under anesthesia. Note gradually prolonged PR interval with failed conduction of third (and seventh) P wave(s) followed by an escape complex. The fourth and eighth P waves (arrows) are not conducted because the ventricles are refractory (lead II, 25 mm/sec). C, Second-degree AV block in a comatose old dog with brainstem signs and seizures. Note the changing configuration of the P waves (wandering pacemaker) (lead II, 25 mm/sec). D, Complete (third-degree) heart block in a Poodle. There is underlying sinus arrhythmia, but no P waves are conducted; a slow ventricular escape rhythm has resulted. Two calibration marks (half-standard, 0.5 cm = 1 mV) are seen. Lead II, 25 mm/sec.
Intraventricular Conduction Disturbances
Abnormal (aberrant) ventricular conduction occurs in association with slowed or blocked impulse transmission in a major bundle branch or ventricular region. The right bundle branch or the left anterior or posterior fascicles of the left bundle branch can be affected singly or in combination. A block in all three major branches results in third-degree (complete) heart block. Activation of the myocardium served by the blocked pathway occurs relatively slowly, from myo-cyte to myocyte; therefore the QRS complexes appear wide and abnormal (Fig. 2-14). Right bundle branch block (RBBB) is sometimes identified in otherwise normal dogs and cats, although it can occur from disease or distention of the right ventricle. Left bundle branch block (LBBB) is usually related to clinically relevant underlying left ventricular disease. The left anterior fascicular block (LAFB) pattern is common in cats with hypertrophic cardiomyopathy.
Ventricular Preexcitation
Early activation (preexcitation) of part of the ventricular myocardium can occur when there is an accessory conduction pathway that bypasses the normal slow-conducting AV nodal pathway. Several types of preexcitation and accessory pathways have been described. Most cause a shortened PR interval. Wolff-Parkinson-White (WPW) preexcitation is also characterized by early widening and slurring of the QRS by a so-called delta wave (Fig. 2-15). This pattern occurs because the accessory pathway (Kent’s bundle) lies outside the AV node (extranodal) and allows early depolarization (represented by the delta wave) of a part of the ventricle distant to where normal ventricular activation begins. Other accessory pathways connect the atria or dorsal areas of the AV node directly to the bundle of His. These cause a short PR interval without early QRS widening. Preexcitation can be intermittent or concealed (not evident on ECG). The danger with preexcitation is that a reentrant supraventricular tachycardia can occur using the accessory pathway and AV node (also called AV reciprocating tachycardia). Usually the tachycardia impulses travel into the ventricles via the AV node (antegrade or orthodromic conduction) and then back to the atria via the accessory pathway, but sometimes the direction is reversed. Rapid AV reciprocating tachycardia can cause weakness, syncope, congestive heart failure, and death. The presence of the WPW pattern on ECG in conjunction with reentrant supraventricular tachycardia that causes clinical signs characterizes the WPW syndrome.
MEAN ELECTRICAL AXIS
The mean electrical axis (MEA) describes the average direction of the ventricular depolarization process in the frontal plane. It represents the summation of the various instantaneous vectors that occur from the beginning until the end of ventricular muscle activation. Major intraventricular conduction disturbances and/or ventricular enlargement patterns can shift the average direction of ventricular activation and therefore the MEA. Only the six frontal plane leads are used to determine MEA. Either of the following methods can be used:
CHAMBER ENLARGEMENT AND BUNDLE BRANCH BLOCK PATTERNS
Changes in the ECG waveforms can suggest enlargement or abnormal conduction within a particular cardiac chamber. However, enlargement does not always produce these changes. A widened P wave has been associated with LA enlargement (p mitrale); sometimes the P wave is notched as well as wide. Tall, spiked P waves (p pulmonale) can accompany RA enlargement. With atrial enlargement, the usually obscure atrial repolarization (Ta) wave may be evident as a baseline shift in the opposite direction of the P wave.
A right-axis deviation and an S wave in lead I are strong criteria for RV enlargement (or RBBB). Other ECG changes can usually be found as well. Three or more of the criteria listed in Box 2-4 are generally present when right ventricular enlargement exists. RV enlargement (dilation or hypertrophy) is usually pronounced if it is evident on the ECG because LV activation forces are normally so dominant. LV dilation and eccentric hypertrophy (see Chapter 3) often increase R-wave voltage in the caudal leads (II and aVF) and widen the QRS. LV concentric hypertrophy inconsistently produces a left-axis deviation.
BOX 2-4 Ventricular Chamber Enlargement and Conduction Abnormality Patterns
Conduction block in the major ventricular conduction pathways disturbs the normal activation process and alters QRS configuration. Electrical activation of ventricular muscle regions served by a diseased bundle branch occurs late and progresses slowly. This widens the QRS complex and shifts the terminal QRS orientation toward the area of delayed activation. Box 2-4 and Fig. 2-16 summarize ECG patterns associated with ventricular enlargement or conduction delay. Box 2-5 lists common clinical associations.
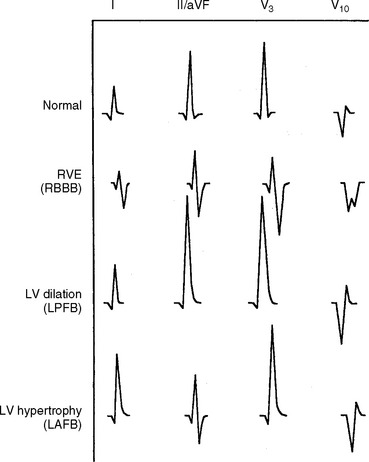
FIG 2-16 Schematic of common ventricular enlargement patterns and conduction abnormalities. ECG leads are listed across top. LAFB, left anterior fascicular block; LPFB, left posterior fascicular block; LV, left ventricular; RVE, right ventricular enlargement; RBBB, right bundle branch block.
Other QRS Abnormalities
Small-voltage QRS complexes sometimes occur. Causes of reduced QRS amplitude include pleural or pericardial effusions, obesity, intrathoracic mass lesions, hypovolemia, and hypothyroidism. Small complexes are occasionally seen in dogs without identifiable abnormalities.
Electrical alternans is an every-other-beat recurring alteration in QRS complex size or configuration. This is most often seen with large volume pericardial effusions (see Chapter 9).
ST-T ABNORMALITIES
The ST segment extends from the end of the QRS complex (also called the J-point) to the onset of the T wave. In dogs and cats this segment tends to slope into the following T-wave, so clear demarcation is uncommon. Abnormal elevation (>0.15 mV in dogs or 0.1 mV in cats) or depression (>0.2 mV in dogs or >0.1 mV in cats) of the J point and ST segment in leads I, II, or aVF may be significant and can be caused by ischemia and other types of myocardial injury.
Atrial enlargement or tachycardia can cause pseudodepression of the ST segment because of prominent Ta waves. Other secondary causes of ST segment deviation include ventricular hypertrophy, slowed conduction, and some drugs (e.g., digoxin).
The T wave represents ventricular muscle repolarization; it may be positive, negative, or biphasic in normal cats and dogs. Changes in size, shape, or polarity from previous recordings in a given animal are probably clinically important. Abnormalities of the T wave can be primary (i.e., not related to the depolarization process) or secondary (i.e., related to abnormalities of ventricular depolarization). Secondary ST-T changes tend to be in the opposite direction of the main QRS deflection. Box 2-6 lists some causes of ST-T abnormalities.
 BOX 2-6 Causes of ST Segment, T Wave, and QT Abnormalities
VPC, Ventricular premature complex.
QT Interval
The QT interval represents the total time of ventricular activation and repolarization. This interval varies inversely with average heart rate; faster rates have a shorter QT interval. Autonomic nervous tone, various drugs, and electrolyte disorders influence the duration of the QT interval (see Box 2-6). Inappropriate prolongation of the QT interval may facilitate development of serious reentrant arrhythmias when underlying nonuniformity in ventricular repolariza tion exists. Prediction equations for expected QT duration have been derived for normal dogs and cats.
ECG MANIFESTATIONS OF DRUG TOXICITY AND ELECTROLYTE IMBALANCE
Digoxin, antiarrhythmic agents, and anesthetic drugs often alter heart rhythm and/or conduction either by their direct electrophysiologic effects or by affecting autonomic tone (Box 2-7).
BOX 2-7 ECG Changes Associated With Electrolyte Imbalance and Selected Drug Adverse Effects/Toxicity
AV, Atrioventricular.
Hyperkalemia (see Figs. 2-17, 2-18)
Potassium has marked and complex influences on cardiac electrophysiology. Hypokalemia can increase spontaneous automaticity of cardiac cells, as well as nonuniformly slow repolarization and conduction; these effects predispose to both supraventricular and ventricular arrhythmias. Hypokalemia can cause progressive ST segment depression, reduced T-wave amplitude, and QT interval prolongation. Severe hypokalemia can also increase QRS and P-wave amplitudes and durations. In addition, hypokalemia exacerbates digoxin toxicity and reduces the effectiveness of class I antiarrhythmic agents (see Chapter 4). Hypernatremia and alkalosis worsen the effects of hypokalemia on the heart.
Moderate hyperkalemia actually has an antiarrhythmic effect by reducing automaticity and enhancing uniformity and speed of repolarization. However, rapid or severe increases in serum potassium concentration are arrhythmogenic primarily because they slow conduction velocity and shorten the refractory period. Fig. 2-17 describes the progression of ECG changes as serum potassium concentration rises. The sinus node is relatively resistant to the effects of hyperkalemia and continues to function, although often at a slower rate. Despite progressive atrial muscle unresponsiveness, specialized fibers transmit sinus impulses to the ventricles, producing a “sinoventricular” rhythm. The characteristic “tented” T-wave appearance may be more apparent in some leads than in others and may be of small amplitude. Fig. 2-18 illustrates the ECG effects of severe hyperkalemia and the response to therapy in a dog with Addison’s disease. Hypocalcemia, hyponatremia, and acidosis accentuate the ECG changes caused by hyperkalemia, whereas hypercalcemia and hypernatremia tend to counteract them.
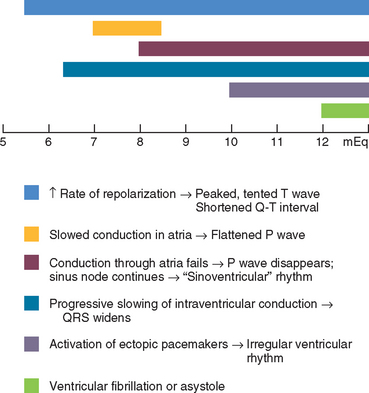
FIG 2-17 Progressive ECG changes that develop with worsening hyperkalemia (scale represents serum K+ concentration in mEq/L). Although ECG changes correlate poorly with serum K+ concentration, they accurately reflect cardiac electrophysiologic changes.
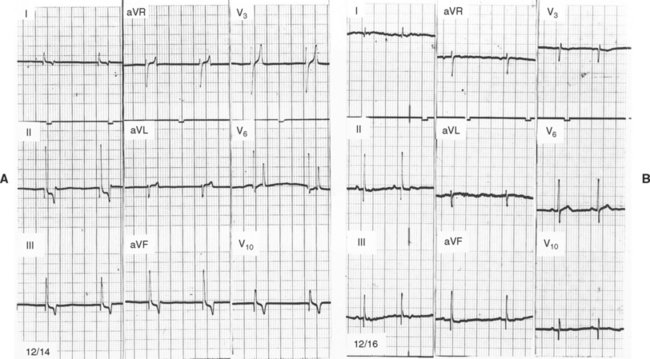
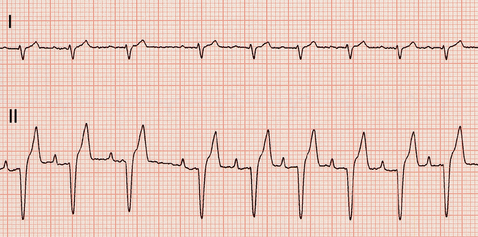
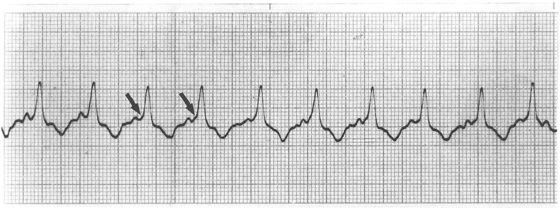
FIG 2-18 ECGs recorded in a female Poodle with Addison’s disease at presentation (A), (K+ = 10.2; Na+ = 132 mEq/L), and 2 days later after treatment (B), (K+ = 3.5; Na+ = 144 mEq/L). Note absence of P waves, accentuated and tented T waves (especially in chest leads), shortened QT interval, and slightly widened QRS complexes in A compared with B. Leads as marked, 25 mm/sec, 1 cm = 1 mV.
Marked ECG changes caused by other electrolyte disturbances are uncommon. Severe hypercalcemia or hypocalcemia could have noticeable effects (Table 2-3 on p. 34), but this is rarely seen clinically. Hypomagnesemia has no reported effects on the ECG, but it can predispose to digoxin toxicity and exaggerate the effects of hypocalcemia.
COMMON ARTIFACTS
Fig. 2-19 on p. 35 illustrates some common ECG artifacts. Electrical interference can be minimized or eliminated by properly grounding the ECG machine; turning off other electrical equipment or lights on the same circuit or having a different person restrain the animal may also help. Other artifacts are sometimes confused with arrhythmias; how-ever, artifacts do not disturb the underlying cardiac rhythm. Conversely, ectopic complexes often disrupt the underlying rhythm and are followed by a T wave. Careful examination for these characteristics usually allows differentiation between intermittent artifacts and arrhythmias.
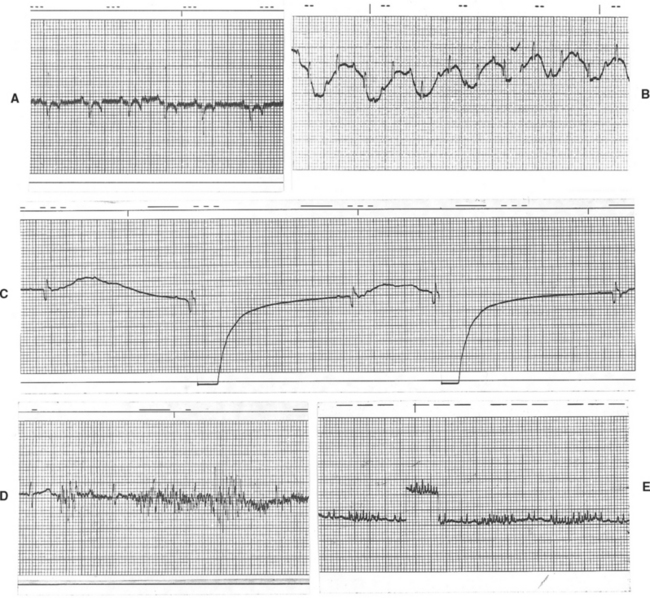
FIG 2-19 Common ECG artifacts. A, 60 Hz electrical interference; Lead III, 25 mm/sec, dog. B, Baseline movement caused by panting; Lead II, 25 mm/sec, dog. C, Respiratory motion artifact; Lead V3, 50 mm/sec, dog. D, Severe muscle tremor artifact; Lead V3, 50 mm/sec, cat. E, Intermittent, rapid baseline spikes caused by purring in cat; a calibration mark is seen just left of the center of the strip. Lead aVF, 25 mm/sec.
AMBULATORY ELECTROCARDIOGRAPHY
Holter Monitoring
Holter monitoring allows the continuous recording of cardiac electrical activity during normal daily activities (except swimming), strenuous exercise, and sleep. This is useful for detecting and quantifying intermittent cardiac arrhythmias and therefore helps identify cardiac causes of syncope and episodic weakness. Holter monitoring is also used to assess the efficacy of antiarrhythmic drug therapy and to screen for arrhythmias associated with cardiomyopathy or other diseases. The Holter monitor is a small battery-powered digital or analog tape recorder worn by the patient, typically for 24 hours. Two or three ECG channels are recorded from modified chest leads using adhesive patch electrodes. During the recording period, the animal’s activities are noted in a patient diary for later correlation with simultaneous ECG events. An event button on the Holter recorder can be pressed to mark the time a syncopal or other episode is witnessed.
The digitized recording is analyzed using computer algorithms that classify the recorded complexes. Evaluation and editing by a trained Holter technician experienced with veterinary recordings are important for accurate analysis. Fully automated computer analysis can result in significant misclassification of QRS complexes and artifacts from dog and cat recordings. A summary report and selected portions of the recording are enlarged and printed for examination by the clinician. Evaluation of a full disclosure print-out of the entire recording is also helpful when compared with the selected ECG strips and the times of clinical signs and/or activities noted in the patient diary (see Suggested Readings for more information). A Holter monitor, hook-up supplies, and analysis can be obtained from some commercial human Holter scanning services, as well as many veterinary teaching hospitals and cardiology referral centers.
Wide variation in heart rate is seen throughout the day in normal animals. In dogs maximum heart rates of up to 300 beats/min have been recorded with excitement or activity. Episodes of bradycardia (<50 beats/min) are common, especially during quiet periods and sleep. Sinus arrhythmia, sinus pauses (sometimes for more than 5 seconds), and occasional second-degree AV block are apparently common in dogs, especially at times when mean heart rate is lower. In normal cats heart rates also vary widely over 24 hours (e.g. from ∼70 to ∼290 beats/minute. Regular sinus rhythm predominates in normal cats, and sinus arrhythmia is evident at slower heart rates. Ventricular premature complexes occur only sporadically in normal dogs and cats; their prevalence likely increases only slightly with age.
Event Recording
Cardiac event recorders are smaller than typical Holter units and contain a microprocessor with a memory loop that can store a brief period of a single modified chest lead ECG. The event recorder can be worn for periods of a week or so, but it cannot store prolonged, continuous ECG activity. Event recorders are used most often to determine whether episodic weakness or syncope is caused by a cardiac arrhythmia. When an episode is observed, the owner activates the recorder, which then stores the ECG from a predetermined time frame (e.g., from 30 seconds before activation to 30 seconds after) for later retrieval and analysis. Implantable (subcutaneous) recording devices have also been used in some veterinary patients and can allow intermittent ECG monitoring over an extended time frame.
OTHER METHODS OF ECG ASSESSMENT
Heart Rate Variability (HRV)
Phasic fluctuations in vagal and sympathetic tone during the respiratory cycle, and also during slower periodic oscillations of arterial blood pressure, influence the variation in time between consecutive heartbeats. HRV refers to the fluctuation of beat-to-beat time intervals around their mean value. HRV is influenced by baroreceptor function as well as by the respiratory cycle and sympathetic/parasympathetic balance. The degree of HRV decreases with severe myocardial dysfunction and heart failure, as well as other causes of increased sympathetic tone. The variation in instantaneous heart rate (R-to-R intervals) can be evaluated as a function of time (time-domain analysis) as well as in terms of the frequency and amplitude of its summed oscillatory components (frequency-domain or power spectral analysis). Frequency-domain analysis allows assessment of the balance between sympathetic and vagal modulation of the cardiovascular system. The potential clinical usefulness of HRV as an indicator of autonomic function, and possibly of prognosis, for veterinary patients is being explored (see Suggested Readings).
Signal-Averaged Electrocardiography (SAECG)
Digital signal averaging of the ECG provides a means of enhancing ECG signal resolution by discarding random components (noise) so that small-voltage potentials that may occur at the end of the QRS complex and into the early ST segment can be detected. These so-called ventricular late potentials can be found in patients with injured myocardium; they indicate the presence of conditions that predispose to reentrant ventricular tachyarrhythmias. The presence of late potentials on SAECG has been identified in some Doberman Pinschers with ventricular tachycardia and significant ventricular dysfunction, but the sensitivity for predicting risk of ventricular tachycardia is unclear (see Suggested Readings).
ECHOCARDIOGRAPHY
Echocardiography (cardiac ultrasonography) is an important noninvasive tool for imaging the heart and surrounding structures. Anatomic relationships as well as cardiac function can be assessed by evaluating cardiac chamber size, wall thickness, wall motion, valve configuration and motion, and proximal great vessels and other parameters. Pericardial and pleural fluid are easily detected, and mass lesions within and adjacent to the heart can be identified. Echocardiographic examination can usually be performed with minimal or no chemical restraint.
Like other diagnostic modalities, echocardiography is best used within the context of a thorough history, cardiovascular examination, and other appropriate tests. Technical expertise is essential to adequately perform and interpret the echocardiographic examination. The importance of the echocardiographer’s skill and understanding of normal and abnormal cardiovascular anatomy and physiology cannot be overemphasized. The ultrasound equipment used as well as individual patient characteristics also affect the quality of images obtained. Sound waves do not travel well though bone (e.g., ribs) and air (lungs); these structures may preclude good visualization of the entire heart.
BASIC PRINCIPLES
Echocardiography uses pulsed, high-frequency sound waves that are reflected, refracted, and absorbed by body tissue interfaces. Only the reflected portion can be received and processed for display. Transducer frequency, power output, and various processing controls influence the intensity and clarity of the displayed echo images. Three echo modalities are used clinically: M-mode, two-dimensional (2-D, real-time), and Doppler. Each has important applications (described in the subsequent sections).
Sound waves are propagated through soft tissue at a characteristic speed (∼1540 m/sec), so the thickness, size, and location of various structures in relation to the origin of the ultrasound beam can be determined at any point in time. Because the intensity of the ultrasound beam decreases as it penetrates into the body (because of beam divergence, absorption, scatter, and reflection of wave energy at tissue interfaces), echoes returning from deeper structures tend to be weaker. When the ultrasound beam (2-D and M-mode) is perpendicular to the imaged structure, stronger echos are returned. Also, greater mismatch in acoustic impedance (which is related to tissue density) between two adjacent tissues produces a more reflective boundary, and stronger echoes result. Very reflective interfaces such as bone/tissue or air/tissue interfere with imaging of weaker echos from deeper tissue interfaces.
Higher frequency ultrasound permits better resolution of small structures because of the beam characteristics of longer near field and lesser far field divergence. However, higher frequencies have less penetrating ability as more energy is absorbed and scattered by the soft tissues. Conversely, a transducer that produces lower frequencies provides greater penetration depth but less well-defined images. Frequencies generally used for small animal echocardiography range from about 3.5 MHz (for large dogs) to >10 MHz (for cats and small dogs). A megahertz (MHz) represents 1,000,000 cycles/sec.
Strongly reflective tissues are referred to as being hyperechoic or of increased echogenicity. Poorly reflecting tissues are hypoechoic; fluid, which does not reflect sound, is anechoic or sonolucent. Tissue behind an area of sonolucency appears hyperechoic because of acoustic enhancement. On the other hand, through-transmission of the ultrasound beam is blocked by a strongly hyperechoic object (such as a rib), and an acoustic shadow (where no image appears) is cast behind the object.
For most echocardiographic examinations, the animal is gently restrained in lateral recumbency; better-quality images are usually obtained when the heart is imaged from the recumbent side. For this the animal is placed on a table or platform with an edge cutout, which allows the echocardiographer to position and manipulate the transducer from the animal’s dependent side. Some animals can be adequately imaged while standing. Shaving a small area of hair over the transducer placement site can improve skin contact and image clarity. Coupling gel is applied to produce air-free contact between skin and transducer. The transducer is placed over the area of the precordial impulse (or other appropriate site), and its position is adjusted to find a good “acoustic window” that allows clear visualization of the heart. The right and left parasternal transducer positions are used most often. Minor adjustment of the animal’s forelimb or torso position may be required to obtain a good acoustic window. Once the heart is located, the transducer is angled or rotated and the echocardiograph’s controls for factors such as beam strength, focus, and postprocessing parameters are adjusted as necessary to optimize the image. Optimal visualization generally is achieved for 2-D and M-mode studies when the ultrasound beam is perpendicular to the cardiac structures and endocardial surfaces of interest. Image artifacts are common and can mimic a cardiac abnormality. If the suspected lesion can be visualized in more than one imaging plane, it is more likely to be real.
The echocardiographic examination includes carefully obtained M-mode measurements and all standard 2-D imaging planes from both sides of the chest, as well as any other views needed to further evaluate specific lesions. Doppler evaluation provides important additional information (discussed in more detail later). The complete examination can be quite time consuming in some patients. Light sedation is helpful if the animal does not lie quietly. Buprenorphine (0.0075 to 0.01 mg/kg IV) with acepromazine (0.03 mg/kg IV) usually works well for dogs. Butorphanol (0.2 mg/kg IM) with acepromazine (0.1 mg/kg IM) is adequate for many cats, although some require more intense sedation. Acepromazine (0.1 mg/kg IM) followed in 15 minutes by ketamine (2 mg/kg IV) can be used in cats, but this regimen can increase heart rate undesirably.
TWO-DIMENSIONAL ECHOCARDIOGRAPHY
A plane of tissue (both depth and width) is displayed using 2-D echocardiography. The anatomic changes resulting from various diseases or congenital defects are evident, although actual blood flow is not usually visualized with 2-D or M-mode imaging alone.
Common 2-D Echocardiographic Views
A variety of planes can be imaged from several chest wall locations. Most standard views are obtained from either the right or left parasternal positions (directly over the heart and close to the sternum). Images are occasionally obtained from subxiphoid (subcostal) or thoracic inlet (suprasternal) positions. Long-axis views are obtained with the imaging plane parallel to the long axis of the heart; short-axis views are perpendicular to this plane (Figs. 2-20 to 2-25). Images are described by the location of the transducer and the imaging plane used (e.g., right parasternal short-axis view, left cranial parasternal long-axis view). 2-D imaging allows an overall assessment of cardiac chamber orientation, size and wall thickness. The RV wall is usually about one third of the thickness of the LV free wall and should be no greater than half its thickness. The size of the right atrial and ventricular chambers is subjectively compared with that of the left atrium and ventricle; the right parasternal long axis and left apical 4 chamber views are useful for this. All valves and related structures as well as the great vessels are systematically examined. Any suspected abnormality is scanned in multiple planes to further verify and delineate it.
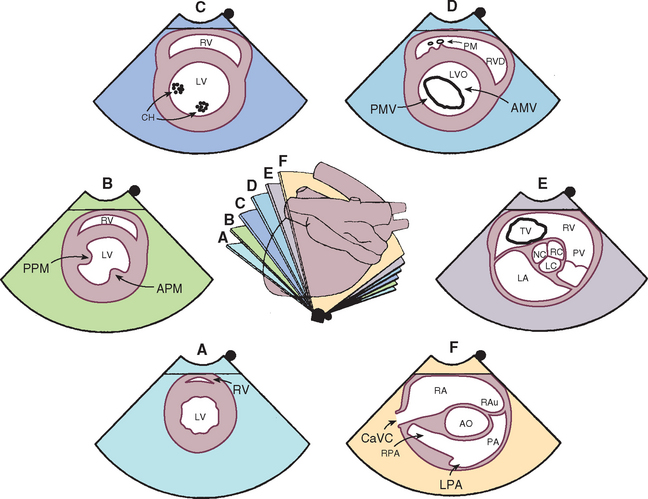
FIG 2-20 Two-dimensional short-axis echocardiographic views from the right parasternal position. The center diagram indicates the orientation of the ultrasound beam used to image cardiac structures at the six levels shown. Several of these positions guide M-mode beam placement as well as Doppler evaluation of tricuspid and pulmonary flows. Corresponding echo images are shown clockwise from the bottom. A, Apex. B, Papillary muscle. C, Chordae tendineae. D, Mitral valve. E, Aortic valve. F, Pulmonary artery. AMV, Anterior (septal) mitral valve cusp; AO, aorta; APM, anterior papillary muscle; CaVC, caudal vena cava; CH, chordae tendineae; LA, left atrium; LPA, left pulmonary artery; LV, left ventricle; LVO, left ventricular outflow tract; PA, pulmonary artery; PM, papillary muscle; PMV, posterior mitral valve cusp; PPM, posterior papillary muscle; PV, pulmonary valve; RA, right atrium; RAu, right auricle; RC, LC, NC, right, left, and noncoronary cusps of aortic valve; RPA, right pulmonary artery; RV, right ventricle; RVO, right ventricular outflow tract; TV, tricuspid valve.
(From Thomas WP et al: Recommendations for standards in transthoracic 2-dimensional echocardiography in the dog and cat, J Vet Intern Med 7:247, 1993.)
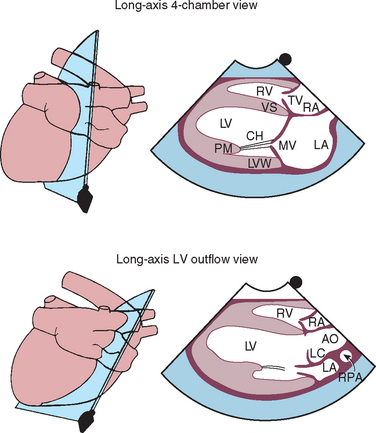
FIG 2-21 Two-dimensional long-axis echocardiographic views from right parasternal position. Each diagram on the left indicates the location of the ultrasound beam as it transects the heart from the right side, resulting in the corresponding echo image on the right. Long-axis four-chamber (left ventricular inflow) view is above. Long-axis view of the left ventricular outflow region is below. AO, Aorta; CH, chordae tendinae; LA, left atrium; LC, left coronary cusp of aortic valve; LV, left ventricle; LVW, left ventricular wall; MV, mitral valve; PM, papillary muscle; RA, right atrium; RPA, right pulmonary artery; RV, right ventricle; TV, tricuspid valve; VS, interventricular septum.
(From Thomas WP et al: Recommendations for standards in transthoracic 2-dimensional echocardiography in the dog and cat, J Vet Intern Med 7:247, 1993.)
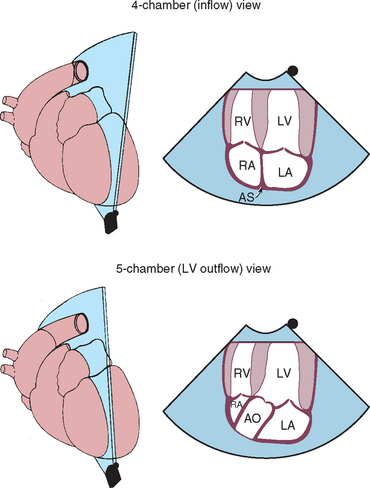
FIG 2-22 Left caudal (apical) parasternal position. Four-chamber view optimized for ventricular inflow is above. Five-chamber view optimized for left ventricular outflow is below. These views provide good Doppler velocity signals from mitral and aortic valve regions. AO, Aorta; AS, interatrial septum; LA, left atrium; LV, left ventricle; RA, right atrium; RV, right ventricle.
(From Thomas WP et al: Recommendations for standards in transthoracic 2-dimensional echocardiography in the dog and cat, J Vet Intern Med 7:247, 1993.)
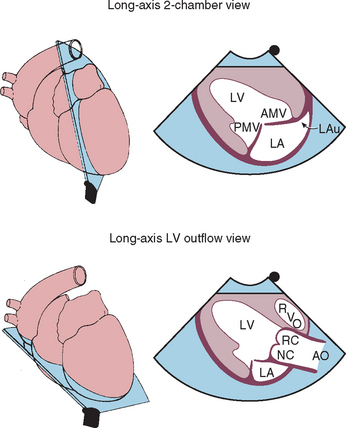
FIG 2-23 Left caudal (apical) parasternal 2-dimensional views optimized for left ventricular inflow and left auricle (above) and left ventricular outflow (below). AMV, Anterior (septal) mitral valve cusp; AO, aorta; LA, left atrium; LAu, left auricle; LV, left ventricle; PMV, posterior mitral valve cusp; RC, NC, right and noncoronary cusps of aortic valve; RVO, right ventricular outflow tract.
(From Thomas WP et al: Recommendations for standards in transthoracic 2-dimensional echocardiography in the dog and cat, J Vet Intern Med 7:247, 1993.)
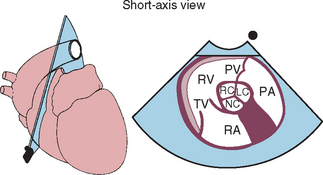
FIG 2-24 Left cranial parasternal short-axis view optimized for right ventricular inflow and outflow. This view is useful for Doppler interrogation of tricuspid and pulmonary artery flows. PA, Pulmonary artery; PV, pulmonary valve; RA, right atrium; RC, LC, NC, right, left, and noncoronary cusps of aortic valve; RV, right ventricle; TV, tricuspid valve.
(From Thomas WP et al: Recommendations for standards in transthoracic 2-dimensional echocardiography in the dog and cat, J Vet Intern Med 7:247, 1993.)
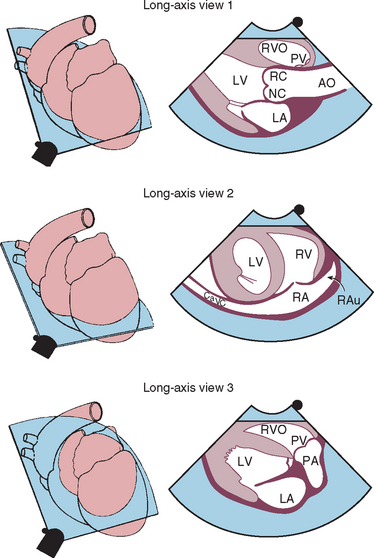
FIG 2-25 Left cranial parasternal long-axis views optimized for aortic root (above), right atrium and auricle (middle), and right ventricular outflow and main pulmonary artery (below). These views are used to evaluate the heart base and can provide good Doppler signals for tricuspid and pulmonary flows. AO, Aorta; CaVC, caudal vena cava; LA, left atrium; LV, left ventricle; PA, pulmonary artery; PV, pulmonary valve; RA, right atrium; RAu, right auricle; RC, NC, right and noncoronary cusps of aortic valve; RV, right ventricle; RVO, right ventricular outflow tract.
(From Thomas WP et al: Recommendations for standards in transthoracic 2-dimensional echocardiography in the dog and cat, J Vet Intern Med 7:247, 1993.)
End diastolic and systolic LV internal dimensions and wall thickness are usually obtained using M-mode, but appropriately timed 2-D frames can also be used. Several methods can be used to estimate LV volume and wall mass. LA size is better assessed using 2-D rather than M-mode. Several methods for measuring LA size have been described. One is to measure the cranial-caudal diameter (top-to-bottom on screen) at end-systole using a right parasternal long axis four-chamber view. In cats this LA dimension normally is <16 mm; a diameter >19 mm may indicate greater risk for thromboembolism. Because of greater body size variation in dogs, LA dimension is usually compared with the 2-D aortic root diameter measured across the sinuses of Valsalva. A 2-D maximal LA diameter : aortic root ratio between 1.7 to 1.9 is considered normal.
M-MODE ECHOCARDIOGRAPHY
This modality provides a one-dimensional view (depth) into the heart. M-mode images represent echos from various tissue interfaces along the axis of the beam (displayed vertically on the screen). These echos, which move during the cardiac cycle, are displayed against time (on the horizontal axis). Thus the “wavy” lines that are seen on these recordings correspond to the positions of particular structures in relation to the transducer as well as to each other at any point in time. Accurate placement of the M-mode beam using a moveable cursor line superimposed on an appropriate 2-D (real-time) image is important. M-mode images usually provide cleaner resolution of cardiac borders than 2-D because of higher sampling rate. Measurements of cardiac dimensions and motion throughout the cardiac cycle are often more accurately obtained from M-mode tracings, especially when coupled with a simultaneously recorded ECG (or phonocardiogram). Difficulty in achieving consistent and accurate beam placement for standard measurements and calculations can be a limitation.
M-Mode Views
Standard M-mode views are obtained from the right parasternal transducer position. The M-mode cursor is positioned with 2-D guidance using the right parasternal short-axis view. Precise positioning of the ultrasound beam within the heart (perpendicular to the structures to be measured) and clear endocardial images are essential for accurate M-mode measurements and calculations. For example, papillary muscles within the left ventricle must be avoided when measuring free-wall thickness. Fig. 2-26 illustrates standard M-mode views. In cases in which the M-mode cursor cannot be optimally aligned (e.g., in animals with focal or asymmetric hypertrophy), wall thickness measurements from 2-D images are preferred.
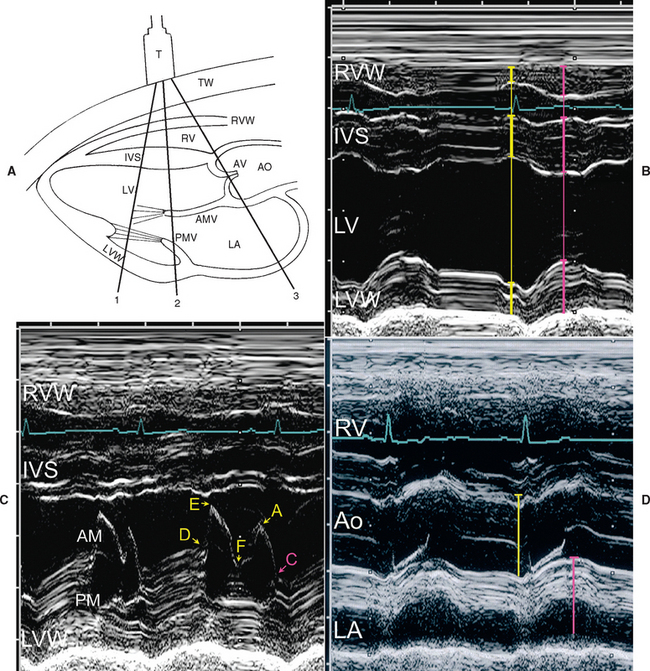
FIG 2-26 Common M-mode views. The diagram (A) indicates the approximate orientation of the one-dimensional ultrasound beam through the heart to achieve the corresponding M-mode images. A lead II ECG is recorded with the echo images for timing within the cardiac cycle. End diastole occurs at the onset of the QRS complex (yellow measure lines); end systole (pink measure lines) is the time when the dimension between the interventricular septum (IVS) and left ventricular free wall (LVW) is smallest. B, Image at the level of the chordae tendineae within the left ventricular lumen (LV), corresponding to cursor line “1” in A. Internal dimensions of the LV are measured from the leading (anterior) edge of the left endocardial wall of the IVS to the leading edge (luminal surface) of the posterior LVW. The thickness of the IVS is measured from the right endocardial surface of the IVS to the leading edge of the left endocardial septal wall at end diastole and end systole; the posterior LVW is measured at the same times from the endocardial surface to (but not including) the leading edge of the epicardial echoes. C, Image at the mitral valve level, cursor line “2” in A. The motion of the anterior (AM) and posterior (PM) mitral leaflets is described by the letters shown. Diastolic opening of the valve occurs at point D and systolic closing occurs at point C (see text for more information). D, Image at the aortic root (Ao) level “3” (where valve cusps are seen). Diameter is measured at end diastole from the leading (anterior) edge of the anterior aortic wall to the leading edge of the posterior wall. The left atrium (LA; usually the auricular region) is measured at the time of peak anterior aortic movement. RV, Right ventricular lumen; RVW, right ventricular wall.
Common Measurements and Normal Values
The standard dimensions measured with M-mode and their timing are also indicated in Fig. 2-26. The leading edge technique is used when possible (i.e., from the edge closest to the transducer [leading edge] of one side of the dimension to the leading edge of the other). In this way, only one endocardial surface is included in the measurement. LV wall and interventricular septal thicknesses, as well as LV chamber dimensions, should be determined at the level of the chordae tendineae, rather than the apex or mitral valve level. Measurements may also be taken from 2-D images if they are of high resolution and frames from the appropriate times in the cardiac cycle are used. Somatotype, breed, and body size greatly influence echo measurements in dogs. Endurance training also affects measured parameters, reflecting the increased cardiac mass and volume associated with frequent and sustained strenuous exercise. Some guidelines for approximate normal canine values are found in Table 2-3. Normal measurements in cats are more uniform but are also influenced by body size (Table 2-4). Chamber volume and ejection fraction are better estimated from optimized 2-D frames using the modified Simpsons’ method rather than M-mode images because of greater potential for inaccurate geometric assumptions from one dimensional measurements (see Supplemental Readings for further information). The right parasternal long axis view is usually better for assessing LV size than the left apical view.
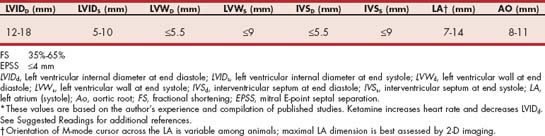
Diastolic measurements are made at the onset of the QRS complex of a simultaneously recorded ECG. Systolic measurements of the LV are made from the point of peak downward motion of the septum to the leading edge of the LV free-wall endocardium at the same instant. The septum and LV wall normally move toward each other in systole, although their peak movement may not coincide if electrical activation is not simultaneous. Paradoxic septal motion, in which the septum seems to move away from the LV wall and toward the transducer in systole, occurs in some cases of RV volume and/or pressure overload. This abnormal septal motion can also be visualized on 2-D images; it precludes accurate assessment of LV function using fractional shortening.
The fractional shortening (FS; % delta D) is commonly used to estimate LV function. FS is the percent change in LV dimension from diastole to systole ([LVIDd - LVIDs]/LVIDd × 100). Most normal dogs have an FS between 25% to 27% and 40%; in most cats FS is 35% to 65%, although there is some variability. It is important to note that this index, like others taken during cardiac ejection, has the significant limitation of being dependent on ventricular loading conditions. For example, reduced LV afterload (as occurs from mitral insufficiency, ventricular septal defect, or peripheral vasodilation) facilitates ejection of blood and permits greater FS, although intrinsic myocardial contractility is not increased. The exaggerated FS in patients with severe mitral regurgitation causes the appearance of increased contractility in those with normal myocardial function and can mask deteriorating contractile function. Regional wall motion abnormalities as well as arrhythmias can affect the FS.
The use of the calculated end-systolic volume index (ESVI) has been suggested as a more accurate way to assess myocardial contractility in the presence of mitral regurgitation. This index (ESV/m2 body surface area) compares ventricular size after ejection with body size rather than with the volume-overloaded end-diastolic ventricular size. LV volume estimation from 2-D rather than M-mode images is recommended. Extrapolation from human studies suggests an ESVI <30 ml/m2 is normal, 30 to 60 ml/m2 indicates mild LV systolic dysfunction, 60 to 90 ml/m2 represents moderate LV dysfunction, and >90 ml/m2 indicates severe LV dysfunction. A number of other methods can also be used to assess LV function.
Mitral valve motion is also evaluated with M-mode. The anterior (septal) leaflet is most prominent and has an “M” configuration. The posterior (parietal) leaflet is smaller; its motion mirrors the anterior leaflet, appearing as a “W.” Tricuspid valve motion is similar. The mitral valve motion pattern is identified by letters (see Figure 2-26). Point E occurs at maximal opening of the valve during the rapid ventricular filling phase. The valve drifts into a more closed position (point F) at the end of rapid ventricular filling. Atrial contraction causes the valve to open again (point A). At rapid heart rates the E and A points can merge. The mitral valve closes (point C) at the onset of ventricular systole. In normal animals the mitral E point is close to the interventricular septum. Increased E point-to-septal separation is usually associated with reduced myocardial contractility, but aortic insufficiency can also cause this. In animals with LV outflow obstruction, hemodynamic forces during ejection can pull the anterior mitral leaflet toward the septum. This is called systolic anterior motion (SAM), and it causes the normally straight mitral echos (between points C and D) to bend toward the septum during systole (see Figure 8-4). Diastolic flutter of the anterior mitral leaflet can sometimes be seen when an aortic insufficiency jet causes the leaflet to vibrate (Figures 2-27 and 2-28).
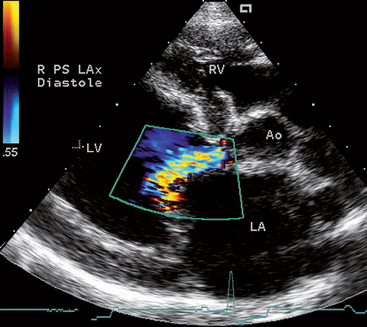
FIG 2-27 Color flow Doppler image of an aortic regurgitation jet angled toward and along the anterior leaflet of the mitral valve in a 2-year-old Rottweiler with aortic valve endocarditis. The regurgitant jet causes the mitral leaflet to flutter in diastole as seen in Fig. 2-28. Imaged from the right parasternal long axis position. Ao, Aorta; LA, left atrium; LV, left ventricle; RV, right ventricle.
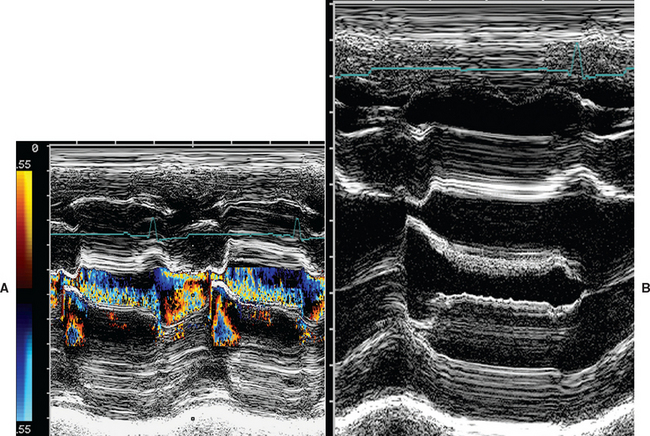
FIG 2-28 Color M-mode (A) and standard M-mode (B) images of the mitral valve from the dog in Fig. 2-27. The disturbed flow from aortic regurgitation is seen as the colors along the anterior leaflet in the left ventricular outflow region. Fine fluttering of the anterior mitral leaflet is seen in B; the leaflet appears wide and “fuzzy” compared with the thin, discrete posterior leaflet.
The diameter of the aortic root and sometimes its motion are measured with M-mode. The parallel walls of the aortic root shift rightward in systole. During diastole one or two aortic valve cusps may be seen as a straight line parallel to and centered between the aortic wall echoes. At the onset of ejection, the cusps separate toward the walls of the aortic root and then come together again at the end of ejection. The shape of these echoes (two cusps) has been described as a train of boxcars or little rectangular boxes attached together by a string. Aortic diameter is measured at end diastole. The amplitude of posterior-to-anterior motion of the aortic root is often decreased in animals with poor cardiac output. The LA dimension (behind the aortic root) is measured at maximal systolic excursion. In normal cats and dogs, the (M-mode) ratio of LA to aortic root diameters is about 1 to 1. However, LA size is underestimated with this M-mode view because (especially in dogs) the M-mode cursor usually transects the LA close to the left auricle, not at its maximal dimension. In cats the M-mode beam is more likely to cross the body of the LA, but its orientation can be inconsistent. Echo beam placement may be difficult in some animals, and the pulmonary artery can be inadvertently imaged instead. Therefore LA size assessment is best done from 2-D images.
Systolic time intervals (STIs) have been used sporadically to estimate cardiac function, but they are influenced by cardiac filling and afterload. These intervals can be calculated if the opening and closing of the aortic valve are clearly seen on M-mode and a simultaneous ECG is recorded for timing. The STIs are left ventricular ejection time (duration of time the aortic valve is open), preejection period (time from the onset of the QRS to aortic valve opening), and total electromechanical systole (left ventricular ejection time plus preejection period). STIs can also be derived with Doppler echocardiography.
CONTRAST ECHOCARDIOGRAPHY
This technique, often called a “bubble study,” uses rapid injection of a substance containing “microbubbles” either into a peripheral vein or selectively into the heart. These microbubbles generate tiny pinpoint echos that temporarily opacify the blood pool being imaged (Fig. 2-29). The microbubbles appear as bright sparkles moving with the blood flow. Agitated saline solution, a mixture of saline and the patient’s blood, and other substances can be used as echo-contrast material. Injection into a peripheral vein opacifies the right heart chambers; bubbles seen in the left heart or aorta indicate a right-to-left shunt. Saline microbubbles do not pass through the pulmonary capillaries (although some commercially available echo-contrast agents do), so echo-contrast injection via selective left-sided heart catheterization is required to visualize intracardiac left-to-right shunts or mitral regurgitation. Doppler echocardiography has largely replaced echocontrast studies, but they are still a useful tool in some cases.
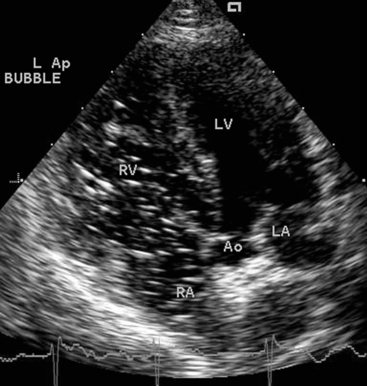
FIG 2-29 Echo “bubble” study in a dog with pulmonary hypertension. Bright speckles fill the RA and RV chambers after an injection of agitated saline into a peripheral vein. Because there was no intracardiac shunt in this dog, no “bubbles” are seen in the left heart chambers, despite abnormally high right heart pressures. View from left apical position; Ao, aorta; LA, left atrium; LV, left ventricle; RA, right atrium; RV, right ventricle.
DOPPLER ECHOCARDIOGRAPHY
Blood flow direction and velocity are imaged with Doppler echocardiography. Several types of Doppler echocardiography are used clinically: pulsed-wave (PW), continuous-wave (CW), and color flow (CF) mapping. Important clinical applications relate to identifying abnormal flow direction or turbulence and increased flow velocity. This allows detection and quantification of valvular insufficiency, obstructive lesions, and cardiac shunts. Cardiac output and other indicators of systolic function can be assessed, and there is much interest in Doppler-derived indices of diastolic function in patients with cardiac disease (see Suggested Readings). Adequate Doppler examinations are technically demanding. They are often very time consuming and require a good understanding of hemodynamic principles and cardiac anatomy.
The Doppler modality is based on detecting frequency shifts between the emitted ultrasound energy and echoes reflected from moving blood cells (the Doppler shift*
* V = C(± Δf/2f0cos ϑ)
V, calculated blood flow velocity (meters/sec); C, speed of sound in soft tissue (1540 meters/sec); ± Δf, Doppler frequency shift; f0, transmitted frequency; ϑ, intercept angle (between ultrasound beam and blood flow direction).
). Echoes returning from cells moving away from the transducer are of lower frequency, and those from cells moving toward the transducer are of higher frequency. The higher the velocity of the cells, the greater the frequency shift. Optimal blood flow profiles and calculation of maximal blood flow velocity are possible when the ultrasound beam is aligned parallel to the flow. This is in contrast to the perpendicular beam orientation needed for optimal M-mode and 2-D imaging. With Doppler, calculated blood flow velocity diminishes as the angle of incidence between ultrasound beam and direction of blood flow diverges from 0 degrees. This is because the calculated flow velocity is inversely related to the cosine of this angle (cosine 0 degrees = 1). As long as the angle between the ultrasound beam and path of blood flow is less than 20 degrees, maximal flow velocity can be estimated with reasonable accuracy. As this angle of incidence increases, the calculated velocity decreases. At an angle of 90 degrees, the calculated velocity is 0 (cosine 90 degrees = 0); therefore no flow signal is recorded when the ultrasound beam is perpendicular to blood flow. Flow signals are usually displayed with time on the x axis and velocity (scaled in m/sec) on the y axis. A zero baseline demarcates flow away from (below baseline) or toward (above baseline) the transducer. Higher velocities are displayed farther from baseline. Other flow characteristics (e.g., turbulence) also affect the Doppler spectral display.
Pulsed Wave Doppler
Pulsed wave (PW) Doppler uses short bursts of ultrasound to analyze echoes returned from a specified area (designated the sample volume) along the Doppler cursor line. The advantage of PW Doppler is that blood flow velocity, direction, and spectral characteristics can be calculated from a specific location in the heart or blood vessel. The main disadvantage is that the maximum measurable velocity is limited. The pulse repetition frequency (time required to send, receive, and process returning echoes), as well as the transmitted frequency and the distance of the sample volume from the transducer determine the maximum measurable velocity (called the Nyquist limit). The Nyquist limit is defined by two times the pulse repetition frequency. Lower frequency transducers and closer sample volume placement increase the Nyquist limit. When blood flow velocity is higher than the Nyquist limit, “aliasing” or velocity ambiguity occurs. This is displayed as a band of velocity signals extending above and below (“wrapped around”) the baseline, so neither velocity nor direction is measurable (Fig. 2-30). The velocity spectrum displayed with PW Doppler when blood cells in the sample volume are moving in the same direction and at the same velocity is relatively thin (tight). Variation in velocity causes spectral broadening (widening).
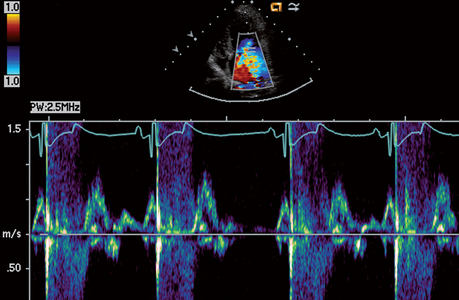
FIG 2-30 Mitral diastolic inflow and systolic regurgitant flow in a dog with degenerative mitral valve disease recorded with PW Doppler from left caudal parasternal position. The direction of mitral regurgitant flow is away from the transducer (below baseline); however, this direction cannot be discerned with PW because the flow velocity is too high. The signal is instead “wrapped around” the baseline (aliased).
Characteristic blood flow patterns are obtained from the different valve areas. Flow across both AV valves has a similar pattern; likewise, flow patterns across the semilunar valve areas are similar. Normal diastolic flow across the mitral valve (Fig. 2-31) and tricuspid valve consists of an initial higher velocity signal during the rapid ventricular filling phase (E wave), which is followed by a smaller velocity signal associated with atrial contraction (A wave). Breed, age, and body weight appear to have little influence on normal Doppler measurements. Peak velocities are normally higher across the mitral (peak E usually ≤0.9 to 1.0 m/sec; peak A usually ≤0.6 to 0.7 m/sec) compared with the tricuspid valve (peak E usually ≤0.8 to 0.9 m/sec; peak A usually ≤0.5 to 0.6 m/sec). The four-chamber left apical view usually provides optimal alignment for assessing mitral inflow velocities; the left cranial short axis view is usually best for tricuspid inflow, although several other imaging planes may provide adequate alignment. Doppler-derived diastolic function indices include the isovolumic relaxation time, mitral valve E/A ratio, and others.
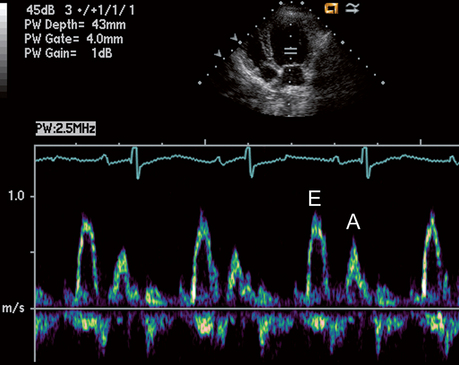
FIG 2-31 Normal mitral valve inflow recorded with PW Doppler from left caudal parasternal position in a dog. The flow signal (above baseline) following the QRS-T of the ECG represents early diastolic flow into the ventricle (E); the second, smaller peak after the P wave represents inflow from atrial contraction (A). Velocity scale in meters/second is on the left.
Flow across the pulmonary and aortic valves (Fig. 2-32) accelerates rapidly during ejection, with more gradual decel eration. Peak systolic pulmonary velocity is ≤1.4 to 1.5 m/sec in most normal dogs. The left cranial views usually provide better flow alignment. Sample volume placement is at or just distal to the valve. Peak aortic velocity is usually ≤1.6 to 1.7 m/sec, although some normal dogs have peak aortic velocities above 2 m/sec related to increased stroke volume or high sympathetic tone, especially if unsedated. Ventricular outflow obstruction causes more rapid flow acceleration, increased peak velocity, and turbulence. In general, aortic velocities over 2.2 (-2.4) m/sec are suggestive of outflow obstruction. Between 1.7 and ∼2.2 m/sec lies a “grey zone” where mild LV outflow obstruction (e.g., some cases of subaortic stenosis) cannot be differentiated with certainty from normal but vigorous left ventricular ejection. Maximal aortic/LV outflow velocities are obtained in most dogs from the subcostal (subxiphoid) position; however, in some dogs the left apical view provides higher velocity recordings. The LV outflow region should be interrogated from both views and the greater maximal velocity value used.
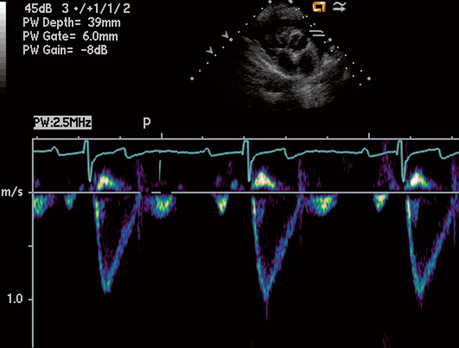
Continuous Wave Doppler
Continuous wave (CW) Doppler employs continuous and simultaneous ultrasound transmission and reception along the line of interrogation. Theoretically, there is no maximum velocity limit with CW Doppler, so high-velocity flows can be measured (Fig. 2-33). The disadvantage of CW Doppler is that sampling of blood flow velocity and direction occurs all along the ultrasound beam, not in a specified area (so-called range ambiguity).
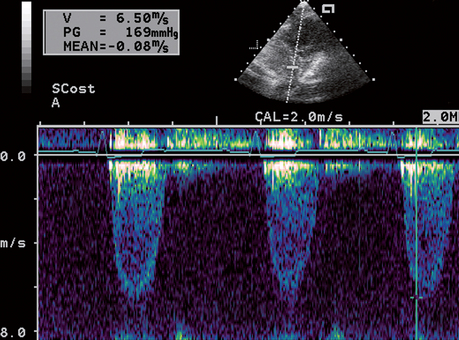
FIG 2-33 CW Doppler recording of high-velocity aortic outflow in a dog with severe subaortic stenosis, imaged from the subcostal position. Estimated systolic pressure gradient across the outflow region is 169 mm Hg based on a peak velocity of 6.5 m/sec. Velocity scale in meters/second is on the left.
Pressure Gradient Estimation
Doppler estimation of pressure gradients is used in combination with M-mode and 2-D imaging to assess the severity of congenital or acquired flow obstructions. In addition, regurgitant jet maximal velocity estimates the peak pressure gradient across the regurgitant valve. The instantaneous pressure gradient across a stenotic or regurgitant valve is estimated using the maximal measured velocity of the flow jet. CF Doppler is useful to depict jet orientation. Careful Doppler beam alignment is essential in order to measure maximum velocity. CW Doppler is employed if aliasing occurs with PW Doppler. A modification of the Bernoulli equation is used to estimate pressure gradient:

Other factors involved in this relationship are usually of minimal clinical importance and are generally ignored.
Pulmonary arterial systolic pressure can be estimated (if there is no pulmonic stenosis) by using the maximal tricuspid regurgitation jet velocity (TRmax). The calculated systolic pressure gradient plus about 8 to 10 mm Hg (or the measured central venous pressure) equals the peak right ventricular systolic pressure, which approximates pulmonary artery systolic pressure. Pulmonary hypertension (PH) is associated when TRmax exceeds 2.8 m/s. The severity of PH is often categorized as mild (∼35-50 mm Hg; TRmax 2.9-3.5 m/s), moderate (∼51-75 mm Hg; TRmax 3.6-4.3 m/s), or severe (>75 mm Hg; TRmax >4.3 m/s). Likewise, pulmonary diastolic pressure can be estimated from pulmonary regurgitant (PR) jet velocity at end-diastole. The calculated end-diastolic pressure gradient between the pulmonary artery and the right ventricle, plus the estimated right ventricular diastolic pressure, represents pulmonary arterial diastolic pressure. Pulmonary hypertension is also suggested by a peak PR velocity of >2.2 m/s.
Color Flow Mapping
Color flow (CF) mapping is a form of PW Doppler that combines the M-mode or 2-D modality with blood flow imaging. However, instead of one sample volume along one scan line, many sample volumes are analyzed along multiple scan lines. The mean frequency shifts obtained from multiple sample volumes are color-coded for direction (in relation to the transducer) and velocity. Most systems code blood flow toward the transducer as red and blood flow away from the transducer as blue. Zero velocity is indicated by black, meaning either no flow or flow that is perpendicular to the angle of incidence. Differences in relative velocity of flow can be accentuated, and the presence of multiple velocities and directions of flow (turbulence) can be indicated by different display maps that use variations in brightness and color. Aliasing occurs often, even with normal blood flows, because of low Nyquist limits. Signal aliasing is displayed as a reversal of color (e.g., red shifting to blue; Fig. 2-34). Turbulence produces multiple velocities and directions of flow in an area, resulting in a mixing of color; this display can be enhanced using a variance map, which adds shades of yellow or green to the red/blue display (Fig. 2-35).
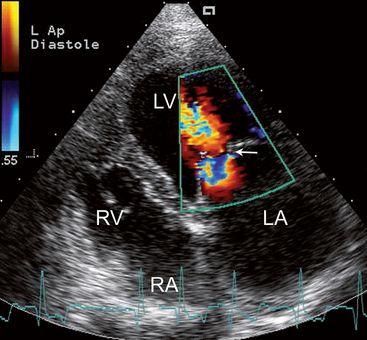
FIG 2-34 Example of color flow aliasing in a dog with mitral valve stenosis and atrial fibrillation. Diastolic flow toward the narrowed mitral orifice (arrow) accelerates beyond the Nyquist limit, causing red-coded flow (blood moving toward transducer) to alias to blue, then again to red, and once more to blue. Turbulent flow is seen within the left ventricle at the top of the 2-D image.
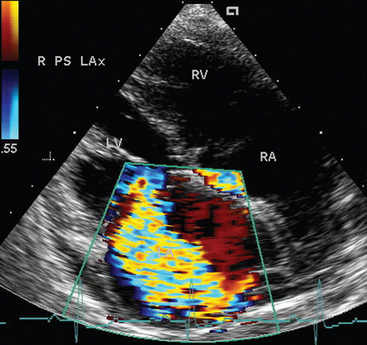
FIG 2-35 Systolic frame showing turbulent regurgitant flow into the enlarged LA of a dog with chronic mitral valve disease. The regurgitant jet curves around the dorsal aspect of the LA. Imaged from the right parasternal long axis, four chamber view. LA, left atrium; LV, left ventricle; RA, right atrium; RV, right ventricle.
The severity of valve regurgitation is sometimes estim-ated by the size and shape of the regurgitant jet during CF imaging. Although technical and hemodynamic factors confound the accuracy of such assessment, wide and long regurgitant jets are generally associated with more severe regurgitation than narrow jets. Other methods for quantifying valve regurgitation have been described as well. Maximum regurgitant jet velocity is not a good indicator of severity, especially with mitral regurgitation. Changes in chamber size provide a better indication of severity with chronic regurgitation.
Doppler Tissue Imaging
Doppler tissue imaging (DTI) is a modality used to assess the motion of tissue, rather than blood cells, by altering the signal processing and filtering of returning echoes. Myocardial velocity patterns can be assessed with color flow and pulsed wave spectral DTI techniques. Spectral DTI provides greater temporal resolution and quantifies velocity of myocardial motion at specific locations, such as the lateral or septal aspects of the mitral annulus (Fig. 2-36). Color DTI methods display mean myocardial velocities from different regions. Other techniques used to assess regional myocardial function and synchrony are derived from DTI methods; these include myocardial velocity gradients, myocardial strain, strain rate, and velocity vector imaging.
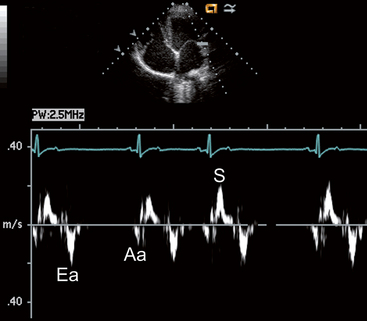
TRANSESOPHAGEAL ECHOCARDIOGRAPHY
Transesophageal echocardiography (TEE) uses specialized transducers mounted on a flexible, steerable endoscope tip to image cardiac structures through the esophageal wall. TEE can provide clearer images of some cardiac structures (especially those at or above the AV junction) compared with transthoracic echocardiography because chest wall and lung interference is avoided. This technique can be particularly useful for defining some congenital cardiac defects and identifying thrombi, tumors, or endocarditis lesions, as well as guiding cardiac interventional procedures (Fig. 2-37). The need for general anesthesia and the expense of the endoscopic transducers are the main disadvantages of TEE. Complications related to the endoscopy procedure appear to be minimal.
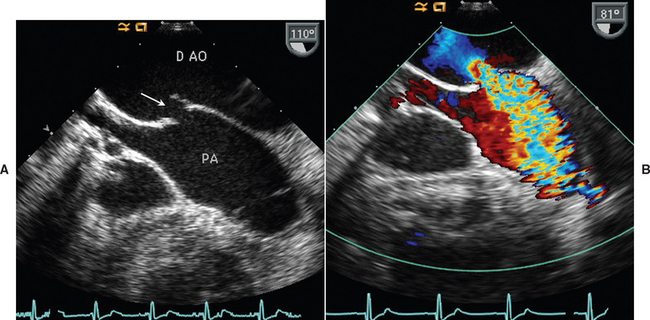
FIG 2-37 A, Two-dimensional transesophageal echo (TEE) image at the heartbase from a 5-year-old English Springer Spaniel shows a patent ductus arteriosus (arrow) between the descending aorta (D Ao) and pulmonary artery (PA). B, Color flow Doppler image in diastole from the same orientation demonstrates flow acceleration toward the ductal opening in the D Ao and the turbulent ductal flow into the PA.
THREE-DIMENSIONAL ECHOCARDIOGRAPHY
The ability to generate and manipulate 3-dimensional (3-D) images of the heart and other structures is a promising new way to evaluate cardiac structure and function. Anatomic and blood flow abnormalities can be viewed from any angle by rotating or bisecting the 3-D images. Current technology requires several cardiac cycles in order to acquire sufficient data for 3-D reconstruction of the entire heart, although true “real time” 3-D echocardiography will soon be available.
OTHER TECHNIQUES
CENTRAL VENOUS PRESSURE MEASUREMENT
Central venous pressure (CVP) is influenced by intravascular volume, venous compliance, and cardiac function. CVP measurement helps in differentiating high right heart filling pressure (as from right heart failure or pericardial disease) from other causes of pleural or peritoneal effusion. But it is important to note that pleural effusion itself can increase intrapleural pressure enough to impair cardiac filling; this can raise CVP even in the absence of cardiac disease. Therefore CVP should be measured after thoracocentesis in patients with moderate- to large-volume pleural effusion. CVP is sometimes used to monitor critical patients receiving large intravenous fluid infusions. However, CVP is not an accurate reflection of left heart filling pressure and thus is not a reliable way to monitor for cardiogenic pulmonary edema. The CVP in normal dogs and cats usually ranges from 0 to 8 (up to 10) cm H2O. Fluctuations in CVP that parallel those of intrapleural pressure occur during respiration.
CVP is measured via a large-bore jugular catheter that extends into or close to the right atrium. The catheter is placed aseptically and connected by extension tubing and a three-way stopcock to a fluid administration set. A water manometer is attached to the stopcock and positioned vertically, with the stopcock (representing 0 cm H2O) placed at the same horizontal level as the patient’s right atrium. The stopcock is turned off to the animal, allowing the manometer to fill with crystalloid fluid; then the stopcock is turned off to the fluid reservoir so that the fluid column in the manometer equilibrates with the animal’s CVP. Repeated measurements are more consistent when taken with the animal and manometer in the same position and during the expiratory phase of respiration. Small fluctuations in the manometer’s fluid meniscus occur with the heartbeat, and slightly larger movement is associated with respiration. Marked change in the height of the fluid column associated with the heartbeat suggests either severe tricuspid insufficiency or that the catheter tip is within the right ventricle.
BIOCHEMICAL MARKERS
A number of specific biochemical markers are being evaluated for their diagnostic and prognostic potential. Cardiac troponins are more sensitive for detecting myocardial injury than cardiac-specific creatine kinase (CK-MB) and other biochemical markers of muscle damage. In dogs the CK-MB isoform comprises only a minority of total cardiac CK, and it is also present in noncardiac tissues. Cardiac troponins are regulatory proteins associated with cardiac actin (thin) contractile filaments. Circulating concentrations of cardiac troponin I (cTnI) and cardiac troponin T (cTnT) provide a specific indicator of myocardial injury or necrosis. The pattern and degree of their release can depend on the type and severity of myocyte injury. Although there is an association between acute injury and the degree of increase in serum troponin concentration, this relationship is less clear in patients with chronic disease. After acute myocyte damage, serum cTn concentration increases within a few hours, peaks in 12 to 24 hours, and then declines over the next few weeks. Myocardial inflammation, trauma, congestive heart failure, hypertrophic cardiomyopathy, and gastric dilatation/volvulus have been associated with increased cardiac toponin concentrations. In dogs with congestive heart failure or hypertrophic cardiomyopathy, this probably relates to continued myocardial remodeling, not just acute damage from myocardial infarction. cTnI appears to be more specific than cTnT. Human assays for cTnI and cTnT can be used in dogs and cats, but because methodology is not standardized among various cTnI assays, the cut-off values for normal may vary. Furthermore, cTn values that indicate clinically relevant myocardial disease or damage in animals are unclear.
The natriuretic peptides, ANP, BNP, and their precursors, are other potentially useful biomarkers for assessing the presence and possibly prognosis of heart failure. Circulating natriuretic peptide concentrations increase in association with vascular volume expansion and decreased renal clearance and when their production is stimulated (e.g., with ventricular strain and hypertrophy, hypoxia, or tachycardia). The natriuretic peptides should be used as functional markers of cardiac disease rather than of specific pathology. Issues of standardization among different commercial assays and methodologies and lack of universal reference values are limitations. The N-terminal fragments (NT-proANP and NT-proBNP) of the natriuretic peptide precursor molecules remain in circulation longer and reach higher plasma concentrations than the active hormone molecules. Because ANP and NT-proANP amino acid sequences are highly conserved among people, dogs, and cats, human assays may be used. Canine and feline BNP are similar, but differences from people preclude the use of most human BNP assays. Canine and feline NT-proBNP measurement is commercially available, although questions regarding interpretation of results remain. Plasma BNP and NT-proBNP are sensitive and specific markers for chronic LV dysfunction in people, and high concentrations are negatively correlated with prognosis. BNP as well as NT-proANP are high in most cats with hypertrophic cardiomyopathy. Elevated concentrations are also seen in dogs with heart disease and heart failure, but overlap in these concentrations compared with those of some dogs without heart disease is of concern. Studies are ongoing to clarify the potential usefulness of plasma natriuretic peptides in dogs with cardiac disease.
Other biomarkers are currently being evaluated. The endothelin (ET) system is activated in dogs and cats with heart failure and in those with pulmonary hypertension, so assays for plasma ET–like immunoreactivity may be useful. Tumor necrosis factor (TNFα) may also be a useful marker of cardiac disease progression, but it is not cardiac specific.
ANGIOCARDIOGRAPHY
Nonselective angiocardiography can be used to diagnose several acquired and congenital diseases, including cardiomyopathy and heartworm disease in cats, severe pulmonic or (sub)aortic stenosis, patent ductus arteriosus, and tetralogy of Fallot. Intracardiac septal defects and valvular regurgitation cannot be reliably identified. The quality of such studies is higher with rapid injection of radiopaque agents via a large-bore catheter and with smaller patient size. In most cases, echocardiography provides similar information more safely. However, evaluation of the pulmonary vasculature is better accomplished using nonselective angiocardiography.
Selective angiocardiography is performed by advancing cardiac catheters into specific areas of the heart or great vessels. Injection of contrast material is generally preceded by the measurement of pressures and oxygen saturations. This technique allows identification of anatomic abnormalities and the path of blood flow. Doppler echocardiography may provide comparable diagnostic information noninvasively. However, selective angiography is a necessary component of many cardiac interventional procedures.
CARDIAC CATHETERIZATION
Cardiac catheterization allows measurement of pressure, cardiac output, and blood oxygen concentration from specific intracardiac locations. Specialized catheters are selectively placed into different areas of the heart and vasculature via the jugular vein, carotid artery, or the femoral vessels. Congenital and acquired cardiac abnormalities can be identified and assessed with these procedures in combination with selective angiocardiography. The advantages of Doppler echocardiography often outweigh those of cardiac catheterization, especially in view of the good correlation between certain Doppler- and catheterization-derived measurements. However, cardiac catheterization is necessary for balloon valvuloplasty, ductal occlusion, and other interventional procedures.
Pulmonary capillary wedge pressure (PCWP) monitoring is sometimes performed in dogs with heart failure because it provides an estimate of left heart filling pressure (in the absence of left ventricular inflow obstruction). To obtain PCWP, an end-hole, balloon-tipped (Swan-Ganz) catheter is passed into the main pulmonary artery. When the balloon is inflated and the catheter allowed to become wedged in a smaller pulmonary artery, flow in that vessel is occluded. The pressure measured at the catheter tip reflects pulmonary capillary pressure, which essentially is equivalent to left atrial pressure. This invasive technique allows differentiation of cardiogenic from noncardiogenic pulmonary edema and provides a means of monitoring the effectiveness of heart failure therapy. However, its use requires meticulous, aseptic catheter placement and continuous patient monitoring.
OTHER NONINVASIVE IMAGING
Nuclear Cardiology
Radionuclide, or nuclear, methods of evaluating cardiac function are available at some veterinary referral centers. These techniques can provide noninvasive assessment of cardiac output, ejection fraction, and other measures of cardiac performance as well as myocardial blood flow and metabolism.
Cardiac Computed Tomography and Magnetic Resonance Imaging
Cardiac computed tomography and magnetic resonance imaging are available in some centers. These techniques depict greater contrast between cardiovascular structures and the blood pool as well as differentiate certain types of tissue. Because cardiac movement during the imaging sequence reduces image quality, some type of physiologic (ECG) gating, as well as rapid image acquisition, are needed. Identification of pathologic morphology is a major application, although myocardial function, perfusion, and blood flow studies may be done depending on the technical capability of the equipment. Novel MR techniques also allow noninvasive evaluation of blood vessels, including calculation of peripheral resistance.
PNEUMOPERICARDIOGRAPHY
Pneumopericardiography may be helpful in delineating the cause of pericardial effusions, especially if echocardiography is unavailable. This technique and pericardiocentesis are described in Chapter 9.
ENDOMYOCARDIAL BIOPSY
Small samples of endocardium and adjacent myocardium can be obtained using a special bioptome passed into the right ventricle via a jugular vein. Routine histopathology and other techniques to evaluate myocardial metabolic abnormalities can be performed on the biopsy samples. Endomyocardial biopsy is most often used for myocardial disease research and is not commonly used in clinical veterinary cardiology.
Buchanan JW, Bücheler J. Vertebral scale system to measure canine heart size in radiographs. J Am Vet Med Assoc. 1995;206:194.
Coulson A, Lewis ND. An atlas of interpretive radiographic anatomy of the dog and cat. Oxford: Blackwell Science, 2002.
Lehmkuhl LB, et al. Radiographic evaluation of caudal vena cava size in dogs. Vet Radiol Ultrasound. 1997;38:94.
Litster AL, Buchanan JW. Vertebral scale system to measure heart size in radiographs of cats. J Am Vet Med Assoc. 2000;216:210.
Sleeper MM, Buchanan JW. Vertebral scale system to measure heart size in growing puppies. J Am Vet Med Assoc. 2001;219:57.
Bright JM, Cali JV. Clinical usefulness of cardiac event recording in dogs and cats examined because of syncope, episodic collapse, or intermittent weakness: 60 cases (1997–1999). J Am Vet Med Assoc. 2000;216:1110.
Calvert CA, et al. Possible late potentials in 4 dogs with sustained ventricular tachycardia. J Vet Intern Med. 1998;12:96.
Calvert CA, Wall M. Evaluation of stability over time for measures of heart-rate variability in overtly healthy Doberman Pinschers. Am J Vet Res. 2002;63:53.
Constable PD, et al. Effects of endurance training on standard and signal-averaged electrocardiograms of sled dogs. Am J Vet Res. 2000;61:582.
Finley MR, et al. Structural and functional basis for the long QT syndrome: relevance to veterinary patients. J Vet Intern Med. 2003;17:473.
Goodwin JK. Holter monitoring and cardiac event recording. Vet Clin North Am: Sm Anim Pract. 1998;28:1391.
Haggstrom J, et al. Heart rate variability in relation to severity of mitral regurgitation in Cavalier King Charles Spaniels. J Small Anim Pract. 1996;37:69.
Harvey AM, et al. Effect of body position on feline electrocardiographic recordings. J Vet Intern Med. 2005;19:533.
Meurs KM, et al. Use of ambulatory electrocardiography for detection of ventricular premature complexes in healthy dogs. J Am Vet Med Assoc. 2001;218:1291.
Miller RH, et al. Retrospective analysis of the clinical utility of ambulatory electrocardiographic (Holter) recordings in syncopal dogs: 44 cases (1991–1995). J Vet Intern Med. 1999;13:111.
Nakayama H, Nakayama T, Hamlin RL. Correlation of cardiac enlargement as assessed by vertebral heart size and echocardiographic and electrocardiographic findings in dogs with evolving cardiomegaly due to rapid ventricular pacing. J Vet Intern Med. 2001;15:217.
Rishniw M, et al. Effect of body position on the 6-lead ECG of dogs. J Vet Intern Med. 2002;16:69.
Tilley LP. Essentials of canine and feline electrocardiography, ed 3. Philadelphia: Lea & Febiger, 1992.
Ulloa HM, Houston BJ, Altrogge DM. Arrhythmia prevalence during ambulatory electrocardiographic monitoring of beagles. Am J Vet Res. 1995;56:275.
Ware WA. Practical use of Holter monitoring. Compend Contin Educ. 1998;20:1.
Ware WA, Christensen WF. Duration of the QT interval in healthy cats. Am J Vet Res. 1999;60:1426.
Ware WA. Twenty-four hour ambulatory electrocardiography in normal cats. J Vet Intern Med. 1999;13:175.
Abbott JA, MacLean HN. Two-dimensional echocardiographic assessment of the feline left atrium. J Vet Intern Med. 2006;20:111.
Adin DB, McCloy K. Physiologic valve regurgitation in normal cats. J Vet Cardiol. 2005;7:9.
Baade H, Schober K, Oechtering G. Echokardiographische referenzwerte beim West Highland White Terrier unter besonderer Berücksichtigung der Rechtsherzfunktion. Tieräerztl Prax. 2002;30:172.
Bayon A, et al. M-mode echocardiography studying growing Spanish mastiffs. J Small Anim Pract. 1994;35:473.
Bonagura JD, Luis Fuentes V. Echocardiography. In: Ettinger SJ, Feldman EC, editors. Textbook of veterinary internal medicine. ed 5. Philadelphia: WB Saunders; 2000:834-873.
Bonagura JD, Miller MW. Doppler echocardiography I: pulsed and continuous wave studies. Vet Clin North Am Small Anim Pract. 1998;28:1325.
Bonagura JD, Miller MW. Doppler echocardiography II: color Doppler imaging. Vet Clin North Am Small Anim Pract. 1998;28:1361.
Calvert CA, Brown J. Use of M-mode echocardiography in the diagnosis of congestive cardiomyopathy in Doberman pinschers. J Am Vet Med Assoc. 1986;189:293.
Chetboul V. Tissue Doppler imaging: a promising technique for quantifying regional myocardial function. J Vet Cardiol. 2002;4:7.
Concalves AC, et al. Linear, logarithmic, and polynomial models of M-mode echocardiographic measurements in dogs. Am J Vet Res. 2002;63:994.
Crippa L, et al. Echocardiographic parameters and indices in the normal Beagle dog. Lab Anim. 1992;26:190.
DeMadron E, Bonagura JD, Herring DS. Two-dimensional echocardiography in the normal cat. Vet Radiol. 1985;26:149.
Feigenbaum H, Armstrong WF, Ryan T. Feigenbaum’s echocardiography, ed 6. Philadelphia: Lippincott, Williams & Wilkins, 2005.
Fox PR, Bond BR, Peterson ME. Echocardiographic reference values in healthy cats sedated with ketamine HCl. Am J Vet Res. 1985;46:1479.
Gavaghan BJ, et al. Quantification of left ventricular diastolic wall motion by Doppler tissue imaging in healthy cats and cats with cardiomyopathy. Am J Vet Res. 1999;60:1478.
Gooding JP, Robinson WF, Mews GC. Echocardiographic assessment of left ventricular dimensions in clinically normal English Cocker Spaniels. Am J Vet Res. 1986;47:296.
Herrtage ME: Echocardiographic measurements in the normal Boxer. Abstr. Proceedings of the 4th European Society of Veterinary Internal Medicine Congress, 1994, p 172.
Jacobs G, Knight DV. M-mode echocardiographic measurements in nonanesthetized healthy cats: effects of body weight, heart rate, and other variables. Am J Vet Res. 1985;46:1705.
Kittleson MD, Brown WA. Regurgitant fraction measured by using the proximal isovelocity surface area method in dogs with chronic myxomatous mitral valve disease. J Vet Intern Med. 2003;17:84.
Koch J, et al. M-mode echocardiographic diagnosis of dilated cardiomyopathy in giant breed dogs. Zentralbl Veterinarmed A. 1996;43:297.
Koffas H, et al. Peak mean myocardial velocities and velocity gradients measured by color M-mode tissue Doppler imaging in healthy cats. J Vet Intern Med. 2003;17:510.
Koffas H, et al. Pulsed tissue Doppler imaging in normal cats and cats with hypertrophic cardiomyopathy. J Vet Intern Med. 2006;20:65.
Lonsdale RA, Labuc RH, Robertson ID. Echocardiographic parameters in training compared with non-training Greyhounds. Vet Radiol Ultrasound. 1998;39:325.
Loyer C, Thomas WP. Biplane transesophageal echocardiography in the dog: technique, anatomy and imaging planes. Vet Radiol Ultrasound. 1995;36:212.
MacDonald KA, et al. Tissue Doppler imaging and gradient echo cardiac magnetic resonance imaging in normal cats and cats with hypertrophic cardiomyopathy. J Vet Intern Med. 2006;20:627.
McEntee K, et al. Doppler echocardiographic study of left and right ventricular function during dobutamine stress testing in conscious healthy dogs. Am J Vet Res. 1999;60:865.
Minors SL, O’Grady MR. Resting and dobutamine stress echocardiographic factors associated with the development of occult dilated cardiomyopathy in healthy Doberman Pinscher dogs. J Vet Intern Med. 1998;12:369.
Moise NS, Fox PR. Echocardiography and Doppler imaging. In: Fox PR, Sisson DD, Moise NS, editors. Textbook of canine and feline cardiology. ed 2. Philadelphia: WB Saunders; 1999:130-171.
Moise NS, et al. Echocardiography, electrocardiography, and radiography of cats with dilatation cardiomyopathy, hypertrophic cardiomyopathy, and hyperthyroidism. Am J Vet Res. 1986;47:1476.
Morrison SA, et al. Effect of breed and body weight on echocardiographic values in four breeds of dogs of differing somatotype. J Vet Intern Med. 1992;6:220.
O’Grady MR, Horne R. Outcome of 103 asymptomatic Doberman Pinschers: incidence of dilated cardiomyopathy in a longitudinal study. Abstr. J Vet Intern Med. 1995;9:199.
Page A, Edmunds G, Atwell RB. Echocardiographic values in the Greyhound. Aust Vet J. 1993;70:361.
Rishniw M, Erb HN. Evaluation of four 2-dimensional echocardiographic methods of assessing left atrial size in dogs. J Vet Intern Med. 2000;14:429.
Schober KE, et al. Pulmonary venous flow characteristics as assessed by transthoracic pulsed Doppler echocardiography in normal dogs. Vet Radiol Ultrasound. 1998;39:33.
Schober KE, Luis Fuentes V, Bonagura JD. Comparison between invasive hemodynamic measurements and noninvasive assessment of left ventricular diastolic function by use of Doppler echocardiography in healthy anesthetized cats. Am J Vet Res. 2003;64:93.
Schober KE, Maerz I. Assessment of left atrial appendage flow velocity and its relation to spontaneous echocardiographic contrast in 89 cats with myocardial disease. J Vet Intern Med. 2006;20:120.
Sisson DD, et al. Plasma taurine concentrations and M-mode echocardiographic measures in healthy cats and in cats with dilated cardiomyopathy. J Vet Intern Med. 1991;5:232.
Sisson D, Schaeffer D. Changes in linear dimensions of the heart, relative body weight as measured by M-mode echocardiography in growing dogs. Am J Vet Res. 1991;52:1591-1596.
Snyder PS, Sato T, Atkins CE. A comparison of echocardiographic indices of the non-racing, healthy greyhound to reference values from other breeds. Vet Radiol Ultrasound. 1995;36:387.
Stepien RL, et al. Effect of endurance training on cardiac morphology in Alaskan sled dogs. J Appl Physiol. 1998;85:1368.
Thomas WP, et al. Recommendations for standards in transthoracic two-dimensional echocardiography in the dog and cat. J Vet Intern Med. 1993;7:247-252.
Vollmar AC. Echocardiographic measurements in the Irish Wolfhound: reference values for the breed. J Am Anim Hosp Assoc. 1999;35:271.
Adin DB, et al. Comparison of canine cardiac troponin I concentrations as determined by 3 analyzers. J Vet Intern Med. 2006;20:1136.
Chetboul V, et al. Diagnostic potential of natriuretic peptides in occult phase of Golden Retriever muscular dystrophy cardiomyopathy. J Vet Intern Med. 2004;18:845.
DeFrancesco TC, et al. Prospective clinical evaluation of an ELISA B-type natriuretic peptide assay in the diagnosis of congestive heart failure in dogs presenting with cough or dyspnea. J Vet Intern Med. 2007;21:243.
Gookin JL, Atkins CE. Evaluation of the effect of pleural effusion on central venous pressure in cats. J Vet Intern Med. 1999;13:561.
Herndon WE, et al. Cardiac troponin I in feline hypertrophic cardiomyopathy. J Vet Intern Med. 2002;16:558.
MacDonald KA, et al. Brain natriuretic peptide concentration in dogs with heart disease and congestive heart failure. J Vet Intern Med. 2003;17:172.
Oakley RE, et al. Experimental evaluation of central venous pressure monitoring in the dog. J Am Anim Hosp Assoc. 1997;33:77-82.
Oyama MA, Sisson D. Cardiac troponin-I concentration in dogs with cardiac disease. J Vet Intern Med. 2004;18:831.
Prosek R, et al. Distinguishing cardiac and noncardiac dyspnea in 48 dogs using plasma atrial natriuretic factor, B-type natriuretic factor, endothelin, and cardiac troponin-I. J Vet Intern Med. 2007;21:238.
Schober KE. Biochemical markers of cardiovascular disease. In: Ettinger SJ, Feldman EC, editors. Textbook of veterinary internal medicine. ed 6. Philadelphia: WB Saunders; 2005:940-948. 2005
Shaw SP, Rozanski EA, Rush JE. Cardiac troponins I and T in dogs with pericardial effusion. J Vet Intern Med. 2004;18:322.
Sisson DD. Neuroendocrine evaluation of cardiac disease. Vet Clin North Am: Small Anim Pract. 2004;34:1105.
Sleeper MM, Clifford CA, Laster LL. Cardiac troponin I in the normal dog and cat. J Vet Intern Med. 2001;15:501.
Spratt DP, et al. Cardiac troponin I: evaluation of a biomarker for the diagnosis of heart disease in the dog. J Small Anim Pract. 2005;46:139.