Measurement Methods Used in Developing Evidence for Practice
Nursing studies examine a wide variety of phenomena and thus require an extensive array of measurement methods. However, nurse researchers have sometimes found limited instruments available to measure phenomena central to the studies needed to development evidence for practice. Measurement methods used in older nursing studies were often developed for a specific study, and there was little documented proof of their validity and reliability. Since the early 1980s, nurse researchers have made it a priority to develop valid and reliable instruments to measure phenomena of concern to nursing. As a result, the number and quality of measurement methods have greatly increased.
Knowledge of measurement methods is important at all levels of nursing. To critically appraise a study, not only must the nurse researcher have some knowledge of measurement theory, but she or he must also understand the state of the art for developing measures to examine the phenomena under study. When evaluating someone else’s research, you might, for example, want to know whether the researcher was using an older tool that had been surpassed by a number of more recently developed instruments. It might help you to know that measuring a particular phenomenon has been a problem with which nurse researchers have struggled for a number of years. Your understanding of the successes and struggles in measuring nursing phenomena may stimulate your creative thinking and lead you to contribute your own research to the development of measurement approaches. Some nursing phenomena have not been adequately examined because reliable and valid instruments are not available to measure them, which makes it difficult for nurse researchers to generate the essential evidence needed for practice (Craig & Smyth, 2007; Malloch & Porter-O’Grady, 2006).
This chapter describes the common measurement approaches used in nursing research, including physiological measures, observations, interviews, questionnaires, and scales. Other methods of measurement discussed include Q methodology, the Delphi technique, projective techniques, and diaries. This chapter also describes the process for locating existing instruments, determining their reliability and validity, and assessing their readability. Directions are provided for describing an instrument in a written report. The chapter concludes with a description of the process of scale construction and issues related to translating an instrument into another language.
PHYSIOLOGICAL MEASUREMENT
Much of nursing practice is oriented toward physiological dimensions of health. Therefore, many of our questions require us to be able to measure these dimensions. Of particular importance are studies linking physiological and psychosocial variables. In 1993, the National Institute of Nursing Research (NINR) expressed a need for increased numbers of physiologically based nursing studies inasmuch as 85% of NINR-funded studies involved nonphysiological variables. According to NINR staff, a review of physiological studies funded by the NINR found that “the biological measurements used in the funded grants often were not state-of-the-science, and the biological theory underlying the measurements often was underutilized” (Cowan, Heinrich, Lucas, Sigmon, & Hinshaw, 1993, p. 4). This report suggested an increase not only in the number of biologically based studies but also in the quality of measurements used in these studies. The NINR’s (2006) number one strategy for building the science of nursing for 2006 to 2010 is the “integrating of biological and behavior science for better health” (see NINR Web site at www.nih.gov/ninr). Due in part to these funding priorities and in part to the demands for outcome studies with physiological measures, the number of studies including physiological measures has dramatically increased. For example, physiological instruments exist to precisely measure nutritional status, wound healing, and sleep patterns.
Physiological measures can be acquired in a variety of ways. The following sections describe how to obtain physiological measures by self-report, observation, direct or indirect measurement, laboratory tests, electronic monitoring, and the creative development of new instruments. The measurement of physiological variables across time is also addressed. The section concludes with a discussion of how to select physiological variables for a particular study.
Obtaining Physiological Measures by Self-Report
Self-report has been used effectively to obtain physiological information and may be particularly useful when the subjects are not in closely monitored settings such as hospitals, clinics, or research facilities. Phenomena that have been or could be measured by self-report include hours of sleep, patterns of daily activities, eating patterns, dieting patterns, stool frequency and consistency, patterns of joint stiffness, variations in degree of mobility, fear of falling, health status, and exercise patterns. For some variables, self-reporting may be the only means of obtaining the information. Such may be the case when the subject experiences a physiological phenomenon, but it cannot be observed or measured by others. Nonobservable physiological phenomena include pain (Adachi, Shimada, & Usui, 2003; Chung, Ng, & Wong, 2002; Im et al., 2007), angina (DeVon & Zerwic, 2003), nausea, dizziness, indigestion, patterns of hunger or thirst, hot flashes, variations in cognition, visual phenomena, tinnitus, pruritus (Ro, Ha, Kim, & Yeom, 2002), fatigue, and dyspnea (Kapella, Larson, Patel, Covey, & Berry, 2006). Pope (1995) pointed out that sound is an essential and constant component of the human condition, but its importance to health has been little recognized. Although one can measure sounds, one cannot measure sound perception and sensitivity. Pope has recommended the development of instruments to measure these responses and specifically pointed out the potential impact of these variables in settings such as critical care units.
Kapella et al. (2006) examined relationships among the physiological variables of fatigue, dyspnea, and functional status in chronic obstructive pulmonary disease (COPD) patients. These variables were measured with self-report instruments, and the measurement of dyspnea is described in the following excerpt.
The self-report CRQ Dyspnea Scale seemed to be a valid and reliable method for measuring the dyspnea experienced by patients with COPD. Kapella et al. (2006) indicated the scale was developed just for people with COPD, which adds to the validity of the scale. Sources that documented the development of the scale’s validity and reliability were identified. In addition, the CRQ Dyspnea Scale was reliable in this study, as indicated by the Cronbach alpha = 0.84. Using self-report measures may enable nurses to ask research questions that were not previously considered, which could be an important means to build knowledge in areas not yet explored. The insight gained could alter the way nurses manage patient situations that are now considered problematic and thereby improve patient outcomes.
Obtaining Physiological Measures by Observation
Researchers sometimes obtain data on physiological parameters by using observational data collection measures. These measures provide criteria for quantifying various levels or states of physiological functioning. In addition to collecting clinical data, this method provides a means to gather data from the observations of caregivers. This source of data has been particularly useful in studies involving persons with Alzheimer’s disease, advanced cancer, and severe mental illness. Observation is also an effective way to gather data on the frail elderly, infants, and young children. Studies involving home health agencies and hospices often use observation tools to record physiological dimensions of patient status. These data are sometimes stored electronically and are available to researchers for large database analysis.
Small and Melnyk (2006) studied the early predictors of post-hospital adjustment problems in critically ill toddlers and preschool children. The researchers measured the mother’s participation in the child’s care during hospitalization using an observational checklist that was completed by the primary nurse. The following excerpt describes the measurement method used and its validity and reliability.
Obtaining Physiological Measures Directly or Indirectly
Physiological variables can be measured either directly or indirectly. Direct measures are more accurate because there is an objective measurement of the study variable. For example, patients might be asked to report any irregular heartbeats over 24 hours, which is an indirect measurement of heart rhythm, and each patient’s heart could be monitored with a holter monitor over the same 24-hour timeframe (direct measure of heart rhythm). Whenever possible, researchers usually select direct measures of their study variables due to the accuracy and precision of these measurement methods. However, if a direct measurement method does not exist, an indirect measurement method could be used in the initial investigation of a physiological variable. Sometimes researchers use both direct and indirect measurement methods to expand the understanding of a physiological variable. For example, Dubbert, White, Grothe, O’Jile, and Kirchner (2006) studied the physical activity of patients who are severely mentally ill. These researchers measured the variable physical activity with indirect and direct measurement methods that are described in the following excerpt.
 SELF-REPORTED PHYSICAL ACTIVITY [INDIRECT MEASURE]
The 42-item Community Health Activities Model Program for Seniors (CHAMPS) … was used to assess frequency and duration of a variety of physical activities for the previous 4 weeks. The CHAMPS yields estimates of kilocalorie (kcal) energy expenditure per unit time and physical activity frequency. In nonclinical samples, CHAMPS scores have test-retest reliability intraclass correlations (ICCS) R = 0.76 for moderate and R = 0.66 for total estimated kcal expenditure over 6 months and validity correlations in the R = 0.20 to 0.30 range with performance on a 6-minute walk test….
OBJECTIVELY MEASURED PHYSICAL ACTIVITY [DIRECT MEASUREMENT]
Participants wore RT3 (Stayhealthy, Inc., Monrovia, CA) accelerometers to obtain objective estimates of daily physical activity. The RT3 instrument, about the size of a pager, measures acceleration of movement along three axes, which was averaged into a composite score (i.e., vector movement [VM], representing the overall magnitude of activity for each minute. RT3 software transformed VM into an estimate of energy expenditure (i.e., kcal per day and per hour), using participant’s height, weight, age, and gender. (Dubbert et al., 2006, p. 206)
Obtaining Physiological Measures from Laboratory Tests
Laboratory tests are usually very precise and accurate and provide direct measures of many physiological variables. Biochemical measures such as the activated partial thromboplastin time must be obtained through invasive procedures. Sometimes these invasive procedures are part of routine patient care, and the researcher can obtain the results from the patient’s record. Although nurses are now performing some biochemical measures in the nursing unit, these measures often require laboratory analysis. When invasive procedures are not part of routine care but are instead performed specifically for a study, great care must be taken to protect the subjects and to follow guidelines for informed consent and institutional approval. The patient (or his or her insurer) cannot be billed for invasive procedures that are not part of routine care; thus, the researcher must seek external funding or the institution in which the patient is receiving care must agree to forego billing for the procedure.
The researcher must also carefully consider the accuracy and precision of laboratory measures and the method of collecting specimens. Kreman et al. (2006) examined the effects of motivational interviewing on selected physiological outcomes in hyperlipidemic persons. One of the physiological outcomes was a lipid profile laboratory test that was collected before and after the motivational treatment. The following excerpt describes the measurement of the subjects’ lipid levels.
A fasting lipid profile included total cholesterol, LDL-C [low-density-lipoprotein cholesterol], and HDL-C [high-density-lipoprotein cholesterol], which were drawn at baseline and at 3 months to examine changes over time. Participants were instructed to fast for 12 hours and avoid alcohol consumption for 24 hours prior to having their blood drawn. Samples were drawn in the participants’ homes, spun down on-site, and transported to a certified clinical laboratory within 4 hours. (Kreman et al., 2006, p. 168)
These researchers picked an accurate and precise way to assess the lipid status of their subjects by measuring their total cholesterol, LDL-C, and HDL-C. By educating the subjects about fasting, controlling the collection of the blood samples, and ensuring the blood was analyzed in a certified lab, the researchers strengthened the precision and accuracy of their laboratory tests that directly measured patients’ lipid statuses.
Obtaining Physiological Measures through Electronic Monitoring
The availability of electronic monitoring equipment has greatly increased the possibilities of physiological measurement in nursing studies, particularly in critical care environments. Understanding the processes of electronic monitoring can make the procedure less formidable to those critically appraising published studies and those considering using the method for measurement.
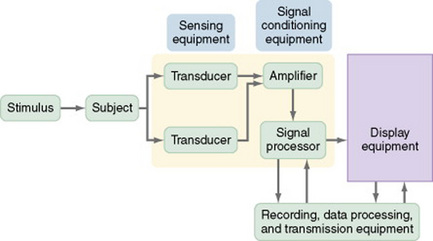
To use electronic monitoring, usually you will place sensors on or within your subject. The sensors measure changes in body functions such as electrical energy. Many sensors need an external stimulus to trigger the measurement process. Transducers convert the electrical signal to numerical data. Electrical signals often include interference signals as well as the desired signal, so you may choose to use an amplifier to decrease interference and amplify the desired signal. The electrical signal is then digitized (converted to numerical digits or values) and stored on magnetic tape. In addition, it is immediately displayed on a monitor. The display equipment may be visual or auditory, or both. A writing recorder provides a printed version of the data. One type of display equipment is an oscilloscope that displays the data as a waveform, and it may provide information such as time, phase, voltage, or frequency of the data. Some electronic equipment simultaneously records multiple physiological measures that are displayed on a monitor. The equipment is often linked to a computer, which allows the researcher to review the data, and the computer often contains complex software for detailed analysis of the data and will provide a printed report of the analysis (DeKeyser & Pugh, 1991; Pugh & DeKeyser, 1995). Figure 16-1 illustrates the process of electronic measurement.
The advantages of using electronic monitoring equipment are the collection of accurate and precise data, recording of data accurately within a computerized system, potential for collection of large amounts of data frequently over time, and the transmission of data electronically for analysis. One disadvantage of using sensors to measure physiological variables is that the presence of a transducer within the body can alter the reading. For example, the presence of a flow transducer in a blood vessel can partially block the vessel and thus alter blood flow. The reading, then, is not an accurate reflection of the flow.
Paratz and Lipman (2006) examined the effects of manual hyperinflation (MHI) on the hemodynamics and plasma catecholamines of ventilated patients. Electronic sensors were used to measure many of the variables in this study, and the measurement of the diastolic pressure, mean arterial pressure (MAP), pulmonary artery occlusion pressure (PAOP), and cardiac output (CO) are described in the following excerpt.
Paratz and Lipman (2006) provided a detailed description of the electronic monitoring equipment they used to measure their study variables. They also detailed when the measurements of variables were obtained, the recording of data, and the preparation of the data for analysis, which were done electronically to reduce the potential for error and increase the accuracy of the data.
Creative Development of Physiological Measures
Some studies require imaginative approaches to measuring phenomena that are traditionally observed in clinical practice but are not measured. The first step in this process is to recognize that the phenomenon being observed by the nurse can be measured. Once that idea has emerged, one can begin envisioning various means of measuring the phenomenon.
Ro et al. (2002) selected a creative treatment and a creative physiological approach to measuring its effect. They describe their study as follows.
As new physiological measurements are developed, they must be compared with previous methods to determine the best strategy for measuring each physiological outcome based on the patient’s condition. Schallom, Sona, McSweeney, and Mazuski (2007) conducted a study to compare forehead and digit oximetry in surgical/trauma patients who were at risk for decreased peripheral perfusion. Previous research had shown that the measurement of pulse oximetry was often impaired in critically ill patients and that the forehead reflectance oximetry may be less susceptible to poor tissue perfusion and might improve the accuracy of oxygen saturation measurement. The following excerpt describes the measurement of oxygen saturation using both the forehead and digit oximetry devices. Figure 16-2 shows the Nellcor N-595 oximeter and Max-Fast forehead sensor.
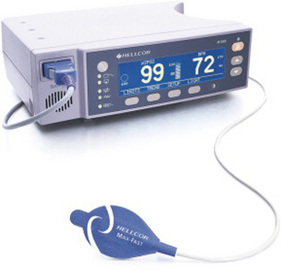
These researchers detailed the devices they used to obtain the oxygen saturation values and the placement of these devices to prevent error in the measurement process. They provided a picture of the devices and how to apply them to a patient and described the precision and accuracy of the devices in the narrative of the research article. Schallom et al. (2007, p. 188) found that “there were fewer unsuccessful measurements with the forehead oximetry technique.” Thus, they concluded that the “forehead sensors improve measurement of oxygen saturation in critically ill surgical/trauma patients.”
Obtaining Physiological Measures across Time
Many nursing studies using physiological measurement methods focus on a single point in time. Thus, there is insufficient information on normal variations in physiological measures across time, and much less information on changes in physiological measures across time in individuals with abnormal physiological states. In some cases, physiological states demonstrate cyclic activity and are associated with circadian rhythms and day-night patterns. When a clinician observes variation in a physiological value, it is important to know whether the variation is within the normal range or signals a change in the patient’s condition. Thus, additional studies need to be conducted to describe patterns of physiological function over time.
Faulkner, Hathaway, and Tolley (2003, p. 10) studied the effects of age, sex, race, body mass index, and Tanner’s stage on short-term evoked cardiovascular autonomic tests (i.e., Valsalva ratio and change in heart rate with deep breathing) and 24-hour heart rate variability (HRV) in a sample of healthy adolescents. The researchers also identified normative indices of both short-term evoked and 24-hour HRV in this age group. The following excerpt identifies the measurement of the cardiovascular autonomic function and HRV over 24 hours.
Selecting a Physiological Measure
Researchers designing a physiological study have less assistance in selecting methods of measurement than do those conducting studies using psychosocial variables. Multiple books and electronic sources are available that discuss various methods for measuring psychosocial variables. In addition, numerous articles in nursing journals describe the development of psychosocial variables or discuss various means of measuring a particular psychosocial variable. However, literature guiding the selection of physiological variables is less available. You might consider the following factors when selecting a physiological measure for a study:
1. What physiological variables are relevant to the study?
2. Do the variables need to be measured continuously or at a particular point in time?
3. Are repeated measures needed?
4. Do certain characteristics of the population under study place limits on the measurement approaches that can be used?
5. How has the variable been measured in previous research?
6. Is more than one measurement method available to measure the physiological variable being studied?
7. Which measurement method is the most accurate and precise for the population you are studying?
8. Could the study be designed to include more than one measurement method for the variable being studied?
9. Where can the measurement device(s) be obtained to measure the physiological variable being studied?
10. Can the measurement device be obtained from the manufacturer for use in the study, or must it be purchased?
It is more difficult to identify previous research on physiological measures than it is to find research on psychosocial measures. The sources most commonly used to identify physiological measurement methods are previous studies that have measured a particular physiological variable. Literature reviews or meta-analyses can provide reference lists of relevant studies. Because the measure might have been used in studies unrelated to the current research topic, it is usually important to examine the research literature broadly.
Physiological measures must be linked conceptually with the framework of the study. The logic of operationalizing the concept in a particular way must be well thought out and expressed clearly. It is often a good idea to use diverse physiological measures of a single concept, which reduces the impact of extraneous variables that might affect measurement. The operationalization of a physiological variable in a study should clearly indicate the physiological measure to be used. The link of the physiological variable to the concept in the framework must be made explicit in the published report of your study.
You also must evaluate the accuracy and precision of physiological measures. Until recently, researchers commonly used information from the equipment manufacturer to describe the accuracy of measurement. This information is useful but not sufficient to evaluate accuracy and precision. The accuracy and precision of physiological measures are discussed in Chapter 15.
One field of research in which considerable effort has been put forth to develop and evaluate measures is wound healing. Identifying valid and reliable measurement methods is important for comparing the effectiveness of various methods of treating a wound. Measurement strategies that have been applied include tracing the outline of the wound, inspecting the wound with a hand-held scanner, using electronic cameras, employing a structured light-scanning device, and applying a computer vision method based on image processing. Other strategies involve measuring wound volume by filling it with various substances such as normal saline, plaster of Paris, or a high-viscosity vinyl polysiloxane (Gentzkow, 1995; Harding, 1995). Thomas (1997) developed a model for the perfect wound-healing instrument and evaluated existing tools in terms of the model. A number of studies have been conducted to compare the accuracy and precision of these measures (Etris, Pribble, & LaBrecque, 1994; Hansen, Sparrow, Kokate, Leland, & Iaizzo, 1997; Liskay, Mion, & Davis, 1993; Melhuish, Plassman, & Harding, 1994). Researchers have not yet reached a consensus on the most desirable method of measurement, and methodological studies in this area continue.
You will need to consider problems you might encounter when using various approaches to physiological measurement. One factor of concern is the sensitivity of the measure. Will the measure detect differences finely enough to avoid a type II error? Physiological measures are usually norm referenced. Thus, data obtained from a subject will be compared with a norm, as well as with other subjects. You will need to determine whether the norm used for comparison is relevant for the population you are studying. For example, Schallom et al. (2007) compared the effectiveness of the digit versus the forehead oximetry in accurately measuring oxygen saturation in surgical/trauma patients. These patients had decreased peripheral perfusion; thus, their oxygen saturation was best measured by the forehead versus the digit oximetry. How labile is the measure? Some measures vary within the individual from time to time, even when conditions are similar. Circadian rhythms, activities, emotions, dietary intake, or posture can also affect physiological measures, as indicated by Faulkner et al. (2003). To what extent will these factors affect the ability to interpret measurement outcomes?
Many measurement strategies require the use of specialized equipment. In many cases, the equipment is available in the patient care area and is part of routine patient care in that unit. Otherwise, the researcher may need to purchase, rent, or borrow the equipment specifically for the study. You will need to be skilled in operating the equipment or obtain the assistance of someone who has these skills. Make sure that the equipment is operated in an optimal fashion and is used in a consistent manner. Sometimes equipment must be recalibrated, or reset, regularly to ensure consistent readings. For example, weight scales are recalibrated periodically to ensure that the weight indicated is accurate and precise. According to federal guidelines, recalibration must be performed as follows:
• In accordance with the manufacturers’ instructions
• In accordance with criteria set up by the laboratory
• After major preventive maintenance or replacement of a critical part
When publishing the results of a physiological study, you must describe the measurement technique in considerable detail to allow an adequate critical appraisal of your study, enable others to replicate your study, and promote clinical application of the results. At present, few replications of physiological studies have been reported in the nursing literature. A detailed description of physiological measures in a research report includes (1) a description of the equipment or device used in performing the measurement, (2) the name of the equipment manufacturer, (3) an account of the accuracy and precision of the equipment or device based on previous research and the manufacturer, (4) an explanation of the exact procedure followed to measure the physiological variable, and (5) an overview of the process the device used to record, retrieve, and store data. The examples discussed in this section can be used as models for describing the methods for obtaining and precisely implementing physiological measures in research to obtain accurate measures of physiological variables.
OBSERVATIONAL MEASUREMENT
Observational measurement is the use of unstructured and structured inspection to gauge a study variable. This section focuses on structured observational measurement, and unstructured measurement is described in Chapter 23. Although measurement by observation is most common in qualitative research, it is used to some extent in all types of studies (Marshall & Rossman, 2006). First you must decide what you want to observe, and then determine how to ensure that every variable is observed in a similar manner in each instance. Therefore, much attention must be given to training data collectors, especially when the observations are complex and examined over time. You must create opportunities for the observational technique to be pilot-tested and to generate data on interrater reliability. Observational measurement tends to be more subjective than other types of measurement and is thus often seen as less credible. However, in many cases, observation is the only possible way to obtain important evidence for practice.
Structured Observations
The first step in a structured observation is to define carefully what is to be inspected or observed in a study. From that point, you will direct your concern toward how the observations are to be made, recorded, and coded. In most cases, you and your research team will develop a category system for organizing and sorting the behaviors or events being observed. The extent to which these categories are exhaustive varies with the study.
Category Systems
The observational categories should be mutually exclusive. If the categories overlap, the observer will be faced with making judgments regarding what category should contain each observed behavior, and data collection may not be consistent. In some category systems, only the behavior that is of interest is recorded. Most category systems require the observer to make some inference from the observed event to the category. The greater the degree of inference required, the more difficult the category system is to use. Some systems are applicable in a wide variety of studies, whereas others are specific to the study for which they were designed. The number of categories used varies considerably with the study. An optimal number for ease of use and therefore effectiveness of observation is 15 to 20 categories.
Checklists
Checklists are techniques used to establish whether a behavior occurred. The observer places a tally mark on a data collection form each time he or she witnesses the behavior. Behavior other than that on the checklist is ignored. In some studies, the observer may place multiple tally marks in various categories while witnessing a particular event. However, in other studies, the observer is required to select a single category in which to place the tally mark. Minnick, Mion, Johnson, Catrambone, and Leipzig (2007) used a checklist to structure their observations of the prevalence and variation of physical restraint use in acute care settings. They provided a detailed description of their measurement process that included extensive training of data collectors and checks for interrater reliability, which was extremely high (>98%) in this study.
Rating Scales
Rating scales, which we will discuss later in this chapter, can be used for observation as well as for self-reporting. A rating scale allows the observer to rate the behavior or event on a scale. This method provides more information for analysis than does the use of dichotomous data, which indicate only that the behavior either occurred or did not occur.
Drankiewicz and Dundes (2003) used observational methods in their study of handwashing among female college students, which is described in the following section.
Interviews
Interviews involve verbal communication during which the subject provides information to the researcher. Although this measurement strategy is most common in qualitative and descriptive studies, it can be used in other types of studies as well. There are various approaches to conducting an interview. They range from the totally unstructured interview in which the subject completely controls content (see Chapter 23) to interviews in which the subject responds to a questionnaire that the researcher has carefully designed. Although most interviews are conducted face to face, telephone interviews are becoming more common (Burnard, 1994). Chapple (1997) pointed out that most interviews in nursing studies have concerned those in relatively powerless positions in society. To successfully interview persons in positions of power, you may have to vary the approach.
Using the interview method for measurement requires careful, detailed work, and it has almost become a science in itself. Excellent books are available on the techniques of developing interview questions (Briggs, 1986; Converse & Presser, 1986; Dillman, 1978; Dillon, 1990; Fowler, 1990; Gorden, 1987; McCracken, 1988; McLaughlin, 1990; Mishler, 1986; Schuman, 1981). If you plan to use this strategy, consult a text on interview methodology before designing your instrument. Because nurses frequently use interview techniques in nursing assessment, the dynamics of interviewing are familiar; however, using this technique for measurement in research requires greater sophistication.
Structured Interviews
Structured interviews are verbal interactions with subjects that allow the researcher to exercise increasing amounts of control over the content of the interview to obtain essential data for a study. The researcher designs the questions before data collection begins, and the order of the questions is specified. In some cases, the interviewer is allowed to further explain the meaning of the question or modify the way in which the question is asked so that the subject can better understand it. In more structured interviews, the interviewer is required to ask the question precisely as it has been designed. If the subject does not understand the question, the interviewer can only repeat it. The subject may be limited to a range of responses previously developed by the researcher, similar to those in a questionnaire. If the possible responses are lengthy or complex, they may be printed on a card so that the subject can review them before selecting a response.
Designing Interview Questions
The process for developing and sequencing interview questions is similar to the process used to design questionnaires and will be explained in the section on questionnaires. Briefly, questions progress from broad and general to narrow and specific. Questions are grouped by topic, with fairly “safe” topics being addressed first and sensitive topics reserved until late in the interview process. Less interesting data such as age, educational level, income, and other demographic information are usually collected last. These data should not be collected during an interview if they can be obtained from another source such as a patient record. The wording of questions in an interview will depend on the educational level of the subjects. Different subjects may interpret the wording of certain questions in a variety of ways, and the researcher must anticipate this possibility. After the interview protocol has been developed, seek feedback from an expert on interview technique and also from a content expert.
Pretesting the Interview Protocol
Once you and your research team have satisfactorily developed the protocol, you will need to pretest or pilot-test it on subjects similar to those who will be included in your study. This pretest will allow you to identify problems in the design of questions, sequencing of questions, or procedure for recording responses. It also will give you a chance to assess the reliability and validity of the interview instrument.
Training Interviewers
Skilled interviewing requires practice, and interviewers must be familiar with the content of the interview. They must anticipate situations that might occur during the interview and develop strategies for dealing with them. One of the most effective methods of developing a polished approach is role-playing. Playing the role of the subject can give the interviewer insight into the experience and thus facilitate an effective response to unscripted situations.
The interviewer must establish a permissive atmosphere in which the subject is encouraged to respond to sensitive topics. He or she must also develop an unbiased verbal and nonverbal manner. The wording of a question, the tone of voice, a raised eyebrow, or a shifting body position can all communicate a positive or negative reaction to the subject’s responses—either of which can alter the data.
Preparing for an Interview
If you are serving as the interviewer and expect the meeting to be lengthy, you will need to make an appointment. Make sure that you are nicely dressed but not overdressed, and be prompt. Choose a site for the interview that is quiet, private, and provides a pleasant environment. Before the appointment, carefully plan the instructions you will give to the subject. For example, you might say, “I am going to ask you a series of questions about … Before you answer each question you need to … Select your answer from the following …, and then you may elaborate on your response. I will record your answer and then, if it is not clear, I may ask you to explain some aspect further.”
Probing
Interviewers use probing to obtain more information in a specific area of the interview. In some cases, you may have to repeat a question. If your subject answers, “I don’t know,” you may have to press for a response. In other situations, you may have to explain the question further or ask the subject to explain statements that she or he has made. At a deeper level, you may pick up on a comment the subject made and begin asking questions to better understand what the subject meant. Probes should be neutral to avoid biasing the subject’s responses. Probing needs to be done within reasonable guidelines so that the subject does not feel that he or she is being cross-examined.
Recording Interview Data
Data obtained from interviews are recorded, either during the interview or immediately afterward. The recording may be in the form of handwritten notes, DVD recordings, or audiotape recordings. If you hand-record your notes, you must have the skill to identify key ideas (or capture essential data) in an interview and concisely record this information. Data must be recorded without distracting the interviewee. Some interviewees have difficulty responding if it is obvious that the interviewer is taking notes or taping the conversation. In such a case, the interviewer may need to record data after completing the interview. If you would prefer to tape-record the interview, you must first obtain the subject’s permission, and plan to prepare verbatim transcriptions of the tapes before data analysis. In some studies, researchers use content analysis to capture the meaning within the data (see Chapter 23).
Advantages and Disadvantages of Interviews
Interviewing is a flexible technique that can allow the researcher to explore greater depth of meaning than she or he can obtain with other techniques. Use your interpersonal skills to encourage your subject’s cooperation and elicit more information. The response rate to interviews is higher than that to questionnaires, and thus interviews can offer a more representative sample. Interviews allow researchers to collect data from subjects who are unable or unlikely to complete questionnaires, such as the very ill or those whose reading, writing, and ability to express themselves are marginal.
Interviews are a form of self-report, and the researcher must assume that the information provided is accurate. Interviewing requires much more time than needed for questionnaires and scales and is thus more costly. Because of time and cost, sample size is usually limited. Subject bias is always a threat to the validity of the findings, as is inconsistency in data collection from one subject to another.
Dzurec and Coleman (1995) used hermeneutics to study the experience of interviewing from the perspective of the interviewer. They found that an unspoken power gradient was present during an interview that made the process difficult for the interviewer. The insight gained from the interview process and from relating to the interviewee as a person made the process seem worthwhile. As respondents indicated, “You find out stuff you never even thought to ask” (Dzurec & Coleman, 1995, p. 245). Recommendations emerging from the study included the following:
Interviewing children requires a special understanding of the art of asking children questions. The interviewer must use words that children tend to use to define situations and events. He or she also must be familiar with the language skills that exist at varying stages of development. Children view topics differently than adults do. Their perception of time, past and present, is also different. Holaday and Turner-Henson (1989) provided detailed suggestions for developing an interview guide or questionnaire appropriate for children.
Some researchers use a combination of open-ended or unstructured interview questions and structured interview questions to gather the data needed for a study. For example, Harralson (2007, p. 96) used quantitative and qualitative methods to examine the “factors associated with delay in seeking emergency medical attention for acute ischemic symptoms in a sample of predominantly African American women.” Harralson interviewed female patients who presented with symptoms of acute myocardial infarction (AMI) in a large, urban teaching hospital in the United States. The following excerpt describes the interview process used in this study.
The study used a structured interview to explore the variables of interest. The 45-minute interview included questions pertaining to sociodemographics, social support, general physical health, medical comorbidities, perceived and practical barriers to seeking health care, and CHD [coronary heart disease] symptoms and severity. Open-ended questions addressed the patients’ experiences from symptom onset until a decision was made to seek medical attention. Open-ended questions included questions about patients’ physical and emotional feelings during the experience, decision-making processes (i.e., who they told and who they sought advice from), and beliefs about what was happening to them at the onset of the symptoms of AMI.
The structured interview was developed specifically for this study on the basis of a systematic review of the literature that examined concepts and factors associated with delay in seeking medical treatment. In addition, several nurses, cardiologists, and social scientists reviewed the interview.
To reduce recall bias in this study, interviews were conducted within 5 days of the acute ischemic event. This recall time frame is similar to time periods used in other studies reviewed in the background section. (Harralson, 2007, p. 98)
QUESTIONNAIRES
A questionnaire is a printed self-report form designed to elicit information that can be obtained from a subject’s written responses. The information derived through questionnaires is similar to that obtained by interview, but the questions tend to have less depth. The subject is unable to elaborate on responses or ask for questions to be clarified, and the data collector cannot use probe strategies. However, questions are presented in a consistent manner, and there is less opportunity for bias than in an interview.
Questionnaires can be designed to determine facts about the subject or persons known by the subject; facts about events or situations known by the subject; or beliefs, attitudes, opinions, levels of knowledge, or intentions of the subject. Questionnaires can be distributed to large samples directly or indirectly through e-mail or mail. The design, development, and administration of questionnaires have been the topics of many excellent books that focus on survey techniques (Berdie, Anderson, & Niebuhr, 1986; Converse & Presser, 1986; Fox & Tracy, 1986; Sudman & Bradburn, 1982). Two nursing methodology texts (Shelley, 1984; Waltz, Strickland, & Lenz, 1991) provide detailed explanations of the questionnaire development procedure.
Although questions on a questionnaire appear easy to design, a well-designed item requires considerable effort. Like interviews, questionnaires can have varying degrees of structure. Some questionnaires ask open-ended questions that require written responses. Others ask closed-ended questions with options that the researcher has selected.
Data from open-ended questions are often difficult to interpret, and content analysis may be used to extract meaning. Open-ended questionnaire items are not advised if your data are being obtained from large samples. Researchers are now using computers to gather questionnaire data (Saris, 1991). Computers are set up at the data collection site, the questionnaire is presented on screen, and subjects respond by using the keyboard or mouse. Data are stored in a computer file and are immediately available for analysis. Data entry errors are greatly reduced. Questionnaires can also be e-mailed to subjects, or subjects can be directed to a website where they can complete the questionnaire online, allowing the data to be stored and analyzed immediately. Thus, researchers can keep track of the number of subjects completing their questionnaire and the evolving results.
Development of Questionnaires
The first step in either selecting or developing a questionnaire is to identify the information desired. For this purpose, you and your research team would develop a blueprint or table of specifications. The blueprint identifies the essential content to be covered by the questionnaire, and the content must be at the educational level of the potential subjects. It is difficult to stick to the blueprint when designing the questionnaire because it is tempting to add “just one more question” that seems a “neat idea” or a question that someone insists “really should be included.” As a questionnaire lengthens, however, fewer subjects are willing to respond and more questions are left blank.
The second step is to search the literature for questionnaires or items in questionnaires that match the blueprint criteria. Sometimes published studies include questionnaires, but frequently you must contact the authors of a study to receive a copy of their questionnaire. Unlike scaling instruments, questionnaires are seldom copyrighted. Researchers are encouraged to use questions in exactly the same form as those in previous studies to enhance the accuracy when results of the two studies are compared. However, questions that are poorly written need to be modified, even if rewriting makes it more difficult to directly compare results.
In some cases, you may find a questionnaire in the literature that matches the questionnaire blueprint that you have developed for your study. However, you may have to add items to or delete items from an existing questionnaire to accommodate your blueprint. In some situations, items from several questionnaires are combined to develop an appropriate questionnaire.
An item on a questionnaire has two parts: a lead-in question (or stem) and a response set. Each lead-in question must be carefully designed and clearly expressed. Problems include ambiguous or vague language, leading questions that influence the response, questions that assume a preexisting state of affairs, and double questions.
In some cases, respondents will interpret terms used in the lead-in question in one way when the researcher intended a different meaning. For example, the researcher might ask how heavy the traffic is in the neighborhood in which the family lives. The researcher might be asking about automobile traffic, but the respondent interprets the question in relation to drug traffic. The researcher might define neighborhood as a region composed of a three-block area, whereas the respondent considers a neighborhood to be a much larger area. Family could be defined as those living in one house or as all close blood relations (Converse & Presser, 1986). If a question includes a term that is unfamiliar to the respondent or for which several meanings are possible, the term must be defined.
Leading questions suggest the answer the researcher desires. These types of questions often include value-laden words and indicate the researcher’s bias. For example, a researcher might ask, “Do you believe physicians should be coddled on the nursing unit?” or “All hospitals are bad places to work, aren’t they?” These examples are extreme, and leading questions are usually constructed more subtly. The degree of formality with which the question is expressed and the permissive tone of the questions are, in many cases, important for obtaining a true measure. A permissive tone suggests that any of the possible responses will be acceptable.
Questions implying a preexisting state of affairs lead the respondent to admit to a previous behavior regardless of how she or he answers. Examples are “How long has it been since you used drugs?” or, to an adolescent, “Do you use a condom when you have sex?”
Double questions ask for more than one bit of information, for example, “Do you like critical care nursing and working closely with physicians?” It would be possible for the respondent to like working in critical care settings but dislike working closely with physicians. In this case, the question would be impossible to answer accurately. A similar question is, “Was the in-service program educational and interesting?”
Questions with double negatives are also difficult to answer. For example, one might ask, “Do you believe nurses should not question doctors’ orders? Yes or No.” In this case, it is difficult to determine the meaning of a yes or no. Thus, the subjects’ responses are uninterpretable.
Each item in a questionnaire has a response set that provides the parameters within which the respondent can answer. This response set can be open and flexible, as it is with open-ended questions, or it can be narrow and directive, as it is with closed-ended questions. For example, an open-ended question might have a response set of three blank lines. With closed-ended questions, the response set includes a specific list of alternatives from which to select.
Response sets can be constructed in a variety of ways. The cardinal rule is that every possible answer must have a response category. If the sample includes respondents who might not have an answer, then include a response category of “don’t know” or “uncertain.” If the information sought is factual, include “other” as one of the possible responses. However, recognize that the item “other” is essentially lost data. Even if the response is followed by a statement such as “Please explain,” it is rarely possible to analyze the data meaningfully. If a large number of subjects (greater than 10%) select the alternative “other,” the alternatives included in the response set might not be appropriate for the population studied.
The simplest response set is the dichotomous yes/no option. Arranging responses vertically preceded by a blank will reduce errors. For example,
because in the latter example, the respondent might not be sure whether to indicate yes by placing a response before or after the Yes.
Response sets must be mutually exclusive, which might not be the case in the following response set:
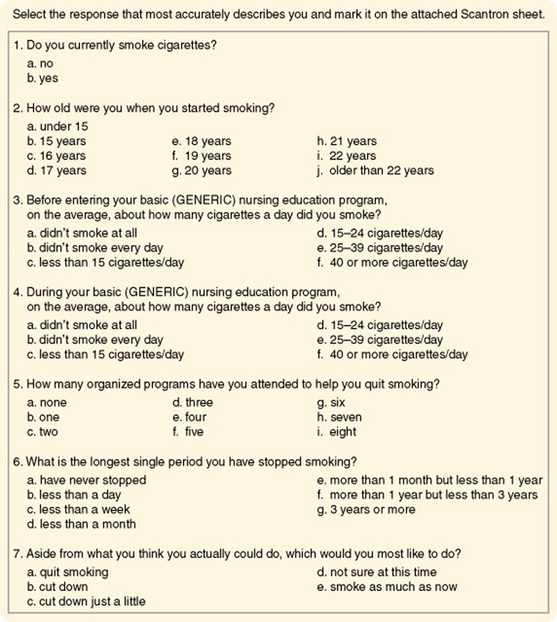
Burns (1986) used a questionnaire to examine smoking patterns of nurses in Texas. Items from that questionnaire, which demonstrates a variety of response sets, are presented in Figure 16-3. Each question should clearly instruct the subject how to respond (i.e., choose one, mark all that apply), or instructions should be included at the beginning of the questionnaire. The subject must know whether to circle, underline, or fill in a circle as he or she responds to items. Clear instructions are difficult to construct and usually require several attempts, and each pilot should be tested on naive subjects who are willing and able to express their reactions to the instructions.
After the questionnaire items have been developed, you will need to carefully plan how they will be ordered. Questions related to a specific topic must be grouped together. General items are included first, with progression to more specific items. More important items might be included first, with subsequent progression to items of lesser importance. Questions of a sensitive nature or those that might be threatening should appear last on the questionnaire. In some cases, the response to one item may influence the response to another. If so, their order must be carefully considered. Any open-ended questions should be presented last because their responses will require more time than needed for closed-ended questions. The general trend is to ask for demographic data about the subject at the end of the questionnaire.
Optical scanning sheets or teleforms may be used to speed up data entry on computer and decrease errors (see Chapter 17 about teleform development). As society becomes more digital, teleforms are becoming common. However, subjects who are not familiar with these sheets may make errors when entering their responses (thus decreasing measurement validity).
A cover letter explaining the purpose of the study, the name of the researcher, the approximate amount of time required to complete the form, and organizations or institutions supporting the study must accompany your questionnaire. Instructions include an address to which the questionnaire can be returned. This address must be at the end of the questionnaire, as well as on the cover letter and envelope. Respondents often discard both the envelope and the cover letter and, after completing the questionnaire, do not know where to send it. It is also wise to provide a stamped, addressed envelope for the subject to return the questionnaire. If possible, the best way to provide questionnaires to potential subjects is by e-mailing a web address for them to access the questionnaire. Subjects can easily complete the questionnaire in their own time, and their responses are automatically submitted at the end of the questionnaire. Sending questionnaires by e-mail have many advantages but one disadvantage is being able to access only individuals with e-mail. Thus, researchers need to determine if the population they are studying has e-mail access.
Your questionnaire must be pilot-tested to determine the clarity of questions, effectiveness of instructions, completeness of response sets, time required to complete the questionnaire, and success of data collection techniques. As with any pilot test, the subjects and techniques must be as similar as possible to those planned for the main study. In some cases, the open-ended questions are included in a pilot test to obtain information for the development of closed-ended response sets for the main study.
Questionnaire Validity
One of the greatest risks in developing response sets is leaving out an important alternative or response. For example, if the questionnaire item addressed the job position of nurses working in a hospital and the sample included nursing students, a category must be added to represent the student role. When seeking opinions, there is a risk of obtaining a response from an individual who actually has no opinion on the research topic. When an item requests knowledge that the respondent does not possess, the subject’s guessing interferes with obtaining a true measure of the study variables.
The response rate to questionnaires is generally lower than that with other forms of self-reporting, particularly if the questionnaires are mailed out. If the response rate is lower than 50%, the representativeness of the sample is seriously in question. The response rate for mailed questionnaires is usually small (25% to 30%), so researchers are frequently unable to obtain a representative sample, even with randomization. There does seem to be a stronger response rate for questionnaires that are sent by e-mail. Strategies that can increase the response rate for a mailed questionnaire are covered in Chapter 17.
Commonly, respondents fail to respond to all the questions. This problem, especially with long questionnaires, can threaten the validity of the instrument. In some cases, the respondent will write in an answer if she or he does not agree with the available choices, or the respondent may write comments in the margin. Generally, these responses cannot be included in the analysis; however, you should keep a record of such responses. Before distributing the questionnaires, determine which questions are critical to the research topic. If any of these questions is omitted in a questionnaire, do not include the results of that question in the analysis.
Consistency in the way the questionnaire is administered is important to validity. For example, administering some questionnaires in a group setting, mailing others, and e-mailing others is not wise. There should not be a mix of mailing or e-mailing to business addresses and to home addresses. If questionnaires are administered in person, the administration must be consistent. Several problems in consistency can occur: (1) Some subjects may ask to take the form home to complete it and return it later, whereas others will complete it in the presence of the data collector; (2) some subjects may complete the form themselves, whereas others may ask a family member to write the responses that the respondent dictates; and (3) in some cases, a secretary or colleague may complete the form, rather than the individual whose response you are seeking. These situations lead to biases in responses that are unknown to the researcher, and they alter the true measure of the variables.
Analysis of Questionnaire Data
Data from questionnaires are usually ordinal in nature, which limits analysis for the most part to summary statistics and nonparametric statistics. However, in some cases, ordinal data from questionnaires are treated as interval data, and t-tests or analyses of variance (ANOVA) are used to test for differences between responses of various subsets of the sample. Discriminant analysis may be used to determine the ability to predict membership in various groups from responses to particular questions.
SCALES
Scales, a form of self-report, are a more precise means of measuring phenomena than are questionnaires. The majority of scales have been developed to measure psychosocial variables. However, self-reports can be obtained on physiological variables such as pain, nausea, or functional capacity by using scaling techniques. Scaling is based on mathematical theory, and there is a branch of science whose primary concern is the development of measurement scales. From the point of view of scaling theory, considerable measurement error (random error) and systematic error are expected in a single item. Therefore, in most scales, the various items on the scale are summed to obtain a single score, and these scales are referred to as summated scales. Less random error and systematic error exist when using the total score of a scale. Using several items in a scale to measure a concept is comparable to using several instruments to measure a concept (see Figure 15-7 in Chapter 15). The various items in a scale increase the dimensions of the concept that are reflected in the instrument. The types of scales described include rating scales, the Likert scale, semantic differentials, and visual analogue scales.
Rating Scales
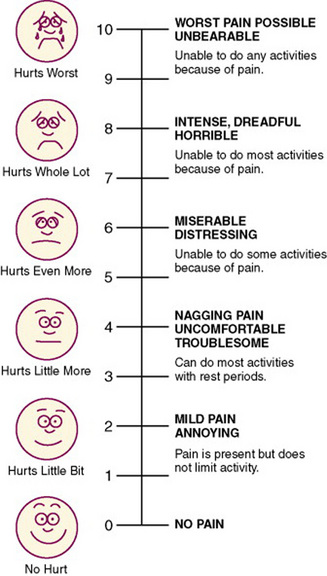
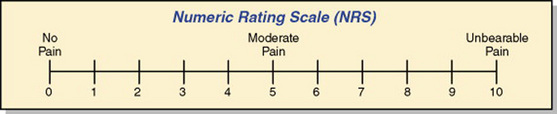
A rating scale, the crudest form of scaling technique, lists an ordered series of categories of a variable that are assumed to be based on an underlying continuum. A numerical value is assigned to each category, and the fineness of the distinctions between categories varies with the scale. The general public commonly uses rating scales. In conversations one can hear statements such as “On a scale of 1 to 10, I would rank that …” Rating scales are easy to develop; however, one must be careful to avoid end statements that are so extreme that no subject will select them. A rating scale could be used to rate the degree of cooperativeness of the patient or the value placed by the subject on nurse-patient interactions. This type of scale is often used in observational measurement to guide data collection. The Faces Pain Scale is a commonly used rating scale to assess the pain of children in clinical practice, and it has proven to be valid and reliable over the years (Figure 16-4). Pain in adults is often assessed with a numeric rating scale (NRS) like the one presented in Figure 16-5.
Likert Scale
The Likert scale determines the opinion or attitude of a subject and contains a number of declarative statements with a scale after each statement. The Likert scale is the most commonly used of the scaling techniques. The original version of the scale included five response categories. Each response category was assigned a value, with a value of 1 given to the most negative response and a value of 5 to the most positive response (Nunnally & Bernstein, 1994).
Response choices in a Likert scale most commonly address agreement, evaluation, or frequency. Agreement options may include statements such as strongly agree, agree, uncertain, disagree, and strongly disagree. Evaluation responses ask the respondent for an evaluative rating along a good/bad dimension, such as positive to negative or excellent to terrible. Frequency responses may include statements such as never, rarely, sometimes, frequently, and all the time. The terms used are versatile and must be selected for their appropriateness to the stem (Spector, 1992). Sometimes seven options are given, sometimes only four.
Use of the uncertain or neutral category is controversial because it allows the subject to avoid making a clear choice of positive or negative statements. Thus, sometimes only four or six options are offered, with the uncertain category omitted. This type of scale is referred to as a forced choice version. Sometimes respondents will become annoyed at forced choice items and refuse to complete them. Researchers who use the forced choice version consider an item that is left blank as a response of “uncertain.” However, responses of “uncertain” are difficult to interpret, and if a large number of respondents select that option or leave the question blank, the data may be of little value.
How the researcher phrases item stems depends on the type of judgment that the respondent is being asked to make. Agreement items are declarative statements such as “Nurses should be held accountable for managing a patient’s pain.” Frequency items can be behaviors, events, or circumstances to which the respondent can indicate how often they occur. A frequency stem might be “You read research articles in nursing journals.” An evaluation stem could be “The effectiveness of ‘X’ drug for relief of nausea after chemotherapy.” Items must be clear, concise, and concrete (Spector, 1992).
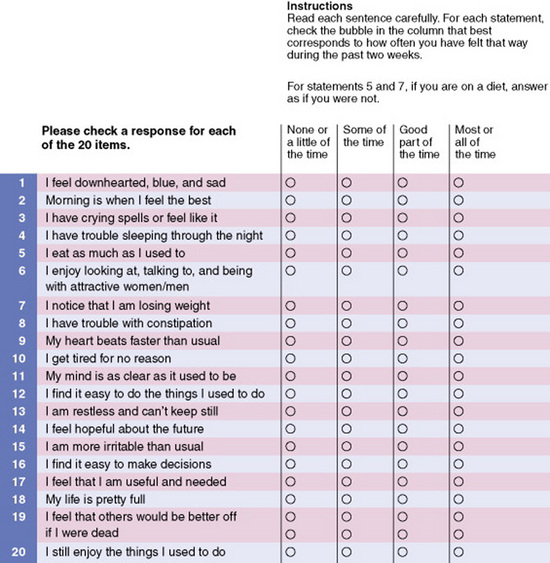
An instrument using a Likert scale usually consists of 10 to 20 items, each addressing an element of the concept being measured. Half the statements should be expressed positively and half negatively to avoid inserting bias into the responses. Scale values of negatively expressed items must be reversed before analysis. Usually, the values obtained from each item in the instrument are summed to obtain a single score for each subject. Although the values of each item are technically ordinal-level data, the summed score is often treated as interval-level data, thus allowing more sophisticated statistical analyses. Some researchers now treat each item as interval-level data. The Zung Depression Scale is a Likert scale used to assess the level of depression in patients in clinical practice (Figure 16-6). This scale has four response options, which include none or a little of the time = 1, some of the time = 2, good part of the time = 3, and most of the time = 4. The scores on the scale can range from 20 to 80 with the interpretation of the scores being: below 50, within normal range, no psychopathology; 50–59, presence of minimal to mild depression; 60–69, presence of moderate to marked depression; and 70 and over, presence of severe to extreme depression. This scale was developed in the 1960s and has extensive testing through research; it is frequently used in clinical practice as a screening tool for depression (Zung, 1965).
Flaskerud (1988) reported difficulty using the Likert scale with some cultural groups. Hispanic and Vietnamese subjects had difficulty understanding the request to select one of four or five possible responses and insisted on responding to each item with a simple yes or no. Additional explanation did not sway them from this position. The reason for this difficulty is not understood.
Semantic Differentials
The semantic differential scale was developed by Osgood, Suci, and Tannenbaum (1957) to measure attitudes or beliefs. It is now used more broadly to measure variations in views of a concept. A semantic differential scale consists of two opposite adjectives with a seven-point scale between them. The subject is to select one point on the scale that best describes his or her view of the concept being examined. The scale is designed to measure the connotative meaning of the concept to the subject. Although the adjectives may not seem to be particularly related to the concept being examined, the technique can be used to distinguish varying degrees of positive and negative attitudes toward a concept. Figure 16-7 illustrates the form used for this type of scale.
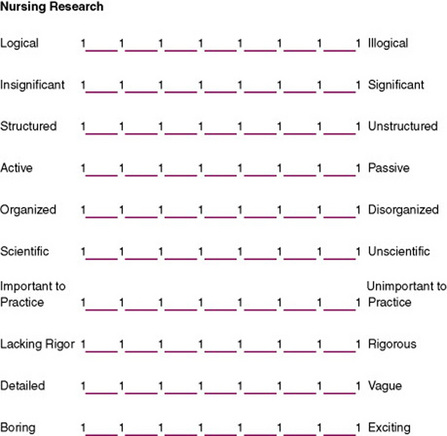
In a semantic differential scale, values from 1 to 7 are assigned to each of the spaces, with 1 being the most negative response and 7 the most positive. Placement of negative responses to the left or right of the scale should be randomly varied to avoid global responses (in which the subject places checks in the same column of each scale). Each line is considered one scale. The values for the scales are summed to obtain one score for each subject. Factor analysis is used to determine the factor structure, which is expected to reflect three factors or dimensions: evaluation, potency, and activity. The researcher must explain theoretically why particular items on the scale cluster together in the factor analysis. Thus, development of the instrument contributes to theory development. Factor analysis is also used to evaluate the validity of the instrument. With some of these instruments, three factor scores, each representing one of the dimensions, are used to describe the subject’s responses and are a basis for further analysis (Nunnally & Bernstein, 1994).
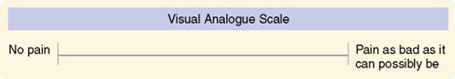
Visual Analogue Scales
One of the problems with scaling procedures is the difficulty of obtaining a fine discrimination of values. An effort to resolve this problem is the visual analogue scale, sometimes referred to as magnitude scaling (Gift, 1989). This technique seems to provide interval-level data, and some researchers argue that it provides ratio-level data (Sennott-Miller, Murdaugh, & Hinshaw, 1988). It is particularly useful in scaling stimuli (Lodge, 1981). This scaling technique has been used to measure pain, mood, anxiety, alertness, craving for cigarettes, quality of sleep, attitudes toward environmental conditions, functional abilities, and severity of clinical symptoms (Wewers & Lowe, 1990).
The stimuli must be defined in a way that the subject clearly understands. Only one major cue should appear for each scale. The scale is a line 100 mm in length with right-angle stops at each end. The line may be horizontal or vertical. Bipolar anchors are placed beyond each end of the line. The anchors should not be placed underneath or above the line before the stop. These end anchors should include the entire range of sensations possible in the phenomenon being measured. Examples include “all” and “none,” “best” and “worst,” and “no pain” and “pain as bad as it could possibly be.” These scales can be developed for children by using pictorial anchors at each end of the line rather than words (Lee & Kieckhefer, 1989).
The subject is asked to place a mark through the line to indicate the intensity of the stimulus. A ruler is then used to measure the distance between the left end of the line and the mark placed by the subject. This measure is the value of the stimulus. The scale is designed to be used while the subject is seated. Whether use of the scale from the supine position influences the results by altering perception of the length of the line has yet to be determined (Gift, 1989).
Wewers and Lowe (1990) have published an extensive evaluation of the reliability and validity of visual analogue scales, although reliability is difficult to determine. Because most of the variables measured with the tool are labile, test-retest consistency is not applicable, and because a single measure is obtained, internal consistency cannot be examined. The visual analogue scale is more sensitive to small changes than numerical and rating scales are and can discriminate between two dimensions of pain. Comparisons of the scale with other instruments measuring the same construct have had varying results and are difficult to interpret. An example of a visual analogue scale is shown in Figure 16-8.
Q-SORT METHODOLOGY
Q-sort methodology is a technique of comparative rating that preserves the subjective point of view of the individual (McKeown & Thomas, 1988). Cards are used to categorize the importance placed on various words or phrases in relation to the other words or phrases in the list. Each phrase is placed on a separate card. The number of cards should range from 40 to 100 (Tetting, 1988). The subject is instructed to sort the cards into a designated number of piles, usually 7 to 10 piles ranging from the most to the least important. However, the subject is limited in the number of cards that may be placed in each pile. If the subject must sort 59 cards, category 1 (of greatest importance) may allow only 2 cards; category 2, 5 cards; category 3, 10 cards; category 4, 25 cards; category 5, 10 cards; category 6, 5 cards; and category 7 (the least important), 2 cards. Thus, placement of the cards fits the pattern of a normal curve. The subject is usually advised to select first the cards that he or she wishes to place in the two extreme categories and then work toward the middle category (which contains the largest number of cards), rearranging cards until he or she is satisfied with the results.
The Q-sort method can also be used to determine the priority of items or the most important items to include in the development of a scale. In the previously mentioned example, the behaviors sorted into categories 1, 2, and 3 might be organized into a 17-item scale. Correlational or factor analysis is used to analyze the data (Dennis, 1986; Tetting, 1988). Simpson (1989) suggested using the Q-sort method for cross-cultural research, with pictures rather than words used for nonliterate groups.
The Q-sort technique is used in the Control Preferences Scale, a general measure of a unidimensional construct involving consumer preferences about participating in decisions regarding their treatment. The Control Preferences Scale is administered by having each subject sort a series of cards through successive paired comparisons (Degner, 1998). Luniewski, Riegle, and White (1999) used a Q-sort technique in their study of effective education for patients with heart failure. Patients were asked to sort 12 cards with questions related to the content of discharge teaching for patients with heart failure.
DELPHI TECHNIQUE
The Delphi technique measures the judgments of a group of experts for the purpose of making decisions, assessing priorities, or making forecasts. Using this technique allows a wide variety of experts to express opinions and provide feedback, nationally and internationally, without meeting together. When the Delphi technique is used, the opinions of individuals cannot be altered by the persuasive behavior of a few people at a meeting. Three types of Delphi techniques have been identified: classic Delphi, policy Delphi, and decision Delphi. In classic Delphi, the focus is on reaching consensus. In policy Delphi, the aim is not consensus but rather to identify and understand a variety of viewpoints. In decision Delphi, the panel consists of individuals in decision-making positions. The purpose is to come to a decision (Beretta, 1996; Crisp, Pelletier, Duffield, Adams, & Nagy, 1997). Some nursing specialty organizations have established their research priorities by using Delphi techniques (Rudy, 1996). Mitchell (1998) assessed the validity of the Delphi technique in nursing education planning and found that 98.1% of the predicted events had either occurred or were still expected to occur.
To implement the technique, the researcher identifies a panel of experts, but the criteria used to determine that a member of the panel is an expert are unclear. Members of the panel remain anonymous, even to each other. A questionnaire is developed that addresses the topics of concern. Although most questions call for closed-ended responses, the questionnaire usually contains opportunities for open-ended responses by the expert. Once they have completed the questionnaires, the respondents return them to the researcher, who then analyzes and summarizes the results. Methods used for this analysis are undefined. The role of the researcher is to maintain objectivity. The outcome of the statistical analysis is returned to the panel of experts, along with a second questionnaire. Respondents with extreme responses to the first round of questions may be asked to justify their responses. The respondents return the second round of questionnaires to the researcher for analysis. This procedure is repeated until the data reflect a consensus among the panel. Limiting the process to two or three rounds is not a good idea if consensus is the goal. In some studies, true consensus is reached, whereas in others, “majority rules.” Some question whether the agreement reached is genuine (Beretta, 1996; Crisp et al., 1997). Couper (1984) developed a model of the Delphi technique, which is presented in Figure 16-9.
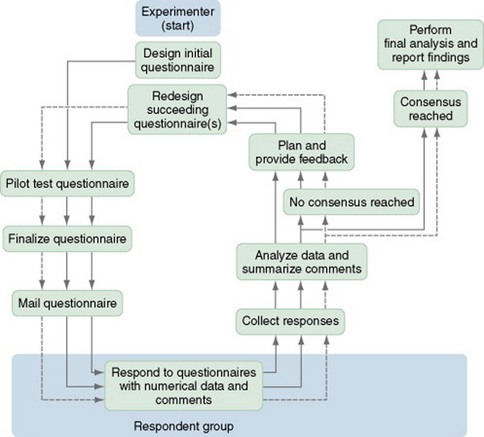
Figure 16-9 Delphi technique sequence model. Multiple arrows indicate repeated cycles of review by experts.
Goodman (1987) identified several potential problems that researchers could encounter when using the Delphi technique. There has been no documentation that the responses of “experts” are different from those one would receive from a random sample of subjects. Because the panelists are anonymous, they have no accountability for their responses. Respondents could make hasty, ill-considered judgments because they know that no negative feedback will result. Feedback on the consensus of the group tends to centralize opinion, and traditional analysis with the use of means and medians may mask the responses of those who are resistant to the consensus. Thus, conclusions could be misleading.
Lindeman (1975) conducted one of the initial studies to determine research priorities in clinical nursing using a Delphi survey. She used a panel of 433 experts, both nurses and non-nurses, with a wide range of interests. The panel was sent four rounds of a 150-item questionnaire. The report, published in Nursing Research, had an important influence on the research conducted in nursing for clinical practice.
PROJECTIVE TECHNIQUES
Projective techniques are based on the assumption that an individual’s responses to unstructured or ambiguous situations reflect the person’s attitudes, desires, personality characteristics, and motives. The technique is most frequently used in psychology and includes techniques such as the Rorschach Inkblot Test, Machover’s Draw-a-Person Test, word association, sentence completion, role-playing, and play techniques. The technique is an indirect measure of data that are unlikely to be obtained directly. Analysis of the data requires that inferences be made about the meaning and is therefore subjective. Many of the tests require extensive training for administration and interpretation and thus have not been used frequently in nursing research. However, with the increased frequency of interdisciplinary research, their use in nursing studies may increase. At present, the technique is used in nursing primarily in studying children (Waltz et al., 1991). Johnson (1990) provided an excellent explanation of the techniques used to interpret children’s drawings.
DIARIES
A diary is a recording of events over time by an individual to document experiences, feelings, or behavior patterns. Diaries have been used since the 1950s to collect data for research from a variety of populations including children, the acute and chronically ill, pregnant women, and the elderly (Aroian & Wal, 2007). A diary, which allows recording shortly after an event, is thought to be more accurate than obtaining the information through recall during an interview. In addition, the reporting level of incidents is higher, and one tends to capture the participant’s perception of situations (McColl, 2004).
The diary technique gives nurse researchers a means to obtain data on topics of particular interest within nursing that have not been accessible by other means. Some potential topics for diary collection include expenses related to a health care event (particularly out-of-pocket expenses), self-care activities (frequency and time required), symptoms of disease, eating behavior, exercise behavior, the child development process, and care provided by family members in a home-care situation. Although diaries have been used primarily with adults, they are also an effective means of collecting data from school-aged children. Butz and Alexander (1991) reported an 88% completion rate in a study of children with asthma, with most children (72.3%) keeping the diary without assistance from their parents.
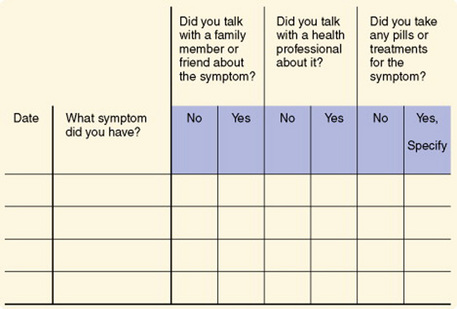
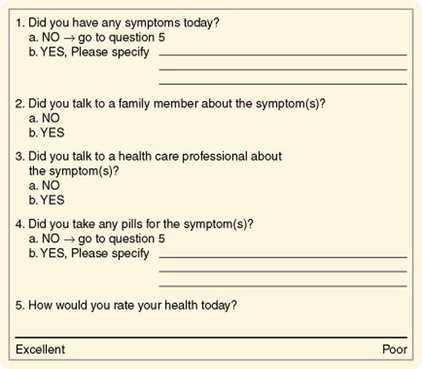
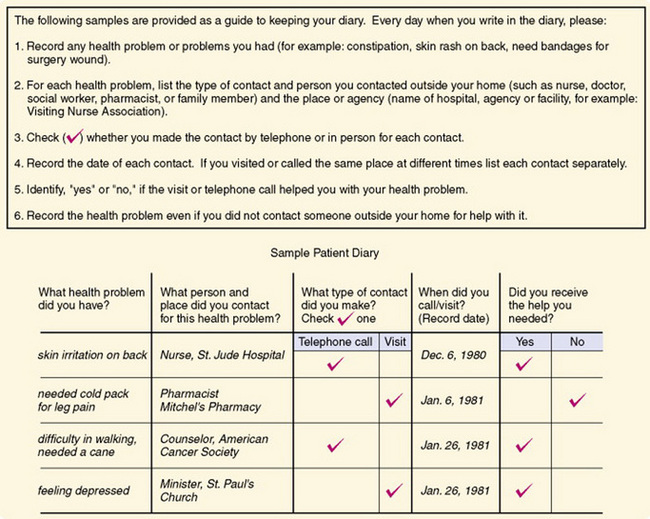
Health diaries have been used to document health problems, responses to symptoms, and efficacy of responses. Diaries may also be used to determine how people spend their days; this information could be particularly useful in managing the care needs of individuals with chronic illnesses. In experimental studies, diaries may be used to determine subjects’ responses to experimental treatments. Two types of health diaries are used: a ledger in which different types of events are recorded, such as the occurrence of a symptom, and a journal in which entries related to specific topics are made daily. Figure 16-10 shows an example of a ledger, and an example of a journal is shown in Figure 16-11. Figure 16-12 shows a sample patient diary. Validity and reliability have been examined by comparing the results with data obtained through interviews and have been found to be acceptable. Participation in studies using health diaries has been good, and attrition rates are reported as low. Adequate instructions related to recording data in the diary and arranging for pickup of the completed document are critical (Burman, 1995).
Burman (1995) made some recommendations regarding the general use of health diaries.
1. Critically analyze the phenomenon of interest to ensure that it can be adequately captured using a diary. Infrequent major events, very minor health events or behaviors, and vague symptoms are less likely to be reported than more frequent, definable acute problems. The use of a diary should be evaluated in light of other data collection approaches such as interviews and emailed or mailed surveys, which may lead to higher data quality depending on the specific phenomenon of interest.
2. Determine which format—ledger or journal—should be used to decrease participant burden while minimizing missing data. The ledger format may be less burdensome but evaluation of missing data is more complicated.
3. Evaluate whether closed- or open-ended questions will result in clearer reporting. Closed-ended questions reduce respondent burden, but may result in overreporting of symptoms.
4. Pilot test any new or refined diary with the target population of interest to identify possible problems, to ensure that the phenomenon can be recorded with this approach, and to evaluate the ability of participants to complete diaries. Participation rates in diary studies vary, although those with high incomes and education levels, and better writing skills may be overrepresented. However, diaries have been used successfully with ill and general-community populations.
5. Determine the diary period that is necessary to adequately record changes and fluctuations in the phenomenon of interest, balancing this with respondent burden. Typical diary periods are 2 to 4 weeks.
6. Provide clear instructions to all participants on the use of a diary before participation begins to enhance data quality. Participants need to know how to use the diaries, what types of events are to be reported, and how to contact the investigator or clinician with questions.
7. Use follow-up procedures during data collection to enhance completion rates. Telephone contacts enhance completion rates. Diaries may be mailed; however, returning diaries through the mail may result in somewhat lower completion rates.
8. Plan analysis procedures during diary development or refinement to be sure the data are in the appropriate form for the analyses. Diary data are very dense and rich, carefully prepared plans can minimize problems. (Burman, 1995, p. 151)
Problems related to the diary method include costs, subject cooperation, quality of the data, conditioning effects on the subject of keeping a diary, and the complexity of data analysis. Costs include interview time, mail and telephone expenses, and remuneration to subjects. Costs are higher than single face-to-face interviews but lower than repeated interviews. Costs are lowest when diaries are used with telephone interviews and highest when diaries are used with repeated face-to-face interviews. Costs are lower when diaries are mailed rather than picked up. Most subject noncooperation occurs in the first month, with only 1% to 2% subject loss after that point. Diary completion rates are higher (80% to 88%) than the completion rates of other data collection methods such as surveys. Picking up the diary increases the completion rate (Butz & Alexander, 1991).
The use of diaries, however, has some disadvantages. Keeping the diary may, in some cases, alter the behavior or events under study. For example, if a person were keeping a diary of the nursing care that he or she was providing to patients, the insight that the person gained from recording the information in the diary might lead to changes in care. Subjects can become more sensitive to items (such as symptoms or problems) reported in the diary, which could result in overreporting. Subjects may also become bored with keeping the diary and become less thorough in recording items, which could result in underreporting (Butz & Alexander, 1991).
Aroian and Wal (2007) investigated the use of a diary for collecting data on symptom experiences in community-dwelling elderly. They found the participants’ reporting of symptoms of chronic illness in the diary declined over the 7 days of the study and did not provide additional information that was not obtained from an interview. Arion and Wal (2007, p. 322) have recommended that researchers be very cautious in their selection of data collection methods for the elderly and that the diary might best be used to “focus on new symptoms or how symptoms unfold over time” rather than to record symptoms of chronic illnesses. Thus, there are strengths and weaknesses to the use of diaries in research, and investigators must determine what measurement method will provide the most valid and reliable information to address their study purpose.
SELECTION OF AN EXISTING INSTRUMENT
Selecting an instrument to measure the variables in a study is a critical process in research. The method of measurement must closely fit the conceptual definition of the variable. You may need to conduct an extensive search of the literature to identify appropriate methods of measurement. In many cases, you will find instruments that measure some of the needed elements but not all, or the content may be related to but somehow different from what you need for your study. Instruments found in the literature may have little or no documentation of their validity and reliability.
Beginning researchers often conclude that no appropriate method of measurement exists and that they therefore must develop a tool. At the time, this solution seems to be the most simple, because the researcher has a clear idea of what needs to be measured. You should not use this solution, however, unless all else fails. Tool development is a lengthy process and requires sophisticated research. Using a new instrument in a study without first evaluating its validity and reliability is unacceptable; it is a waste of subject and investigator time.
Thus, for novice researchers developing their first study, it is essential to identify existing instruments to measure your study variables. Jones (2004) developed a flowchart that might help you to select an existing instrument for your study (Figure 16-13). The major steps include (1) identifying an instrument from the literature, (2) determining if the instrument is appropriate for measuring your study variable, and (3) examining the performance of the instrument by evaluating its reliability and validity. These steps are detailed in the following sections.
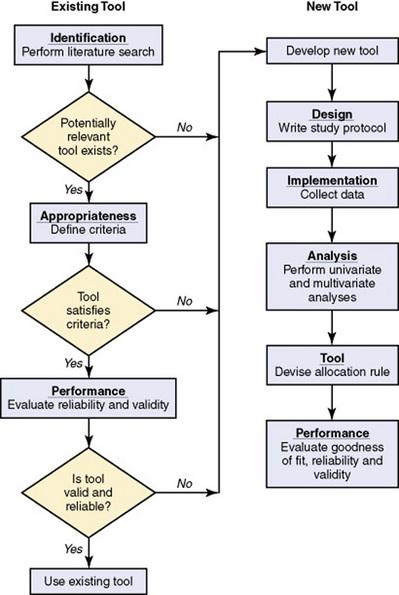
Figure 16-13 Flowchart depicting the identification and assessment of an existing tool and development of a new tool.
Locating Existing Instruments
Locating existing measurement methods has become easier in recent years. A relatively new computer database, the Health and Psychological Instruments Online (HAPI), is available in many libraries and can search for instruments that measure a particular concept or for information on a particular instrument. Sometimes a search on Medline or CINAHL might uncover an instrument that might be useful (Roberts & Stone, 2003).
Many reference books have compiled published measurement tools, some that are specific to instruments used in nursing research. Dissertations often contain measurement tools that have never been published, so a review of Dissertation Abstracts might be helpful. Dissertation Abstracts is now online.
Another important source of recently developed measurement tools is word-of-mouth communication among researchers. Information on tools is often presented at research conferences years before publication. There are often networks of researchers conducting studies on similar nursing phenomena. These researchers are frequently associated with a nursing organization and keep in touch through newsletters, correspondence, telephone, e-mail, computer bulletin boards, and web pages. Thus, questioning available nurse researchers can lead to a previously unknown tool. These researchers can often be reached by telephone, letter, or e-mail and are usually willing to share their tools in return for access to the data to facilitate work on developing validity and reliability information. The Sigma Theta Tau Directory of Nurse Researchers provides address and phone information on nurse researchers. In addition, it lists nurse researchers by category according to their area of research.
Evaluating Existing Instruments for Appropriateness and Performance
You may need to examine several instruments to find the one most appropriate for your study. When selecting an instrument for research, carefully consider how the instrument was developed, what the instrument measures, and how to administer it. Before you review existing instruments, be sure you have conceptually defined your study variable and are clear on what you desire to measure. You will then need to address the following questions to determine the best instrument for measuring your study variable:
1. Does this instrument measure what you want to measure?
2. Does the instrument reflect your conceptual definition of the variable?
3. Is the instrument well constructed?
4. Does your population resemble populations previously studied with the instrument?
5. Is the readability level of the instrument appropriate for your population?
6. How sensitive is the instrument in detecting small differences in the phenomenon you want to measure (what is the effect size)?
7. What is the process for obtaining, administering, and scoring the instrument? Are there costs associated with the instrument?
8. What skills are required to administer the instrument? Do you have to have training or a particular credential to administer the instrument (Roberts & Stone, 2003)?
9. How are the scores interpreted?
10. What is the time commitment of the subjects and researcher for administration of the instrument?
11. What evidence is available related to the instrument’s reliability and validity? Have multiple types of validity been examined (content validity, validity from factor analysis, validity from examining convergence and divergence, or evidence of validity from prediction of concurrent and future events)? Chapter 15 provided a detailed discussion of reliability and validity.
Particular populations may require further assessment to determine their instrumentation requirements. Burnside, Preski, and Hertz (1998) provided an excellent discussion of research instrumentation for elderly subjects. They identified four factors that should be considered when selecting research instruments for use with older adults: fatigue, anxiety, ethnic background, and education.
Assessing Readability Levels of Instruments
The readability level of an instrument is a critical factor when selecting an instrument for a study. Regardless of how valid and reliable the instrument is, you cannot use it effectively in your study if your subjects do not understand the items. Calculating readability is relatively easy and can be performed in about 20 minutes. Many word processing programs and computerized grammar checkers will report the readability level of written material. The Fog formula described in Chapter 15 provides a quick and easy way to assess readability. If the reading level of the instrument is beyond that of your population, you will need to select another instrument for use in your study. Changing the items on an instrument to reduce the reading level can alter the validity and reliability of the instrument.
CONSTRUCTING SCALES
Scale construction is a complex procedure that should not be undertaken lightly. There must be firm evidence of the need for developing another instrument to measure a particular phenomenon important to nursing practice. However, in many cases, measurement methods have not been developed for phenomena of concern to nurse researchers, or measurement tools that have been developed may be poorly constructed and have insufficient evidence of validity to be acceptable for use in studies. It is possible for the researcher to carry out instrument development procedures on an existing scale with inadequate evidence of validity before using it in a study. Neophyte nurse researchers could assist researchers in carrying out some of the field studies required to complete the development of scale validity and reliability.
The procedures for developing a scale have been well defined. The following discussion describes this theory-based process and the mathematical logic underlying it. The theories on which scale construction is most frequently based include classic test theory (Nunnally & Bernstein, 1994), item response theory (Hulin, Drasgow, & Parsons, 1983), multidimensional scaling (Davison, 1983; Kruskal & Wish, 1990), and unfolding theory (Coombs, 1950). Most existing instruments used in nursing research have been developed with classic test theory, which assumes a normal distribution of scores.
Constructing a Scale by Using Classic Test Theory
In classic test theory, the following process is used to construct a scale:
1. Define the concept. A scale cannot be constructed to measure a concept until the nature of the concept has been delineated. The more clearly the concept is defined, the easier it is to write items to measure it (Spector, 1992). Concepts are defined through the process of concept analysis, a procedure discussed in Chapters 4 and 7.
2. Design the scale. Items should be constructed to reflect the concept as fully as possible. The process of construction will differ somewhat depending on whether the scale is a rating scale, Likert scale, or semantic differential scale. Items previously included in other scales can be used if they have been shown empirically to be good indicators of the concept (Hulin et al., 1983). A blueprint may ensure that all elements of the concept are covered. Each item must be stated clearly and concisely and express only one idea. The reading level of items must be identified and considered in terms of potential respondents. The number of items constructed must be considerably larger than planned for the completed instrument because items will be discarded during the item analysis step of scale construction. Nunnally and Bernstein (1994) suggested developing an item pool at least twice the size of that desired for the final scale.
3. Review the items. As items are constructed, it is advisable to ask qualified individuals to review them. Crocker and Algina (1986) recommend asking for feedback in relation to accuracy, appropriateness, or relevance to test specifications; technical flaws in item construction; grammar; offensiveness or appearance of bias; and level of readability. Revise items according to the critical appraisal.
4. Conduct preliminary item tryouts. While items are still in draft form, it is helpful to test them on a limited number of subjects (15 to 30) who represent the target population. Observe the reactions of respondents during testing to note behavior such as long pauses, answer changing, or other indications of confusion about specific items. After testing, a debriefing session must be held during which respondents are invited to comment on items and offer suggestions for improvement. Descriptive and exploratory statistical analyses are performed on data from these tryouts while noting means, response distributions, items left blank, and outliers. Revise items on the basis of this analysis and comments from respondents.
5. Perform a field test. Administer all the items in their final draft form to a large sample of subjects who represent the target population. Spector (1992) recommended a sample size of 100 to 200 subjects. However, the sample size needed for the statistical analyses to follow somewhat depends on the number of items. Some recommend including 10 subjects for each item being tested. If the final instrument was expected to have 20 items and 40 items were constructed for the field test, as many as 400 subjects could be required.
6. Conduct item analyses. The purpose of item analysis is to identify items that form an internally consistent or reliable scale and eliminate items that do not meet this criterion. Internal reliability implies that all the items are consistently measuring a concept. Before these analyses, negatively worded items must be reverse-scored or given a score as though the item was stated positively. For example, the item might read: I do not believe exercise is important to health with the responses of 1 strongly disagree, 2 disagree, 3 uncertain, 4 agree, and 5 strongly agree. If the subject marked a 1 for strongly disagree, this item would be reversed-scored and given a 5 indicating the subject thinks exercise is very important to health. The analyses examine the extent of intercorrelation among the items. The statistical computer programs currently providing (as a package) the set of statistical procedures needed to perform item analyses are SPSS, SPSS/PC, and SYSTAT. These packages perform item-item correlations and item-total correlations. In some cases, the value of the item being examined is subtracted from the total score and an item-remainder coefficient is calculated. This latter coefficient is most useful in evaluating items for retention in the scale.
7. Select items to retain. Depending on the number of items desired in the final scale, items with the highest coefficients are retained. Alternatively, a criterion value for the coefficient (e.g., 0.40) can be set and all items greater than this value retained. The greater the number of items retained, the smaller the item-remainder coefficients can be and still have an internally consistent scale. After this selection process, a coefficient alpha is calculated for the scale. This value is a direct function of the number of items and the magnitude of intercorrelation. Thus, one can increase the value of a coefficient alpha by increasing the number of items or raise the intercorrelations through inclusion of more highly intercorrelated items. Values of coefficient alphas range from 0 to 1. The alpha value should be at least 0.70 to indicate sufficient internal consistency in a new tool (Nunnally & Bernstein, 1994). An iterative process of removing or replacing items, or both, recalculating item-remainder coefficients, and then recalculating the alpha coefficient is repeated until a satisfactory alpha coefficient is obtained. Deleting poorly correlated items will raise the alpha coefficient, but decreasing the number of items will lower it (Spector, 1992). The initial attempt at scale development may not achieve a sufficiently high coefficient alpha. In this case, additional items will need to be written, more data collected, and the item analysis redone. This scenario is most likely to occur when too few items were developed initially or when many of the initial items were poorly written. It may also be a consequence of attempts to operationalize an inadequately defined concept (Spector, 1992).
8. Conduct validity studies. When scale development is judged to be satisfactory, studies must be performed to evaluate the validity of the scale. (Refer to the discussion of validity in Chapter 15.) These studies require the researcher to collect additional data from large samples. As part of this process, scale scores must be correlated with scores on other variables proposed to be related to the concept being put into operation. Hypotheses must be generated regarding variations in mean values of the scale in different groups. Exploratory and then confirmatory factor analysis (discussed in Chapter 20) is usually performed as part of establishing the validity of the instrument. As many different types of evidence of validity should be collected as possible (Spector, 1992).
9. Evaluate the reliability of the scale. Various statistical procedures must be performed to determine the reliability of the scale. These analyses can be performed on the data collected to evaluate validity. (See Chapter 15 for a discussion of the procedures performed to examine reliability.)
10. Compile norms on the scale. To determine norms, the scale must be administered to a large sample that is representative of the groups to which the scale is likely to be given. Norms should be acquired for as many diverse groups as possible. Data acquired during validity and reliability studies can be included for this analysis. To obtain the large samples needed for this purpose, many researchers permit others to use their scale with the condition that data from these studies be provided for compiling norms.
11. Publish the results of development of the scale. Scales are often not published for a number of years after the initial development because of the length of time required to validate the instrument. Some researchers never publish the results of this work. Studies using the scale are published, but the instrument development process may not be available except by writing to the author. This information needs to be added to the body of knowledge, and colleagues should encourage instrument developers to complete the work and submit it for publication (Lynn, 1989; Norbeck, 1985). Johnson and Rogers (2006) provided a detailed discussion of their development of the Purposeful Action Medication-Taking Questionnaire that might help you to understand the instrument development process. These researchers conducted a psychometric study to develop a questionnaire to measure the adherence to medication treatment by individuals with hypertension.
Constructing a Scale by Using Item Response Theory
Using item response theory to construct a scale proceeds initially in a fashion similar to that of classic test theory. There is an expectation of a well-defined concept to operationalize. Items are initially written in a manner similar to that previously described, and item tryouts and field testing are also similar. However, the process changes with the initiation of item analysis. The statistical procedures used are more sophisticated and complex than those used in classic test theory. Using data from field testing, item characteristic curves are calculated by using logistic regression models (Hulin et al., 1983). After selecting an appropriate model based on information obtained from the analysis, item parameters are estimated. These parameters are used to select items for the scale. This strategy is used to avoid problems encountered with classic test theory measures.
Scales developed by using classic test theory effectively measure the characteristics of subjects near the mean. The statistical procedures used assume a linear distribution of scale values. Items reflecting responses of subjects closer to the extremes tend to be discarded because of the assumption that scale values should approximate the normal curve. Therefore, scales developed in this manner often do not provide a clear understanding of subjects at the high or low end of values.
One of the purposes of item response theory is to choose items in such a way that estimates of characteristics at each level of the concept being measured are accurate. To accomplish this goal, researchers use maximal likelihood estimates. A curvilinear distribution of scale values is assumed. Rather than choosing items on the basis of the item remainder coefficient, the researcher specifies a test information curve. The scale can be tailored to have a desired measurement accuracy. By comparing a scale developed by classic test theory with one developed from the same items with item response theory, one would find differences in some of the items retained. Biserial correlations would be lower in the scale developed from item response theory than in the scale developed from classic test theory. Item bias is lower in scales developed by using item response theory and occurs when respondents from different subpopulations having the same amount of an underlying trait have different probabilities of responding to an item positively (Hulin et al., 1983).
Constructing a Scale by Using Multidimensional Scaling
Multidimensional scaling is used when the concept being operationalized is actually an abstract construct believed to be represented most accurately by multiple dimensions. The scaling techniques used allow the researcher to uncover the hidden structure in the construct. The analysis techniques use proximities among the measures as input. The outcome of the analysis is a spatial representation, or a geometrical configuration of data points, that reveals the hidden structure. The procedure tends to be used to examine differences in stimuli rather than differences in people. Thus, a researcher might use this method to measure differences in perception of light or pain. Scales developed by using this procedure reveal patterns among items. The procedure is used in the development of rating scales and semantic differentials (Kruskal & Wish, 1990).
Constructing a Scale by Using Unfolding Theory
When a scale is being constructed with the use of unfolding theory, the researchers ask subjects to respond to the items in the rating scale. Next, they ask the subjects to rank the various response options in relation to the response option that they selected for that item. This procedure is followed for each item in the scale. By using this procedure, the underlying continuum for each scale item is “unfolded.” As an example, suppose you developed the following item:
My preference for a diet to lose weight is
You would ask subjects to select their response to the item. You would then ask them to rank the other options according to the proximity to their choice. The subject might choose a low-calorie diet as number 1, a low-carbohydrate diet as number. 2, a low-fat diet as number 3, and a vegetarian diet as number 4. Although the preferences of other subjects would differ, the results can be plotted to reveal patterns of an underlying continuum. Items selected for the scale would be those with evidence of a pattern of responses. Degner (1998) used unfolding to analyze the results of patient responses to the Control Preferences Scale, a measure of consumer preferences about participating in decisions regarding treatment.
TRANSLATING A SCALE TO ANOTHER LANGUAGE
Contrary to expectations, translating an instrument from the original language to a target language is a complex process. By translating a scale, you can compare concepts among respondents of different cultures. The comparison requires that you first infer and then validate that the conceptual meaning in which the scale was developed is the same in both cultures. This process is highly speculative, and conclusions about the similarities of meanings in a measure must be considered tentative (Hulin et al., 1983).
Four types of translations can be performed: pragmatic translations, aesthetic-poetic translations, ethnographic translations, and linguistic translations. Pragmatic translations communicate the content from the source language accurately in the target language. The primary concern is the information conveyed. An example of this type of translation is the use of translated instructions for assembling a computer. Aesthetic-poetic translations evoke moods, feelings, and affect in the target language that are identical to those evoked by the original material. In ethnographic translations, the purpose is to maintain meaning and cultural content. In this case, translators must be familiar with both languages and cultures. Linguistic translations strive to present grammatical forms with equivalent meanings. Translating a scale is generally done in the ethnographic mode (Hulin et al., 1983).
One strategy for translating scales is to translate from the original language to the target language and then back-translate from the target language to the original language by using translators not involved in the original translation. Discrepancies are identified, and the procedure is repeated until troublesome problems are resolved. After this procedure, the two versions are administered to bilingual subjects and scored by standard procedures. The resulting sets of scores are examined to determine the extent to which the two versions yield similar information from the subjects. This procedure assumes that the subjects are equally skilled in both languages. One problem with this strategy is that bilingual subjects may interpret meanings of words differently from monolingual subjects. This difference in interpretation is a serious concern because the target subjects for most cross-cultural research are monolingual (Hulin et al., 1983).
Yu, Lee, and Woo (2004) provided an excellent description of their process of translating the Medical Outcomes Study Social Support Survey (MOS-SSS) from English to Chinese. These researchers used the forward and backward translation process previously discussed, and the steps they took are outlined in the following excerpt.
In 1997, the Medical Outcomes Trust introduced new translation criteria that are much more comprehensive. The discussion of these criteria is available at www.outcomes-trust.org/bulletin/0797blltn.htm.
Hulin et al. (1983) suggested the use of item response theory procedures to address some of the problems of translation. These procedures can provide direct evidence about the meanings of items in the two languages. Item characteristic curves for an item in the two languages can be compared, as can scale scores in the two languages. This procedure eliminates the need for bilingual samples. It also eliminates the need for the two populations to be equivalent in terms of the distributions of their scores on the trait being measured.
Rather than translating an instrument into each language, Turner, Rogers, Hendershot, Miller, and Thornberry (1996) tested the use of electronic technology involving multilingual audio computer-assisted self-interviewing (Audio-CASI) to enable researchers to include multiple linguistic minorities in nationally representative studies and clinical studies. This system uses electronic translation from one language to another. In the funded project to develop and test the system, a backup phone bank was available to provide multilingual assistance if needed. Whether this strategy will provide equivalent validity of a translated tool is unclear.
SUMMARY
• The measurement approaches used in nursing research include physiological measures, observations, interviews, questionnaires, and scales and some specialized instruments such as Q-sort method, Delphi technique, projective techniques, and diaries.
• Measurements of physiological variables can be either direct or indirect and sometimes require the use of specialized equipment or laboratory analysis.
• To measure observations, every variable is observed in a similar manner in each instance, with careful attention given to training data collectors.
• In structured observational studies, category systems must be developed; and checklists or rating scales are developed from the category systems and used to guide data collection.
• Interviews involve verbal communication between the researcher and the subject, during which the researcher acquires information. Interviewers must be trained in the skills of interviewing, and the interview protocol must be pretested.
• A questionnaire is a printed self-report form designed to elicit information through a subject’s written responses. The information obtained through questionnaires is similar to that obtained by interview, but the questions tend to have less depth. An item on a questionnaire usually has two parts: a lead-in question and a response set.
• Scales, another form of self-reporting, are more precise in measuring phenomena than are questionnaires and have been developed to measure psychosocial and physiological variables. The types of scales include the rating scale, Likert scale, semantic differential scale, and the visual analogue scale.
• A rating scale is a crude form of measurement that includes a list of an ordered series of categories of a variable, which are assumed to be based on an underlying continuum. A numerical value is assigned to each category.
• The Likert scale is designed to determine the opinion or attitude of a subject and contains a number of declarative statements with a scale after each statement.
• A semantic differential scale consists of two opposite adjectives with a seven-point scale between them and measures the connotative meaning of a concept to a subject.
• The visual analogue scale, sometimes referred to as magnitude scaling, is a 100-mm line with right-angle stops at each end with bipolar anchors placed beyond each end of the line. These end anchors must cover the entire range of sensations possible in the phenomenon being measured.
• The Delphi technique measures the judgments of a group of experts, assesses priorities, or makes forecasts. It provides a means for researchers to obtain the opinions of a wide variety of experts across the United States without the need for the experts to meet.
• Projective techniques are based on the assumption that the responses of individuals to unstructured or ambiguous situations reflect their attitudes, desires, personality characteristics, and motives.
• A diary, which allows one to record an experience shortly after an event, is more accurate than obtaining the information through recall at an interview, the reporting level of incidents is higher, and one tends to capture the participant’s perception of situations.
• The choice of tools for use in a particular study is a critical decision that will have a major impact on the significance of the study.
• The researcher must first conduct an extensive search for existing tools. Once found, the tools must be carefully evaluated. Tools that are selected for a study need to be described in great detail in the proposal or publication.
• Scale construction is a complex procedure that should not be undertaken lightly. Theories on which scale construction is most frequently based include classic test theory, item response theory, multidimensional scaling, and unfolding theory. Most existing instruments used in nursing research have been developed through the use of classic test theory.
• Translating a scale to another language is a complex process that allows concepts among respondents of different cultures to be compared.
REFERENCES
Adachi, K., Shimada, M., Usui, A. The relationship between the parturient’s positions and perceptions of labor pain intensity. Nursing Research. 2003;52(1):47–51.
Aroian, K.J., Wal, J.S.V. Measuring elders’ symptoms with daily diaries and retrospective reports. Western Journal of Nursing Research. 2007;29(3):322–337.
Berdie, D.R., Anderson, J.F., Niebuhr, M.A. Questionnaires: Design and use. Metuchen, NJ: Scarecrow Press, 1986.
Beretta, R. A critical review of the Delphi technique. Nurse Researcher. 1996;3(4):79–89.
Briggs, C.L. Learning how to ask: A sociolinguistic appraisal of the role of the interview in social science research. Cambridge, England: Cambridge University Press, 1986.
Burman, M.E. Health diaries in nursing research and practice. Image: Journal of Nursing Scholarship. 1995;27(2):147–152.
Burnard, P. The telephone interview as a data collection method. Nurse Education Today. 1994;14(1):67–72.
Burns, N. Research in progress. Atlanta: American Cancer Society, Texas Division, 1986.
Burnside, I., Preski, S., Hertz, J.E. Research instrumentation and elderly subjects. Image: Journal of Nursing Scholarship. 1998;30(2):185–190.
Butz, A.M., Alexander, C. Use of health diaries with children. Nursing Research. 1991;40(1):59–61.
Chapple, A. Personal recollections on interviewing GPs and consultants. Nurse Researcher. 1997;5(2):82–91.
Chung, J.W.Y., Ng, W.M.Y., Wong, T.K.S. An experimental study on the use of manual pressure to reduce pain in intramuscular injections. Journal of Clinical Nursing. 2002;11(4):457–461.
Converse, J.M., Presser, S. Survey questions: Handcrafting the standardized questionnaire. Newbury Park, CA: Sage, 1986.
Coombs, C.H. Psychological scaling without a unit of measurement. Psychological Review. 1950;57(3):145–158.
Couper, M.R. The Delphi technique: Characteristics and sequence model. Advances in Nursing Science. 1984;7(1):72–77.
Cowan, M.J., Heinrich, J., Lucas, M., Sigmon, H., Hinshaw, A.S. Integration of biological and nursing sciences: A 10-year plan to enhance research and training. Research in Nursing & Health. 1993;16(1):3–9.
Craig, J.V., Smyth, R.L. The evidence-based practice manual for nurses, (2nd ed.). Edinburgh, Scotland: Churchill Livingstone, 2007.
Crisp, J., Pelletier, D., Duffield, C., Adams, A., Nagy, S. The Delphi method? Nursing Research. 1997;46(2):116–118.
Crocker, L., Algina, J. Introduction to classical modern test theory. New York: Holt, Rinehart & Winston, 1986.
Davison, M.L. Multidimensional scaling. New York: Wiley, 1983.
Degner, L.F. Preferences to participate in treatment decision making: The adult model. Journal of Pediatric Oncology Nursing. 1998;15(3, Suppl 1):3–9.
DeKeyser, F.G., Pugh, L.C. Approaches to physiologic measurement. In: Waltz C.F., Strickland O.L., Lenz E.R., eds. Measurement in nursing research. 2nd ed. Philadelphia: F.A. Davis; 1991:387–412.
Dennis, K.E. Q methodology: Relevance and application to nursing research. Advances in Nursing Science. 1986;8(3):6–17.
DeVon, H.A., Zerwic, J.J. The symptoms of unstable angina: Do women and men differ? Nursing Research. 2003;52(2):108–118.
Dillman, D. Mail and telephone surveys: The total design method. New York: Wiley, 1978.
Dillon, J.T. The practice of questioning. New York: Routledge, 1990.
Drankiewicz, D., Dundes, L. Handwashing among female college students. American Journal of Infection Control. 2003;31(2):67–71.
Dubbert, P.M., White, J.D., Grothe, K.B., O’Jile, J., Kirchner, K.A. Physical activity in patients who are severely mentally ill: Feasibility of assessment for clinical and research applications. Archives of Psychiatric Nursing. 2006;20(5):205–209.
Dzurec, L.C., Coleman, P.A. A hermeneutic analysis of the process of conducting interviews. Image: Journal of Nursing Scholarship. 1995;27(3):245.
Etris, M.B., Pribble, J., LaBrecque, J. Evaluation of two wound measurement methods in a multi-center, controlled study. Ostomy/Wound Management. 1994;40(7):44–48.
Faulkner, M.S., Hathaway, D., Tolley, B. Cardiovascular autonomic function in healthy adolescents. Heart & Lung. 2003;32(1):10–22.
Flaskerud, J.H. Is the Likert scale format culturally biased? Nursing Research. 1988;37(3):185–186.
Fowler, F.J. Standardized survey interviewing: Minimizing interviewer-related error. Newbury Park, CA: Sage, 1990.
Fox, J.A., Tracy, P.E. Randomized response: A method for sensitive surveys. Beverly Hills, CA: Sage, 1986.
Gentzkow, G.D. Methods for measuring size in pressure ulcers. Advances in Wound Care. 1995;8(4):43–45.
Gift, A.G. Visual analogue scales: Measurement of subjective phenomena. Nursing Research. 1989;38(5):286–288.
Goodman, C.M. The Delphi technique: A critique. Journal of Advanced Nursing. 1987;12(6):729–734.
Gorden, R.L. Interviewing: Strategy, techniques, and tactics. Chicago: Dorsey Press, 1987.
Guinan, M.E., McGuckin-Guinan, M., Sevareid, A. Who washes hands after using the bathroom? American Journal of Infection Control. 1997;25(5):424–425.
Guyatt, G.H., Berman, L.B., Townsend, M., Pugsley, S.O., Chambers, L.W. A measure of quality of life for clinical trials in chronic lung disease. Thorax. 1987;42(11):773–778.
Hansen, G.L., Sparrow, E.M., Kokate, J.Y., Leland, K.J., Iaizzo, P.A. Wound status evaluation using color image processing. IEEE Transactions on Medical Imaging. 1997;16(1):78–86.
Harding, K.G. Methods for assessing change in ulcer status. Advances in Wound Care. 1995;8(4):37–42.
Harralson, T.L. Factors influencing delay in seeking treatment for acute ischemic symptoms among lower income, urban women. Heart & Lung. 2007;36(2):96–104.
Holaday, B., Turner-Henson, A. Response effects in surveys with school-age children. Nursing Research. 1989;38(4):248–250.
Hulin, C.L., Drasgow, F., Parsons, C.K. Item response theory: Application to psychological measurement. Homewood, IL: Dow Jones-Irwin, 1983.
Im, E., Chee, W., Guevara, E., Liu, Y., Lim, H., Tsai, H., et al. Gender and ethnic differences in cancer pain experience: A multiethnic survey in the United States. Nursing Research. 2007;56(5):296–306.
Johnson, B.H. Children’s drawings as a projective technique. Pediatric Nursing. 1990;16(1):11–17.
Johnson, M.J., Rogers, S. Development of the Purposeful Action Medication-Taking Questionnaire. Western Journal of Nursing Research. 2006;28(3):335–351.
Jones, J.M. Nutritional methodology: Development of a nutritional screening or assessment tool using a multivariate technique. Nutrition. 2004;20(3):298–306.
Kapella, M.C., Larson, J.L., Patel, M.K., Covey, M.K., Berry, J.K. Subjective fatigue, influencing variables, and consequences in chronic obstructive pulmonary disease. Nursing Research. 2006;55(1):10–17.
Kreman, R., Yates, B.C., Agrawal, S., Fiandt, K., Briner, W., Shurmur, S. The effects of motivational interviewing on physiological outcomes. Applied Nursing Research. 2006;19(3):167–170.
Kruskal, J.B., Wish, M. Multidimensional scaling. Newbury Park, CA: Sage, 1990.
Lee, K.A., Kieckhefer, G.M. Measuring human responses using visual analogue scales. Western Journal of Nursing Research. 1989;11(1):128–132.
Lindeman, C.A. Delphi survey of priorities in clinical nursing research. Nursing Research. 1975;24(6):434–441.
Liskay, A.M., Mion, L.C., Davis, B.R. Comparison of two devices for wound measurement. Dermatology Nursing. 1993;5(6):437–441.
Lodge, M. Magnitude scaling: Quantitative measurement of opinions. Beverly Hills, CA: Sage, 1981.
Luniewski, M., Riegle, J.K., White, B. Card sort: An assessment tool for the educational needs of patients with heart failure. American Journal of Critical Care. 1999;8(5):297–302.
Lynn, M.R. Instrument reliability: How much needs to be published? Heart & Lung. 1989;18(4):421–423.
Malloch, K., Porter-O’Grady, T. Introduction to evidence-based practice in nursing and health care. Sudbury, MA: Jones & Bartlett, 2006.
Marshall, C., Rossman, G.B. Designing qualitative research, (4th ed.). Thousand Oaks, CA: Sage, 2006.
McColl, E. Best practice in symptom assessment: A review. Gut. 2004;53(Suppl 4):iv49–iv54.
McCracken, G.D. The long interview. Newbury Park, CA: Sage, 1988.
McKeown, B., Thomas, D. Q methodology. Newbury Park, CA: Sage, 1988.
McLaughlin, P. How to interview: The art of asking questions, (2nd ed.). North Vancouver, BC: International Self-Counsel Press, 1990.
Melhuish, J.M., Plassman, P., Harding, K.G. Circumference, area and volume of the healing wound. Journal of Wound Care. 1994;3(8):380–384.
Melnyk, B.M. Coping with unplanned childhood hospitalization: Effects of informational interventions on mothers and children. Nursing Research. 1994;43(1):50–55.
Melnyk, B.M., Alpert-Gillis, L.J., Hensel, P.B., Cable-Beiling, R.C., Rubenstein, J.S. Helping mothers cope with critically ill child: A pilot test of the COPE intervention. Research in Nursing & Health. 1997;20(1):3–14.
Minnick, A.F., Mion, L.C., Johnson, M.E., Catrambone, C., Leipzig, R. Prevalence and variation of physical restraint use in acute care settings in the US. Journal of Nursing Scholarship. 2007;39(1):30–37.
Mishler, E.G. Research interviewing: Context and narrative. Cambridge, MA: Harvard University Press, 1986.
Mitchell, M.P. Nursing education planning: A Delphi study. Journal of Nursing Education. 1998;37(7):305–307.
National Institute of Nursing Research (NINR) Strategic plan National Institute of Nursing Research: Areas of research emphasis, 2006. Retrieved November 7, 2007, from www.ninr.nih.gov/AboutNINR/NINRMissionandStrategicPlan.
Norbeck, J.S. What constitutes a publishable report of instrument development? Nursing Research. 1985;34(6):380–381.
Nunnally, J.C., Bernstein, I.H. Psychometric theory, (3rd ed.). New York: McGraw-Hill; 1994.
Osgood, C.E., Suci, G.J., Tannenbaum, P.H. The measurement of meaning. Urbana, IL: University of Illinois Press, 1957.
Paratz, J., Lipman, J. Manual hyperinflation caused norepinephrine release. Heart & Lung. 2006;35(4):262–268.
Pope, D.S. Music, noise, and the human voice in the nurse-patient environment. Image: Journal of Nursing Scholarship. 1995;27(4):291–296.
Pugh, L.C., DeKeyser, F.G. Use of physiologic variables in nursing research. Image: Journal of Nursing Scholarship. 1995;27(4):273–276.
Ro, Y., Ha, H., Kim, C., Yeom, H. The effects of aromatherapy on pruritus in patients undergoing hemodialysis. Dermatology Nursing. 2002;14(4):231–234.
Roberts, W.D., Stone, P.W. Ask and expert: How to choose and evaluate a research instrument. Applied Nursing Research. 2003;16(1):70–72.
Rudy, S.F. Research forum: A review of Delphi surveys conducted to establish research priorities by specialty nursing organizations from 1985 to 1995. ORL: Head & Neck Nursing. 1996;14(2):16–24.
Saris, W.E. Computer-assisted interviewing. Newbury Park, CA: Sage, 1991.
Schallom, L., Sona, C., McSweeney, M., Mazuski, J. Comparison of forehead and digit oximetry in surgical/trauma patients at risk for decreased peripheral perfusion. Heart & Lung. 2007;36(3):188–194.
Schuman, H. Questions and answers in attitude surveys: Experiments on question form, wording, and context. New York: Academic Press, 1981.
Sennott-Miller, L., Murdaugh, C., Hinshaw, A.S. Magnitude estimation: Issues and practical applications. Western Journal of Nursing Research. 1988;10(4):414–424.
Shelley, S.I. Research methods in nursing and health. Boston: Little, Brown, 1984.
Simpson, S.H. Use of Q-sort methodology in cross-cultural nutrition and health research. Nursing Research. 1989;38(5):289–290.
Small, L., Melnyk, B.M. Early predictors of post-hospital adjustment problems in critically ill young children. Research in Nursing & Health. 2006;29(6):622–635.
Spector, P.E. Summated rating scale construction: An introduction. Newbury Park, CA: Sage, 1992.
Sudman, S., Bradburn, N. Asking questions: A practical guide to questionnaire design. San Francisco: Jossey-Bass, 1982.
Tetting, D.W. Q-sort update. Western Journal of Nursing Research. 1988;10(6):757–765.
Thomas, D.R. Existing tools: Are they meeting the challenges of pressure ulcer healing? Advances in Wound Care. 1997;10(5):86–90.
Turner, C.F., Rogers, S.M., Hendershot, T.P., Miller, H.G., Thornberry, J.P. Improving representation of linguistic minorities in health surveys. Public Health Reports. 1996;111(3):276–279.
Waltz, C.F., Strickland, O.L., Lenz, E.R. Measurement in nursing research. Philadelphia: F.A. Davis, 1991.
Wewers, M.E., Lowe, N.K. A critical review of visual analogue scales in the measurement of clinical phenomena. Research in Nursing & Health. 1990;13(4):227–236.
Williams, J.E., Singh, S.J., Sewell, L., Guyatt, G.H., Morgan, M.D. Development of a self-report Chronic Respiratory Questionnaire (CRQ-SR). Thorax. 2001;56(12):954–959.
Yu, D.S.F., Lee, D.T.F., Woo, J. Issues and challenges of instrument translation. Western Journal of Nursing Research. 2004;26(3):307–320.
Zung, W.W.K. A self-rating depression scale. Archives of General Psychiatry. 1965;12:63–70.