Interpreting Research Outcomes
When data analysis is complete, there is a feeling that the answers are known and the study is finished. However, the results of statistical analysis alone are inadequate to complete a study. The researcher may know the results, but without careful intellectual examination, these results are of little use to others or to nursing’s body of knowledge. To be useful, the evidence from data analysis needs to be carefully examined, organized, and given meaning, and its statistical and clinical significance needs to be assessed. This process is referred to as the interpretation of research outcomes.
Interpretation is the most important part of any study. It requires more critical synthesis and a higher level of thinking than any previous step. Some of the most profound insights of the entire research process occur during interpretation. There is a tendency to rush this important step to finish the study, but it is not a step to be minimized or hurried. The process takes time for reflection. Often times, a researcher becomes too close to the details to be able to see the big picture. At this point, dialogue with colleagues or mentors can add clarity and expand meaning.
Data collection and analysis are action-oriented activities that require more concrete thinking. However, when interpreting the results of the study, one tends to implement abstract thinking, including the creative use of introspection, reasoning, and intuition. In some ways, these last steps in the research process are the most difficult. They require one to synthesize the logic used to develop the research plan, the strategies used in the data collection phase, and the mathematical logic or insight and pattern formation used in data analysis. Evaluating the research process used in the study, producing meaning from the results, and forecasting the usefulness of the findings are all part of interpretation and require high-level intellectual processes.
Translation is frequently thought of as being synonymous with interpretation. Abstract theoretical statements are sometimes referred to as being translated into more concrete meaning, as, for example, in the operationalization of a variable. Although translate and interpret are similar words, their meanings have subtle differences. Translation means to transform from one language to another or to use terms that can be more easily understood. Interpretation involves explaining the meaning of information. Interpretation seems to include translation and to go beyond it to explore and impart meaning. Thus, in this step of the research process, the researcher translates the results of analysis into findings and then interprets by attaching meaning to the findings.
An example of translation and interpretation is provided in a study of “Predictors of Health-Related Quality of Life 3 months after Traumatic Injury” (Lee, Chaboyer & Wallis, 2008). In the study, data were collected using a telephone survey 3 months after a traumatic injury. The 114 participants were primarily working-age men. One component of the survey measured the physical consequences of the trauma. Statistical results were provided in a table. Translation of these statistical results are reported as follows: “Pain was the most frequently reported symptom; weight and strength loss and fatigue were also reported often in the current study… The three higher scoring subscales of the Chinese IPQ-R (Trauma) were Illness coherence, Controllability, and Consequences (p.87). Interpretation follows with this statement: “These findings might be because the sample was relatively young and of productive working age. Perhaps these factors indicate that the traumatic injury brought many consequences and had multiple effects on participants’ lives. Higher scores on the Illness Coherence and Controllability subscales might also mean that relatively young patients were better able to comprehend their injuries and also consider more ways to control the consequences; however this proposition requires testing” (p.87).
The process of interpretation includes examining evidence, determining findings, forming conclusions, exploring the significance of the findings, generalizing the findings, considering implications, and suggesting further studies. Each of these activities is discussed in this chapter. The final chapter of theses and dissertations and the final sections of research articles and presentations include the interpretation of research outcomes.
EXAMINING EVIDENCE
The first step in interpretation involves considering all the evidence available that supports or contradicts the validity of results related to the research objectives, questions, or hypotheses. To consider the evidence, one needs first to determine what the evidence is and then gather it together. You will need to carefully consider the impact of each piece of evidence on the validity of the results; then you will synthesize the evidence as a whole to arrive at a final judgment. The process is somewhat like conducting a critical appraisal of your own work. Your temptation is to ignore flaws—certainly not to point them out. However, the honest completion of this process is essential in order to build a body of knowledge. It is a time not for confession, remorse, and apology but rather for thoughtful reflection. As the researcher, you will need to identify the problems and strengths of the study and share them with colleagues at presentations and in publications. They affect the meaning of the results and can serve as guideposts for future researchers.
Evidence from the Research Plan
The initial evidence regarding the validity of the study results is derived from reexamining the research plan. Reexamination requires that the researcher reexplore the logic of the methodology. Analyze the logical links among the problem statement, purpose, research questions, variables, framework design, sample, methods of measurement, and types of analyses. These elements of the study logically link together and are consistent with the research problem. Remember the old adage, a chain is only as strong as its weakest link? This saying is also true of research. Therefore, examine the study needs to identify its weakest links or limitations.
You will then need to examine these limitations in terms of their impact on the results. Could the results, or some of the results, be a consequence of a weakness in the methodology rather than a true test of the hypotheses? Can the research objectives, questions, or hypotheses be answered from the methodology used in the study? Could the results be a consequence of an inappropriate conceptual or operational definition of a variable? Do the research questions clearly emerge from the framework? Can the results be related back to the framework? Are the analyses logically planned to test the questions or hypotheses?
If the types of analyses are inappropriate for examining the research questions, what do the results of analyses mean? For example, if the design failed to control extraneous variables, could some of these variables explain the results, rather than the results being explained by the variables measured and examined through statistical analysis? Was the sample studied a logical group on which to test the hypotheses? The researcher must in this way carefully evaluate each link in the design to determine potential weaknesses. Every link is clearly related to the meaning given to the study results. If the researcher is reviewing a newly completed study and determines that the types of analyses were inappropriate, the analyses, of course, need to be redone. If the study has several weaknesses or breaks in logical links, the findings may need to be seriously questioned.
Evidence from Measurement
One assumption often made in interpreting study results is that the study variables were adequately measured. This adequacy is determined by examining the fit of operational definitions with the framework and through validity and reliability information. Although you should determine the reliability and validity of measurement strategies before using them in your study, you need to reexamine the measures at this point to determine the strength of evidence available from the results. For example, did the scale used to measure anxiety truly reflect the anxiety experienced in the study population? What was the effect size? Were the validity and reliability of instruments examined in the present study? Can this information be used to interpret the results? The validity and reliability of measurement are critical to the validity of results. If the instruments used do not measure the variables as defined conceptually and operationally in the study, the results of analyzed measurement scores mean little.
Scores from measurement instruments without validity and reliability can be used for statistical analyses just as easily as those with validity and reliability. The mathematical formula or the computer cannot detect the difference. The difference is in the meaning attributed to the results, which only researchers, not computers, can detect.
Evidence from the Data Collection Process
Many activities that occur during data collection affect the meaning of study results. Did your study have a high refusal rate for subject participation, or was the attrition high? Was the sample size sufficient? Did strategies for acquiring a sample eliminate important groups whose data would have influenced the results? Did you and your research team achieve intervention fidelity when the treatment was implemented? Did unforeseen events occur during the study that might have changed or had an impact on the data? Were measurement techniques consistent? What impact do inconsistencies have on interpreting results? Sometimes data collection does not proceed as planned. Unforeseen situations alter the collection of data. What were these variations in your study? What impact do they have on interpreting the results? Sometimes someone other than the subject completes data collection forms. Also, variations may occur when scales are administered. For example, an anxiety scale may be given to one subject immediately before a painful procedure and to another subject upon awakening in the morning. Values on these measures cannot be considered comparable. Data integrity also depends on honesty of subjects, which could be compromised by anxiety, time constraints, denial, or other factors not in the direct control of the researcher. The researcher must be on the alert for these subject factors that could compromise the integrity of the data. Values on these measures cannot be considered comparable. These types of differences are seldom reported and sometimes not even recorded. To some extent, only the researcher knows how consistently the measurements were taken. Reporting this information is dependent on the integrity of the researcher (Kerlinger & Lee, 2000; Pyrczak & Bruce, 2005; Stein, Sargent, & Rafaels, 2007).
Evidence from the Data Analysis Process
The process of data analysis is an important factor in evaluating the meaning of results. One important part of this examination is to summarize the study weaknesses related to the data analysis process. Ask yourself these questions concerning the meaning of your results: How many errors were made while entering the data into the computer? How many subjects have missing data that could affect statistical analyses? Were the analyses accurately calculated? Were statistical assumptions violated? Were the statistics used appropriate for the data? It is best to address these issues initially before analyses are performed and again when completing the analyses and preparing the final report. Researchers should consult with a biostatistician to assure the appropriateness of the data analysis and statistical tests selected. The biostatistician could also be helpful in interpreting the results. Before submitting a paper for publication, we recheck each analysis reported in the paper. We reexamine the analysis statements in the paper (Corty, 2007). Are we correctly interpreting the results of the analysis? Documentation on each statistical value or analysis statement reported in the paper is filed with a copy of the paper. The documentation includes the date of the analysis, the page number of the computer printout showing the results (the printout is stored in a file by date of analysis), the sample size for the analysis, and the number of missing values.
Except in simple studies, data analysis in quantitative studies is usually performed by computer. With prepared statistical analysis programs, multiple analyses can be performed on the data that the researcher does not understand well. To the neophyte researcher, the computer spits out reams of paper with incomprehensible printed information and, in the end, gives a level of significance. The appropriateness of the data and the logic behind the program may remain unknown, but a new researcher may consider the level of significance as absolute “proof” of an important finding.
In gathering evidence for the implications of the study results, it is critical to reexamine the data analysis process. The researcher needs to examine the sufficiency of personal knowledge and proficiency in the analyses used. Reexamine your data for accuracy and completeness. If mathematical operations were performed manually, recheck them for accuracy. Reexamine computer printouts to ensure that no meaningful information has been overlooked. Recheck tables of data for accuracy and clarity.
Evidence from Data Analysis Results
The outcomes of data analysis are the most direct evidence of the results. The researcher has intimate knowledge of the research and needs to evaluate its flaws and strengths carefully when judging the validity of the results. In descriptive and correlational studies, the validity of the results depends on how accurately the variables were measured in selected samples and settings. The value of evidence in any study depends on the amount of variance in the phenomenon explained within the study, a factor that is often not considered when interpreting the results (Tulman & Jacobsen, 1989). In quasi-experimental and experimental studies, in which hypothesized differences in groups are being examined, the differences or lack of differences do not indicate the amount of variance explained. Both differences or lack of differences, and amount of variance explained needs to be reported in all studies and should serve as a basis for interpreting the results (see Chapters 19 through 22 for discussions of methods of identifying the variance explained in an analysis).
Interpretation of results from quasi-experimental and experimental studies is traditionally based on decision theory, with five possible results: (1) significant results that are in keeping with those predicted by the researcher, (2) nonsignificant results, (3) significant results that oppose those predicted by the researcher, (4) mixed results, and (5) unexpected results.
Significant and Predicted Results
Significant results that coincide with the researcher’s predictions are the easiest to explain and, unless weaknesses are present, validate the proposed logical links among the elements of the study. These results support the logical links developed by the researcher among the framework, questions, variables, and measurement methods. This outcome is very satisfying to the researcher. However, the researcher needs to consider alternative explanations for the positive findings. What other elements could possibly have led to the significant results?
Nonsignificant Results
Unpredicted nonsignificant or inconclusive results are the most difficult to explain. These results are often referred to as negative results. The negative results could be a true reflection of reality. In this case, the reasoning of the researcher or the theory used by the researcher to develop the hypothesis is in error. If so, the negative findings are an important addition to the body of knowledge. With nonsignificant results, it is important to determine if adequate power of 0.8 or higher was achieved for the data analysis. Thus, the researcher needs to conduct a power analysis to determine if the sample size was adequate to prevent the risk of a type II error. A type II error means that in reality the findings are significant, but, because of weaknesses in the methodology, the significance was not detected.
Negative results could also be due to inappropriate methodology, a deviant sample, problems with internal validity, inadequate measurement, the use of weak statistical techniques, or faulty analysis. Unless these weak links are detected, the reported results could lead to faulty information in the body of knowledge (Angell, 1989). It is easier for the researcher to blame faulty methodology for nonsignificant findings than to find failures in theoretical or logical reasoning. If faulty methodology is blamed, the researcher needs to explain exactly how the breakdown in methodology led to the negative results. Negative results, in any case, do not mean that there are no relationships among the variables or differences between groups; they indicate that the study failed to find any.
Significant and Not Predicted Results
Significant results opposite those predicted, if the results are valid, are an important addition to the body of knowledge. An example would be a study in which the researchers proposed that social support and ego strength were positively related. If the study showed that high social support was related to low ego strength, the result would be the opposite of that predicted. Such results, when verified by other studies, indicate that we were headed in the wrong direction theoretically. Because these types of studies can affect nursing practice, this information is important. Sometimes the researcher believes so strongly in the theory that he or she does not believe the results. The researcher remains convinced that there was a problem in the methodology. Sometimes this belief remains entrenched in the minds of scientists for many years because of the bias that good research supports its hypotheses.
Mixed Results
Mixed results are probably the most common outcome of studies. In this case, one variable may uphold the characteristics predicted whereas another does not, or two dependent measures of the same variable may show opposite results. These differences may be due to methodology problems, such as differing reliability or validity of two methods of measuring variables. Additional study might be indicated. Mixed results may also indicate a need to modify existing theory.
Unexpected Results
Unexpected results are relationships found between variables that were not hypothesized and not predicted from the framework guiding the study. These unexpected results are also called serendipitous results. Most researchers examine as many elements of data as possible in addition to those directed by the research objectives, questions, or hypotheses. They can use these findings to develop or refine theories and to formulate later studies. In addition, serendipitous results are as important as evidence in developing the implications of the study. However, researchers must deal carefully with serendipitous results when considering their meaning, because the study was not designed to examine these results.
Evidence from Previous Studies
The results of the present study should always be examined in light of previous findings. It is important for the researcher to know whether the results are consistent with past research. Consistency in findings across studies is important for developing theories and refining scientific knowledge. Therefore, any inconsistencies need to be explored to determine reasons for the differences. Replication of studies and synthesis of findings from existing studies are critical for the development of empirical knowledge for an evidence-based practice (Craig & Smyth, 2007).
DETERMINING FINDINGS
Findings are developed by evaluating evidence (discussed previously in this chapter) and translating and interpreting study results. Although much of the process of developing findings from results occurs in the mind of the researcher, evidence of such thinking can be found in published research reports. It is important during this process to dialogue with colleagues or mentors to clarify meaning or expand implications of the research findings. The 2003 study of Loescher examines cancer worry in women with hereditary risk factors for breast cancer. Dr. Loescher’s excellent study was supported by the National Institutes of Health–National Cancer Institute postdoctoral fellowship and the Oncology Nurses Society Foundation/OrthoBiotech, Inc., Research Fellowship. The article presented here received the 2003 Oncology Nursing Society Excellence in Cancer Nursing Research Award, supported by Schering Oncology/Biotech. Note how Dr. Loescher related her finding to those of previous studies and how she presented her study objectives (aims), results, and findings.

The first study objective was to “ascertain levels of worry among these women.” (Loescher, 2003, p. 768)
Results. The mean total scale score of TACS (the Thoughts About Cancer Scale) was 9.7 (SD = 2.6), suggesting that participants’ overall worry about cancer was rarely or never to sometimes. Mean item scores for the six worry items ranged from 1.2 (rarely or never) to 2.3 (sometimes) (Table 24-1). Worry was dichotomized into low worry (scores 6–11) and worry at least sometimes (scores 12–24). The majority of participants (55%–87%) had lower scores for items pertaining to neutral symptoms and breast cancer-specific signs and symptoms. Conversely, most participants (81%–86%) reported higher scores for items concerning general breast cancer worry. (Loescher, 2003, p. 769)
TABLE 24-1
Level of Cancer Worry in Women at High Risk for Breast Cancer
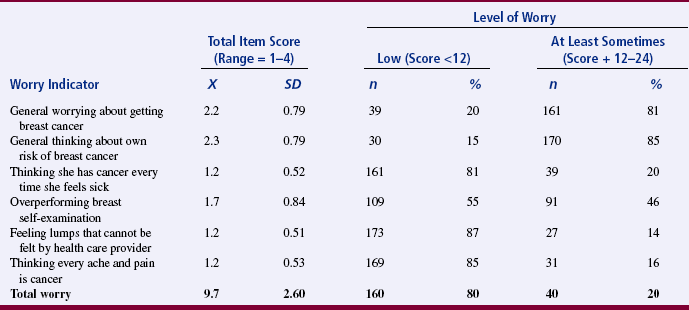
From Loescher, I. J. (2003). Cancer work in women with hereditary risk factors for breast cancer. Oncology Nursing Forum, 30(5), 770
Findings. The main purpose of this study was to investigate cancer worry in women with hereditary risk factors for breast cancer. The mean total worry score as measured by TACS indicated that women in this study sometimes worried about breast cancer. Several other investigators found comparable levels of cancer-specific worry in similar populations (Audrain et al., 1997; Bish et al., 2002; Bowen et al., 1999; Brain et al., 1999; Diefenbach et al., 1999). However, some investigators (Kash et al., 1992; Lloyd et al., 1996) reported higher, almost clinically pathologic levels of worry in high-risk women, whereas others (Leggatt et al., 2000) reported rare cancer worry. These studies of cancer worry did not measure worry in terms of signs and symptoms of cancer or base questionnaire items on qualitative data, so, in that regard, the current study presents new information about cancer worry in high-risk individuals.
The low to moderate levels of worry reported in this study may be explained partially by cognitive determinants of emotion. For example, individuals at risk for a potentially life-threatening disease generally do not worry constantly about this threat because they also are dealing with competing concerns and activities that occur as part of everyday living. Additionally, not worrying constantly could be adaptive in that it prevents overwhelming anxiety (Easterling & Leventhal, 1989; Weinstein, 1988; Weinstein et al., 1986). However, gaining a clearer picture of these assumptions would require asking about worry over time, rather than in a cross-sectional fashion. Although women in this study sometimes worried about developing cancer, the absence of a population-based control group precludes comparisons of worry in high-risk women with women at general population risk.
On average, participants in this study sometimes worried about developing breast cancer and sometimes thought about their own risk for developing breast cancer. These findings reflect results from other studies (Leggatt et al., 2000; Lerman et al., 1994b; McCaul et al., 1998). Many researchers have suggested that this moderate level of worry in women at high risk for breast cancer is the most beneficial—and desired—level for motivating information seeking and practicing recommended risk-reduction behaviors (Bowen et al., 1999; Brain et al., 1999; Lerman et al., 1994a). Higher levels of worry actually may be detrimental to these actions and behaviors (Audrain et al., 1997; Diefenbach et al., 1999).
Although women in this study sometimes thought about breast cancer, an unexpected finding was that when taken individually, neutral symptoms and perceived signs and symptoms of breast cancer did not appear to be worrisome. These findings differed from other studies that reported higher worry for high-risk women experiencing neutral symptoms than for women controls (Cunningham et al., 1998; Easterling & Leventhal, 1989.) One explanation for low symptom-based worry may be that less than half of the sample reported any clinical signs or symptoms, so the cues for worry did not exist. Another untested explanation may be that the women in this study were recruited largely from a dedicated mammography center and cancer-prevention clinics and already were positioned to deal with any cancer signs and symptoms; therefore, these women experienced less worry. (Loescher, 2003, p. 770)
The second study objective was to “assess correlations of cancer worry, perceived risk of cancer, and clinical signs or symptoms of breast cancer.” (Loescher, 2003, p. 768)
Results. The mean total score for absolute risk of developing breast cancer was 51% (SD = 24.8). The mean number of signs and symptoms experienced by the sample was 1.6 (SD = 1.5). Table 24-2 shows individual possible clinical indicators of cancer reported by the sample. Table 24-3 shows correlations of perceived risk and specific clinical indicators of possible breast cancer with cancer worry. (Loescher, 2003, p. 769)
TABLE 24-2
Possible Clinical Indicators of Breast Cancer Reported by the Sample
| Clinical Indicator | n | % |
| Biopsy of at least one breast lump | 64 | 32 |
| At least one abnormal mammogram | 74 | 37 |
| Lump felt by health care provider | 92 | 46 |
| Lump felt during breast self-examination | 85 | 43 |
From Loescher, I. J. (2003). Cancer work in women with hereditary risk factors for breast cancer. Oncology Nursing Forum, 30(5), 770.
TABLE 24-3
Correlations of Cancer Worry with Perceived Risk and Clinical Signs of Breast Cancer
| Breast Cancer Sign | Total Cancer Worry |
| Perceived absolute risk | −0.900 |
| Had biopsy of at least one lump | 0.169 |
| At least one abnormal mammogram or ultrasound | 0.112 |
| At least one lump felt by health care provider | 0.108 |
| At least one lump felt during breast self-examination | 0.123 |
| Total clinical signs | 0.171 |
From Loescher, I. J. (2003). Cancer work in women with hereditary risk factors for breast cancer. Oncology Nursing Forum, 30(5), 770.
Findings. The nonsignificant correlation of perceived risk with cancer worry was not surprising, given the equivocal nature of this relationship in the literature (Audrain et al., 1997; Cull et al., 2001; Cunningham et al., 1998; Easterling & Leventhal, 1989; Hopwood et al., 1998; Kash et al., 1992; Lerman et al., 1996; Lloyd et al., 1996). The use of one standard risk-assessment question may not have been sufficient to fully characterize risk perception. This problem has been reported previously (Bish et al., 2002; Cull et al., 2001), and future studies of worry should include more sensitive measures of perceived risk.
Previous research reported that the amount and frequency of symptoms (symptom burden) elicited worry about cancer in known at-risk women who perceived that they were at high risk for cancer. However, the equivalent symptom burden in known high-risk women with perceived low risk of cancer did not elicit worry (Easterling & Leventhal, 1989). These results may help to explain why participants in this study worried “sometimes” when the correlation of perceived risk with worry was nonsignificant and total symptom burden was low.
Only one clinical sign, having a breast biopsy, was correlated significantly with cancer worry. Because of the family history of breast cancer, however, this symptom cue would be expected to reactivate a threat cognition (Easterling & Leventhal, 1989). The positive significant correlation of total clinical signs of breast cancer with cancer worry suggests that in high-risk women, a constellation of signs might be more worrisome than occurrence of a single sign or symptom. (Loescher, 2003, pp. 770–771)
The third study objective was to “evaluate the ability of clinical signs of cancer, age, and family history to predict cancer worry.” (Loescher, 2003, p. 768)
Results. Table 24-4 presents the results of a binary logistic regression predicting cancer worry (1 = low worry or 2 = worry sometimes or more). The independent variables in the equation were total signs, age (18–40, 41–50, or 51+), mother’s breast cancer history (yes or no), number of sisters with breast cancer, and number of second-degree relatives with breast cancer. This model for high and low concerns about cancer was significant (χ2 = 12.763, df = 6, p = 0.047). Significant explanatory variables of high worry were total clinical signs of breast cancer and participant age of less than 50 years. (Loescher, 2003, p. 769)
TABLE 24-4
Explanatory Variables for Thoughts about Cancer at Least Sometimes
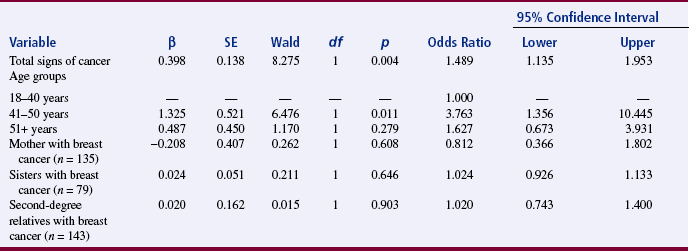
From Loescher, I. J. (2003). Cancer work in women with hereditary risk factors for breast cancer. Oncology Nursing Forum, 30(5), 771.
Findings. Women with more clinical breast symptoms were almost 1.5 times more likely to have higher levels of breast cancer worry. This finding was consistent with results of other studies of women at high risk for breast cancer (Audrain et al., 1997; Cunningham et al., 1998.) Informed women at high risk, however, may be more likely to report breast symptoms (Cunningham et al., 1998).
Age was related significantly to cancer worry, and women aged 41–50 were almost four times more likely to have high worry than other women. This age group as an explanatory variable for higher worry scores was expected and reflects the prime age when breast cancer could develop in these women (Lynch & Lynch, 1991). Younger women also may be at the age when their mothers or sisters were diagnosed with breast cancer and become concerned that they may develop cancer as well.
Other reports (Baider et al., 1999; Kash et al., 1992; Lerman et al., 1991; Lloyd et al., 1996; McCaul et al., 1998) found a positive relationship between family history and cancer worry; however, in this study, history of breast cancer in first- or second-degree relatives did not predict worry. Although this finding is difficult to explain, perhaps in this particular group of women, family history, as a stimulus instilling an abstract threat cognition, is so omnipresent that worry diminishes over time and moderate worry becomes stable. (Loescher, 2003, p. 771)
FORMING CONCLUSIONS
Conclusions are derived from the study findings and are a synthesis of findings. Forming conclusions for a study requires a combination of logical reasoning, creative formation of a meaningful whole from pieces of information obtained through data analysis and findings from previous studies, receptivity to subtle clues in the data, and use of an open context in considering alternative explanations of the data.
When forming conclusions, it is important to remember that research never proves anything; rather, research offers support for a position. Proof is a logical part of deductive reasoning, but not of the research process. Therefore, formulation of causal statements is risky. For example, the causal statement that A causes B (absolutely, in all situations) cannot be scientifically proved. It is more credible to state conclusions in the form of conditional probabilities that are qualified. For example, it would be more appropriate to state in the study that if A occurred, then B occurred under conditions x, y, and z (Kerlinger & Lee, 2000), or that B had an 80% probability of occurring. Thus, one could conclude that if preoperative teaching was provided, postoperative anxiety would be lowered as long as pain was controlled, complications did not occur, and family contacts were high. Loescher (2003) presented only tentative conclusions that are included in the statement of findings.
The methodology of the study should be examined when drawing conclusions from the findings. In spite of a researcher’s higher motives to be objective, subjective judgments and biases will sometimes creep into the conclusions. As a researcher, you will need to be alert and control subjectivity and biases. Students sometimes want positive findings so much that they will misinterpret statistical results on computer printouts as significant when they are clearly nonsignificant.
Identify the limitations of the study when forming conclusions about the findings. The limitations need to be included in the research report. Loescher (2003) provided the following discussion of limitations:
Although this study adds to the limited knowledge base of symptom-based cancer worry, this research has additional limitations. Concomitant use of other instruments that assess benign breast problems might present a more complete picture of symptoms and can induce worry. Another limitation was the lack of diversity among participants, particularly regarding ethnicity and educational and socioeconomic levels. However, women who participate in this type of research tend to be white, well educated, and financially secure (Cull et al., 2001). Continued investigations of cancer worry in a less homogenous sample of women at high risk for breast cancer will provide a better understanding of the construct. (Loescher, 2003, p. 771)
One of the risks in developing conclusions in research is going beyond the data, specifically, forming conclusions that the data do not warrant. The most common example is a study that examines relationships between A and B by correlational analysis and then concludes that A causes B. Going beyond the data is due to faulty logic and occurs more frequently in published studies than one would like to believe. Be sure to check the validity of arguments related to conclusions before revealing findings.
EXPLORING THE SIGNIFICANCE OF FINDINGS
The word significance is used in two ways in research. Statistical significance is related to quantitative analysis of the results of the study. To be important, the results of quantitative studies that use statistical analysis must be statistically significant. Statistical significance means that the results are unlikely to be due to chance. However, statistically significant results are not necessarily important in clinical practice. The results can indicate a real difference that is not necessarily an important difference clinically. For example, Yonkman (1982, p. 356), in reporting results from her study of the effect of cool or heated aerosol on oral temperature, reported that “the statistical tests yielded small values which implied that differences were statistically significant. It is not clear that these differences in temperature are clinically significant.”
The practical significance of a study is associated with its importance to nursing’s body of knowledge. Significance is not a dichotomous characteristic because studies contribute in varying degrees to the body of knowledge. Statistically nonsignificant results can have practical significance. Significance may be associated with the amount of variance explained, control in the study design to eliminate unexplained variance, or detection of statistically significant differences. You and your research team are expected to clarify the significance as much as possible. The areas of significance may be obvious to the researcher who has been immersed in the study but not to a reader or listener. Therefore, always delineate the areas of significance in your research. Determining clinical significance is a judgment based on the researcher’s clinical expertise. It is often based, in part, on whether treatment decisions or outcomes would be different in view of the study findings. A clinically significant study should result in altered decisions or actions by the nurse.
A few studies, referred to as landmark studies, become important referent points in the discipline, such as those by Johnson (1972), Lindeman and Van Aernam (1971), Passos and Brand (1966), and Williams (1972). The importance of a study may not become apparent for years after publication. However, some characteristics are associated with the significance of studies. Significant studies make an important difference in people’s lives, and the findings have external validity. Therefore, it is possible to generalize the findings far beyond the study sample so that the findings have the potential of affecting large numbers of people. The implications of significant studies go beyond concrete facts to abstractions and lead to the generation of theory or revisions in existing theory. A highly significant study has implications for one or more disciplines in addition to nursing. Others in the discipline accept the study, and it is frequently referenced in the literature. Over a period of time, the significance of a study is measured by the number of studies that it generates.
GENERALIZING THE FINDINGS
Generalization extends the implications of the findings from the sample studied to a larger population or from the situation studied to a larger situation. For example, if the study were conducted on diabetic patients, it may be possible to generalize the findings to persons with other illnesses or to well individuals. Highly controlled experimental studies, which are high in internal validity, tend to be low in generalizability because they tend to have low external validity.
How far can generalizations be made? The answer to this question is debatable. From a narrow perspective, one cannot really generalize from the sample on which the study was done. Any other sample is likely to be different in some way. The conservative position, represented by Kerlinger and Lee (2000), recommends caution in considering the extent of generalization. Conservatives consider generalization particularly risky if the sample was not randomly selected. According to Kerlinger and Lee (2000), unless special precautions are taken and efforts made, the results of research are frequently not representative and have limited generality. This statement represents the classic sampling theory position. However, as discussed in Chapter 18, generalizations are often made to abstract or theoretical populations. Thus, conclusions need to address applications to theory. Judgments about the reasonableness of generalizing need to address issues related to external validity, as discussed in Chapter 10.
Generalizations based on accumulated evidence from many studies are called empirical generalizations. These generalizations are important for verifying theoretical statements or developing new theories. Empirical generalizations are the base of a science and contribute to scientific conceptualization, which provide a basis for generating evidence-based guidelines to manage specific practice problems (Craig & Smyth, 2007). Nursing currently has limited empirical generalizations.
CONSIDERING IMPLICATIONS
Implications of research findings for nursing are the meanings of conclusions for the body of knowledge, theory, and practice. Implications are based on the conclusions and are more specific than conclusions. They provide specific suggestions for implementing the findings. You will need to consider the areas of nursing for which your study findings would be useful. For example, you might make suggestions about how nursing practice should be modified. If a study indicated that a specific solution was effective in decreasing stomatitis, the suggestion would state that the findings had implications for caring for patients with stomatitis. It would not be sufficient to state that the study had implications for nurses practicing in oncology.
Loescher (2003) suggested the following implications of her findings:
Novice researchers have a tendency to go beyond the findings to make recommendations not grounded in evidence. These may represent pre-conceived ideas that color interpretation. Experienced researchers learn to set aside their own notions and focus solely on the evidence as it presents itself. Thus, the novice researcher is wise to seek the council and advice of those more experienced in writing these last sections of the research report. Mentors are critical to learning to think through exactly how far one can go and the best approaches to making statements.
SUGGESTING FURTHER STUDIES
Completing a study and examining its implications should culminate in recommendations for future studies that emerge from the present study and from previous studies in the same area of interest. Suggested studies or recommendations for further study may include replications or repeating the design with a different or larger sample. In every study, the researcher gains knowledge and experience that can be used to design “a better study next time.” Formulating recommendations for future studies will stimulate you to define more clearly how to improve your study. From a logical or theoretical point of view, the findings should lead you directly to more hypotheses to further test the framework you are using. Improvements could involve an alternate methodology, a refined measurement tool, changes in sampling criteria, or a different setting.
Loescher (2003) provided the following suggestions for future research:
SUMMARY
• To be useful, evidence from data analysis needs to be carefully examined, organized, and given meaning; and this process is referred to as interpretation.
• Interpretation includes several intellectual activities, such as examining evidence, forming conclusions, exploring the significance of the findings, generalizing the findings, considering implications, and suggesting further studies.
• The first step in interpretation is considering all of the evidence available that supports or contradicts the validity of the results. Evidence is obtained from a variety of sources, including the research plan, measurement validity and reliability, data collection process, data analysis process, data analysis results, and previous studies.
• The outcomes of data analysis are the most direct evidence available of the results related to the research objectives, questions, or hypotheses.
• Five possible results are (1) significant results that are in keeping with those predicted by the researcher, (2) nonsignificant results, (3) significant results that are opposite those predicted by the researcher, (4) mixed results, and (5) unexpected results.
• Findings are a consequence of evaluating evidence, which includes the findings from previous studies.
• Conclusions are derived from the findings and are a synthesis of the findings.
• Implications are the meanings of study conclusions for the body of knowledge, theory, and practice.
• A study needs to be clinically or practically significant as well as statistically significant, and significance is not a dichotomous characteristic because studies contribute in varying degrees to the body of knowledge.
• Generalization extends the implications of the findings from the sample studied to a larger population.
• Completion of a study and examination of implications should culminate in recommending future studies that emerge from the present study and previous studies.
• Interpretation is a rigorous process requiring critical synthesis, self-analysis, and considerable time. Often, dialogue with a colleague or mentor helps clarify and expand meaning.
REFERENCES
Angell, M. Negative studies. New England Journal of Medicine. 1989;321(7):464–466.
Audrain, J., Schwartz, M.D., Lerman, C., Hughes, C., Peshkin, B.N., Biesecker, B. Psychological distress in women seeking genetic counseling for breast-ovarian cancer risk: The contributions of personality and appraisal. Annals of Behavioral Medicine. 1997;19(4):370–377.
Baider, L., Ever-Hadani, P., De-Nour, A.K. Psychological distress in healthy women with familial breast cancer: Like, mother, like daughter? International Journal of Psychiatry in Medicine. 1999;29(4):411–420.
Bish, A., Sutton, S., Jacobs, C., Levene, S., Ramirez, A., Hodgson, S. Changes in psychological distress after cancer genetic counseling: A comparison of affected and unaffected women. British Journal of Cancer. 2002;86(1):43–50.
Bowen, D., McTiernan, A., Burke, W., Powers, D., Pruski, J., Durfy, S., et al. Participation in breast cancer risk counseling among women with a family history. Cancer Epidemiology, Biomarkers, and Prevention. 1999;8(7):581–585.
Brain, K., Norman, P., Gray, J., Mansel, R. Anxiety and adherence to breast self-examination in women with a family history of breast cancer. Psychosomatic Medicine. 1999;61(2):181–187.
Corty, E.W. Using and interpreting statistics: A practical text for the health, behavioral, and social sciences. St. Louis, MO: Mosby, 2007.
Craig, J.V., Smyth, R.L. The evidence-based practice manual for nurses. Edinburgh: Churchill Livingstone, 2007.
Cull, A., Fry, A., Rush, R., Steel, C.M. Cancer risk perceptions and distress among women attending a familial ovarian cancer clinic. British Journal of Cancer. 2001;84(5):594–599.
Cunningham, L.L.C., Andrykowski, M.A., Wilson, J.F., McGrath, P.C., Sloan, D.A., Keady, D.E. Physical symptoms, distress, and breast cancer risk perceptions in women with benign breast problems. Health Psychology. 1998;17(4):371–375.
Diefenbach, M.A., Miller, S.M., Daly, M.B. Specific worry about breast cancer predicts mammography use in women at risk for breast and ovarian cancer. Health Psychology. 1999;18(5):532–536.
Easterling, D.V., Leventhal, H. Contributions of concrete cognition to emotion: Neutral symptoms as elicitors of worry about cancer. Journal of Applied Psychology. 1989;74(5):787–796.
Hopwood, P., Keeling, F., Long, A., Pool, C., Evans, G., Howell, A. Psychological support needs for women at high genetic risk of breast cancer: Some preliminary indicators. Psycho-Oncology. 1998;7(5):402–412.
Johnson, J.E. Effects of structuring patients’ expectations on their reactions to threatening events. Nursing Research. 1972;21(6):499–503.
Kash, K., Holland, J.C., Halper, M.S., Miller, D.G. Psychological distress and surveillance behaviors of women with a family history of breast cancer. Journal of the National Cancer Institute. 1992;84(1):24–30.
Kerlinger, F.N., Lee, H.P. Foundations of behavioral research, (4th ed.), Fort Worth, TX: Harcourt College, 2000.
Lee, B., Chaboyer, W., Wallis, M. Predictors of health-related quality of life 3 months after traumatic injury. Journal of Nursing Scholarship. 2008;40(1):83–90.
Leggatt, V., Mackay, J., Marteau, T.M., Yates, J.R.W. The psychological impact of a cancer family history questionnaire completed in general practice. Journal of Medical Genetics. 2000;37(6):470–472.
Lerman, C., Daly, M., Masny, A., Balshem, A. Attitudes about genetic testing for breast-ovarian cancer susceptibility. Journal of Clinical Oncology. 1994;12(4):843–850.
Lerman, C., Rimer, B.K., Daly, M., Lustbader, E., Sands, C., Balshem, A., et al. Recruiting high risk women into a breast cancer health promotion trial. Cancer Epidemiology, Biomarkers, and Prevention. 1994;3(3):271–276.
Lerman, C., Rimer, B.K., Engstrom, P.F. Cancer risk notification: Psychosocial and ethical implications. Journal of Clinical Oncology. 1991;9(7):1275–1282.
Lerman, C., Schwartz, M.D., Miller, S., Daly, M., Sands, C., Rimer, B.K. A randomized trial of breast cancer risk counseling: Interacting effects of counseling, educational level, and coping style. Health Psychology. 1996;15(2):75–83.
Lindeman, C.A., Van Aernam, B. Nursing intervention with the presurgical patient: The effects of structured and unstructured preoperative teaching. Nursing Research. 1971;20(4):319–332.
Lloyd, S., Watson, S., Waites, B., Meyer, L., Eeles, R., Ebbs, S., et al. Familial breast cancer: A controlled study of risk perceptions, psychological morbidity, and health beliefs in women attending for genetic counseling. British Journal of Cancer. 1996;74(3):482–487.
Loescher, L.J. Cancer worry in women with hereditary risk factors for breast cancer. Oncology Nursing Forum. 2003;30(5):767–772.
Lynch, H.T., Lynch, J.E. Familial factors and genetic predisposition to cancer: Population studies. Cancer Detection and Prevention. 1991;15(1):49–57.
McCaul, K.D., Branstetter, A.D., O’Donnell, S.M., Jacobsen, K., Quinlan, K.B. A descriptive study of breast cancer worry. Journal of Behavioral Medicine. 1998;21(6):565–579.
Passos, J.Y., Brand, L.M. Effects of agents used for oral hygiene. Nursing Research. 1966;15(3):196–202.
Pyrczak, F., Bruce, R.R. Writing empirical research reports, (5th ed.), Glendale, CA: Pyrczak, 2005.
Stein, K.F., Sargent, J.T., Rafaels, N. Intervention research: Establishing fidelity of the independent variable in nursing clinical trials. Nursing Research. 2007;56(1):54–62.
Tulman, L.R., Jacobsen, B.S. Goldilocks and variability. Nursing Research. 1989;38(6):377–379.
Weinstein, N.D. The precaution adoption process. Health Psychology. 1988;7(4):355–386.
Weinstein, N.D., Grubb, P.D., Vautier, J.S. Increasing automobile seat belt use: An intervention emphasizing risk susceptibility. Journal of Applied Psychology. 1986;71(2):285–290.
Williams, A. A study of factors contributing to skin breakdown. Nursing Research. 1972;21(3):238–243.
Yonkman, C.A. Cool and heated aerosol and the measurement of oral temperature. Nursing Research. 1982;31(6):354–357.