Chapter Sixteen Nutritional assessment
INTRODUCTION
Nutrition plays such an important part in growth, development and general health and wellbeing that every body system needs to be taken into account when considering a person’s nutritional status. In terms of relevant anatomy and physiology you will find relevant information in Chapter 13 as well as in Chapters 17, 19 and 20.
THE MOUTH
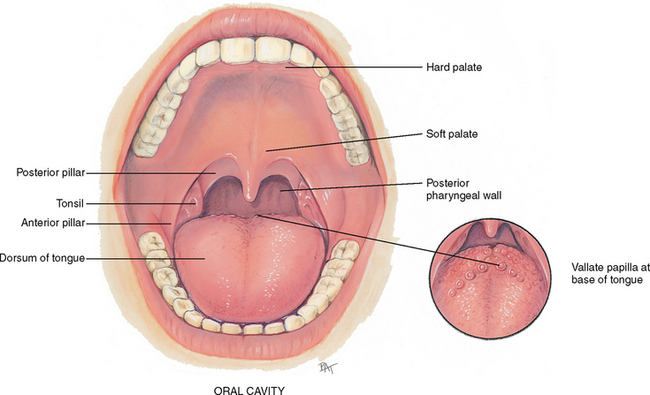
The mouth is the first segment of the digestive system and an airway for the respiratory system. The oral cavity is a short passage bordered by the lips, palate, cheeks and tongue. It contains the teeth and gums, tongue and salivary glands (Fig 16.1). Each of these structures plays an important part in the person’s ability to chew food, manage food in the mouth, begin the digestive process and swallow.
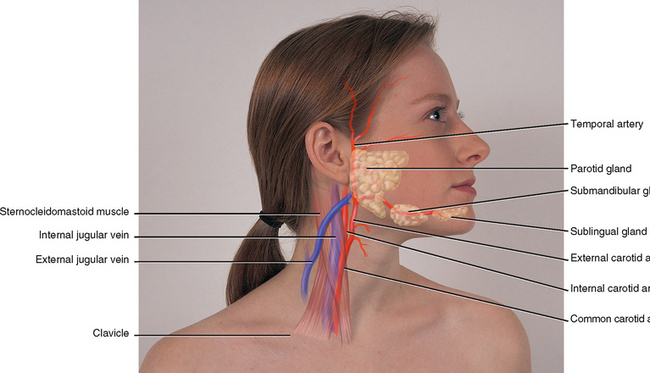
Two pairs of salivary glands are accessible to examination on the face (Fig 16.2). The parotid glands are in the cheeks over the mandible, anterior to and below the ear. They are the largest of the salivary glands but are not normally palpable. The submandibular glands are beneath the mandible at the angle of the jaw. A third pair, the sublingual glands, lie in the floor of the mouth. The temporal artery lies superior to the temporalis muscle, and its pulsation is palpable anterior to the ear.
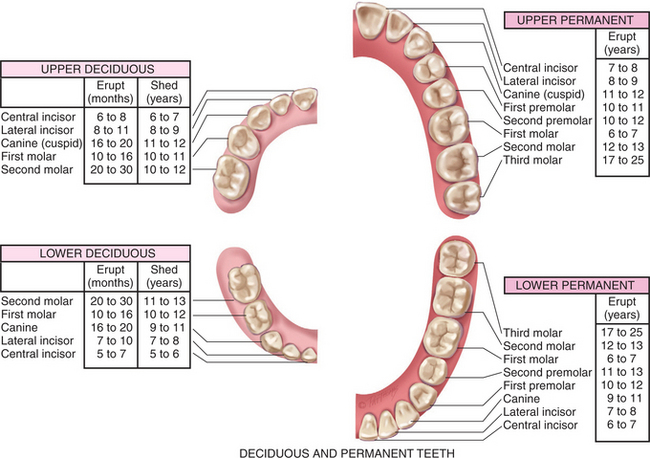
Adults have 32 permanent teeth—16 in each arch (Fig 16.3). Each tooth has three parts: the crown, the neck and the root. The gums (gingivae) collar the teeth. They are thick fibrous tissues covered with mucous membrane. The gums are different from the rest of the oral mucosa because of their pale pink colour and stippled surface.
THE THYROID GLAND
The thyroid gland is an important endocrine gland with a rich blood supply. It straddles the trachea in the middle of the neck (Fig 16.4). This highly vascular endocrine gland synthesises and secretes thyroxine (T4) and triiodothyronine (T3), hormones that stimulate the rate of cellular metabolism. The gland has two lobes, both conical in shape, each curving posteriorly between the trachea and the sternomastoid muscle. The lobes are connected in the middle by a thin isthmus lying over the second and third tracheal rings. (Sometimes a third lobe, the pyramidal lobe, is present. It is cone shaped, usually on the left, and extends up towards the hyoid bone from the isthmus or from the neighbouring lobe.)
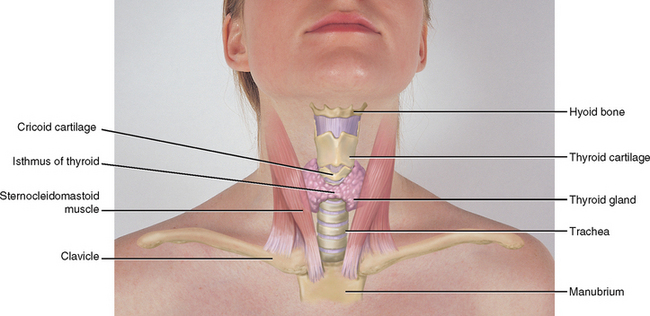
Just above the thyroid isthmus, within about 1 cm, is the cricoid cartilage or upper tracheal ring. The thyroid cartilage is above that, with a small palpable notch in its upper edge. This is the prominent ‘Adam’s apple’ in males. The highest is the hyoid bone, palpated high in the neck at the level of the floor of the mouth.
DEFINING NUTRITIONAL STATUS
Nutritional status refers to the degree of balance between nutrient intake and nutrient requirements. This balance is affected by many factors, including physiological, psychosocial, developmental, cultural and economic.
Optimal nutritional status is achieved when sufficient nutrients are consumed to support day-to-day body needs and any increased metabolic demands due to growth, pregnancy or illness. People having optimal nutritional status are more active, have fewer physical illnesses, and live longer than people who are malnourished.
Undernutrition occurs when nutritional reserves are depleted and/or when nutrient intake is inadequate to meet day-to-day needs or added metabolic demands. Vulnerable groups—infants, children, pregnant women, recent immigrants, people with low incomes, hospitalised people and people in late adulthood—are at risk for impaired growth and development, lowered resistance to infection and disease, delayed wound healing, longer hospital stays and higher healthcare costs.
Undernutrition is commonly seen as a consequence of hospital admission. In 2007 it was estimated that of 777 inpatients in Sydney hospitals 51% were malnourished (Matthews et al, 2007). The majority of patients received undernutrition as a result of being kept nil by mouth due to nonfunctioning gastrointestinal tract, preparation for a procedure or suppressed level of consciousness. Undernutrition was also related to patient-specific reasons such as dislike of the food or lack of appetite due to nausea or disease state. Infrastructural issues such as lack of staff education around nutrition, lack of staffing for feeding assistance were also identified, along with food and catering issues where menus and meals were not suitable for patients. Considering the resultant impact on patient recovery, the screening and management of nutritional risk has become a central focus, in particular within the acute and sub-acute setting.
Over-nutrition is caused by the consumption of nutrients—especially kilojoules, sodium and fat—in excess of body needs. A major nutritional problem today, over-nutrition can lead to obesity and is a risk factor for heart disease, type 2 diabetes, hypertension, stroke, gallbladder disease, sleep apnoea, certain cancers and osteoarthritis (NHLBI et al, nd). An estimated 50% of Australians and 17% of Australian children and adolescents were found to be overweight in 2006 (AIHW, 2008), while in New Zealand 16.7% of the general population and 20.1% of children were overweight (New Zealand Ministry of Health, 2006). For children, overweight is defined as a body mass index (BMI) equal to or greater than the 95th percentile based on age- and gender-specific BMI charts. For adults, overweight is defined as a BMI of 25 or greater, and obesity is defined as a BMI of 30 (CDC, nd). These data are of considerable concern because they represent notable increases during a 6-year period from 1999 to 2004 (Ogden et al, 2006). Being overweight during childhood and adolescence is associated with increased risk for becoming overweight during adulthood (NHLBI et al, nd).
DEVELOPMENTAL CONSIDERATIONS
Infants and children (birth to 12 or 13 years)
The time from birth to 4 months of age is the most rapid period of growth in the life cycle. Although infants lose weight during the first few days of life, birth weight is usually regained by the 7th to 10th day after birth. Thereafter, infants double their birth weight by 4 months and triple it by 1 year of age. Breastfeeding is recommended for full-term infants for the first year of life because breast milk is ideally formulated to promote normal infant growth and development and natural immunity. Although relatively few contraindications to breastfeeding exist, women who are human immunodeficiency virus (HIV) positive should not breastfeed, since HIV can be transmitted through breast milk. The number of kilograms gained during the second year approximates the birth weight.
Infants increase their length by 50% during the first year of life and double it by 4 years of age. Brain size also increases very rapidly during infancy and childhood. By age 2 years, the brain has reached 50% of its adult size; by age 4, 75%; and by age 8, 100%. For this reason, infants and children younger than 2 should not drink skim or low-fat milk or be placed on low-fat diets—fat (kilojoules and essential fatty acids) is required for proper growth and central nervous system development.
Adolescence (12 or 13 years to 19 years)
Following a period of slow growth in late childhood, adolescence is characterised by rapid physical growth and endocrine and hormonal changes. Energy and protein requirements increase to meet this demand, and because of bone growth and increasing muscle mass (and, in girls, the onset of menarche), calcium and iron requirements also increase. Typically, these increased requirements cannot be met by three meals per day; therefore, nutritious snacks play an important role in achieving adequate nutrient intake.
In general, boys grow taller and have less body fat than girls. In adolescence, the percentage of body fat increases in females to about 25% and decreases in males (replaced by muscle mass) to about 12%. Typically, girls double their body weight between the ages of 8 and 14; boys double their body weight between the ages of 10 and 17 years.
Pregnancy and lactation
To support the nutritional requirements of the mother and fetus, sufficient kilojoules, protein, vitamins and minerals must be consumed. Weight gain will vary between individuals and can depend on the pre-pregnancy weight and body mass index of the mother. Generally, if a woman’s body mass index is between 18.6 and 24.9 (kg/m2) she is likely to gain 11 to 16 kg. If a woman is underweight (body mass index <18.5) she is likely to gain 12.5–18 kg and if she is overweight or obese she is likely to gain 5 to 11.5 kg. To gain one or two kilograms in the first trimester is normal. Women should then gain approximately 400 g per week if in normal weight range, less than 300 g per week if overweight or obese, and 500 g per week if underweight. However, the focus should remain on a healthy diet rather than specific weight gain. In addition, dieting during pregnancy is not recommended as this may affect the development of the fetus.
Adulthood (20 to 64 years)
During adulthood, growth and nutrient needs stabilise. Most adults are in relatively good health. However, lifestyle factors such as cigarette smoking, stress, lack of exercise, excessive alcohol intake and diets high in saturated fat, cholesterol, salt and sugar and low in fibre can be factors in the development of hypertension, obesity, atherosclerosis, cancer, osteoporosis and diabetes mellitus. The adult years, therefore, are an important time for education, to preserve health and to prevent or delay the onset of chronic disease.
Late adulthood (65+ years)
As people age, a number of changes occur that make them prone to undernutrition or over-nutrition. Poor physical or mental health, social isolation, alcoholism, limited functional ability, poverty and poly-pharmacy are the major risk factors for malnutrition in older adults (Furman, 2006).
Normal physiological changes in late adulthood that directly affect nutritional status include poor dentition, decreased visual acuity, decreased saliva production, slowed gastrointestinal motility, decreased gastrointestinal absorption and diminished olfactory and taste sensitivity. Important nutritional features of the older years are a decrease in energy requirements due to loss of lean body mass, the most metabolically active tissue, and an increase in fat mass.
Socioeconomic conditions frequently have a significant effect on the nutritional status of those in late adulthood. Decline of extended families and increased mobility of families reduce available support systems. Facilities for meal preparation and eating, transportation to grocery stores, physical limitations, income and social isolation are frequent problems and can obviously interfere with the acquisition of a balanced diet. Medications must also be considered, because those in late adulthood frequently take multiple medications that have a potential for interaction with nutrients and with one another.
CULTURAL AND SOCIAL CONSIDERATIONS
As foods and eating customs are culturally distinct, each person has a unique cultural heritage that may affect nutritional status. Australia and New Zealand have had a continual influx of immigrants since the time of European settlement. Up until the second half of the twentieth century, migrants to Australia and New Zealand were overwhelmingly from the British Isles. They brought with them traditional British and Irish diets. The large-scale arrival of non-British migrants saw new foods enter Australian and New Zealand menus. Migrants from the European continent brought wine, pasta and coffee. The variety of cuisines continued to diversify throughout the latter half of the twentieth century with European, Asian, Middle Eastern and African cuisines commonly found in restaurants and homes, particularly in Australia. Over the last ten years, the increased immigration of peoples from Islamic backgrounds, from the African continent in particular, has seen a growing cultural awareness of religious food practices such as halal diets (Table 16.1).
TABLE 16.1 Religious dietary practices
| Religious group | Food restrictions |
|---|---|
| Buddhism | Dietary rules depend on the branch of Buddhism. Buddhists believe that pain inficted will rebound on to yourself; consequently some Buddhists avoid eating meat and dairy products. Some monks avoid eating in the afternoon while others are restricted from cultivating their own food and rely on donations. |
| Hinduism | Hinduism centres around the interdependence of life and karma. Many Hindus avoid eating meet (beef in particular) or foods that the manufacture of causes pain to animals. Diary products are permitted. Alcohol, garlic and onions are restricted by some as well as red-coloured foods (e.g. tomatoes). |
| Islam | Halal, or ‘lawful or permitted’, refers to food regulations as well as the way in which people conduct their lives. Foods that are forbidden or ‘haram’ include all pork and pork products; meat not slaughtered according to ritual; alcoholic beverages and alcohol products (e.g. vanilla extract), coffee and tea; food and beverages before sunset during Ramadan and other fasting rituals. |
| Judaism | Judaism can be liberal or orthodox. Kashrut are the laws pertaining to food; the most commonly recognised is kosher which refers to those foods that are permitted. Foods which are restricted are pork and pork products; meat not slaughtered according to ritual; all shellfsh (e.g. crab, lobster, shrimp, oysters); dairy products and meat at the same meal; leavened bread and cake during Passover. Feasting and fasting also occur during particular rituals. |
| Catholicism and Orthodox Christians | Orthodox Christians observe feast and fast days. Fasting or fish on Fridays can be observed, while meat is restricted in some denominations on Ash Wednesday, Good Friday and other holy days. Alcoholic beverages are restricted by some denominations. |
| Mormon and Seventh Day Adventists | Mormons and Seventh Day Adventists avoid alcoholic beverages; caffeinated beverages (e.g. coffee, tea, soft drinks) and medicines containing caffeine, stimulants or alcohol. In addition, Seventh Day Adventists avoid all port and pork products as well as shellfsh and some avoid all meat, dairy products and eggs. Some Mormons also fast on the first Sunday of each month. |
Immigrants commonly maintain traditional eating customs (especially for holidays and observance of religious customs) long after the language and manner of dress of an adopted country have become routine. Occupation, class, religion, gender and health awareness all have a great bearing on eating customs.
Newly arrived immigrants may be at nutritional risk for a variety of reasons. They have frequently emigrated from countries with limited food supplies—caused by poverty, poor sanitation, war or political strife. General undernutrition, hypertension, diarrhoea, lactose intolerance, osteomalacia (soft bones), scurvy and dental caries are among the more common nutrition-related problems of new immigrants from developing countries. In addition, barriers such as language and cultural differences can further hinder the provision of nutritional information and health promotion among these groups (Genet, 2000). The best way to learn about the eating patterns of a people is to talk with them, eat with them and ask about their dietary customs.
The cultural factors that must be considered are the cultural definition of food, frequency and number of meals eaten away from home, form and content of ceremonial meals, amount and types of foods eaten and regularity of food consumption.
As inaccuracies may occur, 24-hour food history or 3-day food diaries, traditionally used for assessment, may be inadequate when dealing with people from culturally diverse backgrounds. Standard dietary handbooks may fail to provide culture-specific diet information because nutritional content is generally based on Western diets.
Cultural variation in diets can create confusion when assessing patients. Among Vietnamese migrants, the dietary intake of calcium may appear inadequate, particularly with the low consumption of dairy products common among members of this group. Daily soups prepared by soaking bones in acidified broth or pickled or sweet and sour meats such as pork ribs (vinegar leaches calcium from the bones and makes it available to the body) are, however, commonly consumed, thus providing adequate quantities of calcium to meet daily requirements. Tofu is also a good source of calcium if calcium salts are used to precipitate the curd. In Middle Eastern countries, yoghurt and feta cheese are the major dietary sources of calcium since milk is not commonly consumed by adults. The reason for this is lactose intolerance. Ninety-five per cent of Asian Australians and Asian New Zealanders are lactose intolerant, while 84% of Indigenous Australians and 64% of New Zealand Māori are also lactose intolerant. This intolerance is least common in those of Northern European descent with 9% of New Zealand Caucasians and 17% of Australian Caucasians lactose intolerant (see http://www.lactose.com.au/info/what+is+lactose+intolerance).
Food itself is only one part of eating. In some cultures, social contacts during meals are restricted to members of the immediate or extended family. For example, in some Middle Eastern cultures, men and women eat meals separately, or women may be permitted to eat with their husbands, but not with other males. Etiquette during meals, the use of hands, type of eating utensils (e.g. chopsticks, special flatware) and protocols governing the order in which foods are consumed during a meal all vary cross culturally.
See also Chapter 13 for a discussion of cross-cultural considerations concerning the health of teeth and general oral health.
Indigenous Australians and Torres Strait Islanders
Prior to European settlement, Indigenous Australians and Torres Strait Islanders lived on traditional diets of native plants and animals which were rich in nutrients and low in fat. Specific diets depended on the area in which the community lived and were affected by seasonal changes. While some groups held permanent settlements, in coastal and river areas for example, others travelled vast distances seasonally to known food sources (www.cultureandrecreation.gov.au). The introduction of high energy and low nutrient modern diets has increased the risk of obesity, cardiovascular disease and diabetes in these and other population groups. Indigenous Australians are six times more likely to have diabetes than the general population (www.betterhealth.vic.org.au), with poor nutrition contributing to morbidity and mortality among Indigenous populations. The persistently poor diet and health status is also attributed to their low socioeconomic status, as food purchases are often restricted to cheap, high energy and nutrient poor foods (Lee et al, 2009).
Māori and Pacific Islanders
Like the Indigenous Australian population, the Māori and Pacific peoples existed on a high nutrient, low energy dense diet prior to colonisation. With the settlement of Europeans and urbanisation of New Zealand, the Māori diet and physical activity patterns changed. This led to reduced physical activity and a low nutrient, high energy diet. Māori and Pacific peoples now have a diet higher in fat and lower in vegetables than the general population. Obesity in the Māori population stands at 27%, as compared with 16.7% in the general population. Among the Pacific peoples, obesity prevalence in 1997 was 26% in Pacific men and 47% in Pacific women (New Zealand Ministry of Health, 1999). Food has a central role in the cultural life of Māori and Pacific peoples and this must be considered when developing approaches to address obesity and nutrition. In addition to the cultural issues, healthy food choices in New Zealand are significantly tied to socioeconomic status. Māori and Pacific peoples are over-represented in the low deprived groups in New Zealand and this must also be taken into consideration when addressing nutritional issues.
Dietary practices of selected cultural groups
It is necessary to avoid cultural stereotyping—the tendency to view individuals of common cultural backgrounds similarly and according to a preconceived notion of how they ‘ought’ to behave. For example, despite widely held stereotypes, we know that there are Chinese who do not like rice, Italians who dislike spaghetti, Irish who dislike corned beef and cabbage, and so forth. Aggregate dietary preferences among people from certain cultural groups, however, can be described (e.g. characteristic ethnic dishes, methods of food preparation). Cultural food preferences are often interrelated with religious dietary beliefs and practices. Many religions use foods as symbols in celebrations and rituals.
Fasting and other religious observations may limit a person’s food or liquid intake during specified times; for example, many Catholics fast and abstain from meat on Ash Wednesday and the Fridays of Lent. Muslims fast from dawn to sunset during the month of Ramadan in the Islamic calendar and eat only twice a day—before dawn and after sunset; Jews observe a 24-hour fast on Yom Kippur.
Knowing the person’s religious practices related to food enables you to suggest improvements or modifications that do not conflict with dietary laws. With widespread malnutrition in the hospital or supported care setting, it is imperative that people’s cultural food preferences are assessed in order to support optimum nutrition in this unfamiliar environment. Table 16.1 summarises dietary practices for selected religious groups.
PURPOSES AND COMPONENTS OF NUTRITIONAL ASSESSMENT
Nutritional status can be determined by the application of nutritional assessment techniques. In general, these techniques are non-invasive, inexpensive and easy to perform.
The purposes of nutritional assessment are to (1) identify individuals who are malnourished or are at risk of developing malnutrition, (2) provide data for designing a nutrition plan of care that will prevent or minimise the development of malnutrition and (3) establish baseline data for evaluating the efficacy of nutritional care.
Nutrition screening, the first step in assessing nutritional status, may be completed in any setting (e.g. general practice clinic, home, hospital, long-term care). Based on easily obtained data, nutrition screening is a quick and easy way to identify individuals at nutrition risk, such as those with weight loss, inadequate food intake or recent illness. Parameters used for nutrition screening typically include weight and weight history, conditions associated with increased nutritional risk, diet information and routine laboratory data. A variety of valid tools are available for screening different populations. For example, the Malnutrition Universal Screening Tool (MUST) has been validated in many patient groups for use both in the hospital setting as well as in the community (Malnutrition Advisory Group, 2010).
Individuals identified at nutritional risk during screening should undergo a comprehensive nutritional assessment, which includes dietary history and clinical information, physical examination for clinical signs, anthropometric measures and laboratory tests. The skills needed to collect the clinical and dietary history and to perform the physical examination are described in the Subjective data and Objective data sections that follow.
Various methods for collecting current dietary intake information are available—24-hour food history, food frequency questionnaire and food diary. During hospitalisation, documentation of nutritional intake can best be achieved through a daily food chart which identifies the type as well as the quantity of food consumed.
The easiest and most popular method for obtaining information about dietary intake is the 24-hour food history. The individual or family member completes a questionnaire or is interviewed and asked to recall everything eaten within the last 24 hours. However, several significant sources of error may occur when this method is used: (1) the individual or family member may not be able to recall the type or amount of food eaten; (2) intake within the last 24 hours may be atypical of usual intake; (3) the individual or family member may alter the truth for a variety of reasons; and (4) snack items and use of gravies, sauces and condiments may be underreported.
To counter some of the difficulties inherent in the 24-hour recall method, a food frequency questionnaire may also be completed. With this tool, information is collected on how many times per day, week or month the individual eats particular foods. Drawbacks to the use of the food frequency questionnaire are (1) it does not quantify amount of intake, and (2) like the 24-hour recall, it relies on the individual’s or family member’s memory for how often a food was eaten.
Food diaries or records require asking the individual or family member to write down everything consumed for a certain period of time. Three days—two weekdays and one weekend day—are customarily used. A food diary is most complete and accurate if the individual is instructed to record information immediately after eating. Potential problems with the food diary include (1) noncompliance, (2) inaccurate recording, (3) atypical intake on the recording days and (4) conscious alteration of diet during the recording period.
Direct observation of the feeding and eating process can lead to detection of problems not readily identified through standard nutrition interviews. For example, observing the typical feeding techniques used by a parent or caregiver and the interaction between the individual and caregiver can be of value when assessing failure to thrive in children or unintentional weight loss in older adults.
The Australian Guide to Healthy Eating and the Summary of Dietary Guidelines for an Adult are examples of guides used to encourage adequate dietary intake (Fig 16.5 and Table 16.2). The Australian and New Zealand Government websites for dietary guidelines will enable you and your clients to create individualised nutrition and health plans (see Nutrition-related websites below). The plans can be easily adapted to clients with different ages, gender, cultural backgrounds, lifestyles and health problems. For example, the estimated energy requirement for an active 2-year-old boy is 2000 kJ per day compared with 1800 kJ per day for a 2-year-old girl (NHMRC/Ministry of Health New Zealand, nd).
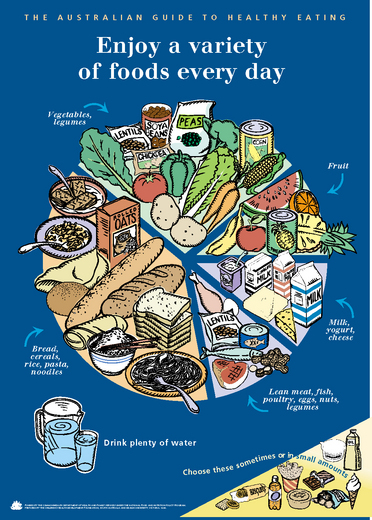
TABLE 16.2 Summary of dietary guidelines for an adult (approximately 8380 kJ per day)
| Consume 4 to 7 serves of vegetables each day (e.g. 1 medium potato, 1 cup raw). Choosing a variety of vegetables helps to provide the vitamins, minerals, antioxidants, fibre and carbohydrate that help to keep you healthy. |
| Consume 2 to 3 serves of fruit each day (e.g. 1 medium piece, 1 cup diced or canned). Choose a variety of fruits. |
| Consume 4 to 6 serves (e.g. 2 slices of bread, 1 cup rice pasta noodles) of wholegrain products per day. Limit refined carbohydrate (e.g. white bread) to under half of the daily servings. |
| Consume 2 to 3 serves of low-fat, high calcium milk products (e.g. 1 cup milk, 2 slices of cheese). |
| Consume 1 to 1.5 serves of meat, fish or eggs (e.g. 65-100 g lean meat, 80-120 g fish, 2 small eggs). Choose meats or other sources of protein that are lean, low-fat, or fat-free. |
| Fats and high sugar foods should be consumed sometimes and in small amounts and limited to 2.5 serves (e.g. 1 tsp butter, 1 can soft drink, ½ small chocolate bar). These foods may be high in fat, salt and sugar. Keep total fat intake to 20% to 35% of energy intake, most from polyunsaturated or monounsaturated fats. Limit intake of saturated fat. Keep trans fatty acid consumption as low as possible. |
| Limit alcohol intake. Men should drink no more than two standard drinks per day and women should aim for no more than one per day (e.g. 1 stubby of beer, 100 mL wine). Alcohol provides little nutrition and adds extra kilojoules. |
| Consume less than 300 mg/day of cholesterol. |
| Consume less than 1500 mg (approximately ½ tsp of salt) of sodium per day. |
| Consume potassium-rich foods, such as fruits and vegetables. |
| Consume as little added sugar (or other low kJ sweeteners) as possible. |
| Get at least 30 minutes of moderate intensity exercise on most days of the week; to lose weight or maintain weight loss, increase to 60 to 90 minutes. |
SUBJECTIVE DATA
Nutritional health is becoming an increasing focus for healthcare professionals. Subjective nutritional assessments investigate a variety of elements related to nutrition including: the person’s usual eating patterns and weight; any changes to their routine and physical status; and any underlying psychosocial or physical conditions that may impact their nutritional health. Nursing assessment of people’s nutritional status and risk is necessary to avoid the development of nutrition-associated complications such as cognitive dysfunction, fatigue, pressure ulcers and an increased susceptibility to infection. Tools such as the subjective global assessment (SGA) help to provide a nutritional assessment based on clinical judgment which assesses the many elements that can contribute to and indicate alterations in nutritional health.
3. Changes in appetite, taste, smell, chewing, swallowing
5. Recent surgery, trauma, burns, infection
7. Vomiting, diarrhoea, constipation
8. Food allergies or intolerances
9. Medications and/or nutritional supplements
11. Smoking, alcohol or nonprescription drug use
| Assessment guidelines | Clinical signifcance and clinical alerts |
|---|---|
Most individuals are knowledgeable about, or interested in, the foods they consume. If misconceptions are present, begin gradual education to enact health eating habits. Ethnic/religious beliefs or feeding difficulties may affect intake of certain foods. Alternative diets, if not closely managed, may not be nutritionally adequate. |
|
| Persons who have had a recent, unintentional weight loss or who are obese are at nutritional risk. Underweight individuals are vulnerable because their fuel reserves may be depleted. Excess weight is associated with a number of health problems, ranging from hypertension to cancer. Protein and energy needs are often overlooked in acutely ill obese persons. | |
| Persons who have had recent surgery, trauma, sepsis or conditions causing nutrient losses may have energy and nutrient needs that are two or three times greater than normal. | |
| Individuals with chronic illnesses that affect nutrient use (e.g. diabetes mellitus, pancreatitis, COPD or malabsorption) or those receiving cancer treatment are twice as likely to have nutritional defcits. | |
| Gastrointestinal symptoms such as nausea, vomiting, diarrhoea or constipation may interfere with nutrient intake or absorption. | |
Analgesics, antacids, anticonvul-sants, antibiotics, diuretics, laxatives, anti-neoplastic drugs, steroids and oral contraceptives are among the drugs that can interact with nutrients, impairing their digestion, absorption, metabolism or utilisation. Vitamin/mineral supplements may cause harmful side effects if taken in large amounts. Use of herbal/botanical supplements is commonly not reported, so ask about intake and discuss proper use and potential adverse effects. Complementary and alternative medicines can have inter actions with other medications; for information refer to National Center for Complementary and Alternative Medicine website (see websites list, p. 430). |
|
| Socioeconomic factors may interfere with the ability to purchase a range and amount of food necessary for an adequate diet. | |
These agents are often substituted for nutritious foods and increase requirements for some nutrients. Also, pregnant women who smoke, drink alcohol or use nonprescription drugs give birth to a disproportionate number of infants with low birth weights, failure to thrive and other serious complications. Chronic tobacco use is associated with tooth loss and decay and periodontal disease. Chronic tobacco use combined with heavy alcohol consumption increases risk of oral and pharyngeal cancers. |
|
| Kilojoule and nutrient needs increase with increased activity and exercise, especially competitive sports and manual labour. Inactive or sedentary lifestyles often lead to excess weight gain. | |
| Long-term nutritional deficiencies or excesses may first become manifiest as disease, such as these common examples during the adult years. Early identification of nutritional alterations permits dietary and activity modifcations to occur promptly–at a time when the body can recover more fully. | |
| Additional history for infants and children | |
| Dietary histories of infants and children are generally obtained from the child’s parents, guardian, babysitter or day care centre. Usually, the person responsible for food preparation is able to provide a fairly accurate dietary history. Having the caregivers keep a thorough daily food diary or asking the caregiver to recall the nutritional intake over the previous 24 hours during clinic visits are the most commonly employed techniques for this population group. | |
| Low birth weight (<2500 g) is a major factor in infant morbidity and mortality. Poor gestational nutrition, low maternal weight gain and maternal alcohol and drug use–all factors in low birth weight–can lead to birth defects and delayed growth and development. | |
| Well-nourished infants are more likely to have appropriate physical and social growth and development. Inexperienced mothers may have problems with breastfeeding or bottle-feeding or have questions about whether the infant is receiving adequate amounts of food. | |
| The preschool period is one of increasing growth and is the period when lifelong food habits form. Use of small portions, finger foods, simple meals and nutritious snacks are strategies to improve dietary intake. Avoid foods likely to be aspirated (e.g. hot dogs, nuts, grapes, round sweets and popcorn). | |
| Evaluate child’s self-care. Early self-care has best compliance. | |
| Additional history for the adolescent | |
| Obesity, particularly in girls, may precipitate fad dieting and malnutrition. Because of adolescents’ increased body awareness and self-consciousness, they are prone to eating disorders (anorexia nervosa or bulimia), conditions in which the real or perceived body image does not compare favourably to an ideal image found in advertisements or pictures of fashion models. | |
Once confned to male professional athletes, the use of anabolic steroids and other performance-enhancing agents now extends to middle school or intermediate, high school and university or TAFE in both males and females. Adverse effects include personality disorders (aggressiveness), liver and other organ damage. Energy boosting drinks like Red Bull, V or XS may contain large amounts of caffeine, other stimulants and/or herbal products. Side effects include dehydration, dangerously high blood pressure and heart rate and sleep problems. |
|
| An accurate dietary history may be difficult because of between-meal snacks and meals eaten on the run. These are often omitted or forgotten during the interview or in a food diary. | |
| Menarche is usually delayed if malnutrition is present. Likewise, amenorrhoea or scant menstrual fow is associated with nutritional defciency. | |
| Additional history for the pregnant female | |
| A multiparous mother with pregnancies occurring less than 1 year apart has an increased chance of depleted nutritional reserves. Note previous complications of pregnancy (excessive vomiting, anaemia or gestational diabetes). Slower gastrointestinal motility and pressure from the fetus may cause constipation, haemorrhoids and indigestion. A past history of a low-birth-weight infant suggests past nutritional problems. Giving birth to an infant weighing 4.5 kg or more may signal latent diabetes in the mother. | |
| The expectant mother is vulnerable to familial, cultural and traditional infuences for food choices. Cravings for or aversions to particular foods are common; evaluate for their potential contribution to, or interference with, dietary intake. There are certain foods that should be avoided; for more information, see the Food Standards Australia and New Zealand website in the website list below. | |
| Additional history for late adulthood (65+ years) | |
| Note any physiological or psychological changes or socioeconomic changes that affect nutritional status. | |
2. Review the ‘Determine Your Nutritional Health’ checklist (see Fig 16.6) |
The Nutritional Screening Initiative (White et al, 1991) is a three-step approach for nutrition screening of the elderly. The nutrition checklist in Figure 16.6 identifes major risk factors and indicators of poor nutritional status. Persons identifed at risk should undergo level 1 and/or level 2 screening depending on whether they are at moderate or high risk of poor nutritional status. |
Xerostomia (dry mouth) is a side effect of many drugs: antidepressants, anticholinergics, antihypertensives, anti-psychotics, bronchodilators. Self-care may be decreased by disabilities such as arthritis, vision impairment, confusion or depression. Some people add extra salt or sugar to enhance food when taste begins to wane. Diminished smell may decrease the person’s ability to detect food spoilage, gas leaks or smoke from a fire. |
OBJECTIVE DATA
Observation of an individual’s appearance—obese, cachectic (fat and muscle wasting) or oedematous—provides an overall indication of a person’s nutritional status. In addition, a variety of objective screening tests are used to guide nutritional intervention. Body mass index, the malnutrition universal screening tool and the subjective global assessment are commonly used to screen for nutritional risk. In addition to these tools, specific clinical signs can indicate nutritional deficiencies, most prominently seen in areas in which rapid turnover of epithelial tissue occurs—skin, hair, mouth, lips and eyes. These signs, however, may not be nutritional in origin and consequently laboratory testing can assist in nutritional investigation and diagnosis. Laboratory tests for assessment of nutritional status are reviewed later in this chapter. Clinical signs of various nutritional deficiencies are summarised in Table 16.3 and are depicted in the section on abnormalities at the end of this chapter (see Table 16.5).
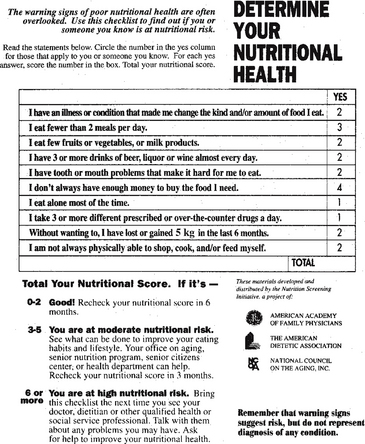
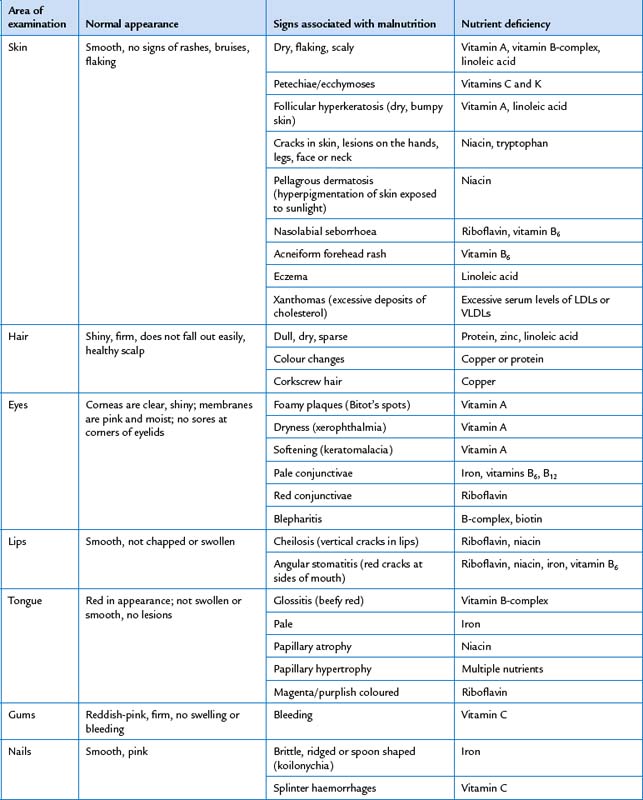
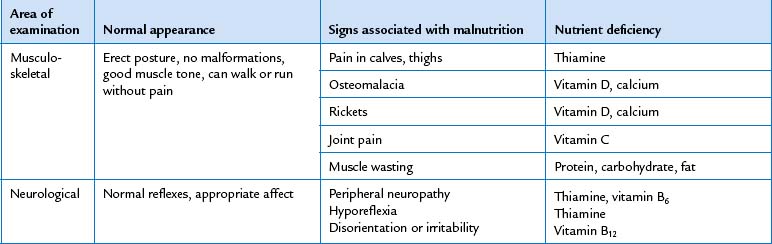
TABLE 16.5 Abnormalities due to nutritional defciencies
 |
| Pellagra |
 |
| Follicular hyperkeratosis |
| Dry, bumpy skin associated with vitamin A and/or linoleic acid (essential fatty acid) defciency. Linoleic acid defciency may also result in eczematous skin, especially in infants. |
 |
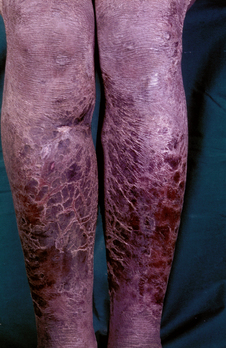
| Kwashiorkor |
| Occurs in children and adults whose diets contain mostly carbohydrate and little or no protein and are under stress (growth, parasitic or viral infections, major surgery, trauma or burns). Accompanying signs include generalised oedema, scaling areas of decreased pigmentation and decreased hair pigmentation. |
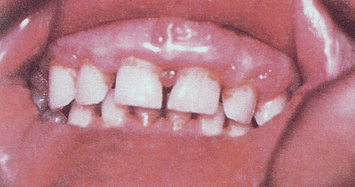 |
| Scorbutic gums |
| Defciency of vitamin C. Gums are swollen, ulcerated and bleeding due to vitamin C-induced defects in oral epithelial basement membrane and periodontal collagen fbre synthesis. |
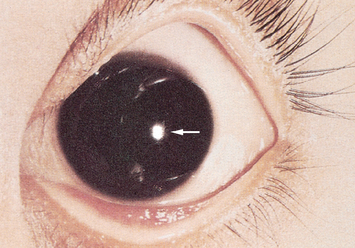 |
| Bitot’s spots |
| Foamy plaques of the cornea that are a sign of vitamin A defciency. Severe depletion may result in conjunctival xerosis (drying) and progress to corneal ulceration, and fnally destruction of the eye (keratomalacia). |
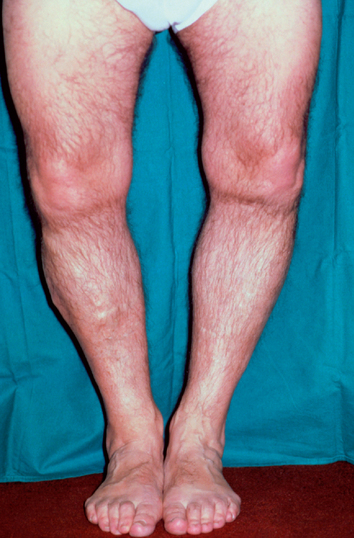 |
| Rickets |
 |
| Magenta tongue |
| ‘Magenta tongue’ is a sign of ribofavin defciency. In contrast, a pale tongue is probably attributable to iron defciency; a beefy red-coloured tongue is caused by vitamin B-complex defciency. |
| Procedures and normal findings | Abnormal findings and clinical alerts |
|---|---|
| ANTHROPOMETRIC MEASURES | |
| Anthropometry is the measurement and evaluation of growth, development and body composition. The most commonly used anthropometric measures for registered nurses are height, weight and waist-to-hip ratio. Measurement of height, weight and head circumference is described in Chapter 9. | |
| Derived weight measures | |
 |
A current weight of 80% to 90% of ideal weight suggests mild malnutrition; 70% to 80%, moderate malnutrition; and <70%, severe malnutrition. |
| A current weight of 85% to 95% of usual body weight indicates mild malnutrition; 75% to 84%, moderate malnutrition; and <75%, severe malnutrition. | |
| An unintentional loss of >5% of body weight over 1 month, >7.5% of body weight over 3 months, or >10% of body weight over 6 months is clinically signifcant. | |
| Body mass index | |
| Waist-to-hip ratio | |
| The waist-to-hip ratio assesses body fat distribution as an indicator of health risk. Obese persons with a greater proportion of fat in the upper body, especially in the abdomen, are described as presenting with android obesity; obese persons with most of their fat in the hips and thighs are described as presenting with gynoid obesity. The equation to calculate waist-to-hip ratio is: | A waist-to-hip ratio of ≥1.0 in men or ≥0.8 in women is indicative of android (upper body obesity) and increasing risk for obesity-related diseases and early mortality. |
 |
A WC >80 cm in women and >90 cm in men increases risk of cardiovascular and metabolic diseases. |
| where waist circumference (WC) is measured in centimetres at the smallest circumference below the rib cage and above the umbilicus, and hip circumference is measured in centimetres at the largest circumference of the buttocks. In addition, waist circumference alone can be used to predict greater health risk. | |
| INSPECT THE MOUTH | |
| Begin with anterior structures and move posteriorly. Use a tongue blade to retract structures and a bright light for optimal visualisation. | |
| Lips | |
| Inspect the lips for colour, moisture, cracking or lesions. Retract the lips and note their inner surface as well (Fig 16.7). | Cherry red lips may be observed in ketoacidosis. Cheilitis (perlèche)–cracking at the corners (see Table 13.2). |
| Teeth and gums | |
The condition of the teeth is an index of the person’s general health. Your examination should not replace the regular dental examination, but you should note any diseased, absent, loose or abnormally positioned teeth. The teeth normally look white, straight and evenly spaced and clean and free of debris or decay. Compare the number of teeth with the number expected for the person’s age. Ask the person to bite as if chewing something and note alignment of upper and lower jaw. Normal occlusion in the back is the upper teeth resting directly on the lowers; in the front, the upper incisors slightly override the lower incisors. |
|
| Normally, the gums look pink or coral with a stippled (dotted) surface. The gum margins at the teeth are tight and well defned. Check for swelling; retraction of gingival margins; and spongy, bleeding or discoloured gums. Dark-skinned people normally may have a dark melanotic line along the gingival margin. | Gingival hypertrophy, crevices between teeth and gums, pockets of debris. Gums bleed with slight pressure, indicating gingivitis (see Table 13.3). |
| Tongue | |
Check the tongue for colour, surface characteristics and moisture. The colour is pink and even. The dorsal surface is normally roughened from the papillae. A thin white coating may be present. Ask the person to touch the tongue to the roof of the mouth. Its ventral surface looks smooth, glistening, and shows veins. Saliva is present. If the person is able to move their own tongue ask them to move it so you can visualise the ventral and lateral surfaces. Inspect for any white patches or lesions—normally none are present. If any occur, palpate these lesions for induration. |
Beefy red swollen tongue. Smooth glossy areas (see Table 13.5). Enlarged tongue occurs with mental retardation, hypothyroidism, acro-megaly; a small tongue accompanies malnutrition. Dry mouth occurs with dehydration, fever; tongue has deep vertical fissures. Saliva is decreased while the person is taking anticholinergic and other medication. Excess saliva and drooling occur with gingivostomatitis and neurological dysfunction. |
| If the person is unconscious or otherwise unable to move their tongue on demand, with a gloved hand hold the tongue with a cotton gauze pad for traction and swing the tongue out and to each side (Fig 16.8). | |
| Inspect carefully the entire U-shaped area under the tongue behind the teeth. Oral malignancies are most likely to develop here. Note any white patches, nodules or ulcerations. If lesions are present, or with any person over 50 years old or with a positive history of smoking or alcohol use, use your gloved hand to palpate the area. Place your other hand under the jaw to stabilise the tissue and to ‘capture’ any abnormality (Fig 16.9). Note any induration. | |
| Buccal mucosa | |
Hold the cheek open with a tongue blade, and check the buccal mucosa for colour, nodules or lesions. It looks pink, smooth and moist, although patchy hyperpigmentation is common and normal in dark-skinned people. An expected finding is Stensen’s duct, the opening of the parotid salivary gland. It looks like a small dimple opposite the upper second molar. You also may see a raised occlusion line on the buccal mucosa parallel with the level the teeth meet. This is caused by the teeth closing against the cheek. A larger patch also may be present along the buccal mucosa. This is leuko-edema, a benign greyish opaque area, more common in dark-skinned people. When it is mild, the patch disappears as you stretch the cheeks. The severity of the condition increases with age, looking greyish white and thickened. The cause of the condition is unknown. Do not mistake leukoedema for oral infections such as candidiasis (thrush). |
Dappled brown patches are present with Addison’s disease (chronic adrenal insufficiency). Orifce of Stensen’s duct looks red with mumps. Koplik’s spots–early prodromal (early warning) sign of measles (see Table 13.4). |
| Fordyce’s granules are small, isolated white or yellow papules on the mucosa of cheek, tongue and lips (Fig 16.10). These little sebaceous cysts are painless and not signifcant. | The chalky white raised patch of leuco-plakia is abnormal (see Table 13.4). |
| Palate | |
| Shine your light up to the roof of the mouth. The more anterior hard palate is white with irregular transverse rugae. The posterior soft palate is pinker, smooth and upwardly movable. A normal variation is a nodular bony ridge down the middle of the hard palate, a torus palatinus (Fig 16.11). This benign growth arises after puberty in some people. Figure 16.11 uses a mirror to refect the image of the torus palatinus, which actually lies in the roof of the mouth. | The hard palate appears yellow with jaundice. In dark-skinned people with jaundice, it may look yellow, muddy yellow or green-brown. Oral Kaposi’s sarcoma is the most common early lesion in people with AIDS (see Table 13.6) |
| Observe the uvula; it normally looks like a feshy pendant hanging in the midline (Fig 16.12). Ask the person to say ‘ahhh’ and note the soft palate and uvula rise in the midline. This tests one function of cranial nerve X, the vagus nerve. | A bifid uvula looks like it is split in two (see Table 13.6). Any deviation to the side or absent movement indicates nerve damage, which might occur following a stroke or head injury. Clinical alert: this finding may indicate dysphagia. Further assessment of swallowing ability is required. |
| INSPECT THE THROAT | |
| Enlarge your view of the posterior pharyngeal wall by depressing the tongue with a tongue blade (Fig 16.13). Push down halfway back on the tongue. Press slightly off centre to avoid eliciting the gag reflex. You can help the person whose gag reflex is easily triggered by offering a tongue blade to depress their own tongue. | |
| Although usually it is not done in the screening examination, touching the posterior wall with the tongue blade elicits the gag reflex. This tests cranial nerves IX and X, the glossopharyngeal and vagus. | Part of swallowing assessment. |
| Test cranial nerve XII, the hypoglossal nerve, by asking the person to stick out the tongue. It should protrude in the midline. Note any tremor, loss of movement or deviation to the side. | |
| During the examination, notice any breath odour, halitosis. This is common and usually is due to a local cause, such as poor oral hygiene, consumption of odoriferous foods, alcohol consumption, heavy smoking or dental infection. Occasionally it may indicate a systemic disease. | Diabetic ketoacidosis has a sweet, fruity breath odour; this acetone smell also occurs in children with malnutrition or dehydration. Others are an ammonia breath odour with uraemia; a musty odour with liver disease; a foul, fetid odour with dental or respiratory infections; alcohol odour with alcohol ingestion or chemicals. |
| Blood glucose monitoring | |
| Blood glucose levels (BGL) | Refects carbohydrate metabolism. |
| Blood glucose monitoring is a test to identify blood glucose concentration. The test is performed by a finger prick. The blood sample is applied to a disposable test-strip which is inserted into a testing monitor for a calculation of the level of glucose. Because of the wide range of technologies to perform this test, it is important to be familiar with how to use available equipment, including calibration of equipment. | |
| DEVELOPMENTAL CONSIDERATIONS | |
| Infants, children and adolescents (birth to 19 years) | |
| Weight. During infancy, childhood and adolescence, height and weight should be measured at regular intervals, because longitudinal growth is one of the best indices of nutritional status over time. | |
| Body mass index. Determination of body mass index may be useful in evaluating childhood and teenage over- or undernutrition. | |
| Mouth and throat. A normal finding in infants is the sucking tubercle, a small pad in the middle of the upper lip from friction of breast- or bottle-feeding. Note the number of teeth and whether it is appropriate for the child’s age. Also note pattern of eruption, position, condition and hygiene. Use this guide for children under 2 years old; the child’s age in months minus the number 6 should equal the expected number of deciduous teeth. Normally, all 20 deciduous teeth are in by 2½ years. Saliva is present after 3 months of age and shows in excess with teething children. | Discoloured teeth appear yellow or yellow-brown with infants taking tetra-cycline or whose mothers took the drug during the last trimester; appear green or black with excessive iron ingestion, although this reverses when the iron is stopped. Malocclusion: upper or lower dental arches are out of alignment. |
| Mobility should allow the tongue to extend at least as far as the alveolar ridge. | Ankyloglossia, a short lingual frenulum, can limit protrusion and impair speech development (see Table 13.5). |
| Note any bruising or laceration on the buccal mucosa or gums of the infant or young child. | Trauma may indicate child abuse from forced feeding of bottle or spoon. |
Bednar aphthae are traumatic areas or ulcers on the posterior hard palate on either side of the midline. They result from abrasions while sucking. Insert your gloved finger into the baby’s mouth and palpate the hard and soft palate as the baby sucks. The sucking reflex can be elicited in infants up to 12 months old. |
|
| The pregnant female | |
| Gum hypertrophy (surface looks smooth and stippling disappears) may occur normally at puberty or during pregnancy (pregnancy gingivitis). | |
| Weight. Measure weight monthly up to 30 weeks gestation, then every 2 weeks until the last month of pregnancy, when weight should be measured weekly. Women should gain approximately 400 g per week if they were in normal weight range prior to pregnancy, less than 300 g per week if they were overweight or obese and 500 g per week if underweight prior to pregnancy. | Consider the expectant mother at nutritional risk if her weight is 10% or more below ideal or 20% or more above the norm for her height and age group. |
| Late adulthood (65+ years) | |
In the edentulous person the mouth and lips fold in, giving a ‘purse-string’ appearance. The teeth may look slightly yellowed, although the colour is uniform. Yellowing results from the dentin visible through worn enamel. The surface of the incisors may show vertical cracks from a lifetime of exposure to extreme temperatures. The teeth may look longer as the gum margins recede. The surfaces may look worn down or abraded. Old dental work deteriorates, especially at the gum margins. The teeth loosen with bone resorption and may move with palpation. The tongue looks smoother as a result of papillary atrophy. The older adult’s buccal mucosa is thinned and may look shinier, as though it was ‘varnished’. |
|
| Height. With age, height declines in both men and women very slowly from the early 30s, leading to an average 2.9 cm loss in men and 4.9 cm loss in women (Gabriella and Sinclair, 1997; Reuben et al, 1995). Height measures may not be accurate in individuals confned to a bed or wheelchair or those over 65 years of age (because of osteoporotic changes). Therefore, arm span (see below), which is correlated with height, may be a better measure for older people. | Body mass index and waist-to-hip ratio are better indicators of obesity in this age group. |
| OTHER MEASUREMENTS | |
| Laboratory studies | |
Routine laboratory tests are objective, can detect preclinical nutritional deficiencies and can be used to confrm subjective findings. Use caution, however, when interpreting test results that may be outside normal ranges, because they do not always refect a nutritional problem and because standards for persons in late adulthood have not yet been frmly established. The best routinely performed laboratory indicators of nutritional status are haemoglobin, haematocrit, cholesterol, triglycerides, total lymphocyte count and serum albumin. Glucose, low- and high-density lipoproteins, prealbumin, transferrin and total protein levels also provide meaningful information. |
|
| Haemoglobin. The haemoglobin determination is used to detect iron deficiency anaemia. Normal values are as follows: infants, 1 to 3 days—145 to 225 g/L, 2 months—90 to 140 g/L; children, 6 to 12 years—115 to 155 g/L; adults, males—140 to 180 g/L, females—120 to 160 g/L. | |
| Haematocrit. Haematocrit, a measure of cell volume, is also an indicator of iron status. Normal values are as follows: infants, 1 to 3 days—44% to 72%, 2 months—28% to 42%; children, 6 to 12 years—35% to 45%; adults, males—37% to 49%, females—36% to 46%. | A high haematocrit can indicate dehydration and subsequent concentration of the blood. A low value indicates insuffcient haemoglobin formation, thus haematocrit and haemoglobin values should be interpreted together. |
| Cholesterol. Total cholesterol is measured to evaluate fat metabolism and to assess the risk of cardiovascular disease. Normal cholesterol concentrations vary with age and gender. Normal cholesterol is below 4.0 mmol/L, while the ratio between low density lipoproteins and high density lipoproteins should be less than 4 (i.e. LDL:HDL = <4). | Coronary artery disease risk steadily increases as serum cholesterol rises. Serum cholesterol levels of 5.5 to 6.5 mmol/L (borderline high) are associated with moderate risk and 6.5 mmol/L or more (high) with high risk of coronary artery disease, heart attack, stroke and peripheral vascular disease. |
| Triglycerides. Serum triglycerides (TGs) are used to screen for hyperlipidaemia and to determine the risk of coronary artery disease. Triglyceride values are age related. Some controversy exists over the most appropriate normal ranges, but the following are fairly widely accepted: ages 0 to 19, 0.11 to 1.13 mmol/L; ages 20 to 65, 0.45 to 2.26 mmol/L. | Serum TG levels are also associated with coronary artery disease and are categorised as borderline, 0.5 to 1.7 mmol/L, or high, more than 1.7 mmol/L. |
| Total lymphocyte count. The most commonly used tests of immune function are total lymphocyte count (TLC) and skin testing, also called delayed cutaneous hypersensitivity testing. TLC is an important indicator of visceral protein status and therefore of cellular immune function. | |
| Non-nutritional factors that affect TLC include hypoalbuminaemia, metabolic stress (e.g. major surgery, trauma and sepsis), infection, cancer and chronic diseases. | |
| Total lymphocyte counts of 1500 to 1800 indicate mild lymphocyte depletion; 900 to 1500, moderate depletion; and less than 900, severe depletion. | |
Skin testing. Adequate immunity can also be demonstrated by a positive reaction to multiple skin test antigens. In these tests of immune function, at least six antigens are injected intradermally in the forearm area, and the response (redness and/or induration) is noted at 24 and 48 hours. A 5 mm or greater response to more than one antigen is generally considered to be a positive reaction (i.e. indicative of adequate immunity). Commonly used antigens include Candida, tetanus toxoid, diphtheria toxoid, streptococcus, old tuberculin, proteus and trichophyton. |
A response of <5 mm indicates anergy or immuno-incompetence. Anergy occurs with malnutrition, hepatic failure, infection and immunosuppressive drugs (e.g. chemotherapy agents, steroids). Lymphocytopenia and the lack of a positive response to skin test antigens increase the risk of infection and sepsis. |
| Serum proteins. Serum albumin is another common measurement of visceral protein status. Because of its relatively long half-life (17 to 20 days) and large body pool (4.0 to 5.0 g/kg), albumin is not an early indicator of protein malnutrition. | Low serum albumin levels occur with protein–kilojoule malnutrition, altered hydration status and decreased liver function. |
| Normal serum albumin concentration in infants and children older than 6 months and adults ranges from 35 to 55 g/L. | A serum albumin level of 28 to 35 g/L represents moderate visceral protein depletion, and <28 g/L denotes severe depletion (Chernecky and Berger, 2008). |
Levels of serum transferrin, an iron-transport protein, can be measured directly or by an indirect measurement of total iron-binding capacity. Serum transferrin, with a half-life of 8 to 10 days, may be a more sensitive indicator of visceral protein status than albumin. The most widely used formula for computing serum transferrin is |
Levels of 1.5 to 1.7 g/L suggest mild protein deficiency; 1.0 to 1.5 g/L, moderate deficiency; and levels less than 1.0 g/L, severe deficiency (Lee and Nieman, 2003). Because many clinical conditions can alter serum albumin and transferrin levels, consider the person’s history in conjunction with these values for accurate interpretation. |
| Prealbumin, or thyroxin-binding prealbumin, serves as a transport protein for thyroxin (T4) and retinol-binding protein. With a shorter half-life (48 hours) than either albumin or transferrin, prealbumin is sensitive to acute changes in protein status and sudden demands on protein synthesis. Normal prealbumin levels range from 150 to 250 mg/L. | Prealbumin levels are elevated in renal disease and reduced by surgery, trauma, burns and infection. Prealbumin levels of 100 to 150 mg/L indicate mild depletion; 50 to 100 mg/L, moderate depletion; and less than 50 mg/L, severe depletion. |
| C-reactive protein (CRP), a plasma protein marker of infammatory status produced by the liver, is used to monitor metabolic stress (e.g. trauma, surgery, burns) and as an indicator of when to begin nutritional support in critically ill patients. CRP is generally not detectable in the blood (<6 mg/L) of healthy individuals. | Detectable levels of CRP are associated with increased risk of atherosclerosis and may be seen in other infammatory conditions, such as infections, rheumatoid arthritis or tuberculosis. The use of oral contraceptives and the last 4 to 5 months of pregnancy may also produce detectable CRP levels. |
| Nitrogen balance. Nitrogen balance is also used as an index of protein nutritional status. Nitrogen is released with the catabolism of amino acids (proteins) and is excreted in the urine as urea. Nitrogen balance therefore indicates whether the person is anabolic (using the normal energy stores and therefore pooling proteins and nitrogen creating a positive nitrogen balance) or catabolic (breaking down proteins in tissues for energy and therefore excreting nitrogen and creating a negative nitrogen balance within the body). | |
| Nitrogen balance is estimated by a formula based on urine urea nitrogen (UUN) excreted during the previous 24 hours: | In response to stress and increased protein demand, the body rapidly mobilises its protein compartments, which results in increased production of urea and excretion of urea in the urine. With infection, an estimated loss of 9 to 11 g/day of UUN can be expected. In patients with major burns, 12 to 18 g/day of urea nitrogen may be expected in the urine (Blackburn et al, 1977). |
| where | |
| 4 = Non-urea nitrogen losses via faeces, skin, sweat and lungs, measured in grams | |
| Creatinine-height index. The creatinine-height index (CHI) is a method of estimating the amount of skeletal muscle mass. Creatinine is derived from the breakdown of creatine, an energy-containing complex found in muscle. Creatinine is excreted unchanged in the urine at a constant rate in proportion to the amount of body muscle. | |
| The validities of CHI and nitrogen balance studies are dependent on the accuracy of the 24-hour urine collection. Failure to obtain an accurate sample and abnormal renal function result in underestimation of creatinine and nitrogen losses. | |
| The person’s CHI is then compared with a CHI standard table to determine the degree of skeletal muscle depletion. | Assuming an accurate 24-hour urine specimen, a CHI of 60% to 80% of standard indicates a moderate deficit in body mass. A value of <60% indicates a severe deficit of body muscle mass (Blackburn et al, 1977). Stress, fever and trauma can increase urinary creatinine excretion. |
| DEVELOPMENTAL CONSIDERATIONS IN LABORATORY TESTING | |
In infancy and childhood, laboratory tests are performed only when undernutrition is suspected or if the child has acute or chronic illnesses that affect nutritional status. During adolescence, unless overt disease is suspected, laboratory evaluation of haemoglobin and haematocrit levels and urinalysis for glucose and protein levels are adequate. In pregnancy, haemoglobin and haematocrit values can be used to detect deficiencies of protein, folacin, vitamin B12 and iron. Urine is frequently tested for glucose and protein (albumin), which can signal diabetes, preeclampsia and renal disease. In late adulthood, all serum and urine data must be interpreted with an understanding of declining renal effciency and a tendency for people to be over-hydrated or under-hydrated. |
|
| SERIAL ASSESSMENT | |
| To monitor nutritional status in malnourished individuals or in individuals at risk for malnutrition, serial measurements of nutritional assessment parameters are made at routine intervals. At a minimum, weight and dietary intake should be evaluated weekly. Because the other nutritional assessment parameters change more slowly, data on these indicators may be collected biweekly or monthly. | Based on the findings of the nutritional assessment, the type of malnutrition can be diagnosed. The four major types of malnutrition are obesity, marasmus, kwashiorkor and marasmus/kwashiorkor mix (Table 16.4). Each type of malnutrition has characteristic clinical and laboratory findings and a distinct cause. |
| Health promotion | |
The keys to a healthy diet for adults are (a) eat a variety of foods from all the basic food groups to ensure nutrient adequacy; (b) consume the recommended amounts of fruits/vegetables, whole grains and fat-free or low-fat milk products or equivalents; (c) limit intake of foods high in saturated or trans fats, added sugars, starch, cholesterol, salt and alcohol; (d) match kilojoule intake with kilojoules expended; (e) be physically active for at least 30 minutes each day of the week; and (f) follow food safety guidelines for handling, preparing and storing foods. Approaches to weight loss for overweight and obesity must be tailored to the individual, be culturally sensitive and consider the patient’s readiness to lose weight and their healthcare and self-care beliefs. Weight loss programs that provide less than 5020 kilojoules may not provide adequate nutrients and may cause damage. Regardless of macronutrient composition, any diet that reduces kilojoule intake or contains 5860–6280 kilojoules per day results in weight loss. In other words, it is not eating too much of any particular nutrient such as carbohydrate or fat that makes us gain weight, but rather the overall number of kilojoules ingested. The cardinal features of a successful long-term weight loss plan are (a) getting regular physical exercise (i.e. 30 minutes every day); (b) eating a healthy low kJ (<6280 kilojoules per day), low fat (20–25% of total kilojoules) diet; and (c) monitoring daily food intake (e.g. food diary, portion size) and weight. |
|
| FURTHER OBJECTIVE ASSESSMENT FOR ADVANCED PRACTICE | |
| The assessments described in the following sections require advanced skill and scope of practice. Nurses working in community settings and specialised clinics may need to develop these skills. | |
| Equipment needed | |
| Anthropometric measures | |
| In addition to measures of height and weight, advanced assessment includes triceps skinfold thickness, ulnar length, elbow breadth and arm circumferences. | |
| Skinfold thickness | |
| Skinfold thickness measurements provide an estimate of body fat stores or the extent of obesity or undernutrition. Although other sites can be used (biceps, subscapular or suprailiac skinfolds), the triceps skinfold (TSF) is most commonly selected because of its easy accessibility and because standards and techniques are most developed for this site. To measure TSF thickness: | |
2. Using the thumb and forefinger of your left hand, gently grasp a fold of skin and fat on the posterior aspect of the person’s left upper arm, midway between the acromion process of the scapula and the olecranon process (the tip of the elbow). Gently pull the skinfold away from the underlying muscle (Fig 16.14). |
|
3. While grasping the skinfold, pick up the calipers with your right hand and depress the spring-loaded lever. Apply caliper jaws horizontally to the fat fold. Release the lever of the calipers while holding the skinfold. Wait 3 seconds, then take a reading. Repeat three times and average the three skinfold measurements (Fig 16.15). |
TSF values 10% below or above standard suggest undernutrition and over-nutrition, respectively. |
| Non-reproducible readings may be due to instrument malfunctions, use of plastic calipers (which are less accurate) or examiner error. Oedema may produce falsely high readings. | |
| Mid-upper arm circumference | |
| Mid-upper arm circumference (MAC) estimates skeletal muscle mass and fat stores (Fig 16.16). | |
| Measurements below the 10th percentile or above the 95th percentile warrant further medical and nutritional evaluation. Very high or very low readings may be due to examiner error. | |
| Derived anthropometric measures | |
| Although the MAC is of little value in and of itself, when combined with the TSF measurement, it is possible to indirectly determine the arm muscle circumference and arm muscle area. | |
| Mid-upper arm muscle circumference (MAMC) estimates skeletal muscle reserves or the amount of lean body mass and is derived from the TSF and MAC measures using the following formula: | MAMC is dependent on accurate measurement of the MAC and TSF. In general, a MAMC that is 90% of standard is suggestive of mild malnutrition, 60% to 90% suggests moderate malnutrition and less than 60% is indicative of severe malnutrition. |
| where | |
| Record calculation on data forms. Mid-arm muscle area (MAMA) is a good indicator of lean body mass and thus skeletal protein reserves. These reserves are important in growing children and are especially valuable in evaluating persons who may be malnourished because of chronic illness, multiple surgeries or inadequate dietary intake. | |
| The equation for calculating MAMA is | MAMA is considered to be a more sensitive measure of long-standing malnutrition than MAMC. A MAMA of 90% of standard refects mild malnutrition; 60% to 90% moderate malnutrition; and less than 60% severe malnutrition. |
 |
|
| where | |
Record calculation on data forms. Other techniques to measure body composition are bioelectrical impedance analysis (BIA) and dual-energy x-ray absorptiometry (DEXA). Both BIA and DEXA measure fat and lean body mass; in addition, DEXA measures bone mineral density (Bolanowski and Nilsson, 2001). |
|
| Ulnar length | |
| Ulnar length can be used to estimate height in those situations in which height is difficult to measure. Measure between the point of the elbow (olecranon process) and the midpoint of the prominent bone of the wrist (styloid process). | |
| Arm span or total arm length | |
| Measurement of arm span is useful for those situations in which height is difficult to measure, such as in children with cerebral palsy or scoliosis or in persons in late adulthood with spinal curvature. Arm span, which is nearly equivalent to height, is sometimes used clinically instead of height (Gabriella and Sinclair, 1997; Reuben et al, 1995). Ask the person to hold the arms straight out from the sides of the body. Measure the distance from the tip of the middle finger on one hand to that on the other hand. | |
| Frame size | |
| Frame size is calculated to determine appropriate range of ideal body weight. Most weight standards of ideal weight for height contain classifcations of weight by frame size. Elbow breadth, a measure of skeletal breadth, is the most accurate method to determine frame size (Frisancho and Flegel, 1983). To measure it, you must be familiar with the use of fat-blade sliding calipers or a broad-blade anthropometer. | |
1. Instruct the person to extend the right arm forwards, perpendicular to the body. Bend the elbow to a 90-degree angle, with the palm of the hand turned laterally (Fig 16.17). |
|
| Thyroid gland | |
| The thyroid gland is difficult to palpate; arrange your setting to maximise your likelihood of success. Position a standing lamp to shine tangentially across the neck to highlight any possible swelling. Supply the person with a glass of water, and first inspect the neck as the person takes a sip and swallows. Thyroid tissue moves up with a swallow. | Look for diffuse enlargement or a nodular lump. |
| Posterior approach. To palpate, move behind the person (Fig 16.18). Ask the person to sit up very straight and then to bend the head slightly forwards and to the right. This will relax the neck muscles. Use the fingers of your left hand to push the trachea slightly to the right. | |
| Then curve your right fingers between the trachea and the sternomastoid muscle, retracting it slightly, and ask the person to take a sip of water. The thyroid moves up under your fingers with the trachea and larynx as the person swallows. Reverse the procedure for the left side. | |
| Usually you cannot palpate the normal adult thyroid. If the person has a long, thin neck, you will sometimes feel the isthmus over the tracheal rings. The lateral lobes are not usually palpable; check them for enlargement, consistency, symmetry and the presence of nodules. | Abnormalities: enlarged lobes that are easily palpated before swallowing, or are tender to palpation; or the presence of nodules or lumps. See Table 16.7. |
| Anterior approach. This is an alternative method of palpating the thyroid, but it is more awkward to perform, especially for a beginning examiner. Stand facing the person. Ask them to tip the head forwards and to the right. Use your right thumb to displace the trachea slightly to the person’s right. Hook your left thumb and fingers around the sternomastoid muscle. Feel for lobe enlargement as the person swallows (Fig 16.19). |


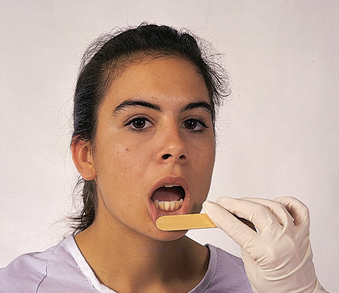
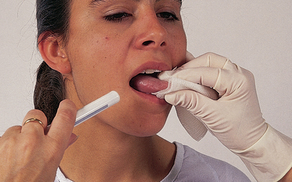
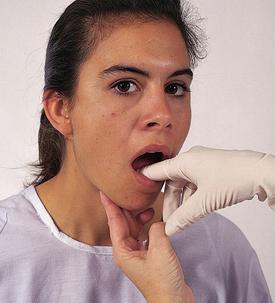
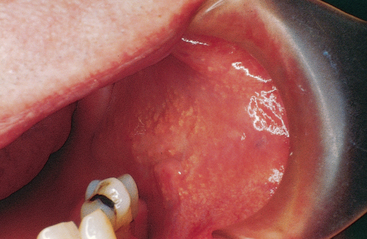
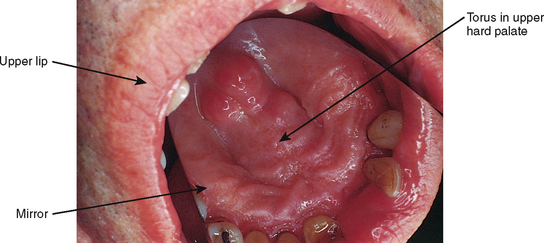
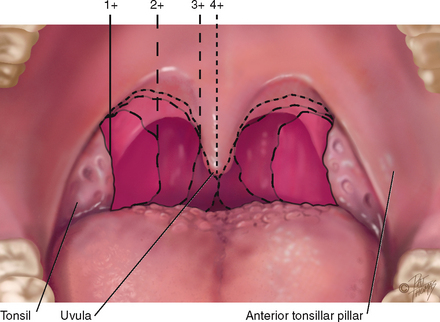
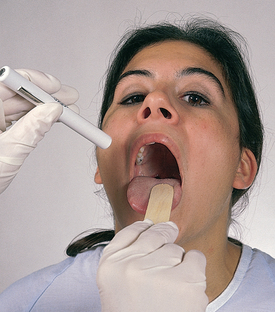
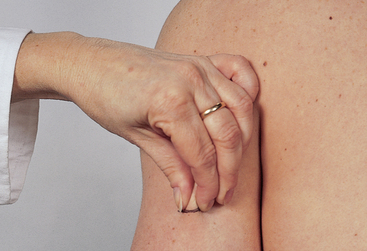
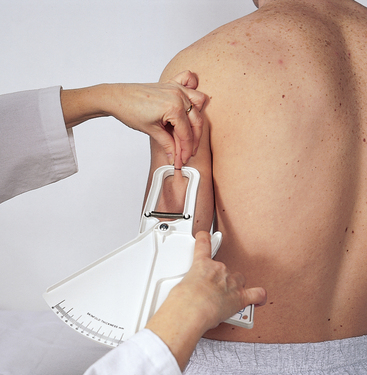
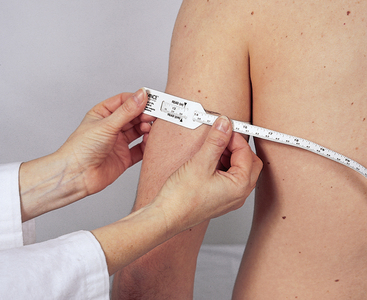

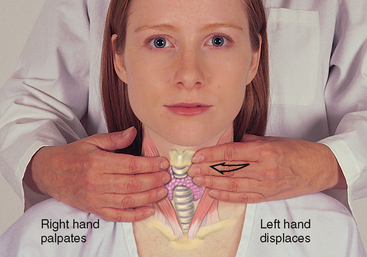
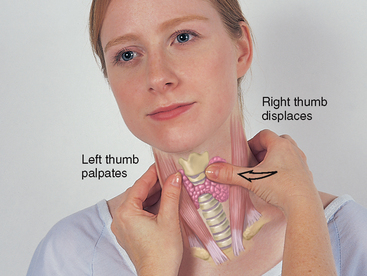
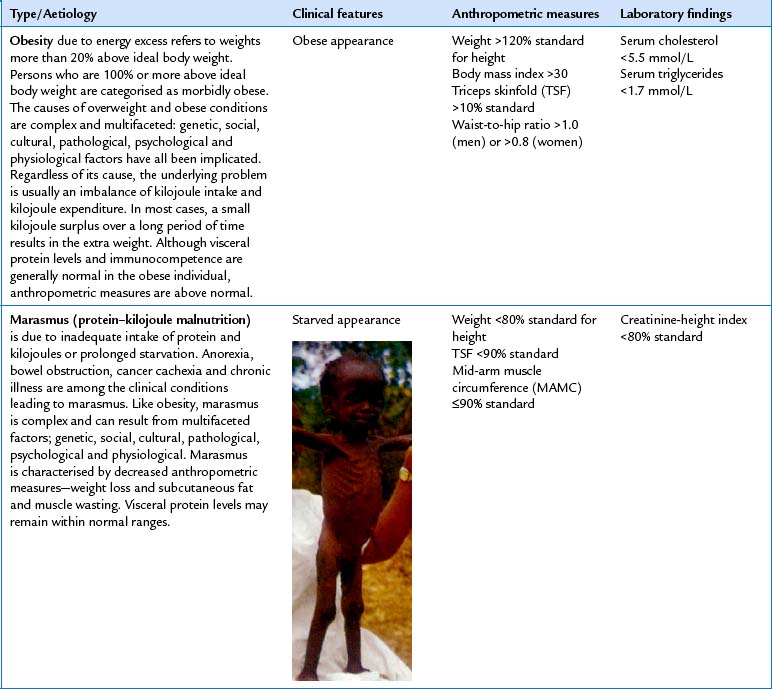
TABLE 16.7 Swellings on the neck
 |
| Thyroid—multiple nodules |
| Multiple nodules usually indicate infammation or a multi-nodular goitre rather than a neoplasm. However, suspect any rapidly enlarging or frm nodule. |
| Thyroid—single nodule (not illustrated) |
| Most solitary nodules are benign, although a solitary nodule poses a greater risk of malignancy than do multiple nodules and poses a greater risk in a young person. Suspect any painless, rapidly growing nodule, especially the appearance of a single nodule in a young person. Cancerous nodules tend to be hard and are fixed to the surrounding structures. |
Summary Checklist Nutritional assessment
1. Obtain a health history relevant to nutritional status.
2. Elicit dietary history, if indicated.
3. Inspect skin, hair, eyes, oral cavity, nails and musculoskeletal and neurological systems for clinical signs and symptoms suggestive of nutritional deficiencies.
4. Measure height, weight and other anthropometric parameters, as indicated.
DOCUMENTATION AND CRITICAL THINKING
FOCUSED ASSESSMENT: CLINICAL CASE STUDY 1
RG is a 33-year-old gay male diagnosed as HIV sero-positive 5 years ago.
Subjective
He presents to the Infectious Disease Clinic with a 2-week history of diarrhoea and anorexia, and a weight loss of 17 kg. His current daily energy intake averages 4200 kJ (his usual intake is 8400 kJ). He describes diarrhoea as ‘runny’ and occurring 4 to 6 times a day.
Objective
Inspection: Slightly raised patches resembling milk curds present in mouth and throat. General appearance is pale and cachectic.
Anthropometric: Height is 166.4 cm. Current weight is 50.9 kg; usual and ideal body weight is 68 kg. BMI—18.4.
Laboratory: Serum albumin (18.6 g/L) and total lymphocyte count (1000/mm3) are well below normal ranges. Stool is of watery consistency; stool analysis reveals Cryptosporidium infection.
FOCUSED ASSESSMENT: CLINICAL CASE STUDY 2
EF is an 87-year-old widow who lives alone in her own home. She has enjoyed good health all of her life.
Subjective
During the past year, she has experienced declining memory and no longer cooks or drives. EF now relies on her children to take her grocery shopping and prepare occasional meals. She spends her time watching television and reading. Her income is adequate for her needs. She says that she experiences occasional constipation and describes her appetite as excellent. EF eats a well-balanced diet and enjoys high-carbohydrate foods such as biscuits, lollies and cakes because they are easy to chew. Energy intake is 7500 kJ/day.
ABNORMAL FINDINGS FOR ADVANCED PRACTICE
TABLE 16.6 Metabolic syndrome (MetS)
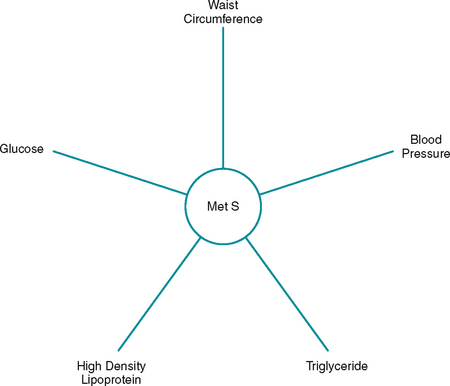 |
| A sequelae of obesity is metabolic syndrome (MetS), which is diagnosed when three or more of the following risk factors are present: (1) fasting plasma glucose level ≥110 mg/dL; (2) blood pressure >130/85; (3) waist circumference of > 90 cm for men and 80 cm for women; (4) high density lipoprotein (HDL) cholesterol >1.3 mmol/L for men and 1.5 mmol/L for women; and (5) triglyceride levels >1.7 mmol/L (ATP III, 2001). MetS is associated with increased risk for cardiovascular disease, type 2 diabetes mellitus and mortality, and its prevalence is estimated to be 28% among adolescents and 22% among adults (Ford, Giles and Dietz, 2002; Weiss et al, 2004). |
TABLE 16.8 Paediatric facial abnormalities
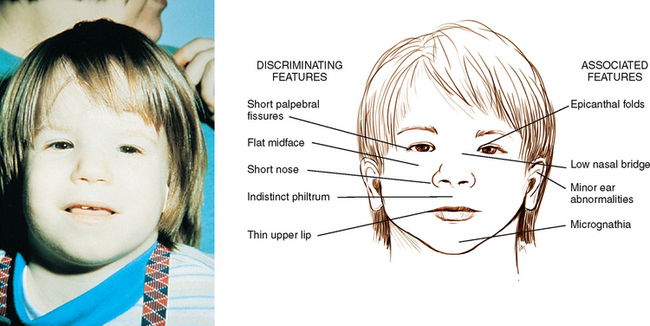 |
| Fetal alcohol syndrome |
| A pregnant woman who abuses alcohol is at great risk of producing a baby with a wide range of growth and development abnormalities. Facial malformations may be recognisable at birth. Characteristic facies include narrow palpebral fissures, epicanthal folds and midfacial hypoplasia. |
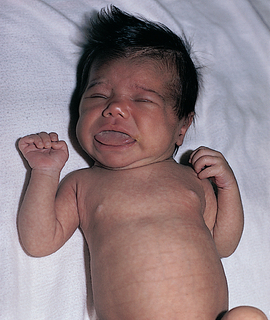 |
| Congenital hypothyroidism |
| Thyroid deficiency at an early age produces impaired growth and neurological defcit. Without neonatal screening, characteristic facies develop by 3 to 6 months of age: low hairline, hirsute forehead, swollen eyelids, narrow palpebral fissures, widely spaced eyes, depressed nasal bridge, puffy face, thick tongue protruding through an open mouth and a dull expression. Head size is normal but the anterior and posterior fontanels are wide open. |
TABLE 16.9 Abnormal facial appearances with chronic illnesses
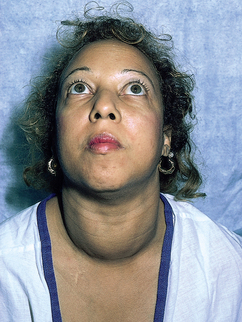 |
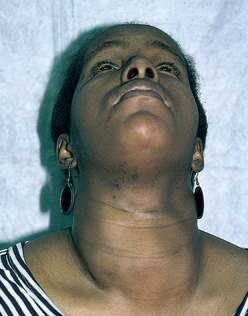
| Hyperthyroidism |
| Goitre is an increase in the size of the thyroid gland and occurs with hyperthyroidism, Hashimoto’s thyroiditis and hypothyroidism. Graves’ disease (shown here) is the most common cause of hyperthyroidism, manifested by goitre and exophthalmos (bulging eyeballs). Symptoms include nervousness, fatigue, weight loss, muscle cramps and heat intolerance; signs include tachycardia, shortness of breath, excessive sweating, fne muscle tremor, thin silky hair and skin, infrequent blinking and a staring appearance. |
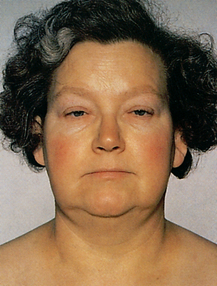 |
| Myxoedema (hypothyroidism) |
| A deficiency of thyroid hormone, when severe, causes a non-pitting oedema or myxoedema. Note puffy oedematous face, especially around eyes (periorbital oedema), coarse facial features, dry skin and dry coarse hair and eyebrows. |
Ackley B, Ladwig G. Nursing diagnosis handbook: an evidence-based guide to planning care, 8th edn. Chatswood: Elsevier, 2007.
Adult Treatment Panel III (ATP III). Executive summary of the third report of the National Cholesterol Education Program (NCEP) Expert Panel on Detection, Evaluation, and Treatment of High Blood Cholesterol in Adults. JAMA. 2001;285:2486–2497.
Australian Government Department of Health and Ageing. The Australian guide to healthy eating. Available at http://www.health.gov.au/internet/main/publishing.nsf/Content/E384CFA588B74377CA256F190004059B/$File/fd-cons.pdf, 1998.
Australian Government Department of Health and Ageing. Healthy eating recommended daily servings. Available at http://www.healthyactive.gov.au/internet/healthyactive/Publishing.nsf/Content/recommended-daily-servings.
Australian Government Department of Health and Ageing. Australian food and drink. Available at http://www.cultureandrecreation.gov.au/articles/foodanddrink/.
Australian Government Department of Health and Ageing. A healthy and active Australia. Available at http://www.healthyactive.gov.au/.
Australian Government Department of Health and Ageing. Healthy eating at various stages of life: Pregnant women. Available at http://www.health.gov.au/internet/healthyactive/publishing.nsf/Content/pregnant-women.
Australian Institute of Health and Welfare (AIHW). Making progress: the health, development and wellbeing of Australia’s children and young people. Available at http://www.aihw.gov.au/publications/phe/mp-thdawoacayp/mp-thdawoacayp-c03.pdf.
Blackburn GL, et al. Nutritional and metabolic assessment of the hospitalised patient. J Parenter Enteral Nutr. 1977;1(1):11–22.
Bolanowski M, Nilsson BE. Assessment of human body composition using dual-energy x-ray absorptiometry and bioelectrical impedance analysis. Med Sci Monit. 2001;7(5):1029–1033.
Centers for Disease Control and Prevention (CDC): (nd). Overweight and obesity: obesity trends. Available at www.cdc.gov/nccdphp/dnpa/obesity/trend/index.htm.
Centers for Disease Control and Prevention (CDC). Growth charts, National Centre for Health Statistics in collaboration with the National Centre for Chronic Disease Prevention and Health Promotion. Available at www.cdc.gov/growth_charts.
Chernecky CC, Berger BJ. Laboratory tests and diagnostic procedures, 5th edn. St Louis: Saunders, 2006.
Detsky AS, et al. What is subjective global assessment of nutritional status? J Parenteral Enteral Nutr. 1987;11(1):8–14.
DiMaria-Ghalili RA, Amella E. Nutrition in older adults: intervention and assessment can help curb the growing threat of malnutrition. Am J Nurs. 2005;105(3):40–49.
Fischbach F. A manual of laboratory and diagnostic tests, 7th edn. Philadelphia: Lippincott Williams & Wilkins, 2003.
Food Standards Australia and New Zealand (nd). Thinking about having a baby: important things you need to know about what you eat and drink. Available at http://www.foodauthority.nsw.gov.au/_Documents/consumer_pdf/pregnancy-brochure.pdf.
Ford ES, Giles WH, Dietz WH. Prevalence of the metabolic syndrome among U.S. adults: findings from the National Health and Nutrition Examination Survey. JAMA. 2002;287:356–359.
Fraser CG. Biological variation: from principles to practice. Washington DC: AAAC Press. DC, 2001.
Frisancho AR, Flegel PN. Elbow breadth as a measure of frame size for U.S. males and females. Am J Clin Nutr. 1983;31:311–314.
Frisancho AR. Anthropometric standards for the assessment of growth and nutritional status. Michigan: University of Michigan Press, 1990.
Frisancho AR. New standards of weight and body composition by frame size and height for assessment of nutritional status of adults and the elderly. Am J Clin Nutr. 1984;40:808–819.
Furman EF. Undernutrition in older adults across the continuum of care: nutritional assessment, barriers, and interventions. J Gerontol Nurs. 2006;32(1):22–27.
Gabriella SE, Sinclair AJ. Diagnosing undernutrition in elderly people. Rev Clin Gerontol. 1997;7:367–371.
Genet G. Constraints to active leisure: a guide for local authorities. Wellington: Hillary Commission, 2000.
Kondrup J, Johansen N, Plum LM, et al. Incidence of nutritional risk and causes of inadequate nutritional care in hospitals. Clin Nutr. 2002;21:461–468.
Kovacevich DS, et al. Nutrition risk classification: a valid and reproducible tool for nurses. Nutr Clin Pract. 1997;12:20–25.
Lee AJ, Leonard D, Moloney AA, et al. Improving Aboriginal and Torres Strait Islander nutrition and health. Med J Aust. 2009;190:547–548.
Lee RD, Nieman DC. Nutritional assessment, 3rd edn. New York: McGraw-Hill, 2003.
Malnutrition Advisory Group, British Association for Parenteral and Enteral Nutrition. Malnutrition Universal Screening Tool 2010. Available at http://www.bapen.org.uk/must_tool.html.
Matthews R, Bartlett L, Hall J. Nutrition matters. Patient centred nutrition project. Diagnostic report. Sydney: Northern Sydney Central Coast Area Health Service New South Wales, 2007.
National Academy of Sciences. Nutrition during lactation. Washington DC: National Academy Press, 1991.
National Academy of Sciences. Nutrition during pregnancy. Washington DC: National Academy Press, 1990.
National Health and Medical Research Council/Ministry of Health New Zealand. nd: Nutrient Values for Australia and New Zealand. Available at http://www.nrv.gov.au/energy.htm.
National Heart, Lung, and Blood Institute (NHLBI). National Institutes of Health, Department of Health and Human Services (nd): Obesity education initiative. Available at http://www.nhlbi.nih.gov/about/oei/index.htm.
National Institutes of Health. The practical guide: identification, evaluation, and treatment of overweight and obesity in adults. Washington DC: NHLBI Obesity Education Initiative, 2000. [monograph]
New South Wales Food Authority. Food safety during pregnancy. Available at http://www.foodauthority.nsw.gov.au/_Documents/consumer_pdf/pregnancy-brochure.pdf.
New Zealand Ministry of Health, A portrait of health: key results of the 2006/2007 New Zealand Health Survey. New Zealand Ministry of Health, Wellington, 2008. Available at http://www.moh.govt.nz/moh.nsf/indexmh/portrait-of-health.
New Zealand Ministry of Health. NZ food: NZ people: key results of the 1997 National Nutrition Survey. Available at http://www.moh.govt.nz/moh.nsf/pagesmh/852.
Nutrition Interventions. Manual for professionals caring for older Americans. Washington DC: Project of the American Academy of Family Physicians, The American Dietetic Association, and National Council on Aging, Nutrition Screening Initiative, 1994.
Ogden CL, et al. Prevalence of overweight and obesity in the United States, 1999–2004. JAMA. 2006;295(13):1549–1555.
Pesce-Hammond K, Wessel J. Nutrition assessment and decision making. In: Merritt R, ed. The A.S.P.E.N. nutrition support practice manual. 2nd edn. Silver Spring: The American Society for Parenteral and Enteral Nutrition; 2005:3–26.
Queensland Government. Healthy weight gain during pregnancy. Available at http://www.health.qld.gov.au/nutrition/resources/antenatal_wght.pdf.
Reuben DB, Greendale GA, Harrison GG. Nutrition screening in older persons. J Am Geriatr Soc. 1995;43(4):415–425.
Royal Australian College of Pathologists. RCPA manual: Glucose—plasma, serum, or whole blood. Available at http://rcpamanual.edu.au/index.php?option=com_pttests&task= show_test&id=531&Itemid=77..
Smith SC, et al. HA/ACC guideline for secondary prevention for patients with coronary and other atherosclerotic vascular disease: 2006 update. Circulation. 2006;113(19):2363–2372.
Spector RE. Cultural diversity in health and illness, 6th edn. Upper Saddle River: Pearson Prentice Hall, 2004.
Subcommittee on Nutritional Status and Weight Gain during Pregnancy, Food and Nutrition Board, National Academy of Sciences. Nutrition during pregnancy. Parts I and II. Washington DC: National Academy Press, 1990.
Sullivan DH, Sun S, Walls RC. Protein-energy undernutrition among elderly hospitalized patients: a prospective study. JAMA. 1999;281(21):2013–2019.
Walton KL. Treating malnutrition in hospitals: dieticians in the driving seat. Nutrition & Dietetics. 2009;66(4):202–205.
Weinsier RL, Butterworth JR. Hospital malnutrition: a prospective evaluation of general medical subjects during the course of hospitalisation. Am J Clin Nutr. 1979;32:418–426.
Weiss R, et al. Obesity and the metabolic syndrome in children and adolescents. N Engl J Med. 2004;350(23):2362–2374.
White JV, Ham RJ, Lipschitz DA. Nutrition screening initiative: toward a common view. Washington DC: Nutrition Screening Initiative, 1991. [monograph]
World Health Organization (WHO). Obesity: preventing and managing the global epidemic. Geneva: WHO, 2000.
Xu Y, Whitmer K. C-reactive protein and cardiovascular disease in people with diabetes. Am J Nurs. 2006;106(8):66–72.
Better Health Channel, www.betterhealth.vic.org.au.
Dietitians Association of Australia, http://www.daa.asn.au/.
Food Standards Australia and New Zealand, http://www.food standards.gov.au/foodstandards/nutritionpanelcalculator/.
Heart Foundation of Australia, http://www.heartfoundation.org.au/sites/HealthyEating/Pages/default.aspx?gclid=CJyHtPCfn6UCFQvgbgodPX7LfA.
Heart Foundation of New Zealand, http://www.heartfoundation.org.nz/index.asp?pageID=2145826314.
National Center for Complementary and Alternative Medicine. http://nccam.nih.gov/.
National Digestive Disease Clearing House, http://digestive.niddk.nih.gov/index.htm.
National Health and Medical Research Council—Nutritional Guidelines, http://www.nhmrc.gov.au/your_health/healthy/nutrition/guidelines.htm.
New Zealand Ministry of Health—Food and nutrition guidelines, http://www.moh.govt.nz/moh.nsf/indexmh/nutrition-foodandnutritionguidelines.
Nutrition Australia, http://www.nutritionaustralia.org/.