Chapter Nine General survey, measurement and vital signs
OBJECTIVE DATA
The general survey is a study of the whole person, covering the general health state and any obvious physical characteristics and usually forms the first part of a comprehensive physical assessment. A general survey begins from the moment you first meet the person. What leaves an immediate impression? Does the person look sick, moving slowly or with effort, with shoulders slumped and eyes without lustre or downcast? Is the hospitalised patient conversing with visitors, involved in reading or television or lying perfectly still? Even as you introduce yourself and shake hands, you collect data. Does the person fully extend the arm, shake your hand firmly, make eye contact or smile? Are the palms dry or wet and clammy?
The general survey will give you an overall impression of the person by paying attention to the following characteristics: physical appearance, body structure, mobility and behaviour. Following the general survey you will proceed through the health history, measurements and the vital signs. The sequence of the general survey may vary, depending on the circumstances. For example, if you know the person quite well, then you might focus more on behaviour, mobility and appearance. Following the general survey, your approach to measuring vital signs should include informing the person about the procedure, measuring the vital signs carefully and documenting your findings. Always remember to wash your hands before and after the procedure.
Conducting a general survey of the person each time you encounter the person will alert you to changes that may have taken place that require further assessment.
| Procedures and normal findings | Abnormal findings and clinical alerts |
|---|---|
| THE GENERAL SURVEY | |
| The aim is to determine the general state of health and whether the person appears well, chronically unwell or acutely ill. | |
| Physical appearance | |
| Observe physical appearance of the person on meeting, then throughout the collection of history information and the physical assessment and throughout the episode of care. | |
| Age—The person appears their stated age. | Appears older than stated age, as can occur with chronic illness, alcoholism, smoking. |
| Sex—Sexual development is appropriate for gender and age. | Delayed or precocious puberty. |
| Level of consciousness—The person is alert and oriented, attends to your questions and responds appropriately. | Confused, drowsy, lethargic (see Table 22.2). |
| Clinical alert: Change in conscious state requires immediate attention. | |
| Skin—Skin is intact | Bleeding or other signs of trauma must be investigated immediately. |
| Colour tone is even, pigmentation varying with genetic background, skin is intact with no obvious lesions. | |
Jaundice: yellow discolouration. Erythema: redness of the skin. Lesions (Ch 17). Cyanosis: bluish discolouration. Clinical alert: Presence of cyanosis requires immediate attention. |
|
| Facial features—Facial features are symmetrical with movement, appropriate smiling, frowning. | Immobile, mask-like, asymmetrical, drooping (see Table 22.4, Abnormalities in Cranial Nerves). |
| No signs of acute distress are present. | Respiratory signs, e.g. shortness of breath (dyspnoea) wheezing rapid breathing (tachypnoea) use of accessory muscles harsh high-pitched wheezing sound made on inspiration or expiration (stridor). Pain, indicated by facial grimace, holding body part, crying, moaning, sweating. Mental state, e.g. acute anxiety, agitation. Clinical alert: Presence of any of these signs of distress requires immediate attention. |
| Body structure | |
| Stature—The height appears within normal range for age, genetic heritage (see Measurement below). | Excessively short or tall (see Table 9.6) |
| Nutrition—The weight appears within normal range for height and body build; body fat distribution is even. | Cachectic: profoundly malnourished and emaciated. Usually associated with chronic illness, e.g. cancer. Simple obesity: even fat distribution. Centripetal (truncal) obesity: fat concentrated in face, neck, trunk, with thin extremities, as in Cushing’s syndrome (hyperadrenalism) (see Table 9.6). Please note that impressions of cachexia or obesity must be verified by objective measurement. |
| Symmetry—Body parts look equal bilaterally and are in relative proportion to each other. | |
| Posture—The person stands comfortably erect as appropriate for age. Note the normal ‘plumb line’ through anterior ear, shoulder, hip, patella, ankle. | Abnormal posture may be associated with neurological, bone or muscle disorders. Rigid spine and neck; moves as one unit (e.g. arthritis). Lordosis: an unusual inward curving of the spine in the lower part of the back Kyphosis: a permanent curvature of the spine as can be seen in the older person giving a stooped or hunched-over appearance. |
| Position—The person sits comfortably in a chair or on the bed or examination table, arms relaxed at sides, head turned to examiner. | |
| Body build, contour—Proportions are | Elongated arm span, arm span greater than height (e.g. Marfan’s syndrome, hypogonadism) (see Table 9.6). |
| 1 Arm span (fingertip to fingertip) equals height. | |
| 2 Body length from crown to pubis roughly equal to length from pubis to sole of foot. | |
| Obvious physical deformities—note any congenital or acquired defects. | Missing extremities or digits; webbed digits; shortened limb. |
| Mobility | |
| Observe the person sit, walk and change positions. | |
| Gait—Normally, the base is as wide as the shoulder width; foot placement is accurate; the walk is smooth, coordinated, even and well balanced; and associated movements, such as symmetrical arm swing, are present. | Shuffling, dragging, nonfunctional leg. Propulsion—difficulty stopping (see Table 22.7). |
| Range of motion—Note full mobility for each joint and that movement is deliberate, accurate, smooth and coordinated. (See Chs 15 and 22 for information on more detailed testing of joint range of motion.) | |
| No involuntary movement. | Tics, tremors, seizures (see Table 22.6). |
| Behaviour | |
| Observation of the facial expression, mood and affect, and quality of speech are performed at the same time as observing behaviour. Clothing and hygiene are evaluated together. | |
| Facial expression—The person maintains eye contact (unless a cultural taboo exists), expressions are appropriate to the situation, e.g. thoughtful, serious or smiling. (Note expressions both while the face is at rest and while the person is talking.) | Flat, depressed, angry, sad, anxious. However, note that anxiety is common in ill people. Be aware also that some people smile when they are anxious. |
| Mood and affect—The person is comfortable and cooperative with the examiner and interacts pleasantly. | Agitated, hostile, distrustful, suspicious, crying. |
| Speech—Articulation (the ability to form words) is clear and understandable. | Alterations in quality of speech such as dysarthria and dysphagia or garbled speech (see Table 22.3, Speech Disorders) may occur as a result of neurological disorders. |
| The stream of talking is fluent, with an even pace. | Extremes of few words or of constant talking. |
| The person conveys ideas clearly. | |
| Word choice is appropriate to culture and education. | Inappropriate use of words need to be further evaluated in a mental status and/or neurological assessment. |
| The person communicates in prevailing language easily by themself or with an interpreter. | |
| Dress—Clothing is appropriate to the climate, looks clean and fits the body and is appropriate to the person’s culture and age group. | Trousers too large and held up by belt suggest weight loss, as does the addition of new holes in belt. If the belt is moved to a looser fit, it may indicate obesity or ascites. |
| Inappropriate clothing may be related to heat/cold intolerance, mental illness or poverty. | |
| Personal hygiene—The person appears clean and groomed appropriately for their age, occupation and socioeconomic group. (Note that a wide variation of dress and hygiene is ‘normal’.) | Abnormal body odours (perspiration, urine, faeces) may be related to inadequate personal hygiene. |
| Abnormal breath odours may be observed such as alcohol, acetone, ammonia. | |
| Hair is groomed, brushed. Women’s make-up is appropriate for age and culture. | In a previously carefully groomed woman, unkempt hair and absent make-up may indicate malaise or illness. |
| MEASUREMENT | |
| Weight | |
| Use a standardised balance or electronic standing scale. Instruct the person to remove their shoes and heavy outer clothing before standing on the scale. When a sequence of repeated weights is necessary, aim for approximately the same time of day and the same type of clothing worn each time. Record the weight in kilograms. A recent weight loss may be explained by successful dieting. A weight gain usually reflects overabundant caloric intake, unhealthy eating habits and sedentary lifestyle or changes in health status. | An unexplained weight loss may be a sign of a short-term illness (e.g. fever, infection, disease of the mouth or throat) or a chronic illness (endocrine disease, malignancy, mental health dysfunction). |
| Height | |
Use a wall-mounted device or the measuring pole on the balance scale. Align the extended headpiece with the top of the head. The person should be shoeless, standing straight with gentle traction under the jaw and looking straight ahead. Feet, shoulders and buttocks should be in contact with the hard surface. For bed-bound patients, length can be assessed using a pliable measuring tape to measure the body in sections. Measurements should be taken from the heel to knee, knee to hip, hip to shoulder and shoulder to top of the head. These measurements are then totalled to determine height. |
|
| Body mass index | |
| Body mass index is a standard measure of weight for height and an indicator of overweight, obesity or protein–calorie malnutrition (see Appendix A on the Evolve website). BMI formula: | BMI interpretation for adults (Australian Government, 2008): |
| <18.5 Underweight | |
| (See World Heath Organization BMI classification website: http://apps.who.int/bmi/index.jsp?introPage=intro_3.html) | BMI interpretation for children ages 2–20 years (Centers for Disease Control, 2000): 85th to 95th percentile = risk for overweight. |
| Waist-to-hip ratio | |
| The waist-to-hip ratio assesses body fat distribution as an indicator of health risk. Obese persons with a greater proportion of fat in the upper body, especially in the abdomen, have android obesity; obese persons with most of their fat in the hips and thighs have gynoid obesity. The equation is: | A waist-to-hip ratio of ≥1.0 in men or ≥0.8 in women is indicative of android (upper body obesity) and increasing risk for obesity-related diseases and early mortality. |
| A waist circumference of >89 cm in women and >102 cm in men increases risk of type 2 diabetes and cardiovascular disease. | |
| where waist circumference is measured at the smallest circumference below the rib cage and above the iliac crest and hip circumference is measured at the largest circumference of the buttocks. In addition, waist circumference alone can be used to predict greater health risk. Measure at the end of gentle expiration. | |
| Calculate the waist-hip ratio using the following formula: | |
| For example, if a woman has a 112 cm waist and 101 cm hips, the calculation would be as follows; | |
| The desired waist-to-hip ratio for women is 0.8 or less and for men is 1.0 or less. | |
| VITAL SIGNS | |
| Traditionally, ‘vital signs’ consist of measurements of temperature, blood pressure and heart and respiratory rates. This collection of measurements is used as part of baseline assessment of patients/clients and routine monitoring of response to treatments. Pulse oximetry, wound or circulation checks and/or pain assessment may also supplement vital signs, according to patient needs. Pain is now considered to be the fifth vital sign and is covered in detail in Chapter 10. | |
| The order in which the various components of vital signs are taken varies according to patient need. The frequency of vital signs measurements will also depend on patient need, and care should be taken so that vital signs are not done unnecessarily. | |
| Interpretation of vital signs measurements is always considered in the context of the broader assessment of the person. However, where any one of the vital signs measurements is outside the parameters of normal, further assessment is critical. | |
| As with any procedure, the patient requires an explanation and hands should be washed before and after taking vital signs. | |
| Temperature | |
| Cellular metabolism requires a stable core, or ‘deep body’, temperature of a mean of 37.2°C. The body maintains a steady temperature through a thermostat, or feedback mechanism, regulated in the hypothalamus of the brain. The thermostat balances heat production (from metabolism, exercise, food digestion, external factors) with heat loss (through radiation, evaporation of sweat, convection, conduction). | The thermostatic function of the hypothalamus may become scrambled during illness or central nervous system disorders. |
| The various routes of temperature measurement reflect the body’s core temperature. The normal oral temperature in a resting person ranges between 35.8°C and 37.5°C. The rectal temperature measures 0.4°C to 0.5°C higher (Table 9.1). | |
| Body temperature normally fluctuates over the day, with the lowest levels around 4 am and the highest in the late afternoon, between 4 and 6 pm. An individual’s body temperature typically changes by about 0.5°C between its highest and lowest points each day. This is called the diurnal cycle. | Febrile: Core body temperature is elevated, e.g. >37.5°C |
| Hyperthermia or hyperpyrexia is an excessively high temperature (exceeding 39°C) and is caused by pyrogens secreted by toxic bacteria during infections or from tissue breakdown such as that following myocardial infarction, trauma, surgery or malignancy. Neurological disorders (e.g. a cerebral vascular accident, cerebral oedema, brain trauma, tumour or surgery) also can reset the brain’s thermostat at a higher level, resulting in heat production and conservation. | |
| During the menstruation cycle progesterone secretion occurs with ovulation creating a 0.15–0.45°C rise in temperature, caused by sharply elevated levels of progesterone, that continues until menses. | |
| Body temperature is influenced by: | |
| The oral temperature is accurate and convenient. The oral sublingual site has a rich blood supply from the carotid arteries that quickly responds to changes in inner core temperature. | |
| Afebrile: Core body temperature is within the normal range (35.8°C to 37.5°C). | |
| Body temperature can be measured in a variety of ways. | Hypothermia occurs when the body temperature registers between 25°C and 35°C and is usually due to accidental, prolonged exposure to cold. It may also be purposefully induced to lower the body’s oxygen requirements during heart or peripheral vascular surgery, neurosurgery, amputation or gastrointestinal haemorrhage. Physical changes that accompany hypothermia include skin and cardiovascular changes. The skin is cool to touch and capillary endothelium, damaged by prolonged exposure to the cold, becomes ‘leaky’. Oedema may result when the patient is rewarmed as plasma moves into the interstitial space from the capillaries. |
| The electronic thermometer has the advantages of swift and accurate measurement (usually in 20 to 30 seconds) as well as safe, unbreakable, disposable probe covers. The instrument must be fully charged and correctly calibrated. | |
| This type of thermometer can be placed in the mouth, axilla or rectum. | |
| Plastic strip thermometers can be placed on the forehead or in the mouth and change colour to indicate the temperature. The strip is placed on the forehead and read after 1 minute. Read it while the strip is in place. This method is the least accurate. Plastic strip thermometers are also available for the mouth. | |
| The tympanic membrane thermometer (TMT) is a noninvasive, nontraumatic device that is extremely quick and efficient. The probe tip has the shape of an otoscope, the instrument used to inspect the ear. Gently place the covered probe tip in the person’s ear canal (see Fig 9.1). Do not force it and do not occlude the canal. Activate the device and you can read the temperature in 2 to 3 seconds. Report the temperature in degrees Celsius. The tympanic membrane thermometer is not suitable for use in babies under 3 months of age. | There is minimal chance of crosscontamination with the tympanic thermometer because the ear canal is lined with skin and not mucous membrane. The tympanic thermometer has the advantages of speed, convenience, safety, reduced risk of injury and infection and noninvasiveness. |
| Environmental temperature will affect tympanic temperature measurement (Lockwood, Conroy-Hiller and Page, 2004). | |
| Remove probe cover after each use. | |
| The tympanic membrane thermometer senses infrared emissions of the tympanic membrane (eardrum). The tympanic membrane shares the same vascular supply that perfuses the hypothalamus (the internal carotid artery); thus it is an accurate measurement of core temperature (Gilbert et al, 2002). | There are a number of advantages to using tympanic thermometers including that they are minimally invasive and quick (O’Toole, 1997; Koziol-McLain, Oman and Edwards, 1996). |
| Temperature is measured in various parts of the body, depending on the available technology. | Axillary temperatures are associated with wide variation in readings (Johanna |
| The axillary temperature is a safe method of temperature assessment for infants and young children when the environment is reasonably controlled (see | Briggs Institute, 2010). |
| Developmental considerations below). The electronic thermometer is appropriate for use in the axilla. | |
| Take a rectal temperature only if no tympanic membrane thermometer equipment is available or if the other routes are not practical—for example, for comatose patients, or for those who cannot close the mouth because of breathing or oxygen tubes, wired mandible or other facial dysfunction. | Extreme care should be taken if temperature is taken via the rectum. Complications such as internal migration of broken thermometers and rectal perforation have occurred (Lockwood et al, 2004). |
| Wear gloves and insert a lubricated rectal probe cover on an electronic thermometer only 2 to 3 cm into the adult rectum, directed towards the umbilicus. | |
| Disadvantages to the rectal route are patient discomfort and the time-consuming and intrusive nature of the activity. | |
| Pulse | |
| With every beat, the heart pumps an amount of blood—the stroke volume—into the aorta. This is about 70 mL in the adult. The force flares the arterial walls and generates a pressure wave, which is felt in the periphery as the pulse. Palpating the peripheral pulse gives the rate and rhythm of the heartbeat, as well as local data on the condition of the artery. The radial pulse is usually palpated when measuring vital signs. | |
| Using the pads of your first three fingers, palpate the radial pulse at the flexor aspect of the wrist laterally along the radius bone (Fig 9.2). Push until you feel the strongest pulsation. While it is recommended to count for 60 seconds, if the rhythm is regular, count the number of beats in 30 seconds and multiply by 2. Although the 15-second interval is frequently practised, it is not recommended as any one-beat error in counting results in a recorded error of four beats per minute. The 30-second interval is the most accurate and efficient when heart rates are normal or rapid and when rhythms are regular. However, if the rhythm is irregular, count for a full minute. As you begin the counting interval, start your count with ‘zero’ for the first pulse felt. The second pulse felt is ‘one’, and so on. Assess the pulse, including (1) rate, (2) rhythm, (3) force and (4) elasticity. | The thumb should not be used to palpate the radial pulse because it has its own pulse. |
| Press firmly but not so hard as to obliterate the pulse | |
| Should difficulty be encountered with taking a peripheral pulse, e.g. faint or irregular rhythm, then an apical rate should be taken. | |
| Rate | |
| In the resting adult, the normal heart rate range is 60 to 100 beats per minute (bpm). The rate normally varies with age, being more rapid in infancy and childhood and more moderate during adult and older years. The rate also varies with gender; after puberty, females have a slightly faster rate than males (Table 9.2). | In the adult, a heart rate less than 60 bpm is bradycardia. This occurs normally in the well-trained athlete whose heart muscle develops along with the skeletal muscles. The stronger, more efficient heart muscle pushes out a larger stroke volume with each beat, thus requiring fewer beats per minute to maintain a stable cardiac output. (Review the equation CO = SV × R, or Cardiac output = Stroke volume × Rate, in Ch 12.) A more rapid heart rate, over 100 bpm, is tachycardia. Further assessment of abnormal pulse rates should be determined by auscultation of the apical pulse. |
| For descriptions of abnormal rates and rhythms, see Table 11.1. | |
| Tachycardia occurs in response to exercise but also with anxiety, fever, sepsis and following myocardial infarction and certain medications. | |
| Rhythm | |
| The rhythm of the pulse normally has an even tempo. | An irregular rhythm indicates a cardiac dysrhythmia. |
| One irregularity that is commonly found in children and young adults is sinus arrhythmia. Here the heart rate varies with the respiratory cycle, speeding up at the peak of inspiration and slowing to normal with expiration. Inspiration momentarily causes a decreased stroke volume from the left side of the heart; to compensate, the heart rate increases. (See Ch 12 for a full discussion of sinus arrhythmia.) If any other irregularities are felt, auscultate heart sounds for a more complete assessment (Ch 12). | |
| Force | |
| The force of the pulse shows the strength of the heart’s stroke volume. The pulse force is recorded using a three-point scale: | A ‘weak, thready’ pulse reflects a decreased stroke volume (e.g. as occurs with haemorrhagic shock). A ‘full, bounding’ pulse denotes an increased stroke volume, as with anxiety, exercise and some abnormal conditions. |
| 3+—Full, bounding | |
| 2+—Normal | |
| 1+—Weak, thready | |
| 0—Absent | |
| Some agencies use a four-point scale; make sure your system is consistent with that used by the rest of your staff. Either scale is somewhat subjective. | |
| Experience will increase your clinical judgment. | |
| Elasticity | |
| With normal elasticity, the artery feels springy, straight, resilient. | |
| Chapter 12 presents assessment of the praecordium, including listening to the heart rate and rhythm as well as the quality of heart sounds. Chapter 11 presents further data on other pulse sites. | |
| Respirations | |
| Normally, a person’s breathing is relaxed, regular, automatic and silent. Because most people are unaware of their breathing, do not mention that you will be counting the respirations, because sudden awareness may alter the normal pattern. Instead, maintain your position of counting the radial pulse and unob-trusively count the respirations. Count for 30 seconds or for a full minute if you suspect an abnormality. Avoid the 15-second interval. The result can vary by a factor of ± 4, which is significant with such a small number. Apart from observing the rate of breathing the examiner can also place their hand on the chest. | The optimal method of respiratory rate count involves counting for one full minute, using a stethoscope against the chest when respiratory rate is rapid to ensure all breaths are counted, and counting respiratory rate when the patient is at rest. |
| An abnormal respiratory rate can be a predictor of a potentially serious condition. Changes in respiration rate can be a very important indicator of patient deterioration. | |
| Note that respiratory rates presented in Table 9.3 are normally more rapid in infants and children. Also, a fairly constant ratio of pulse rate to respiratory rate exists, which is about 4:1. Normally, both pulse and respiratory rates rise as a response to exercise or anxiety. More detailed assessment on respiratory status is presented in Chapter 14. | |
| Blood pressure | |
| Blood pressure (BP) is the force of the blood pushing against the side of its container, the vessel wall. The strength of the push changes with the event in the cardiac cycle. The systolic pressure is the maximum pressure felt on the artery during left ventricular contraction, or systole. The diastolic pressure is the elastic recoil, or resting, pressure that the blood exerts constantly between each contraction. The pulse pressure is the difference between the systolic and diastolic and reflects the stroke volume (Fig 9.3). The mean arterial pressure (MAP) is the pressure forcing blood into the tissues, averaged over the cardiac cycle. This is not an arithmetic average of systolic and diastolic pressures because diastole lasts longer. Rather, it is a value closer to diastolic pressure plus one-third the pulse pressure. | |
The average BP in the young adult is 120/80 mmHg, although this varies normally with many factors, such as: • Age. Normally, a gradual rise occurs through childhood and into the adult years (see Fig 9.4). • Gender. Before puberty, no difference exists between males and females. After puberty, females usually show a lower BP reading than do male counterparts. After menopause, BP in females is higher than in male counterparts. • Diurnal rhythm. A daily cycle of a peak and a trough occurs: the BP climbs to a high in late afternoon or early evening and then declines to an early morning low. • Weight. BP is higher in obese persons than in persons of normal weight of the same age (including adolescents). • Exercise. Increasing activity yields a proportionate increase in BP. Within 5 minutes of terminating the exercise, the BP normally returns to baseline. • Emotions. The BP momentarily rises with fear, anger and pain as a result of stimulation of the sympathetic nervous system. • Stress. The BP is elevated in persons feeling continual tension because of lifestyle, occupational stress or life problems. The level of BP is determined by five factors: |
|
| 1 Cardiac output. If the heart pumps more blood into the container (i.e. the blood vessels), the pressure on the container walls increases (Fig 9.5). | |
| Illustration Copyright Pat Thomas, © 2006. | |
| 2 Peripheral vascular resistance. Peripheral vascular resistance is the opposition to blood flow through the arteries. When the container becomes smaller (e.g. such as with constricted vessels), the pressure needed to push the contents becomes greater. | |
| 3 Volume of circulating blood. Volume of circulating blood refers to how tightly the blood is packed into the arteries. Increasing the contents in the container increases the pressure. | |
| 4 Viscosity. The ‘thickness’ of blood is determined by its formed elements, the blood cells. When the contents are thicker, the pressure increases. | |
| 5 Elasticity of vessel walls. When the container walls are stiff and rigid, the pressure needed to push the contents increases. | |
| Blood pressure is measured with a stethoscope and an aneroid sphygmoma-nometer. The aneroid gauge is subject to drift; it must be recalibrated at least once each year and it must rest at zero. | Regular maintenance and calibration of mercury sphygmomanometers, aneroid manometers or electronic devices is required to ensure accuracy of readings (Lockwood et al, 2004). |
| The cuff consists of an inflatable rubber bladder inside a cloth cover. The width of the rubber bladder should equal 40% of the circumference of the person’s arm. The length of the bladder should equal 80% of this circumference. | lll-fitting or wider cuffs deliver false low readings and narrow cuffs give a false high reading (O’Brien and Davison, 1994). |
| Available cuffs include six sizes that fit newborn infants to the extra-large adult, as well as tapered cuffs for the cone-shaped obese arm and thigh cuffs. Match the appropriate size cuff to the person’s arm size and shape and not to the person’s age (Fig 9.6). | The cuff size is important; using a cuff that is too narrow yields a falsely high BP because it takes extra pressure to compress the artery. If the cuff is too wide a false low BP reading will result |
| Arm pressure | |
| A comfortable, relaxed person yields a valid blood pressure. Many people are anxious at the beginning of an examination; allow at least a 5-minute rest before measuring the BP. Then take two or more BP measurements separated by 2 minutes. | |
| For each person, verify BP in both arms once, either on admission or for the first complete physical examination. It is not necessary to continue to check both arms for screening or monitoring. Occasionally a 5 to 10 mmHg difference may occur in BP in the two arms (if values are different, use the higher value). | A difference in the two arms of more than 10 to 15 mmHg may indicate arterial obstruction on the side with the lower reading. |
| The person may be sitting or lying, with the bare arm supported at heart level. (If used, place the mercury manometer so that it is vertical and at your eye level.) When sitting, the patient’s feet should be flat on the floor because BP has a false high measurement when legs are crossed versus uncrossed (van Groningen et al, 2008). | Wait up to 5 minutes before taking a blood pressure following exertion or position change by the patient. |
| Palpate the brachial artery, which is located just above the antecubital fossa, medial to the biceps tendon. With the cuff deflated, centre it about 2.5 cm above the brachial artery and wrap it evenly. | |
| Now palpate the brachial or the radial artery (Fig 9.7). Inflate the cuff until the artery pulsation is obliterated and then 20 to 30 mmHg beyond. This will avoid missing an auscultatory gap, which is a period when Korotkoff sounds dis appear during auscultation (Table 9.4). | An auscultatory gap occurs in about 5% of people, most often in hypertension caused by a noncompliant arterial system. |
| Deflate the cuff quickly and completely; then wait 15 to 30 seconds before reinflating so that the blood trapped in the veins can dissipate. Place the bell of the stethoscope over the site of the brachial artery, making a light but airtight seal (Fig 9.8). The diaphragm endpiece is usually adequate, but the bell is designed to pick up low-pitched sounds such as the sounds of a blood pressure reading. So if you have a bell, use it. | Blood pressure measurement is more accurate when using the bell rather than the diaphragm of the stethoscope (Lockwood et al, 2004). |
| Rapidly inflate the cuff to the maximal inflation level you determined. Then deflate the cuff slowly and evenly, about 2 mmHg per heartbeat. Note the points at which you hear the first appearance of sound, the muffling of sound and the final disappearance of sound. These are phases I, IV and V of Korotkoff sounds, which are the components of a BP reading first described by a Russian surgeon in 1905 (see Table 9.4). | |
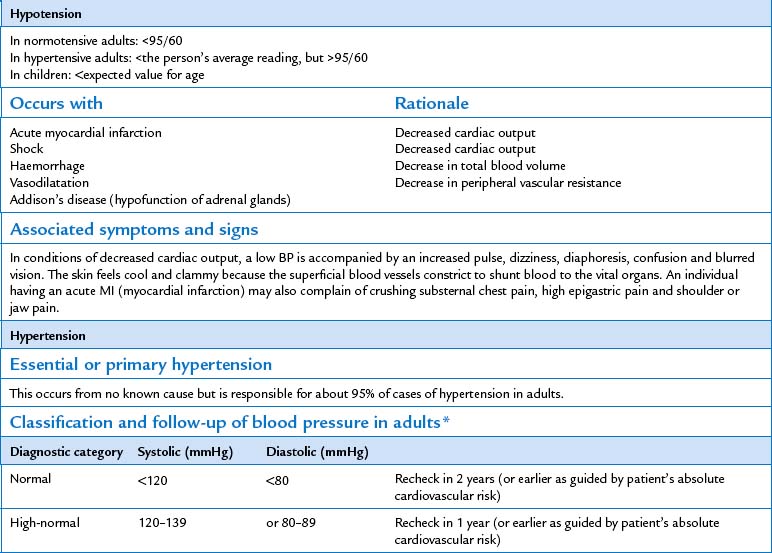
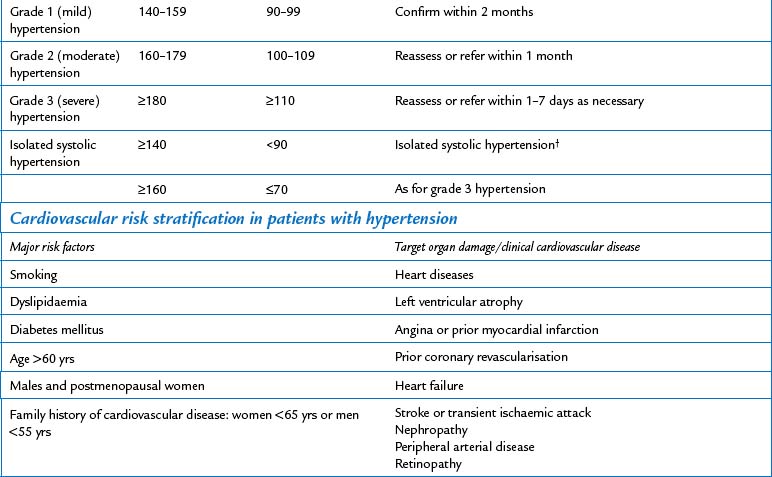
| For all age-groups, the fifth Korotkoff phase is used to define diastolic pressure However, when a variance greater than 10 to 12 mmHg exists between phases IV and V, record both phases along with the systolic reading (e.g. 142/98/80). Clear communication is important because the results significantly affect diagnosis and planning of care. See Table 9.5 for a list of common errors in blood pressure measurement. | Hypotension, abnormally low BP; hypertension, abnormally high BP (see parameters in Table 9.7). |
| Blood pressure can also be measured electronically. The electronic device is attached to a blood pressure cuff. Sensors in the blood pressure cuff sense blood flow vibrations and convert them into electric impulses which are translated to a digital readout. The readings provided by the electronic device include blood pressure, mean arterial pressure and pulse rate. A stethoscope is not required when using an electronic blood pressure device. | Electronic blood pressure devices are not capable of evaluating the quality of the pulse, i.e. intensity or rhythm. |
| The device can be programmed to alarm should the blood pressure vary from desired limits. | |
| Orthostatic (or postural) vital signs | |
| Take serial measurements of pulse and blood pressure when: you suspect volume depletion; when the person is known to have hypertension or is taking antihypertensive medications; or when the person reports fainting or syncope. Have the person rest supine for 2 or 3 minutes, take baseline readings of pulse and BP, then repeat the measurements with the person sitting, then standing. For the person who is too weak or dizzy to stand, assess supine and then sitting with legs dangling. When the position is changed from supine to standing, normally a slight decrease (less than 10 mmHg) in systolic pressure may occur. | Orthostatic hypotension, a drop in systolic pressure of more than 20 mmHg, or orthostatic pulse increases of 20 bpm or more, occurs with a quick change to a standing position. These changes are due to abrupt peripheral vasodilatation without a compensatory increase in cardiac output. Orthostatic changes also occur with prolonged bedrest, older age, hypovolaemia and some drugs. |
| Record the BP by using even numbers. Also record the person’s position, the arm used and the cuff size, if different from the standard adult cuff. Record the pulse rate and rhythm, noting whether the pulse is regular. | |
| Thigh pressure | |
| When BP measured at the arm is excessively high, particularly in adolescents and young adults, compare it with the thigh pressure. Normally, the thigh pressure is higher than that in the arm. If possible, turn the person into the prone position on the abdomen. (If the person must remain in the supine position, bend the knee slightly.) Wrap a large cuff, 18 to 20 cm, around the lower third of the thigh, centred over the popliteal artery on the back of the knee. Auscultate the popliteal artery for the reading (Fig 9.9). Normally, the systolic value is 10 to 40 mmHg higher in the thigh than in the arm, and the diastolic pressure is the same. | With coarctation of the aorta, arm pressures are high. Thigh pressure is lower because the blood supply to the thigh is below the constriction. |
| DEVELOPMENTAL CONSIDERATIONS | |
| Infants and children | |
| General survey | |
| Physical appearance, body structure, mobility—Note the same basic elements as with the adult, with consideration to age and development. Exceptions are the standing toddler who has a normally protuberant abdomen (‘toddler lordosis’). Behaviour—Note the response to stimuli and level of alertness appropriate for age. | |
| Parental bonding—Note the child’s interactions with parents, that parent and child show a mutual response and are warm and affectionate, appropriate to the child’s condition. The parent provides appropriate physical care of child and promotes new learning. | Some signs of child abuse are that the child avoids eye contact; the child exhibits no separation anxiety when you would expect it for age; the parent is disgusted by child’s odour, sounds, drooling or stools. |
| Deprivation of physical or emotional care (Ch 5). | |
| Measurement | |
| Weight. Weigh an infant on an electronic scale. Guard the baby so that they do not fall. Weigh to the nearest 10 g for infants and 100 g for toddlers. | |
| By age 2 or 3 years, use the upright scale. Leave underpants on the child. Some young children are fearful of the rickety standing platform and may prefer sitting on the infant scale. Use the upright scale with preschoolers and school-age children, maintaining modesty with light clothing. | |
| Length. Until age 2 years, measure the infant’s body length supine by using a horizontal measuring board. Hold the head in the midline. Because the infant normally has flexed legs, extend them momentarily by holding the knees together and pushing them down until the legs are flat on the table. Avoid using a tape measure along the infant’s length because this is inaccurate. | |
| For age 2 or 3 years, measure the child’s height by standing the child against the pole on the platform scale or back against a flat ruler taped to the wall. (Sometimes a child will stand more erect against the solid wall than against the narrow measuring pole on the scale.) Encourage the child to stand straight and tall and to look straight ahead without tilting the head. The shoulders, buttocks and heels should touch the wall. Hold a book or flat board on the child’s head at a right angle to the wall. Mark just under the book, noting the measure to the nearest 1 mm. | |
| Physical growth is perhaps the best index of a child’s general health. The child’s height and weight are recorded at every healthcare visit to determine normal growth patterns. The results are plotted on growth charts based on data from the US-based National Center for Health Statistics (NCHS). (See Appendix B on the Evolve website for samples of the two groups of charts: one group for weight and height charts from birth to 36 months for girls and boys and the second group from 2 to 18 years for males and females.) | |
| Healthy childhood growth is continuous but uneven, with rapid growth spurts occurring during infancy and adolescence. Results are more reliable when comparing numerous growth measures over a long time. These charts also compare the individual child’s measurements against the general population. Normal limits range from the 5th to the 95th percentile on the standardised charts. | |
| Use your judgment and consider the ethnic background of the small-for-age child. Explore the growth patterns of the parents and siblings. Be aware that the statistical averages for Australia are based on US charts which are based on norms for Caucasian children and may not necessarily generalise to other ethnic groups. | Further explore any growth measure that • Falls below the 5th or above the 95th percentile • Shows a wide percentile difference between height and weight—e.g. a 10th percentile height with a 95th percentile weight • Shows that growth has suddenly stopped when it had been steady • Fails to show normal growth spurts during infancy and adolescence. |
| Head circumference. Measure the infant’s head circumference at birth and at each well child visit up to age 2 years and then yearly up to 6 years (Fig 9.10). Circle the tape around the head at the prominent frontal and occipital bones; the widest span is correct. Plot the measurement on standardised growth charts. Compare the infant’s head size with that expected for age. A series of measurements is more valuable than a single figure to show the rate of head growth. | |
| The newborn’s head measures about 32 to 38 cm (average about 34 cm) and is about 2 cm larger than the chest circumference. The chest grows at a faster rate than the cranium; at some time between 6 months and 2 years, both measurements are about the same, and after age 2 years the chest circumference is greater than the head circumference. | Enlarged head circumference occurs with increased intracranial pressure (Ch 22). |
| Measurement of the chest circumference is valuable in a comparison with the head circumference, but not necessarily by itself. Encircle the tape around the chest at the nipple line. It should be snug, but not so tight that it leaves a mark (Fig 9.11). | |
| Vital signs | |
| When taking a child or infant’s vital signs, where appropriate ask the parent to assist. The infant or child should be positioned correctly and comfortably prior to and during the procedure. | |
| Measure vital signs with the same purpose and frequency as you would in an adult. With an infant, reverse the order of vital sign measurement to respiration, pulse and temperature. For infants under 3 months of age take the temperature at either the inguinal, axilla or rectal sites. Taking a rectal temperature may cause the infant to cry, which will increase the respiratory and pulse rate, thus masking the normal resting values. For older children avoid the rectal route and take a tympanic, inguinal or axillary temperature. The TMT measurement is so rapid that it is usually over before the child realises it. When this is not feasible, use the reverse order and measure the rectal temperature last. Promote the cooperation of the school-age child by explaining the procedure completely and encouraging the child to handle the equipment. Your approach to measuring vital signs with the adolescent is much the same as with the adult. | |
| Temperature | |
| Axillary. The axillary route is safe and accessible. When cold receptors are stimulated, brown fat tissue in the area releases heat through chemical energy, which artificially raises skin temperature. When the axillary route is used, place the tip well into the axilla, and hold the child’s arm close to the body. | Nurses have questioned the accuracy of tympanic temperature measurement when compared with the use of the axillary route for temperature measurement in children. A systematic review conducted by Reid and colleagues at the Centre for Clinical Effectiveness, Monash University (2007) concluded that infrared tympanic thermometers are more accurate than axillary thermometers at temperature measurement for children aged between one month and 15 years. |
| Oral and rectal routes should not be routinely used to measure the body temperature in children aged from 0 to 5 years. | |
| In infants under the age of four weeks, temperature should be measured with an electronic thermometer in the axilla (National Institute for Health and Clinical Excellence, 2007). | |
| Inguinal. The inguinal route is also safe for measuring a child’s body temperature. Its results may be closer to core temperature than the axillary site because the inguinal area has a rich supply of blood vessels, it lacks the brown fat tissue that interferes with axillary temperatures and you can form a tight skin-to-skin seal. Abduct the infant’s leg and locate the femoral pulse. Place the bulb of the thermometer lateral to the pulse site, and adduct the leg to create a seal. | |
| Oral. Use the oral route when the child is old enough to keep the mouth closed. This is usually at age 5 or 6 years, although some 4-year-old children can cooperate. When available, use an electronic thermometer because it is unbreakable and it registers quickly. | |
| Rectal. Use this route with infants of less than 3 months of age or with other age-groups when other routes are not feasible, such as with the child who is unconscious, critically ill or prone to seizure. An infant may be supine or side lying, with the examiner’s hand flexing the knees up onto the abdomen. An infant also may lie prone across the adult’s lap. Separate the buttocks with one hand, and insert the lubricated electronic rectal probe no further than 2.5 cm. Any deeper insertion risks rectal perforation because the colon curves posteriorly at 3 cm. | |
| Normally, rectal temperatures measure higher in infants and young children than in adults, with an average of 37.8°C at 18 months. Also, the temperature normally may be elevated in the late afternoon, after vigorous playing or after eating. | Up to ages 6 to 8 years, children have higher fevers with illness than adults do. Even with minor infections, fevers may elevate to 39.5°C to 40.5°C. |
| Pulse | |
| Palpate or auscultate an apical rate with infants and toddlers (see Ch 12 for location of apex and technique). In children older than 2 years, use the radial site. Count the pulse for a full minute to take into account normal irregularities, such as sinus arrhythmia. The heart rate normally fluctuates more with infants and children than with adults in response to exercise, emotion and illness. | |
| Respirations | |
| Infants and children under 6–7 years are predominantly abdominal breathers. Watch the abdomen for movement, because the respirations are normally more diaphragmatic than thoracic (Fig 9.12). Count a full minute because the pattern varies significantly from rapid breaths to short periods of apnoea. Note the normal rate in Table 9.3. | |
| Blood pressure | |
| In children aged 3 years and older and in younger children at risk, measure a routine BP at least annually. For accurate measurement in children, make some adjustment in the choice of equipment and technique. The most common error is to use the incorrect size cuff. The cuff width must cover two-thirds of the upper arm, and the cuff bladder must completely encircle it. | When it is not possible to use the arm for blood pressure measurement in infants, the lower leg can be used. |
| Crying, eating or sucking can influence blood pressure measurements and should be noted at the time of measurement. | |
| Use a paediatric-sized endpiece on the stethoscope to locate the sounds. If possible, allow a crying infant to become quiet for 5 to 10 minutes before measuring the BP; crying may elevate the systolic pressure by 30 to 50 mmHg. Use the disappearance of sound (phase V Korotkoff) for the diastolic reading in children as well as adults. Normal BP values by age groups are based on the child’s height (Appendixes C-1 and C-2 on the Evolve website). In children, height is more strongly correlated with BP than is age. The new charts avoid the mis classification as normotensive or hypertensive of children who are at the extremes of normal growth (National Heart, Lung, and Blood Institute, nd). That is, for children of the same age, BP classified as 90th and 95th percentiles are lower for very short children, whereas tall children are given a higher normal range. | Further explore any blood pressure that is greater than the 95th percentile and refer for diagnostic evaluation. For the child whose BP falls in the 90th to 95th percentile and whose high BP cannot be explained by height or weight, monitor the BP every 6 months. |
| Children under 3 years of age have such small arm vessels that it is difficult to hear Korotkoff sounds with a stethoscope. Instead, use an electronic BP device that uses oscillometry, such as Dynamap, and gives a digital readout for systolic, diastolic and MAP and pulse. Or use a Doppler ultrasound device to amplify the sounds. This instrument is easy to use and can be used by one examiner. (Note the technique for using the Doppler device, Fig 9.14 below.) | |
| The adult over 65 years | |
| General survey | |
| Physical appearance—By the eighth and ninth decades, body contour is sharper, with more angular facial features, and body proportions are redistributed. (See measuring weight and height, above.) | |
| Posture—A general flexion occurs by the eight or ninth decade. | |
| Gait—Older adults often use a wider base to compensate for diminished balance, arms may be held out to help balance and steps may be shorter or uneven. | |
| Measurement | |
| Weight. The person over 65 years appears sharper in contour with more prominent bony landmarks than the younger adult. Body weight decreases during the 80s and 90s. This factor is more evident in males, perhaps because of greater muscle shrinkage. The distribution of fat also changes during the 80s and 90s. Even with good nutrition, subcutaneous fat is lost from the face and periphery (especially the forearms), whereas additional fat is deposited on the abdomen and hips. | |
| Height. By the 80s and 90s, many people are shorter than they were in their 70s. This results from shortening in the spinal column from thinning of the vertebral discs and shortening of the individual vertebrae and from the postural changes of kyphosis and slight flexion in the knees and hips. Because long bones do not shorten with age, the overall body proportion looks different—a shorter trunk with relatively long extremities. | |
| Vital signs | |
| Temperature. Changes in the body’s temperature regulatory mechanism leave the person over 65 less likely to have fever but at a greater risk for hypothermia and hyperthermia. Thus the temperature is a less reliable index of the older person’s true health state. Sweat gland activity is also diminished. | |
| Pulse. The normal range of heart rate is 60 to 100 bpm, but the rhythm may be slightly irregular. The radial artery may feel stiff, rigid and tortuous in an older person, although this condition does not necessarily imply vascular disease in the heart or brain. The increasingly rigid arterial wall needs a faster upstroke of blood, so the pulse is actually easier to palpate. | |
| Respirations. Ageing causes a decrease in vital capacity and a decreased inspiratory reserve volume. You may note a shallower inspiratory phase and an increased respiratory rate. | |
| Blood pressure. The aorta and major arteries tend to harden with age. As the heart pumps against a stiffer aorta, the systolic pressure increases, leading to a widened pulse pressure (see Fig 9.4 for mean BP readings in apparently healthy persons from birth to old age). With many older people, both the systolic and the diastolic pressures increase, making it difficult to distinguish normal ageing values from abnormal hypertension. | |
| ADDITIONAL TECHNIQUES | |
| Measurement of oxygen saturation | |
| The pulse oximeter is a noninvasive method to assess arterial oxygen saturation (Spo2). A sensor attached to the person’s finger or earlobe has a diode that emits light and a detector that measures the relative amount of light absorbed by oxyhaemoglobin (HbO2) and unoxygenated (reduced) haemoglobin (Hb). The pulse oximeter compares the ratio of light emitted to light absorbed and converts this ratio into the percentage of oxygen saturation. Because it only measures light absorption of pulsatile flow, the result is arterial oxygen saturation. A healthy person with no lung disease and no anaemia normally has an SpO2 of 97% to 98%. | Clinical alert: SpO2 reading less than 97% requires immediate further investigation. |
| Select the appropriate pulse oximeter probe. The finger probe is spring loaded and feels like a clothespin attached to the finger but does not hurt (Fig 9.13). | |
| The Doppler technique | |
| In many situations, pulse and BP measurement are enhanced by using an electronic device, the Doppler ultrasonic flowmeter. The Doppler technique works by a principle discovered in the nineteenth century by an Austrian physicist, Johannes Doppler. Sound varies in pitch in relation to the distance between the sound source and the listener; the pitch is higher when the distance is small, and the pitch lowers as the distance increases. Think of a railway train speeding towards you; its train whistle sounds higher the closer it gets, and the pitch of the whistle lowers as the train fades away. | |
| In this case, the sound source is the blood pumping through the artery in a rhythmic manner. A handheld transducer picks up changes in sound frequency as the blood flows and ebbs and it amplifies them. The listener hears a whooshing pulsatile beat. | |
| The Doppler technique is used to locate the peripheral pulse sites (see Ch 11 for further discussion of this technique). For BP measurement, the Doppler technique will augment Korotkoff sounds (Fig 9.14). Through this technique, you can evaluate sounds that are hard to hear with a stethoscope, such as those in critically ill individuals with a low B P, in infants with small arms and in obese persons in whom the sounds are muffled by layers of fat. Also, proper cuff placement is difficult on the obese person’s cone-shaped upper arm. In this situation, you can place the cuff on the more even forearm and hold the Doppler probe over the radial artery. For either location, use the following procedure: | |
• Apply coupling gel to the transducer probe. • Touch the probe to the skin, holding the probe perpendicular to the artery. • A pulsatile whooshing sound indicates location of the artery. You may need to rotate the probe, but maintain contact with the skin. Do not push the probe too hard or you will wipe out the pulse. • Inflate the cuff until the sounds disappear; then proceed another 20 to 30 mmHg beyond that point. • Slowly deflate the cuff, noting the point at which the first whooshing sounds appear. This is the systolic pressure. • It is difficult to hear the muffling of sounds or a reliable disappearance of sounds indicating the diastolic pressure (phases IV and V of Korotkoff sounds). However, the systolic pressure alone gives valuable data on the level of tissue perfusion and on blood flow through patent vessels. |
|
| PROMOTING HEALTH AND SELF-CARE | |
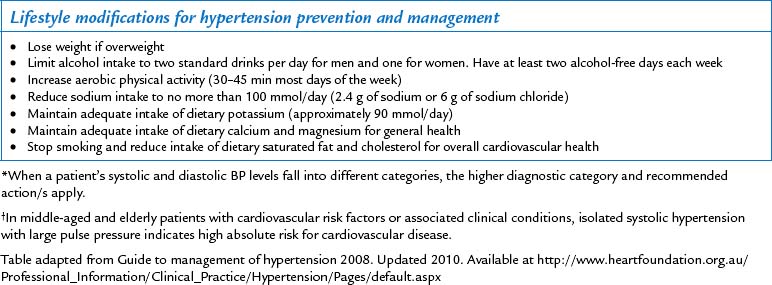
| As you measure height and weight and collect vital signs, it is a good time to begin a teaching plan to help the individual keep these physical signs within normal limits. The Australian Government Healthy Weight 2008 (Australian Government, 2008) program and the Heart Foundation consider the following lifestyle modifications to be the foundation of hypertension control. Even if your patient is normotensive and has body weight in normal limits, the following lifestyle modifications can help keep blood pressure under control. | |
• Lose weight, if you are more than 10% above ideal weight. • Limit alcohol intake to two standard drinks per day for men and one for women and to have at least two alcohol-free days each week. A standard drink is any drink that contains 10 g of alcohol. • Get regular aerobic exercise (e.g. a 30- to 45-minute brisk walk) most days of the week. • Cut sodium intake from the average 150 mmol/L (150 mEq/L) to less than 100 mmol/L (100 mEq/L) per day (less than 2.3 g of sodium or 6 g of sodium chloride). • Include the recommended daily allowances of potassium, calcium and magnesium in your diet. • Dietary modification. Choose foods that include fruits, vegetables, pulses and a wide selection of wholegrain foods, moderate amounts of low-fat or reduced-fat dairy products. Reduce dietary saturated fat and cholesterol. |

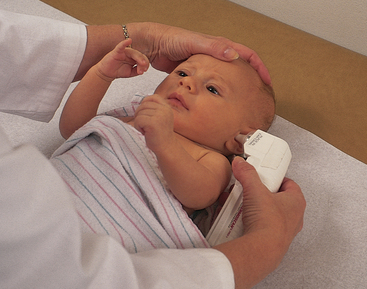
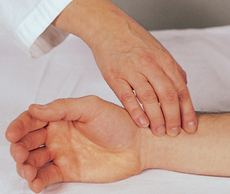
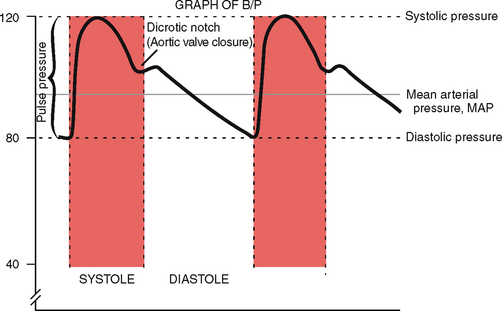
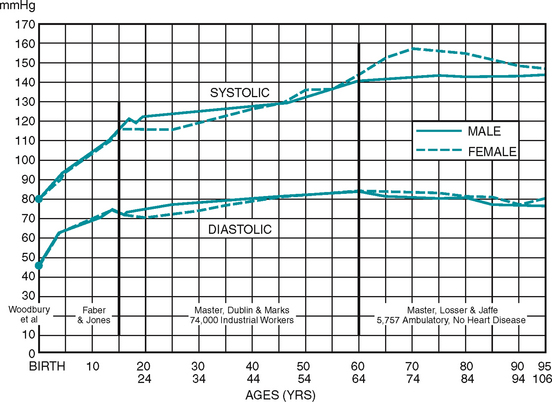
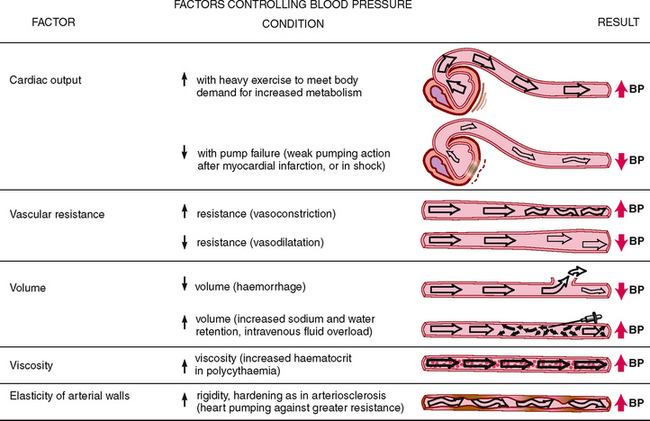
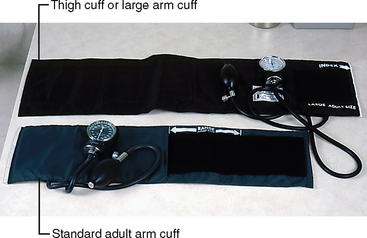
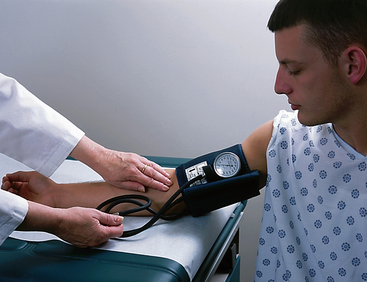
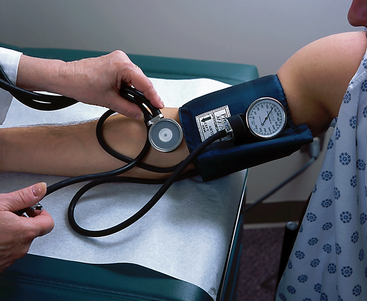
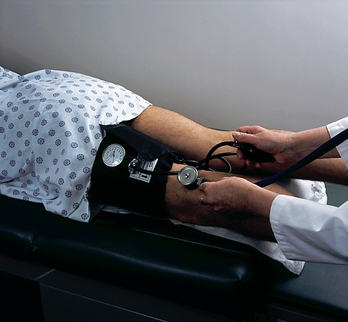

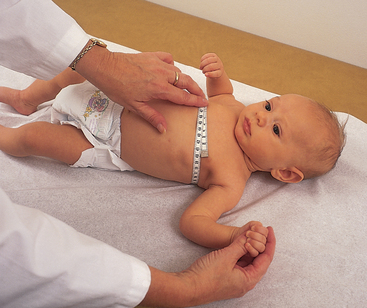
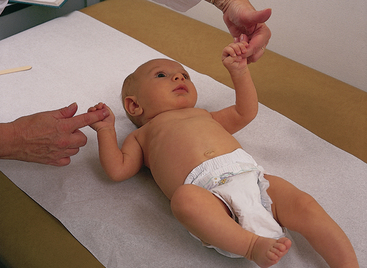
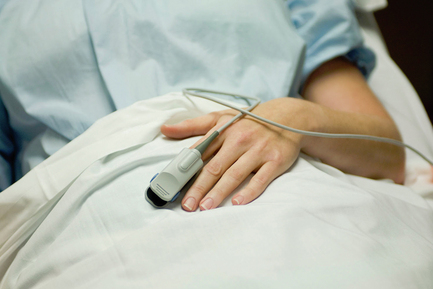
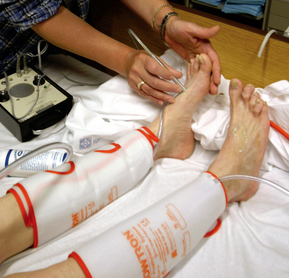
TABLE 9.1 Temperature variations according to site
| Approach | Temperature |
|---|---|
| Rectal | 37.6 degrees Celsius |
| Oral | 37.0 degrees Celsius |
| Axillary | 36.4 degrees Celsius |
| Ear | 37.6 degrees Celsius |
Normal temperature readings are based on Vital Signs by Richard Rathe, MD. Available at http://medinfo.ufl.edu/year1/bcs/clist/vitals.html
TABLE 9.2 Normal resting pulse rates across age groups
| Age | Average (beats per minute) | Normal limits |
|---|---|---|
| Newborn | 120 | 70–190 |
| 1 yr | 120 | 80–160 |
| 2 yr | 110 | 80–130 |
| 4 yr | 100 | 80–120 |
| 6 yr | 100 | 75–115 |
| 8 yr | 90 | 70–110 |
| 10 yr | 90 | 70–110 |
| 12 yr | ||
| Female | 90 | 70–110 |
| Male | 85 | 65–105 |
| 14 yr | ||
| Female | 85 | 65–105 |
| Male | 80 | 60–100 |
| 16 yr | ||
| Female | 80 | 60–100 |
| Male | 75 | 55–95 |
| 18 yr | ||
| Female | 75 | 55–95 |
| Male | 70 | 50–90 |
| Well-conditioned athlete | May be 50–60 | 50–100 |
| Adult | 74–76 | 60–100 |
| Over 65 years | 74–76 | 60–100 |
TABLE 9.3 Normal respiratory rates
| Age | Breaths per minute |
|---|---|
| Neonate | 30–40 |
| 1 yr | 20–40 |
| 2 yr | 25–32 |
| 4 yr | 23–30 |
| 6 yr | 21–26 |
| 8 yr | 20–26 |
| 10 yr | 20–26 |
| 12 yr | 18–22 |
| 14 yr | 18–22 |
| 16 yr | 12–20 |
| 18 yr | 16–20 |
| Adult | 10–20 |
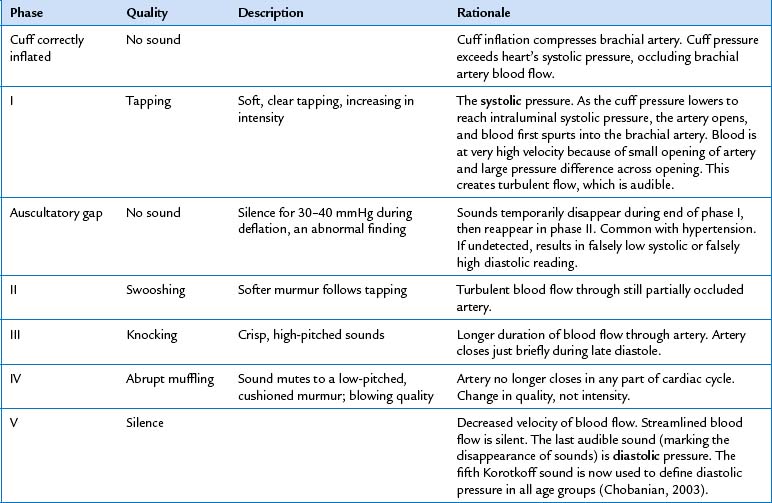
TABLE 9.5 Common errors in blood pressure measurement
| Common error | Result | Rationale |
|---|---|---|
| Taking blood pressure reading when person is anxious or angry or has just been active | Falsely high | Sympathetic nervous system stimulation |
| Faulty arm position | ||
| Above level of heart | Falsely low Falsely high | Eliminates effect of hydrostatic pressure |
| Below level of heart | Falsely high diastolic | Additional force of gravity added to brachial artery pressure |
| Person supports own arm | Falsely high systolic and diastolic | Sustained isometric muscular contraction |
| Faulty leg position (e.g. person’s legs are crossed) | Translocation of blood volume from dependent legs to thoracic area | |
| Examiner’s eyes are not level with meniscus of mercury column | ||
| Looking up at meniscus | Falsely high | Parallax |
| Looking down on meniscus | Falsely low | |
| Inaccurate cuff size (This is the most common error.) | ||
| Cuff too narrow for extremity | Falsely high | Needs excessive pressure to occlude brachial artery |
| Cuff wrap is too loose or uneven or bladder balloons out of wrap | Falsely high | Needs excessive pressure to occlude brachial artery |
| Failure to palpate radial artery while inflating | ||
| Inflating not high enough | Falsely low systolic | Miss initial systolic tapping or may tune in during auscultatory gap (tapping sounds disappear for 10 to 40 mmHg and then return; common with hypertension) |
| Inflating cuff too high | Pain | |
| Pushing stethoscope too hard on brachial artery | Falsely low diastolic | Excessive pressure distorts artery and the sounds continue |
| Deflating cuff | ||
| Too quickly | Falsely low systolic or falsely high diastolic | Insufficient time to hear tapping |
| Too slowly | Falsely high diastolic | Venous congestion in forearm makes sounds less audible |
| Halting during descent and reinflating cuff to recheck systolic | Falsely high diastolic | Venous congestion in forearm |
| Failure to wait 1–2 min before repeating entire reading | Falsely high diastolic | Venous congestion in forearm |
| Any observer error | ||
| Examiner’s ‘subconscious bias’; a preconceived idea of what blood pressure reading should be due to person’s age, race, sex, weight, history or condition | Error anywhere | |
| Error anywhere | ||
TABLE 9.6 Abnormalities in body height and proportion
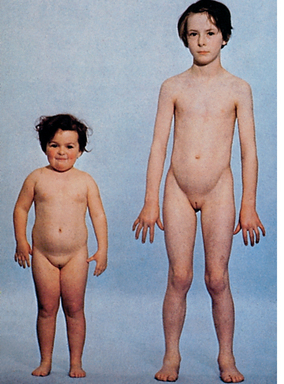
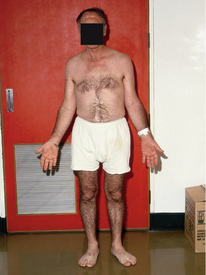
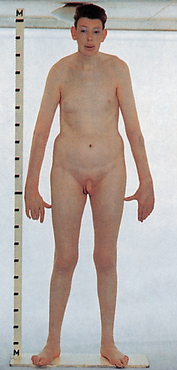
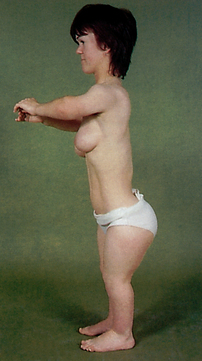
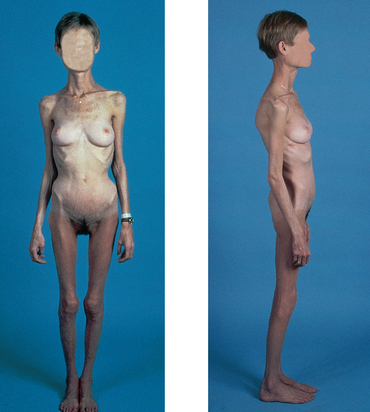
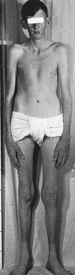
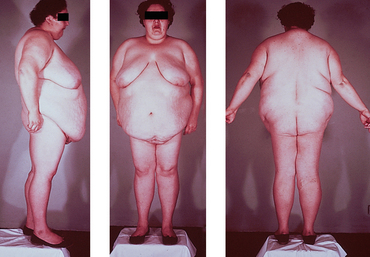
Reprinted from the Clinical Slide Collection on the Rheumatic Diseases,© 1991, 1995, 1997. Used by permission of the American College of Rheumatology.
Observation charts usually provide for the documentation of a range of patient assessments in addition to temperature, pulse, respirations and blood pressure. This additional information might include pulse oximetry, weight, bowel movements, urine test results etc. Although vital signs are usually documented on a specifically designed observation chart, currently there is no uniformity in design. Changes in heart and respiratory rate, blood pressure and temperature can signal the onset of serious adverse events for patients. Given the importance of these charts in identifying patients at risk, the Australian Commission on Quality and Safety in Health Care has identified that the design of observation charts may contribute to confusion for nurses. As a consequence a national observation chart is currently being designed to better assist the early identification of patients at risk of deterioration.
Alexis O. Providing best practice in manual pulse measurement. Br J Nurs. 2010;19(4):228–234.
Amoore J, Guehenec M, Scordecchia R, et al. Auditing the technology used to measure blood pressure. Journal of Medical Engineering & Technology. 2010;34(3):209–216.
Anekwe L. Sphygmoerrors throw doubt on hypertension diagnoses. Pulse. 2009;69(12):3.
Australian Bureau of Statistics. Children who are overweight or obese 2007–08. In National health survey (NHS) and 2006 children’s participation in cultural and leisure activities survey. Available at http://www.abs.gov.au/AUSSTATS/abs@.nsf/Lookup/4102.0Main+Features20Sep+2009, 2009.
Australian Bureau of Statistics. Chronic disease. In Year book, Australia: 2008. Available at http://www.abs.gov.au/ausstats/abs@.nsf/7d12b0f6763c78 caca257061001cc588/895A3D95B6ACAE9CCA2573D200107617?opendocument.
Australian Commission on Quality and Safety in Health Care. Recognising and responding to clinical deterioration: use of observation charts to identify clinical deterioration. Available at http://www.health.gov.au/internet/safety/publishing.nsf/Content/prog-patientsrisk-lp/$File/UsingObservation Charts-2009.pdf, 2009.
Australian Government. Healthy weight 2008: Australia’s future. The national action agenda for children and young people and their families. Available at http://www.health.gov.au/internet/healthy active/publishing.nsf/content/healthy_weight08.pdf/$file/healthy_weight08.pdf, 2008.
Australian Government, Department of Health and Ageing. Clinical practice guidelines for the management of overweight and obesity in children and adolescents. Available at http://www.health.gov.au/internet/main/publishing.nsf/Content/893169B10DD 846FCCA256F190003BADA/$File/children.pdf, 2008.
Babatsikou F, Zavitsanou A. Epidemiology of hypertension in the elderly. Health Science Journal. 2010;4(1):24–30.
Baid H. Patient assessment. The process of conducting a physical assessment: a nursing perspective. British Journal of Nursing. 2006;15(13):710–714.
Baillie L, Curzio J. A survey of first year student nurses’ experiences of learning blood pressure measurement. Nurse Education in Practice. 2009;9(1):61–71.
Burke V, Beilin LJ, Dunbar D, et al. Associations between blood pressure and overweight defined by new standards for body mass index in childhood. Preventive Medicine. 2004;38(5):558–564.
Centers for Disease Control and Prevention. Growth charts, National Center for Health Statistics in collaboration with the National Center for Chronic Disease Prevention and Health Promotion. Available at www.cdc.gov/growth_charts, 2000.
Chobanian AV, et al. The seventh report of the Joint National Committee on Prevention, Detection, Evaluation, and Treatment of High Blood Pressure: The INC Report. JAMA. 2003;289(10):2560–2572.
Cusson RM, Madonia JA, Taekmen JB. The effect of environment on body site temperatures in full-term neonates. Nursing Research. 1997;46(4):202–207.
De Greeff A, Ghosh D, Anthony J, et al. Accuracy assessment of the Dinamap ProCare 400 in pregnancy and preeclampsia. Hypertension in Pregnancy. 2010;29(2):198–205.
Dimkpa U, Oji JO. Relationship of body mass index with haemodynamic variables and abnormalities in young adults. Journal of Human Hypertension. 2010;24(4):230–236.
Doshi H, Weder AB, Bard RL, et al. Does ‘hidden undercuffing’ occur among obese patients? Effect of arm sizes and other predictors of the difference between wrist and upper arm blood pressures. Journal of Clinical Hypertension. 2010;12(2):82–88.
Duggan P. Which Korotkoff sound should be used for the diastolic blood pressure in pregnancy? Australian and New Zealand Journal of Obstetrics and Gynaecology. 2008;38(2):194–197.
Duncan J, Duncan E, Schofield G. Accuracy of body mass index (BMI) thresholds for predicting excess body fat in girls from five ethnicities. Asia Pacific Journal of Clinical Nutrition. 2009;18(3):404–411.
Es¸er I, Khorshid L, Günes¸ UY, et al. The effect of different body positions on blood pressure. J Clin Nurs. 2007;16(1):137–140. (2007)
Fallis W. Neonatal axillary temperature measurements: a comparison of electronic thermometer predictive and monitor modes. Journal of Obstetric, Gynecologic, & Neonatal Nursing. 2006;28(4):389–394.
Gentles D, Metcalf P, Dyall L, et al. Blood pressure prevalences and levels for a multicultural population in Auckland, New Zealand: results from the Diabetes, Heart and Health Survey 2002/2003. New Zealand Medical Journal. 2006;119(1245):U2318.
Giantin V, Toffanello ED, Enzi G, et al. Reliability of body temperature measurements in hospitalised older patients. Journal of Clinical Nursing. 2008;17(11):1518–1525.
Gilbert M, Barton AJ, Counsell CM. Comparison of oral and tympanic temperatures in adult surgical patients. Appl Nurs Res. 2002;15(1):42–47.
Gupta V, Lipsitz L. Orthostatic hypotension in the elderly: diagnosis and treatment. American Journal of Medicine. 2007;120(10):841–847.
Guss D, Abdelnur D, Hemingway T. The impact of arm position on the measurement of orthostatic blood pressure. Journal of Emergency Medicine. 2008;34(4):377–382.
Heart Foundation. Guide to management of hypertension 2008. Updated 2010. Available at http://www.heartfoundation.org.au/Professional_Information/Clinical_Practice/Hypertension/Pages/default.aspx.
Hockenberry MJ, Wilson D. Wong’s nursing care of infants and children, 8th edn., Edinburgh: Elsevier, 2008.
Joanna Briggs Institute. Vital signs. Clinical Online Network of Evidence for Care and Therapeutics, 2010.
Knecht K, Seller J, Alpert B. Korotkoff sounds in neonates, infants, and toddlers. American Journal of Cardiology. 2009;103(8):1165–1167.
Kovacs V, Gabor A, Fajcsak Z, et al. Role of waist circumference in predicting the risk of high blood pressure in children. International Journal of Pediatric Obesity. 2010;5(2):143–150.
Koziol-McLain J, Oman K, Edwards G. Ear temperatures: making research based clinical decisions. J Emerg Nurs. 1996;22(1):77–79.
Lawes C, Vander Hoorn S, Rodgers A. Global burden of blood-pressure-related disease, 2001. Lancet. 2008;371:1513–1518.
Lockwood C, Conroy-Hiller T, Page T. Vital signs. JBI Reports. 2004;2(6):207–230.
Lu S-H, Dai Y-T, Yen C-J. The effects of measurement site and ambient temperature on body temperature values in healthy older adults: a cross-sectional comparative study. International Journal of Nursing Studies. 2009;46(11):1415–1422.
Lu S-H, Leasure A-R, Dai Y-T. A systematic review of body temperature variations in older people. J Clin Nurs. 2010;19(1/2):4–16.
Ma G, Sabin N, Dawes M. A comparison of blood pressure measurement over a sleeved arm versus a bare arm. Canadian Medical Association Journal. 2008;178(5):585–589.
Mattoo T. Arm cuff in the measurement of blood pressure. American Journal of Hypertension. 2002;15(2 Supplement 1):S67–S68.
Metcalf P, Scragg RK, Schaaf D, et al. Trends in major cardiovascular risk factors in Auckland, New Zealand: 1982 to 2002–2003. New Zealand Medical Journal. 2006;119(1245):U2308.
Ministry of Health, Health status. The burden of disease and injury in New Zealand. Ministry of Health, Wellington, 2008. Available at http://www.stats.govt.nz/sitecore/content/population/Home/information-by-subject/health/health-status.aspx.
Musselman B. Increasing knowledge about the use of appropriately sized blood pressure cuffs. J Emerg Nurs. 2005;31(1):15–16.
National Center for Health Statistics (NCHS). Growth charts. Available at http://www.cdc.gov/growthcharts/.
National Heart, Lung, and Blood Institute. (nd): Blood pressure tables for children and adolescents. Available at http://www.nhlbi.nih.gov/guidelines/hypertension/child_tbl.htm.
National Institute for Health and Clinical Excellence (NICE), Feverish illness in children: NICE guideline. NICE, London, 2007. Available at www.nice.org.uk.
National Public Health Partnership (NPHP). Healthy children—strengthening promotion and prevention across Australia, National Public Health Strategic Framework for Children 2005–2008. Melbourne: NPHP, 2005.
Northern Territory, Department of Health and Community Services. Child growth charts in the Northern Territory. Discussion paper. Consideration of the 2006 WHO growth standards. Available at http://www.health.nt.gov.au/library/scripts/objectify Media.aspx?file=pdf/18/23.pdf&siteID=1&str_title=Child Growth Charts in the Northernt territory-Discussion paper.pdf, 2008.
O’Brien D, Davison M. Blood pressure measurement: rational and ritual actions. Br J Nurs. 1994;3(8):393–396.
O’Toole S. Alternatives to mercury thermometers. Prof Nurse. 1997;12(11):783–786.
Pickering T, Hall J, Appel L, et al. Recommendations for blood pressure measurement in humans and experimental animals. Hypertension. 2005;45:142–161.
Polanco P. Practical issues of hemodynamic monitoring at the bedside. Surgical Clinics of North America. 2006;86(6):1431–1456.
Pullen RL. Using pulse oximetry accurately. Nursing. 2010;40(4):63.
Purssell E, While A, Coomber B. Tympanic thermometry—normal temperature and reliability. Paediatric Nursing. 2009;21(6):40–43.
Reid J, Turner T, Harris C. Infrared tympanic thermometers versus digital/electronic or infrared axillary thermometers for temperature recording in children. Melbourne: Centre for Clinical Effectiveness, Monash University, 2007.
Roelants M, Hauspie R, Hoppenbrouwers K. Breastfeeding, growth and growth standards: performance of the WHO growth standards for monitoring growth of Belgian children. Annals of Human Biology. 2010;37(1):2–9.
Smitz S, Van de Winckel A, Smitz M. Reliability of infrared ear thermometry in the prediction of rectal temperature in older inpatients. J Clin Nurs. 2009;18(3):451–456.
Sund-Levander M, Grodzinsky E. What is the evidence base for the assessment and evaluation of body temperature? Nurs Times. 2010;106(1):10–13.
Thomas Collin R, Alpert B. Pre-hypertension and hypertension in pediatrics: don’t let the statistics hide the pathology. Journal of Pediatrics. 2009;155(2):165–169.
Tolan R, Jr. Fever of unknown origin: a diagnostic approach to this vexing problem. Clinical Pediatrics. 2010;49(3):207–213.
van Groningen LF, Adiyaman A, Elving L, et al. Which physiological mechanism is responsible for the increase in blood pressure during leg crossing? J Hypertens. 2008;26(3):433–437.
Victorian Government Department of Human Services. Headline indicators for children’s health, development and wellbeing: the child health and wellbeing reform initiative. Australian Health Ministers’ Conference and the Community and Disability Services Ministers’ Conference Statewide Outcomes for Children. Melbourne, 2006, Office for Children, Victorian Government Department of Human Services. Available at http://www.edu web.vic.gov.au/edulibrary/public/earlychildhood/develop ment/headlinerrptfull.pdf, 2006.
Wang Z, Knight S, Wilson A, et al. Blood pressure and hypertension for Australian Aboriginal and Torres Strait Islander people. Eur J Cardiovasc Prev Rehabil. 2006;13(3):438–443.
Wood CS, Gans LP. Contrasting patterns of blood pressure and related factors within a Maori and European population in New Zealand. Soc Sci Med. 1986;23(5):439–444.
World Health Organization (nd). BMI classification. Available at http://apps.who.int/bmi/index.jsp?introPage=intro_3.html.
Xuegang X. A model of Korotkoff sounds method electronic sphygmomanometer equivalent to the mercury one. Journal of Medical Colleges of PLA. 2010;25(1):19–23.