10 Control of Cardiac Output
Coupling of Heart and Blood Vessels
Cardiac output (CO) is defined as the total flow of blood out of the left ventricle. It could be measured in the aorta, except for that portion of the total output that flows to the heart itself via the coronary circulation. Cardiac output is thus the total flow that is available to perfuse all the tissues of the body. In order to meet the metabolic demands of the body, and maintain arterial pressure, cardiac output must be able to increase substantially. During severe exercise (see Chapter 13), cardiac output can increase 4- to 5-fold. In general, this is accomplished by increases in heart rate (up to 3-fold, in young adults) and increases in stroke volume (up to about 1.5-fold). In such exercise, this increase in cardiac output enables an increase in overall O2 consumption of approximately 12 times (untrained young male). Because total peripheral resistance during exercise decreases to a little as one-third the resting value, the increase in cardiac output is essential to maintain the mean arterial pressure. Changes in both the heart and the systemic vasculature are required to produce the increased cardiac output.
Factors Controlling Cardiac Output
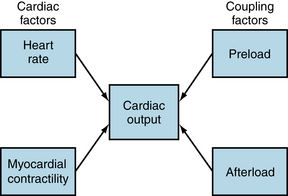
Four factors that control cardiac output are heart rate, myocardial contractility, preload, and afterload (Figure 10-1). Heart rate and myocardial contractility are strictly cardiac factors. They are characteristics of the cardiac tissues, although they are modulated by various neural and humoral mechanisms. Preload and afterload, however, depend on the characteristics of both the heart and the vascular system. On the one hand, preload and afterload are important determinants of cardiac output. On the other hand, preload and afterload are themselves determined by the cardiac output and by certain vascular characteristics. Preload and afterload may be designated as coupling factors because they constitute a functional coupling between the heart and blood vessels.
To understand the regulation of cardiac output, one must appreciate the nature of the coupling between the heart and the vascular system. Graphic techniques have been developed to analyze the interactions between the cardiac and vascular components of the circulatory system. The graphic analysis involves two simultaneous functional relationships between cardiac output and central venous pressure (i.e., the pressure in the right atrium and thoracic venae cavae).
The cardiac function curve (CFC) defines one of these relationships. It is an expression of the well-known Frank-Starling relationship (see Chapters 4 and 5), and it reflects the dependence of cardiac output on preload (i.e., on central venous, or right atrial, pressure). The cardiac function curve is a characteristic of the heart itself, and it has been studied in hearts that have been completely isolated from the rest of the circulatory system.
The vascular function curve defines the dependence of the central venous pressure on the cardiac output. This relationship depends only on certain vascular system characteristics, namely peripheral resistance, arterial and venous compliances, and blood volume. The vascular function curve is entirely independent of the characteristics of the heart, and it can be evaluated even if the heart was replaced by a mechanical pump.
The Cardiac Function Curve Relates Central Venous Pressure (Preload) to Cardiac Output
Preload or Filling Pressure of the heart
The greater the preload of the heart, the greater the cardiac output. In the intact circulation, it will be the pressure in the great veins (i.e., the central venous pressure [CVP]) that constitutes the preload of the heart. In the whole heart, the stretch of the ventricles prior to systole will determine the strength of the subsequent contraction, by the cellular mechanisms discussed earlier (see Chapter 4). The cardiac output is the output of the left ventricle, but it is the preload of the right ventricle that ultimately actually determines the cardiac output. The reason is that, during periods when cardiac output is constant, and within limits, the left ventricle will pump whatever volume of blood comes to it, from the right side of the heart. Thus, it is the filling pressure on the right side of the heart that ultimately determines the output on the left. The filling pressure on the right side of the heart is functionally equal to the central venous pressure. In the intact circulation, the preload is considered to be the CVP, which is approximately equal to the mean right atrial pressure ( ra), which, when the tricuspid valve is open, is approximately equal to the right ventricular pressure. The relationship between preload or filling pressure and stroke volume (or cardiac output) is shown in the cardiac function curve. Cardiac function curves are also known as “Starling curves” or ventricular function curves. Partial curves can be obtained in human subjects, through the use of intracardiac pressure and volume transducers. The cardiac function curve is a manifestation of the Frank-Starling relationship or length-dependence of cardiac contraction.
Cardiac Function Curve
The CFC will be derived by using left ventricular pressure-volume (P-V) loops to illustrate the effect that varying preload has on the stroke volume (SV). In the CFC, stroke volume (or the proportional quantity, CO) is plotted as a function of filling pressure, or preload. For the left ventricle, a measure of preload is the left ventricular end-diastolic pressure (LVEDP). In an experimental situation in which an isolated animal heart is used, the preload of the left ventricle may be varied by changing the height of a reservoir of blood that is connected to the left ventricle (see Chapter 5). Raising or lowering the reservoir increases or decreases the pressure in the left ventricle and is one way in which preload can be changed in an experimental setting. The effect of changing preload on the left ventricular P-V loop is shown in Figure 10-2A. Decreased preload is associated with decreased end-diastolic volume, and increased preload with increased end-diastolic volume. However, the contractility of the ventricle has not changed in this example, and thus the end-systolic pressure-volume relationship (the straight line that indicates the maximum pressure the ventricle can produce at a given volume) has not changed and therefore the end-systolic volume does not change when preload changes. The result is that increased preload results in an increased stroke volume and decreased preload results in a decreased stroke volume. When the different stroke volumes are then plotted against the preload pressures at which they occurred (Figure 10-2B), the entire relationship yields the CFC. A CFC obtained from measurements in 75 patients in whom left ventricular end-diastolic pressure was varied (by various means) (Figure 10-3) verifies that the CFC is a feature of cardiac function in humans.
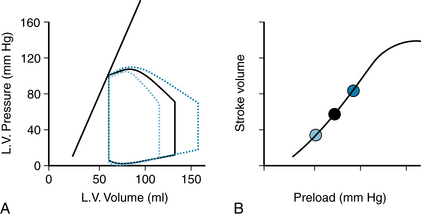
FIGURE 10-2 The cardiac function curve (CFC) shows the relationship between preload and cardiac output (or stroke volume). A single CFC (panel B) can be obtained by varying preload to produce different stroke volumes of the left ventricle (LV), as shown in the pressure-volume loops (panel A). The straight line represents the end-systolic pressure-volume relationship (ESPVR). Three individual P-V loops are illustrated, and each is characterized by a different stroke volume. The three different stroke volumes are plotted in B vs. the preload at which they were obtained. When stroke volume is measured at many different preloads, the continuous curve in B is obtained, which is the complete cardiac function curve.
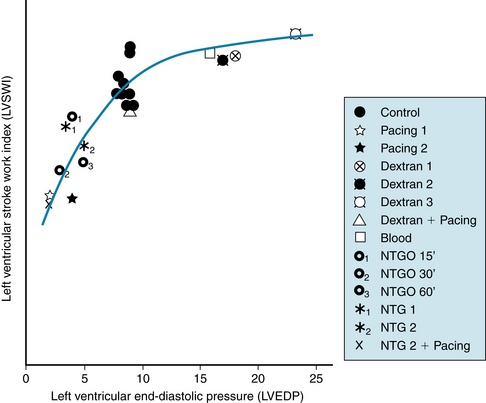
FIGURE 10-3 Cardiac function curve in humans. Preload of the left ventricle (measured as left ventricular end-diastolic pressure) was varied by various interventions in 75 patients. A composite graph for 75 patients in whom left ventricular end-diastolic pressure (LVEDP) was modified as shown. Each point represents the mean value for a particular intervention and includes from 4 to 21 patients, with a total of 102 interventions. Left ventricular stroke work index (LVSWI) is positively related to LVEDP up to 10 mm Hg (LVSWI = 24.4 + 2.70 LVEDP); thereafter, there is little increase in LVSWI as LVEDP increases further. NTG, sublingual nitroglycerin; NTGO, nitroglycerin ointment with observations made after 15, 30, and 60 minutes.
(Modified from Parker JO, Case RB: Normal left ventricular function. Circulation 60:4, 1979.)
Factors that Change the Cardiac Function Curve
Contractility
Increases in cardiac contractility, as produced by the actions of norepinephrine or epinephrine on the heart, are a primary way in which cardiac output is increased physiologically. These substances, acting to increase contractility by the cellular mechanisms already presented (see Chapters 4 and 5), have the effect of raising the peak pressure that can be developed at a given left ventricular volume. Increases in contractility are reflected in an end-systolic pressure-volume relationship that is shifted upward and to the left (increased slope), and vice versa for decreases in contractility, as might occur with cardiac damage. Increases in contractility thus increase stroke volume by decreasing end-systolic volume (Figure 10-4A). At each preload, stroke volume is increased with increased contractility, and thus the entire cardiac function curve is increased upwardly (Figure 10-4B). Decreased contractility results in a decreased stroke volume at all preloads. With a change in contractility, the heart will be characterized by a completely new cardiac function curve, which still, however, reflects the Frank-Starling relationship or the length-dependence of cardiac contraction.
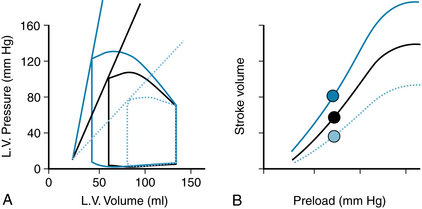
FIGURE 10-4 Effect of altered contractility on left ventricular (L.V.) pressure-volume loops (A) and cardiac function curves (B). Increasing left ventricular contractility increases the slope of the end-systolic pressure volume relation, decreases end-systolic volume, and increases stroke volume. Solid black lines represent the normal, basal state; dotted blue lines, decreased contractility; and solid blue lines, increased contractility. Filled circles in (B) represent the stroke volumes of the correspondingly colored pressure-volume loops in (A).
Afterload
Afterload is the load experienced by the left ventricle after the aortic valve opens (ending the isovolumic contraction phase). Afterload is thus related to the arterial blood pressure as well as to the hemodynamic properties of the arterial system (which will influence the dynamics of the arterial blood pressure during ejection of the stroke volume into the arterial system; see Chapter 7). Increases in afterload are represented on the left ventricular P-V loop as a higher pressure throughout the ejection phase (Figure 10-5A). When the diastolic arterial blood pressure is elevated, the isovolumic contraction must then develop a higher pressure in the left ventricle (compared with normal basal state) before the aortic valve can be forced open. If ventricular contractility is constant, the end-systolic P-V relationship is not altered, and therefore the stroke volume is reduced, because the heart is not able to achieve a lower end-systolic volume (it does not have an increased ability to “squeeze down” against the elevated pressure). Conversely, decreases in afterload result in increased stroke volume, because the heart is able to squeeze down more, achieving a lower end-systolic volume. A change in afterload places the left ventricle on a completely new function curve (Figure 10-5B), which still displays the length-dependence of cardiac contraction.
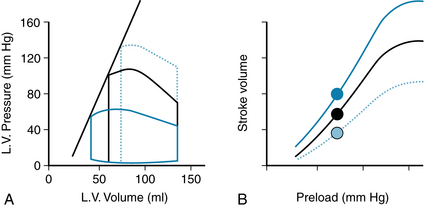
FIGURE 10-5 Effect of altered afterload on left ventricular (L.V.) pressure-volume loops (A) and cardiac function curves (B). Increasing afterload results in decreased stroke volume, because of increased end-systolic volume. Black solid lines represent normal basal state; blue dotted lines, increased afterload; and solid blue lines, decreased afterload. Filled circles in (B) represent the stroke volumes of the correspondingly colored pressure-volume loops in (A).
Myocardial Compliance
Damaged or ischemic heart muscle is less compliant (“stiffer”) than normal heart muscle. In the absence of any other changes, the result is less filling during diastole and a reduced end-diastolic volume (Figure 10-6A). If contractility is not changed, then the stroke volume will be markedly reduced and the left ventricle will operate on a new cardiac function curve (Figure 10-6B) that is depressed compared with the normal basal state.
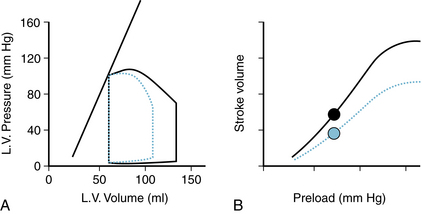
FIGURE 10-6 Effect of decreasing ventricular compliance on the left ventricular (L.V.) pressure-volume loop (A) and the cardiac function curve (B). Decreased myocardial compliance results in reduced filling during diastole, hence decreased end-diastolic volume and stroke volume. Black solid lines represent normal basal state; and dotted blue line, decreased ventricular compliance. Filled circles in (B) represent the stroke volumes of the correspondingly colored pressure-volume loops in (A).
Cardiac Function Curves and Physiological Function
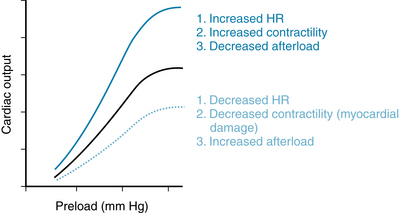
Heart rate is a major physiological determinant of cardiac output, because CO = HR × SV. Thus, it is useful to plot cardiac output, rather than stroke volume, as a function of preload (Figure 10-7). Increased heart rate, increased contractility, and decreased afterload are all factors that increase cardiac output at a given preload. Conversely, decreased heart rate, decreased contractility, increased afterload, and decreased compliance all decrease cardiac output at a given preload. Physiologically, the changes in cardiac function are rarely (if ever) as simple as can be achieved in isolated heart preparations, as illustrated in the simple schemes shown in Figures 10-2, and 10-4 through 10-6). For example, an increase in contractility produced by increased sympathetic drive to the heart (increased release of norepinephrine) tends to raise stroke volume as shown (see Figure 10-4), but heart rate also increases, with a resultant greater cardiac output. Because mean arterial pressure is the arithmetic product of cardiac output and total peripheral resistance, there is an increase in mean arterial pressure, which constitutes an increase in afterload, an effect that tends to decrease stroke volume. Thus, it is important to remember that physiologically, multiple changes usually occur simultaneously. Most importantly, the filling pressure of the heart is greatly influenced by conditions in the systemic blood vessels. The effect that factors in the systemic vasculature have on the filling pressure of the heart, and hence on cardiac output, are quantified with the vascular function curve, or VFC, as discussed next.
The Vascular Function Curve Relates Central Venous Pressure to Cardiac Output
The vascular function curve is independent of the Frank-Starling relationship, length-dependence of cardiac contraction. The vascular function curve defines the changes in central venous pressure evoked by changes in cardiac output; that is, central venous pressure is the dependent variable (or response), and cardiac output is the independent variable (or stimulus). This situation contrasts with that in the cardiac function curve, in which central venous pressure (or preload) is the independent variable and cardiac output is the dependent variable.
A simplified model of the circulation helps explain how cardiac output determines the level of central venous pressure (Figure 10-8). The essential components of the cardiovascular system have been lumped into four elements. The right and left sides of the heart, as well as the pulmonary vascular bed, are considered simply a pump, much as that employed during open heart surgery. The high-resistance microcirculation is designated the peripheral resistance. Finally, the compliance of the system is subdivided into two components, the arterial compliance, Ca, and the venous compliance, Cv. As defined in Chapter 7, compliance (C) is the increment of volume (ΔV) accommodated per unit change of pressure (ΔP); that is:
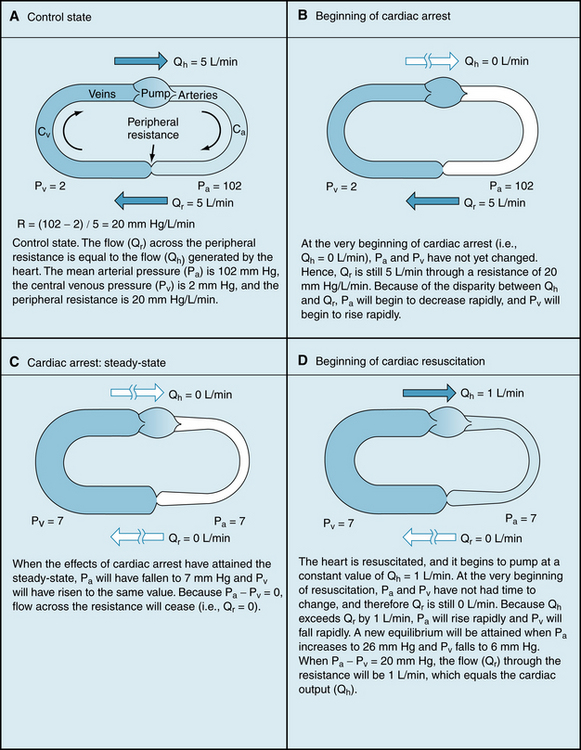
FIGURE 10-8 Simplified model of the cardiovascular system, consisting of a pump, arterial compliance (Ca), peripheral resistance, and venous compliance (Cv).
 (1)
(1)The venous compliance is about 20 times as great as the arterial compliance. In the example that follows, the ratio of Cv to Ca is set at 19:1 to simplify certain calculations. Thus, if it was necessary to add x mL of blood to the arterial system to produce a 1–mm Hg increment in arterial pressure, it would be necessary to add 19x mL of blood to the venous system to raise venous pressure by the same amount.
To illustrate how central venous pressure varies inversely with cardiac output, let us first give our model certain characteristics that resemble those of an average adult person (see Figure 10-8A). Let the flow (Qh) generated by the heart (i.e., cardiac output) be 5 L/min; let mean arterial pressure, Pa, be 102 mm Hg; and let central venous pressure, Pv, be 2 mm Hg. The peripheral resistance, R, is the ratio of pressure difference (Pa − Pv) to flow (Qr) through the resistance vessels; this ratio equals 20 mm Hg/L/min. An arteriovenous pressure difference of 100 mm Hg is sufficient to force a flow (Qr) of 5 L/min through a peripheral resistance of 20 mm Hg/L/min. This flow (peripheral runoff) is precisely equal to the flow (Qh) generated by the heart. From heartbeat to heartbeat, the volume of blood in the arteries (Va) and the volume of blood in the veins (Vv) remain constant, because the volume of blood transferred from the veins to the arteries by the heart equals the volume of blood that flows from the arteries through the resistance vessels and into the veins.
Figure 10-8B illustrates the status of the circulation at the very beginning of an episode of cardiac arrest, that is, Qh = 0. Initially, the volumes of blood in the arteries (Va) and veins (Vv) have not had time to change. The arterial and venous pressures depend on Va and Vv, respectively. Therefore these pressures are identical to the respective pressures in panel A (i.e., Pa = 102 and Pv = 2). The arteriovenous pressure gradient of 100 mm Hg will force a flow (the peripheral runoff) of 5 L/min through the peripheral resistance of 20 mm Hg/L/min. Although cardiac output now equals 0 L/min, the flow through the microcirculation transiently equals 5 L/min. In other words, the potential energy stored in the arteries by the previous pumping action of the heart causes blood to be transferred from arteries to veins. This transfer occurs initially at the control rate, even though the heart can no longer transfer blood from the veins into the arteries.
As time passes, the blood volume in the arteries progressively decreases, and the blood volume in the veins progressively increases. Because the vessels are elastic structures, arterial pressure falls gradually and venous pressure rises gradually. This process continues until the arterial and venous pressures become equal (Figure 10-8C). Once this condition is reached, the flow (Qr) from the arteries to the veins through the resistance vessels is zero, as is the cardiac output (Qh).
At zero flow equilibrium (Figure 10-8C), the pressure attained in the arteries and veins depends on the relative compliances of these vessels. Had the arterial (Ca) and venous (Cv) compliances been equal, the decline in Pa would have been equal to the rise in Pv, because the decrement in arterial volume equals the increment in venous volume (the principle of “conservation of mass”). Pa and Pv would both have attained the average of Pa and Pv in Figure 10-8A and B—that is, Pa = Pv = (102 + 2)/2 = 52 mm Hg.
However, the veins are much more compliant than are the arteries; the compliance ratio is approximately equal to the ratio (Cv:Ca = 19) that we have assumed for the model. Hence, the transfer of blood from arteries to veins at equilibrium would induce a fall in arterial pressure that is 19 times as great as the concomitant rise in venous pressure. As shown in Figure 10-8C, Pv would increase by 5 mm Hg (from 2 to 7 mm Hg), whereas Pa would fall by 19 × 5 = 95 mm Hg (from 102 to 7 mm Hg). This equilibrium pressure that prevails in the circulatory system in the absence of flow is often referred to as the mean circulatory pressure, or static pressure. The pressure in the static system reflects the total volume of blood in the system and the overall compliance of the entire system.
The example of cardiac arrest in Figure 10-8 provides the basis for understanding the vascular function curves. Two important points on the curve have already been derived, as shown in Figure 10-9. One point (A) represents the normal operating status (depicted in Figure 10-8A). At that point, when cardiac output was 5 L/min, Pv was 2 mm Hg. Then, when flow stopped (cardiac output = 0), Pv became 7 mm Hg at equilibrium; this pressure is the mean circulatory pressure, Pmc.
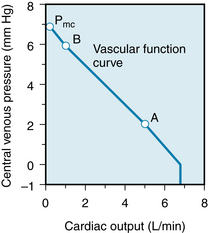
FIGURE 10-9 Changes in central venous pressure produced by changes in cardiac output. The mean circulatory pressure (or static pressure), Pmc, is the equilibrium pressure throughout the cardiovascular system when cardiac output is 0. Points B and A represent the values of venous pressure at cardiac outputs of 1 and 5 L/min, respectively.
The inverse relationship between central venous pressure and cardiac output (see Figure 10-9) simply denotes that when cardiac output is suddenly decreased, the peripheral runoff from arteries to veins is temporarily greater than the rate at which the heart pumps the blood from the veins back into the arteries. During that transient period, a net volume of blood is translocated from arteries to veins; hence Pa falls and Pv rises.
An example of a sudden increase in cardiac output, but with peripheral resistance remaining constant, illustrates how a third point, B, on the vascular function curve is derived. Consider that the arrested heart is suddenly restarted and that it immediately begins pumping blood from the veins into the arteries at a rate of 1 L/min (Figure 10-8D). When the heart first begins to beat, the arteriovenous pressure gradient is zero, and hence no blood flows from the arteries into the veins. When beating has just resumed, blood is being depleted from the veins at the rate of 1 L/min, and the arterial volume is being repleted at the same rate. Hence Pv begins to fall and Pa begins to rise. Because of the difference in compliances, Pa will rise 19 times more rapidly than Pv will fall.
The resulting pressure gradient causes blood to flow through the resistance. If the heart maintains a constant output of 1 L/min, Pa continues to rise and Pv continues to fall until the pressure gradient becomes 20 mm Hg. This gradient forces a flow of 1 L/min through a resistance of 20 mm Hg/L/min. This gradient is achieved by a 19–mm Hg rise (to 26 mm Hg) in Pa and a 1–mm Hg fall (to 6 mm Hg) in Pv. This equilibrium value of Pv = 6 mm Hg for a cardiac output of 1 L/min also appears (point B in Figure 10-9) on the vascular function curve. The curve reflects a net transfer of blood from the venous to the arterial side of the circuit after the heart has been restarted, and consequently, Pv is reduced.
The reduction of Pv that can be achieved by an increase in cardiac output is limited. At some critical maximal value of cardiac output, sufficient fluid is translocated from the venous to the arterial side of the circuit to reduce Pv below the ambient pressure. In a system of very distensible vessels, such as the venous system, the vessels collapse when the intravascular pressure falls below the extravascular pressure. This venous collapse constitutes an impediment to venous return to the heart. Hence, in the example in Figure 10-9, it limits the maximal value of cardiac output to 7 L/min, regardless of the capabilities of the pump. For readers interested in the mathematical derivation of these results, the basic equations are presented in the next section.
Mathematical Analysis of the Vascular Function Curve
From the definition of peripheral resistance (see Chapter 6):
 (2)
(2)where R is resistance, Pa is arterial pressure, Pv is venous pressure, and Qr is blood flow through the resistance vessels. At equilibrium, Qr equals cardiac output, Qh. Assume that R = 20 and that Qh had been 0 but that it had then been increased to a constant value of 1 L/min (Figure 10-10, arrow 1). If we solve Equation 2 for Pa when the system is in equilibrium (i.e., Qr = Qh), then:
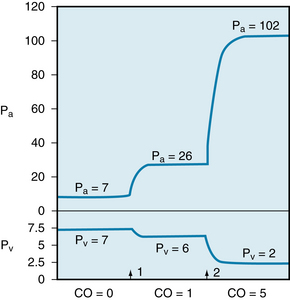
FIGURE 10-10 Changes in arterial (Pa) and venous (Pv) pressures in the circulatory model shown in Figure 10-8. The total peripheral resistance is 20 mm Hg/l/min, and the ratio of Cv to Ca is 19:1. The cardiac output (CO) is 0 to the left of arrow 1. It is increased to 1 L/min at arrow i, and to 5 L/min at arrow 2.
 (3)
(3)Thus Pa increases to a value 20 mm Hg greater than Pv. It continues to be 20 mm Hg above Pv, as long as the pump output is maintained at 1 L/min and the peripheral resistance remains at 20 mm Hg/L/min. We can calculate what the actual changes in Pa and Pv will be when Qr attains a constant value of 1 L/min. The arterial volume increment needed to achieve the required level of Pa depends entirely on the arterial compliance, Ca. For a rigid arterial system (low compliance), this volume is small; for a distensible system, the volume is large. Whatever the magnitude, however, the change in volume represents the translocation of some quantity of blood from the venous to the arterial side of the circuit.
For a given total blood volume, any increment in arterial volume (ΔVa) must equal the decrement in venous volume (ΔVv); that is:
 (4)
(4)From the definition of compliance:
 (5)
(5)and
 (6)
(6)By substitution into equation 4:
 (7)
(7)Given that Cv is 19 times as great as Ca, the increment in Pa is 19 times as great as the decrement in Pv; that is:
 (8)
(8)To calculate the absolute values of Pa and Pv, let ΔPa represent the difference between the prevailing Pa and the mean circulatory pressure (Pmc); that is, let:
 (9)
(9)and let ΔPv represent the difference between the prevailing Pv and the mean circulatory pressure. Then:
 (10)
(10)Substituting these values for ΔPa and ΔPv into Equation 8:
 (11)
(11)By solving equations 3 and 11 simultaneously:
 (12)
(12)and
 (13)
(13)Hence, for a mean circulatory pressure of 7 mm Hg, Pa increases to 26 mm Hg and Pv decreases to 6 mm Hg when Qh increases from 0 to 1 L/min (see Figure 10-10). These pressure changes provide the required arteriovenous pressure gradient of 20 mm Hg.
If the pump output is abruptly increased to a constant level of 5 L/min (Figure 10-10, arrow 2) and peripheral resistance remains constant at 20 mm Hg/L/min, an additional volume of blood is translocated from the venous to the arterial side of the circuit. The blood progressively accumulates in the arteries until Pa reaches a level of 100 mm Hg above Pv, as shown by substitution into Equation 3:
 (14)
(14)By solving equations 11 and 14 simultaneously, we find that Pa rises to a value of 95 mm Hg above Pmc, and Pv falls to a value 5 mm Hg below Pmc. In Figure 10-10, therefore, Pv declines to 2 mm Hg and Pa rises to 102 mm Hg. The resulting pressure gradient of 100 mm Hg will force a cardiac output of 5 L/min through a constant peripheral resistance of 20 mm Hg/L/min.
The following equation for Pv as a function of Qr in the model is derived from equations 2, 7, 9, and 10:
 (15)
(15)Equation 15 has the form of a straight line and satisfies the relation y = mx + b. Note that the slope (m) depends only on R, Ca and Cv. Note also that when Qr = 0, then Pv = Pmc; that is, at zero flow, Pv equals the mean circulatory pressure.
Venous Pressure Depends on Cardiac Output
Experimental and clinical observations have shown that changes in cardiac output do indeed evoke the alterations in Pa and Pv that have been predicted previously for our simplified model. In an experiment on an anesthetized dog, for example, a mechanical pump was substituted for the right ventricle (Figure 10-11). As the cardiac output, Q, was diminished in a series of small steps, Pa fell and Pv rose.
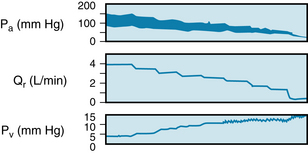
FIGURE 10-11 Changes in arterial (Pa) and central venous (Pv) pressures produced by changes in systemic blood flow (Qr) in a canine right-heart bypass preparation. Stepwise changes in Qr were produced by altering the rate of a mechanical pump.
(From Levy MN: The cardiac and vascular factors that determine systemic blood flow. Circ Res 44:739, 1979.)
Blood Volume
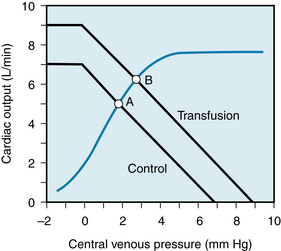
The vascular function curve is affected by variations in total blood volume. During circulatory standstill (i.e., zero cardiac output), the mean circulatory pressure depends only on total vascular compliance and blood volume, as stated previously. Thus, for a given vascular compliance, the mean circulatory pressure will increase when the blood volume is expanded (hypervolemia), and it will decrease when the blood volume is diminished (hypovolemia). This is illustrated by the y-axis intercepts in Figure 10-12, in which the mean circulatory pressure is 5 mm Hg after hemorrhage and is 9 mm Hg after transfusion. These values compare with that of 7 mm Hg when the blood volume is normal (normovolemia).
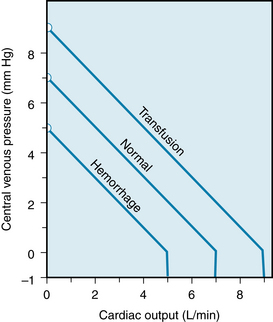
FIGURE 10-12 Effects of increased blood volume (Transfusion curve) and of decreased blood volume (Hemorrhage curve) on the vascular function curve. Similar shifts in the vascular function curve are produced by increases and decreases, respectively, in venomotor tone.
Figure 10-12 shows that the cardiac output at which Pv = 0 varies directly with the blood volume. Therefore, the maximal value of cardiac output becomes progressively more limited as the total blood volume is reduced. However, the pressure (Pv = 0) at which the veins collapse (denoted by the sharp change in slope of the vascular function curve) is not altered appreciably by changes in blood volume. This pressure depends only on the pressure surrounding the central veins.
Furthermore, the differences in Pv during hypervolemia, normovolemia, and hypovolemia in the static system are preserved at each level of cardiac output, such that the vascular function curves parallel one another (see Figure 10-12). To illustrate, consider the example of hypervolemia, in which the mean circulatory pressure is 9 mm Hg. In Figure 10-12, both Pa and Pv would be 9 mm Hg, instead of 7 mm Hg, when the cardiac output is zero. With a sudden increase in cardiac output to 1 L/min (at arrow 1 in Figure 10-10), if the peripheral resistance were still 20 mm Hg/L/min, an arteriovenous pressure gradient of 20 mm Hg would still be necessary for 1 L/min to flow through the resistance vessels. This does not differ from the example for normovolemia. If we assume the same Cv:Ca ratio of 19:1, the pressure gradient would be achieved by a 1–mm Hg decline in Pv and a 19–mm Hg rise in Pa. Hence a change in cardiac output from 0 to 1 L/min would evoke the same 1–mm Hg reduction in Pv. This change in Pv would apply, irrespective of the blood volume, as long as Ca, Cv, and the peripheral resistance were independent of the blood volume. Equation 15 also discloses that the slope of the vascular function curve remains constant as long as R, Cv, and Ca do not change.
Venomotor Tone
The effects of changes in venomotor tone on the vascular function curve closely resemble those of changes in blood volume. In Figure 10-12, for example, the transfusion curve could just as well represent increased venomotor tone, whereas the hemorrhage curve could represent decreased tone. During circulatory standstill, for a given blood volume, the pressure within the vascular system will rise as the tension exerted by the smooth muscle within the vascular walls increases. It is principally the arteriolar and venous smooth muscles that are mainly under nervous or humoral control. The fraction of the blood volume located within the arterioles is very small, whereas the blood volume in the veins is large (see Table 1-1). Therefore, if the blood volume remains constant, only changes in venous tone can alter the mean circulatory pressure appreciably. Hence, mean circulatory pressure rises with increased venomotor tone and falls with diminished tone.
Experimentally, the pressure attained shortly after abrupt circulatory standstill is usually above 7 mm Hg, even when blood volume is normal. The pressure change is attributable to the generalized venoconstriction elicited by cerebral ischemia, activation of the arterial and central chemoreceptors, and reduced excitation of the arterial baroreceptors. If resuscitation is not successful, this reflex response subsides as central nervous activity ceases. When blood volume is normal, the mean circulatory pressure usually approaches a value close to 7 mm Hg.
Blood Reservoirs
Venoconstriction is considerably greater in certain regions of the body than in others. Large vascular beds that undergo appreciable venoconstriction constitute blood reservoirs. The vascular bed of the skin is one of the major blood reservoirs in humans. Blood loss evokes profound subcutaneous venoconstriction, which is responsible for the characteristic pale appearance of the skin in people who have lost a substantial amount of blood. The resulting diversion of blood away from the skin liberates several hundred milliliters of blood, to be perfused through more vital regions. The vascular beds of the liver, lungs, and spleen are also important blood reservoirs. In the dog, the spleen is packed with red blood cells, and it can constrict to a small fraction of its normal size. During hemorrhage, this mechanism autotransfuses blood of high erythrocyte content into the general circulation. However, in humans the volume changes of the spleen are considerably smaller (see also Chapter 13).
Peripheral Resistance
The changes in the vascular function curve induced by changes in arteriolar tone are shown in Figure 10-13. The arterioles contain only about 3% of the total blood volume (see Table 1-1). Changes in the contractile state of these vessels do not significantly alter the mean circulatory pressure, as stated previously. Thus, the family of vascular function curves that represent different peripheral resistances converges at a common point on the ordinate.
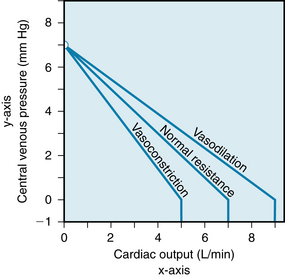
FIGURE 10-13 Effects of arteriolar vasodilation and vasoconstriction on the vascular function curve.
At any given cardiac output, Pv varies inversely with the arteriolar tone, all other factors remaining constant. Arteriolar constriction sufficient to double the peripheral resistance causes a twofold rise in Pa (see Chapter 7). In the example shown in Figure 10-10, a change in the cardiac output from 0 to 1 L/min (arrow 1) caused Pa to rise from 7 to 26 mm Hg, an increment of 19 mm Hg. If peripheral resistance had been twice as great, the same change in cardiac output would have evoked twice as great an increment in Pa.
To achieve this greater rise in Pa, twice as great an increment in blood volume would be required on the arterial side of the circulation, if the arterial compliance remained constant. Given a constant total blood volume, this larger arterial volume signifies a corresponding reduction in venous volume. Hence, the decrement in venous volume would be twice as great when the peripheral resistance was doubled.
If venous compliance remained constant, a twofold reduction in venous volume would be reflected by a twofold decline in Pv. Therefore, an increase in cardiac output from 0 L/min to 1 L/min (Figure 10-10, arrow 1) would have caused a 2–mm Hg decrement in Pv, to a level of 5 mm Hg. Similarly, greater increases in cardiac output would have evoked proportionately greater decrements in Pv under conditions of increased peripheral resistance than when the levels of resistance were normal.
This relationship between the peripheral resistance and the decrement in Pv, together with the failure of peripheral resistance to affect the mean circulatory pressure, accounts for the clockwise rotation of the vascular function curves with increased peripheral resistance (see Figure 10-13). Conversely, arteriolar vasodilation is associated with a counterclockwise rotation from the same vertical axis intercept. A higher maximal level of cardiac output is attainable when the resistance vessels are dilated than when they are constricted.
Cardiac Output and Venous Return are Closely Associated
Except for small, transient disparities, the heart is unable to pump any more blood than is delivered to it through the venous system. Similarly, because the circulatory system is a closed circuit, the venous return must equal the cardiac output over any appreciable time interval. The flow around the entire closed circuit depends on the capability of the pump, the characteristics of the circuit, and the total volume of fluid in the system. “Cardiac output” and “venous return” are simply two terms for the flow around the closed circuit. Cardiac output is the volume of blood being pumped by the heart per unit time; venous return is the volume of blood returning to the heart per unit time. At equilibrium, these two flows are equal.
The techniques of circuit analysis are applied here in an effort to gain some insight into the control of flow around the vascular circuit. Acute changes in cardiac contractility, peripheral resistance, or blood volume may transiently affect cardiac output and venous return disparately. Except for such brief disparities, however, such factors simply alter flow around the entire circuit. Whether one thinks of that flow as cardiac output or as venous return is irrelevant. Many writers have ascribed a reduction in cardiac output during some intervention, such as hemorrhage, to a decrease in venous return. Such an explanation, however, may be an example of circular reasoning. Hemorrhage reduces flow around the entire circuit, for reasons to be elucidated. To attribute the reduction in cardiac output to a curtailment of venous return is equivalent to ascribing the decrease in total blood flow to a decrease in total blood flow!
The Heart and Vasculature are Coupled Functionally
In accordance with Starling law of the heart, cardiac output depends intimately on the right atrial (or central venous) pressure. Furthermore, right atrial pressure is approximately equal to right ventricular end-diastolic pressure, because the normal tricuspid valve constitutes a low-resistance junction between the right atrium and right ventricle. In the discussion that follows, graphs of cardiac output as a function of central venous pressure (Pv) are called cardiac function curves. Extrinsic regulatory influences may be expressed as shifts in such curves, as indicated previously (see Figure 5-23).
A typical cardiac function curve is plotted on the same coordinates as a normal vascular function curve in Figure 10-14. The cardiac function curve is plotted according to the usual convention; that is, the variable (Pv) plotted along the abscissa is the independent variable (stimulus), and the variable (cardiac output) that is plotted along the ordinate is the dependent variable (response). In accordance with the Frank-Starling mechanism, the cardiac function curve reveals that a rise in Pv causes an increase in cardiac output.
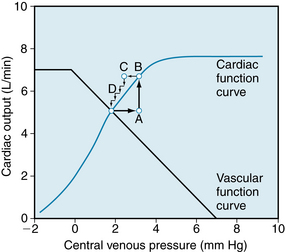
FIGURE 10-14 Typical vascular and cardiac function curves plotted on the same coordinate axes. Note that to plot both curves on the same graph, it is necessary to reverse the x and y axes for the vascular function curves shown in Figures 10-9, 10-12 and 10-13. The coordinates of the equilibrium point, at the intersection of the cardiac and vascular function curves, represent the stable values of cardiac output and central venous pressure at which the system tends to operate. Any perturbation (e.g., when venous pressure is suddenly increased to point A) institutes a sequence of changes in cardiac output and venous pressure that restore these variables to their equilibrium values (points B through D; see text for explanation).
Conversely, the vascular function curve describes an inverse relationship between cardiac output and Pv; that is, a rise in cardiac output causes a reduction in Pv. Pv is the dependent variable (or response), and cardiac output is the independent variable (or stimulus) for the vascular function curve. By convention, Pv should be scaled along the y-axis, and cardiac output should be scaled along the x-axis. Note that this convention is observed for the vascular function curves displayed in Figures 10-9, 10-12, and 10-13.
However, to include the vascular function curve on the same set of coordinate axes with the cardiac function curve (see Figure 10-14), it is necessary to violate the plotting convention for one of these curves. We have arbitrarily violated the convention for the vascular function curve. Note that the vascular function curve in Figure 10-14 reflects how Pv (scaled along the x-axis) varies in response to a change of cardiac output (scaled along the y-axis).
The equilibrium point of a system represented by a given pair of cardiac and vascular function curves is defined by the intersection of these two curves. The coordinates of this equilibrium point represent the values of cardiac output and Pv at which such a system tends to operate. Only transient deviations from such values for cardiac output and Pv are possible, as long as the given cardiac and vascular function curves accurately describe the system.
The tendency for the cardiovascular system to operate around such an equilibrium point may best be illustrated by examining its response to a sudden perturbation. Consider the changes elicited by a sudden rise in Pv from the equilibrium point to point A in Figure 10-14. Such a change might be induced by rapid injection, during ventricular diastole, of a given volume of blood on the venous side of the circuit. The injection of the volume of blood would be accompanied by the withdrawal of an equal volume from the arterial side, so that the total blood volume would remain constant.
As defined by the cardiac function curve in Figure 10-14, this elevated Pv would increase cardiac output (A to B) during the very next ventricular systole. The increased cardiac output, in turn, would result in the net transfer of blood from the venous to the arterial side of the circuit, with a consequent reduction in Pv. In one heartbeat, the reduction in Pv would be small (B to C) because the heart would transfer only a tiny fraction of the total venous blood volume over to the arterial side. Because of this reduction in Pv, the cardiac output during the very next beat diminishes (C to D) by an amount dictated by the function curve. Because point D is still above the intersection point, the heart will pump blood from the veins to the arteries at a rate greater than that at which the blood will flow across the peripheral resistance from arteries to veins. Hence Pv will continue to fall. This process will continue, in diminishing steps, until the point of intersection is reached. Only one specific combination of cardiac output and venous pressure (denoted by the coordinates of the point of intersection) will simultaneously satisfy the requirements of the cardiac and vascular function curves.
Myocardial Contractility
Combinations of cardiac and vascular function curves help explain the effects of alterations in ventricular contractility. In Figure 10-15, the lower cardiac function curve represents the control state, whereas the upper curve reflects an increased contractility. This pair of curves is analogous to the family of ventricular function curves shown in Figure 5-23. The enhancement of ventricular contractility might be achieved by electrical stimulation of the cardiac sympathetic nerves. If the effects of such stimulation were restricted to the heart, the vascular function curve would be unaffected. Therefore one vascular function curve would suffice, as shown in Figure 10-15.
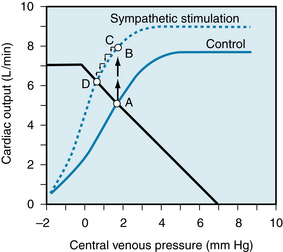
FIGURE 10-15 Enhancement of myocardial contractility, as by cardiac sympathetic nerve stimulation, causes the equilibrium values of cardiac output and venous pressure (Pv) to shift from the intersection (point A) of the control vascular and cardiac function curves (solid lines) to the intersection (point D) of the same vascular function curve with the cardiac function curve (dashed line) that represents enhanced myocardial contractility. See text for explanation of points B and C.
During the control state, the equilibrium values for cardiac output and Pv are designated by point A. Cardiac sympathetic nerve stimulation would abruptly raise cardiac output to point B, because of the enhanced contractility, before Pv would change appreciably. However, this high cardiac output would increase the net transfer of blood from the venous to the arterial side of the circuit. Consequently, Pv would begin to fall (point C). Cardiac output would continue to fall until a new equilibrium point (D) was reached. This point is located at the intersection of the vascular function curve with the new cardiac function curve. The new equilibrium point (D) lies above and to the left of the control equilibrium point (A). This shift reveals that sympathetic stimulation evokes a greater cardiac output at a lower level of Pv.
Such a change accurately describes the true response. In the experiment depicted in Figure 10-16, the left stellate ganglion was stimulated between the two arrows. During stimulation, aortic flow (cardiac output) rose quickly to a peak value. The flow then fell gradually to a steady-state value, which was significantly greater than the control level. The increased aortic flow was accompanied by reductions in right and left atrial pressures (PRA and PLA). The initial, abrupt rise in cardiac output in this experiment represents the shift from A to B in Figure 10-15, whereas the subsequent, more gradual reductions in cardiac output and atrial pressure in the experiment represent the progressive shift from B to D.
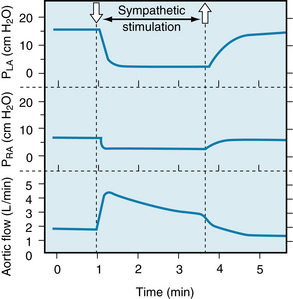
FIGURE 10-16 During electrical stimulation of the left stellate ganglion (containing cardiac sympathetic nerve fibers), aortic blood flow increased while pressures in the left atrium (PLA) and right atrium (PRA) diminished. These data conform to the conclusions derived from Figure 10-15, in which the equilibrium values of cardiac output and venous pressure are observed to shift from point A to point D during cardiac sympathetic nerve stimulation.
(Redrawn from Sarnoff SJ, Brockman SK, Gilmore JP, et al: Regulation of ventricular contraction. Influence of cardiac sympathetic and vagal nerve stimulation on atrial and ventricular dynamics. Circ Res 8:1108, 1960.)
Blood Volume
Changes in blood volume affect the vascular function curve in the manner shown in Figure 10-12. To understand the circulatory alterations evoked by a given change in blood volume, the appropriate cardiac function curve should be plotted along with the vascular function curves that represent the control and experimental states.
Figure 10-17 illustrates the response to a blood transfusion. Equilibrium point B, which denotes the values for cardiac output and Pv after transfusion, lies above and to the right of the control equilibrium point, A. Thus the transfusion increases both cardiac output and Pv. Hemorrhage has the opposite effect. Mechanistically, the change in ventricular filling pressure (central venous pressure), evoked by a given change in blood volume, alters cardiac output. This is accomplished by changing the sensitivity of the contractile proteins to the prevailing level of intracellular Ca++, as explained in Chapters 4 and 5. Pure increases or decreases in venomotor tone elicit responses analogous to those evoked by augmentations or reductions, respectively, of the total blood volume, for reasons discussed later.
Peripheral Resistance
Predictions concerning the effects of changes in peripheral vascular resistance are complex because both the cardiac and vascular function curves shift. With increased peripheral resistance (Figure 10-18), the vascular function curve is rotated counterclockwise. However, it converges to the same Pv-axis intercept as does the control curve (see Figure 10-13); the directions of rotation differ in Figures 10-13 and 10-18 because the axes were switched for the vascular function curves in the two figures. The cardiac function curve is also shifted downward because (1) as peripheral resistance increases, arterial pressure (afterload) tends to rise and (2) at any given Pv, the heart is able to pump less blood against a greater afterload. Because the cardiac and vascular function curves are both displaced downward, the new equilibrium point, B, falls below the control point, A.
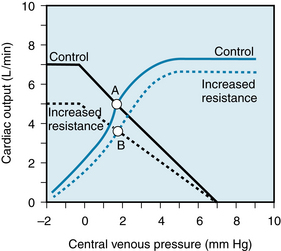
FIGURE 10-18 An increase in peripheral resistance shifts the cardiac and vascular function curves downward. At equilibrium the cardiac output is less (point B) when the peripheral resistance is high than when it is normal (point A).
Whether point B falls directly below point A or lies to the right or left of it depends on the magnitude of the shift in each curve. For example, if a given increase in peripheral resistance shifts the vascular function curve more than it does the cardiac function curve, the equilibrium point B will fall below and to the left of A; that is, both cardiac output and Pv will diminish. Conversely, if the cardiac function curve is displaced more than the vascular function curve, point B will fall below and to the right of point A; that is, cardiac output will decrease but Pv will rise somewhat.
CLINICAL BOX
“Heart failure” is the general term that refers to those conditions in which the heart is not able to provide adequate blood flow to the tissues of the body. Heart failure may be acute or chronic. Acute heart failure may be caused by toxic quantities of drugs and anesthetics or by certain pathological conditions, such as a sudden coronary artery occlusion. Chronic heart failure may occur in such conditions as essential hypertension and ischemic heart disease. In these various forms of heart failure, myocardial contractility is impaired. Consequently, the cardiac function curve is shifted downward and to the right, as shown in Figure 10-19.
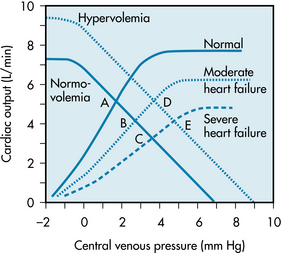
FIGURE 10-19 With moderate or severe heart failure, the cardiac function curves are shifted to the right. Before any change in blood volume, cardiac output decreases and central venous pressure rises (from control equilibrium point A to point B or C). After the increase in blood volume that usually occurs in heart failure, the vascular function curve is shifted to the right. Hence, central venous pressure may be elevated with no reduction in cardiac output (point D) or (in severe heart failure) with some diminution in cardiac output (point E).
In acute heart failure, blood volume does not change immediately. Therefore, the equilibrium point of the cardiac and vascular function curves will shift from the intersection of the normal curves (Figure 10-19, point A) to the intersection of the normal vascular function curve, with a cardiac function curve that denotes impaired contractility (point B or C).
In chronic heart failure, both the cardiac function and vascular function curves shift. The vascular function curve shifts because of an increase in blood volume caused in part by fluid retention by the kidneys. The fluid retention is related to the concomitant reduction in glomerular filtration rate and to the greater secretion of aldosterone by the adrenal cortex. The resulting hypervolemia is reflected by a rightward shift of the vascular function curve, as shown in Figure 10-19. Hence, with moderate degrees of heart failure, Pv is elevated, but cardiac output is approximately normal (point D). With more severe degrees of heart failure, Pv will be still higher but cardiac output will be subnormal (point E).
The Right Ventricle Regulates not only Pulmonary Blood Flow but also Central Venous Pressure
The interrelations between cardiac output and central venous pressure are complicated and perplexing. The simplified circulation model includes just one pump and only the systemic circulation. The interrelations are much more complex when the systemic and pulmonary circulations and the left and right ventricles are included in the analysis. However, the systemic and pulmonary vascular systems are important components of the cardiovascular systems in mammals, and therefore the more complete model does merit analysis.
Figure 10-20 shows a more complete, but still oversimplified, cardiovascular system model that contains two pumps in series (the left and right ventricles) and two vascular beds in series (the systemic and pulmonary vasculatures). The series arrangement requires that the flows pumped by the two ventricles be virtually equal to each other over any substantial period. Otherwise, the blood would ultimately accumulate in one or the other of the vascular systems. Because the cardiac function curves for the two ventricles differ substantially, the filling (atrial) pressures for the two ventricles must differ appropriately to ensure equal stroke volumes (see Figure 5-21).
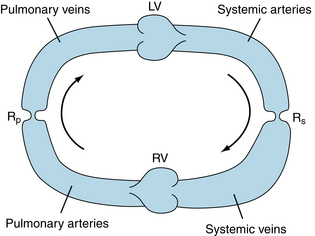
FIGURE 10-20 Simplified cardiovascular system model that consists of left (LV) and right (RV) ventricles, systemic (Rs) and pulmonary (Rp) vascular resistances, systemic arterial and venous compliances, and pulmonary arterial and venous compliances. Arrows indicate direction of blood flow.
Two basic tenets about ventricular function are (1) the left ventricle is the pump that forces blood through the systemic vasculature and (2) the right ventricle is the pump that forces blood through the pulmonary vasculature. Although these assertions are essentially correct, it is instructive to examine right ventricular function in more detail.
Consider the effect on the circulatory system model shown in Figure 10-20 if the right ventricle suddenly ceases to function as a pump and instead serves as a passive, low-resistance conduit between the systemic veins and the pulmonary arteries. In such a circulatory system, the only pump would then be the left ventricle. The left ventricle would now be required to pump blood through two vascular resistances in series, namely the systemic and pulmonary resistances. We shall consider the resistance of the right ventricle itself to be negligible.
Normally, pulmonary resistance is about 10% as great as systemic resistance. The total resistance would be 10% greater than the systemic resistance alone (see Chapter 6) because the two resistances are in series with each other. In a normal cardiovascular system, a 10% increase in systemic vascular resistance would increase mean arterial pressure (and hence left ventricular afterload) by approximately 10%. This would not affect left ventricular function drastically. However, when the 10% increase in total resistance is achieved by adding a small resistance (i.e., the pulmonary resistance) downstream of the systemic resistance, and that resistance is separated from the systemic resistance by a large compliance (the combined systemic venous and pulmonary arterial compliance), the 10% increase in total resistance then affects the cardiovascular system drastically.
The simulated effects of inactivating the pumping action of the right ventricle in a hydraulic analog of the circulatory system are shown in Figure 10-21. In the model, the right and left ventricles generate cardiac outputs that vary directly with their respective filling pressures. Under control conditions, the output of the right ventricle (5 L/min) is equal to that of the left ventricle. The right ventricular pumping action causes the pressure in the pulmonary artery to exceed the pressure in the pulmonary veins by an amount that will force fluid through the pulmonary vascular resistance at a rate of 5 L/min.
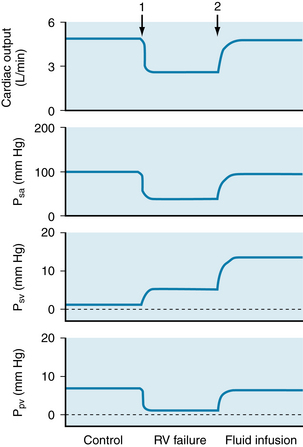
FIGURE 10-21 The changes in cardiac output, systemic arterial pressure (Psa), systemic venous pressure (Psv), and pulmonary venous pressure (Ppv) evoked by simulated right ventricular failure and by simulated fluid infusion in the circulatory model shown in Figure 10-20. At arrow 1, the pumping action of the right ventricle was discontinued (simulated right ventricular [RV] failure), and the right ventricle served only as a low-resistance conduit. At arrow 2, fluid volume was expanded, and the right ventricle continued to serve only as a conduit.
(Modified from Furey SA, Zieske HA, Levy MN: The essential function of the right ventricle. Am Heart J 107:404, 1984.)
When the right ventricle ceases pumping (arrow 1), the systemic venous and pulmonary arterial systems become a common passive conduit with a large compliance. Pulmonary arterial pressure decreases (not shown), and systemic venous pressure rises to a common value (5 mm Hg in Figure 10-21). At this low pressure, however, fluid flows from the pulmonary arteries to the pulmonary veins at a greatly reduced rate. At the same time, the left ventricle initially pumps fluid from the pulmonary veins to the systemic arteries at the control rate of 5 L/min. Hence pulmonary venous pressure drops precipitously. Left ventricular (cardiac) output also drops abruptly because pulmonary venous pressure is the preload for the left ventricle. This effect, in turn, results in a rapid reduction in systemic arterial pressure. In summary, cessation of right ventricular pumping causes marked reductions in cardiac output, in systemic arterial pressure, and in pulmonary venous pressure as well as a modest rise in systemic venous pressure (Figure 10-21).
Most of the hemodynamic problems induced by inactivating the right ventricle can be reversed by increasing the fluid (blood) volume of the system (arrow 2, Figure 10-21). If fluid is added until pulmonary venous pressure (left ventricular preload) is raised to its control value, cardiac output and systemic arterial pressure are restored to normal, but systemic venous pressure is abnormally elevated. In a human subject, such a rise in systemic venous pressure may lead to the accumulation of fluid (edema) in the dependent regions of the body; such edema is characteristic of right heart failure.
Severe contractile failure of the right ventricle is the equivalent of overstressing the left ventricle by adding in series a relatively small (10%) hydraulic resistance (pulmonary vascular resistance) to the normal systemic vascular resistance. Ordinarily, increasing the systemic vascular resistance itself by 10% does not seriously stress the cardiovascular system. However, when the 10% additional resistance is downstream of the systemic venous bed (which has a very large compliance), it may diminish cardiac output drastically. The main compensatory response of the body is to increase blood volume, in part by renal retention of fluid and electrolytes. However, this compensatory response may lead to severe peripheral edema.
With these findings in mind, we might reassess the principal function of the right ventricle as follows: From the viewpoint of providing sufficient flow of blood to all the tissues in the body, the left ventricle alone is adequate to carry out this function. The operation of two ventricles in series is not essential to provide adequate blood flow to the tissues. The crucial function of the right ventricle is therefore to prevent the rise in systemic venous (and pulmonary arterial) pressure that would be required to force the normal cardiac output through the pulmonary vascular resistance. Preventing the abnormal rise in systemic venous pressure also prevents extensive dependent edema.
CLINICAL BOX
Any change in contractility that affects the two ventricles disparately alters the distribution of blood volume in the two vascular systems. For example, if a coronary artery to the left ventricle becomes occluded suddenly, left ventricular contractility is impaired and left ventricular failure ensues. Instantaneously, left atrial pressure does not change perceptibly and the left ventricle begins to pump a diminished flow. If the right ventricle is not affected by the acute coronary artery occlusion, the right ventricle initially continues to pump the normal flow. The disparate right and left ventricular outputs result in a progressive increase in left atrial pressure and a progressive decrease in right atrial pressure. Therefore left ventricular output increases toward the normal value and the right ventricular output falls below the normal value. This process continues until the outputs of the two ventricles become equal again. At this new equilibrium, the outputs of the two ventricles are subnormal. The elevated left atrial pressure is accompanied by an equally elevated pulmonary venous pressure, which can have serious clinical consequences. The high pulmonary venous pressure can increase lung stiffness and lead to respiratory distress by increasing the mechanical work of pulmonary ventilation. Furthermore, the high pulmonary venous pressure elevates the hydrostatic pressure in the pulmonary capillaries, and hence may lead to transudation of fluid from the pulmonary capillaries to the pulmonary interstitium or into the alveoli themselves (pulmonary edema). The last of these consequences may be lethal.
CLINICAL BOX
In humans, right heart failure may be caused by occlusive disease predominantly of the coronary vessels to the right ventricle; these vessels are affected much less commonly than are the vessels to the left ventricle. The major hemodynamic effects of acute right heart failure are pronounced reductions in cardiac output and in arterial blood pressure, and the principal treatment consists of infusion of blood or plasma. Bypass of the right ventricle is not infrequently implemented surgically for patients with certain congenital cardiac defects, such as severe narrowing of the tricuspid valve and maldevelopment of the right ventricle. The effects of acute right heart failure or of right ventricular bypass are directionally similar to those predicted by the model study (see Figure 10-21).
Heart Rate has Ambivalent Effects on Cardiac Output
Cardiac output is the product of stroke volume and heart rate. The preceding analysis of the control of cardiac output was, in reality, restricted to the control of stroke volume, and the role of heart rate was neglected. The effect of changes in heart rate on cardiac output are now considered. The analysis is complex, because a change in heart rate alters the other three factors (preload, afterload, and contractility) that determine stroke volume (see Figure 10-1). An increase in heart rate, for example, would decrease the duration of diastole. Hence, ventricular filling would be diminished; that is, preload would be reduced. If the proposed increase in heart rate did alter cardiac output, the arterial pressure would change; that is, afterload would be changed. Finally, the rise in heart rate would increase the net rate of Ca++ influx into the myocardial cells, enhancing myocardial contractility (see Chapter 4).
Heart rate has been varied by artificial pacing in many types of experimental preparations and in humans. The effects on cardiac output have usually resembled the experimental results shown in Figure 10-22. In this experiment on an anesthetized dog, the stroke volume progressively diminished as the atrial pacing frequency was gradually increased (Figure 10-22A). Presumably, the curtailment of stroke volume was induced by the abridged time for ventricular filling.
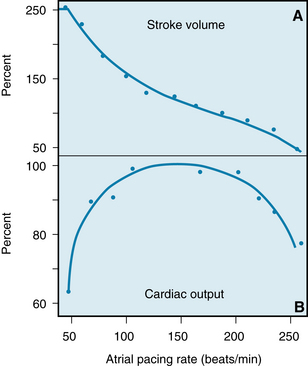
FIGURE 10-22 The changes in stroke volume (A) and cardiac output (B) induced by changing the rate of atrial pacing in an anesthetized dog.
(Redrawn from Kumada M, Azuma T, Matsuda K: The cardiac output-heart rate relationship under different conditions. Jpn J Physiol 17:538, 1967.)
The change in cardiac output induced by a change in heart rate is influenced markedly by the actual level of the heart rate. In the experiment shown in Figure 10-22, for example, as the pacing frequency was increased within the range of 50 to 100 beats per minute (beats/min), an increase in heart rate augmented the cardiac output (Qh). Over this lower frequency range, the reduction in stroke volume evoked by a given increase in heart rate (HR) was proportionately less than the increase in heart rate itself. Consequently, because Qh = SV × HR, a given increment in HR would exceed the induced decrement in SV. Hence the induced Qh would exceed the initial Qh.
Over the frequency range from about 100 to 200 beats/min, however, cardiac output was not affected appreciably by changes in pacing frequency (Figure 10-22B). As the pacing frequency was increased, the stroke volume decreased in proportion to the increase in heart rate. Finally, at excessively high pacing frequencies (above 200 beats/min), increments in heart rate decreased the cardiac output. Therefore the induced decrement in SV must have exceeded the increment in HR over this high range of pacing frequencies. Although the relationship of Qh to HR is characteristically that of an inverted U, the relationship varies quantitatively among subjects and among physiological states in any given subject.
The reason for the observed correlations between cardiac output and heart rate should be interpreted very cautiously. During physical exercise, for example, cardiac output and heart rate often rise proportionately, and stroke volume may change very little (see Chapter 13). One is tempted to conclude that the increase in cardiac output must be caused by the observed increase in heart rate, because the correlation between cardiac output and heart rate is striking. However, Figure 10-22 emphasizes that, over a wide range of heart rates, a change in heart rate has little influence on cardiac output. Several studies on exercising subjects have confirmed that, even during exercise, changes in pacing frequency over a substantial frequency range do not alter cardiac output very much.
CLINICAL BOX
The characteristic relationship between cardiac output and heart rate explains the urgent need for treatment of patients who have excessively slow or excessively fast heart rates. Profound bradycardias (slow rates) may occur as the result of a very slow sinus rhythm in patients with sick sinus syndrome or as the result of a slow idioventricular rhythm in patients with complete atrioventricular block. In either rhythm disturbance, the capacity of the ventricles to fill during a prolonged diastole is limited (often by the noncompliant pericardium). Hence, cardiac output usually decreases substantially because the very slow heart rate cannot be overcome by a sufficiently great stroke volume. Consequently, these rhythm disturbances often require installation of an artificial pacemaker.
At the other end of the heart rate spectrum, excessively high heart rates in patients with supraventricular or ventricular tachycardias often require emergency treatment because their cardiac outputs may be critically low. In such patients, the filling time is so restricted at very high heart rates that small additional reductions in filling time elicit disproportionately severe reductions in filling volume. Reversion of the tachycardia to a more normal rhythm can usually be accomplished pharmacologically. However, cardioversion, which delivers a strong electric current across the thorax or directly to the heart through an implanted device, may be required in emergencies.
The principal increase in cardiac output during exercise must therefore, be ascribed to (1) the pronounced reduction in peripheral vascular resistance, (2) the positive inotropic effect of the increased sympathetic neural activity on the ventricular myocardium, and (3) the auxiliary pumping action of the contracting skeletal muscles. These factors are combined with the directional effects on blood flow brought about by the venous valves (as explained later in this chapter). The attendant changes in heart rate are not inconsequential, however. If the heart rate cannot increase normally during exercise, the augmentation of cardiac output and the capacity for exercise may be severely limited. The increase in heart rate plays a permissive role in augmenting cardiac output, even if it is not proper to assign HR to a primary, causative role. The mechanisms responsible for raising heart rate in precise proportion to the increase in cardiac output are undoubtedly neural in origin, but the specific components of the reflex arcs have not yet been elucidated.
Ancillary Factors Affect the Venous System and Cardiac Output
The interrelationships between central venous pressure and cardiac output have been explained in an oversimplified fashion, and the described effects have been evoked by changes in isolated variables. However, because many feedback control loops regulate the cardiovascular system, an isolated change in a single variable rarely occurs. A change in blood volume, for example, reflexly alters cardiac function, peripheral resistance, and venomotor tone. Several auxiliary factors also regulate cardiac output. Such ancillary factors may be considered to modulate the more basic factors that we have considered here.
Gravity
Gravitational forces may affect cardiac output profoundly. It is not unusual for some soldiers standing at attention to faint because cardiac output is reduced. Gravitational effects are exaggerated in airplane pilots during pullouts from dives. The centrifugal force in the footward direction may be several times greater than the force of gravity. Such individuals characteristically black out momentarily during the maneuver, as blood is drained from the cephalic regions and pooled in the lower parts of the body.
The explanation for the reduction in cardiac output under such conditions is often specious. It is frequently argued that when an individual is standing, the forces of gravity impede venous return from the dependent regions of the body. This statement is incomplete, however, because it ignores the facilitative counterforce on the arterial side of the same circuit.
In this sense the vascular system resembles a U tube. To comprehend the action of gravity on flow through such a system, the models depicted in Figures 10-23 and 10-24 are analyzed. In Figure 10-23, for example, all the U tubes represent rigid cylinders of constant diameter. With both limbs of the U tube oriented horizontally (Figure 10-23A), the flow depends only on the pressures at the inflow and outflow ends of the tube (Pi and Po, respectively), the viscosity of the fluid, and the length and radius of the tube, in accordance with Poiseuille’s equation (see Chapter 6). With a constant cross section, the pressure gradient is uniform; hence, the pressure midway down the tube (Pm) equals the average of the inflow and outflow pressures.
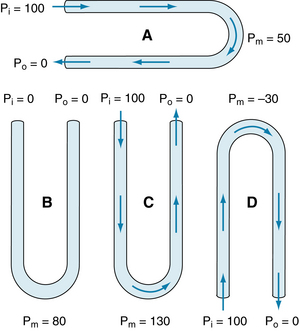
FIGURE 10-23 Pressure distributions in rigid U tubes with constant internal diameters, all with the same dimensions. For a given inflow pressure (Pi = 100) and outflow pressure (Po = 0), the pressure at the midpoint (Pm) depends on the orientation of the U tube, but the flow through the tube is independent of the orientation.
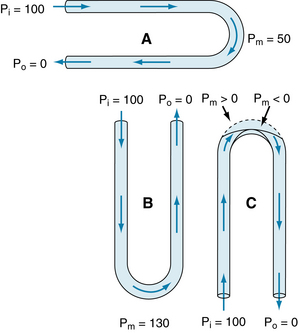
FIGURE 10-24 In U tubes with distensible sections at the bends, even when inflow (Pi) and outflow (Po) pressures are the same, the resistance to flow, and the fluid volume contained within each tube, varies with the orientation of the tube. Pm, pressure at the midpoint of the tube.
When the U tube is oriented vertically (Figure 10-23B to D), hydrostatic forces must be taken into consideration. In tube B, both limbs are open to atmospheric pressure, and both ends are located at the same hydrostatic level; hence, there is no flow. The pressure at the midpoint of the tube is simply ρhg. The pressure depends on the density of the fluid, r; the height of the U tube, h; and the acceleration of gravity, g. In the example in Figure 10-23, the length of the U tube is such that the midpoint pressure is 80 mm Hg.
Now consider tube C, which is oriented the same as is tube B but in which a 100–mm Hg pressure difference is applied across the two ends. The flow precisely equals that in tube A, because the pressure gradient, tube dimensions, and fluid viscosity are all the same. Gravitational forces are precisely equal in magnitude, but opposite in direction, in the two limbs of the U tube. Because the flow is the same as that in A, there is a pressure drop of 50 mm Hg at the midpoint as a result of the viscous losses that result from flow. Furthermore, gravity tends to increase pressure by 80 mm Hg at the midpoint, just as in tube B. The actual pressure at the midpoint of tube C is the result of the viscous loss and hydrostatic gain, or 130 mm Hg in this example.
In tube D, a pressure gradient of 100 mm Hg is applied to the same U tube, but the tube is oriented in the opposite direction. Gravitational forces are so directed that the pressure at the midpoint tends to be 80 mm Hg less than that at the end of the U tube. Viscous losses still produce a 50–mm Hg pressure drop at the midpoint, relative to Pi. With this orientation, pressure at the midpoint of the U tube is 30 mm Hg below ambient pressure. Flow is the same as in tubes A and C, for the reasons stated in relation to C.
In a system of rigid U tubes, gravitational effects do not alter the rate of fluid flow. However, experience shows that gravity does affect the cardiovascular system. The reason is that the vessels are distensible rather than rigid. To explain the gravitational effects, the pressures in a set of U tubes with distensible components (at the bends in the tubes of Figure 10-24) are examined. In tubes A and B in Figure 10-24, the pressure distributions resemble those in tubes A and C, respectively, in Figure 10-23. In Figure 10-24, because the pressure is higher at the bend of tube B than at the bend of tube A, and because the segments are distensible in this region, the distention at the bend in tube B exceeds that at the bend in tube A. The extent of the distention depends on the compliance of these tube segments. Because flow varies directly with the tube diameter, the flow through tube B exceeds the flow through tube A for a given pressure difference applied at the ends.
Orienting a U tube with its bend downward actually increases, rather than diminishes, the flow. How then is the observed impairment of cardiovascular function explained when the body is similarly oriented? The explanation is that the cardiovascular system is a closed circuit of constant fluid (blood) volume, whereas the U tube is an open conduit that is supplied by a fluid source of unlimited volume. In the dependent regions of the cardiovascular system, the distention occurs more on the venous than on the arterial side of the circuit, because the venous compliance is so much greater than the arterial compliance. Such venous distention is readily observed on the back of the hands when the arms are allowed to hang down. The hemodynamic effects of such venous distention (venous pooling) resemble those caused by the hemorrhage of an equivalent volume of blood from the body. When an adult person shifts from a supine position to a relaxed standing position, 300 to 800 mL of blood is pooled in the legs. This change may reduce cardiac output by about 2 L/min.
The compensatory adjustments to the erect position are similar to the adjustments to blood loss. For example, the diminished baroreceptor excitation reflexly speeds the heart, strengthens the cardiac contraction, and constricts the arterioles and veins. The baroreceptor reflex has a greater effect on the resistance vessels than on the capacitance vessels. Warm, ambient temperatures interfere with the compensatory vasomotor reactions, and the absence of muscular activity exaggerates the effects.
When the U tube is rotated so that the bend is directed upward (Figure 10-24, tube C), the effects are opposite to those that take place in tube B. The pressure at the bend of tube C would tend to be −30 mm Hg, just as in tube D in Figure 10-23. However, the distensible segment of tube C collapses because the ambient pressure exceeds the internal pressure. Flow then ceases, and therefore the pressure decrease associated with viscous flow does not occur. In U tube C, when flow stops, the pressure at the top of each limb is 80 mm Hg less than at the bottom (the hydrostatic pressure difference). Hence, in the left (or inflow) limb, the pressure begins to rise rapidly from a negative value. If the tube remained collapsed at the bend, the pressure to the left of the collapsed segment would rapidly approach 20 mm Hg. However, as soon as this pressure exceeds the ambient pressure (0 mm Hg), the collapsed tubing is forced open, and flow begins. With the onset of flow, however, pressure at the bend again drops below the ambient pressure. Thus, the tubing at the bend flutters; that is, it fluctuates between the open and closed states.
When an arm is raised, the cutaneous veins in the hand and forearm collapse, for the reasons described previously. Fluttering does not occur, because the deeper veins are protected from collapse by being tethered to surrounding structures. This protection allows these deeper veins to accommodate the flow that is ordinarily carried by the collapsed superficial veins. The analogy would be to add a rigid tube (which represents the deeper veins) in parallel with the collapsible tube (which represents the superficial veins) at the bend of tube C in Figure 10-24. The collapsible tube would no longer flutter but it would remain closed. All flow would occur through the rigid tube, just as in tube D in Figure 10-23.
CLINICAL BOX
Many of the drugs used to treat hypertension also interfere with the reflex adaptation to standing. Similarly, astronauts exposed to weightlessness lose their adaptations after a few days in space and experience difficulties when they first return to earth. When individuals with impaired reflex adaptation stand, their blood pressure may drop substantially. This response, called orthostatic hypotension, may cause lightheadedness or fainting.
Muscular Activity and Venous Valves
When a person who is recumbent stands but remains at rest, the pressure rises in the veins in the dependent regions of the body. The venous pressure in the legs increases gradually, and it does not reach an equilibrium value until almost 1 minute after standing. The slowness of this rise in Pv is attributable to the venous valves, which permit flow only toward the heart. When the person stands, the valves prevent blood in the veins from actually falling toward the feet. Hence the column of venous blood is supported at numerous levels by these valves; temporarily, the venous column consists of many discontinuous segments. However, blood continues to enter the column from many venules and small tributary veins, and the pressure continues to rise. As soon as the pressure in one segment exceeds that in the segment just above it, the intervening valve is forced to open. Ultimately, all the valves are open and the column is continuous. This state resembles that in the outflow limbs of the U tubes shown in Figures 10-23 and 10-24.
Precise measurement reveals that the final level of Pv in the feet during quiet standing is only slightly greater than that in a static column of blood extending from the right atrium to the feet. This finding indicates that the pressure drop caused by blood flow from the foot veins to the right atrium is very small. This very low resistance justifies regarding all the veins as a common venous compliance in the circulatory system model illustrated in Figure 10-8.
CLINICAL BOX
The superficial veins in the neck are ordinarily partially collapsed when a normal individual is upright. Blood returns to the heart from the head mainly through the deeper cervical veins. However, when central venous pressure is abnormally elevated, the superficial neck veins are distended and do not collapse even when the subject sits or stands. Such cervical venous distention is an important clinical sign of congestive heart failure.
When an individual who has been standing quietly begins to walk, the venous pressure in the legs decreases appreciably (Figure 10-25). Blood is forced from the veins toward the heart because of the intermittent venous compression exerted by the contracting leg muscles and because of the presence of the venous valves (see Figure 12-2). Hence, muscular contraction lowers the mean venous pressure in the legs, and it serves as an auxiliary pump. Furthermore, it prevents venous pooling and lowers capillary hydrostatic pressure, thereby reducing the tendency for edema fluid to collect in the feet during standing.
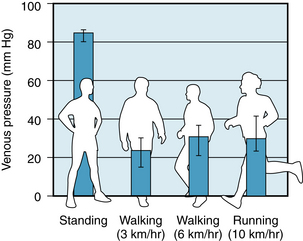
FIGURE 10-25 Mean pressures (± 95% confidence intervals) in the foot veins of 18 people during quiet standing, walking, and running.
(From Stick C, Jaeger H, Witzleb E: Measurements of volume changes and venous pressure in the human lower leg during walking and running. J Appl Physiol 72:2063, 1992.)
CLINICAL BOX
This auxiliary pumping mechanism is not very effective in people with varicose veins in their legs. The valves in such veins do not operate properly, and therefore when the leg muscles contract, the blood in the leg veins is forced in the retrograde as well as in the antegrade direction. Thus, when an individual with varicose veins stands or walks, the venous pressure in the ankles and feet is excessively high. The consequent high capillary pressure leads to the accumulation of edema fluid in the ankles and feet.
Respiratory Activity
The normal, periodic activity of the respiratory muscles causes rhythmic variations in vena caval blood flow. Thus, respiration constitutes an auxiliary pump to promote venous return. Coughing, straining at stool, and other activities that require respiratory muscle exertion may affect cardiac output substantially.
The changes in blood flow in the superior vena cava during the normal respiratory cycle are shown in Figure 10-26. During normal respiration, the reduction in intrathoracic pressure is transmitted to the lumina of the intrathoracic blood vessels. Central venous pressure is reduced during inspiration, increasing the pressure gradient between extrathoracic and intrathoracic veins. The consequent acceleration of venous return to the right atrium is displayed in Figure 10-26 as an increase in superior vena caval blood flow, from 5.2 mL/second (s) during expiration to 11 mL/s during inspiration.
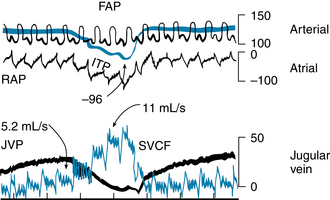
FIGURE 10-26 During a normal inspiration, intrathoracic (ITP), right atrial (RAP), and jugular venous (JVP) pressures decrease, and flow in the superior vena cava (SVCF) increases (from 5.2 to 11 mL/second [s]). All pressures are in millimeters of water, except for femoral arterial pressure (FAP), which is in millimeters of mercury.
(Modified from Brecher GA: Venous return, New York, 1956, Grune & Stratton.)
An exaggerated reduction in intrathoracic pressure achieved by a strong inspiratory effort against a closed glottis (called Müller maneuver) does not increase venous return proportionately. The extrathoracic veins collapse near their entry into the chest when their internal pressures fall below the ambient level. As the veins collapse, flow into the chest momentarily stops. The cessation of flow raises pressure upstream, thereby forcing the collapsed segment to open again. The process is repetitive; the venous segments adjacent to the chest alternately open and close.
During normal expiration, flow into the central veins decelerates. However, the mean rate of venous return during normal respiration exceeds the flow during a brief period of apnea (cessation of respiration). Hence normal inspiration apparently facilitates venous return more than normal expiration impedes it. This effect must be partly attributable to the valves in the veins of the extremities and neck. These valves prevent any reversal of flow during expiration. Thus, the respiratory muscles and venous valves constitute an auxiliary pump for venous return.
Sustained expiratory efforts increase intrathoracic pressure and thereby impede venous return. Straining against a closed glottis (termed Valsalva maneuver) regularly occurs during coughing, defecation, and heavy lifting. Intrathoracic pressures in excess of 100 mm Hg have been recorded in trumpet players, and pressures over 400 mm Hg have been observed during paroxysms of coughing. Such pressure increases are transmitted directly to the lumina of the intrathoracic arteries. After coughing ceases, the arterial blood pressure may fall precipitously because of the preceding impediment to venous return.
CLINICAL BOX
The intense, brief increases in intrathoracic pressure induced by coughing constitute an auxiliary pumping mechanism for the blood, despite the concurrent tendency to impede venous return momentarily. During certain diagnostic procedures, such as coronary angiography and electrophysiological testing, patients are at increased risk for ventricular fibrillation. Such patients have been trained to cough rhythmically on command. If ventricular fibrillation does occur, substantial arterial blood pressure increments are generated by each cough, and enough cerebral blood flow may be promoted to sustain consciousness and to preserve the viability of the cerebral tissues. The cough raises the intravascular pressure equally in intrathoracic arteries and veins. Blood is propelled through the extrathoracic tissues, however, because the increased pressure is transmitted to the extrathoracic arteries but not to the extrathoracic veins. The venous valves prevent transmission of the intrathoracic pressure to the extrathoracic veins.
Artificial Respiration
In most forms of artificial respiration (mouth-to-mouth resuscitation, mechanical respiration), lung inflation is achieved by applying endotracheal pressures above atmospheric pressure, and expiration occurs by passive recoil of the thoracic cage. Thus, lung inflation is accompanied by an appreciable rise in intrathoracic pressure. Vena caval flow decreases sharply during the phase of positive-pressure lung inflation (indicated by the progressive rise in endotracheal pressure in the central portion of Figure 10-27). When negative endotracheal pressure (indicated by the abrupt decrease in endotracheal pressure in the right side of Figure 10-27) is used to facilitate deflation, vena caval flow accelerates more than when the lungs are allowed to deflate passively (near the left border of Figure 10-27).
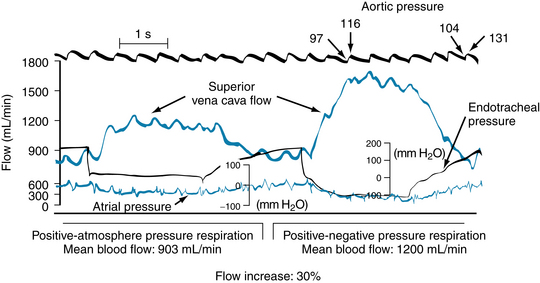
FIGURE 10-27 During intermittent positive-pressure respiration, the flow in the superior vena cava is approximately 30% greater when the lungs are deflated actively by application of negative endotracheal pressure (right side) than when they are allowed to deflate passively against atmospheric pressure (left side).
(Modified from Brecher GA: Venous return, New York, 1956, Grune & Stratton.)
Summary
 Two important relationships between cardiac output (CO) and central venous pressure (Pv) prevail in the cardiovascular system. One applies to the heart and the other to the vascular system.
With respect to the heart, CO varies directly with Pv (or preload) over a very wide range of Pv. This relationship is represented by the cardiac function curve and expresses the Frank-Starling mechanism.
With respect to the vascular system, Pv varies inversely with CO. This relationship is represented by the vascular function curve, and it reflects the fact that as CO increases, for example, a greater fraction of the total blood volume resides in the arteries and a smaller volume resides in the veins.
The principal mechanism that governs the cardiac function curve is the change in the affinity of the contractile proteins for calcium. This effect is evoked by changes in the cardiac filling pressure (preload).
The principal factors that govern the vascular function curve are the arterial and venous compliances, the peripheral vascular resistance, and the total blood volume.
The equilibrium values of CO and Pv that prevail under a given set of conditions are determined by the intersection of the cardiac and vascular function curves.
At very low and very high heart rates, the heart is unable to pump an adequate CO. At very low rates, the increment in filling during diastole cannot compensate for the small number of cardiac contractions per minute. At very high rates, the large number of contractions per minute cannot compensate for the inadequate filling time.
Gravity influences CO because the veins are so compliant, and substantial quantities of blood tend to pool in the veins of the dependent portions of the body.
Respiration changes the pressure gradient between the intrathoracic and extrathoracic veins. Hence respiration serves as an auxiliary pump, which may alter the mean level of CO and may induce rhythmic changes in stroke volume during the various phases of the respiratory cycle.
Arbab-Zadeh A., Dijk E., Prasad A., et al. Effect of aging and physical activity on left ventricular compliance. Circulation. 2004;110:1799.
Brengelmann G.L. A critical analysis of the view that right atrial pressure determines venous return. J Appl Physiol. 2003;94:849.
Jacob G., Ertl A.C., Shannon J.R., et al. Effect of standing on neurohumoral responses and plasma volume in healthy subjects. J Appl Physiol. 1998;84:914.
McGee S.R. Physical examination of venous pressure: A critical review. Am Heart J. 1998;136:10.
Pang C.C. Autonomic control of the venous system in health and disease: Effects of drugs. Pharmacol Ther. 2001;90:179.
Rowell L.B., O’Leary D.S., Kellogg D.L., Jr. Integration of cardiovascular control systems in dynamic exercise. In: Rowell L.B., Shepherd J.T., eds. Handbook of Physiology, Section 12: Exercise: Regulation and Integration of Multiple Systems. New York: Oxford University Press, 1996.
Tyberg J.V., Belenkie I., Manyari D.E., et al. Ventricular interaction and venous capacitance modulate left ventricular preload. Can J Cardiol. 1996;12:1058.
Uemura K., Sugimachi M., Kawada T., et al. A novel framework of circulatory equilibrium. Am J Physiol. 2004;286:H2376.
Uemura K., Kawada T., Kamiya A., et al. Prediction of circulatory equilibrium in response to changes in stressed blood volume. Am J Physiol. 2005;289:H301.
CASE 10-1
History
A 44-year-old woman with severe cardiac failure caused by coronary artery disease was treated by cardiac transplantation. She recovered very well, and 1 month after surgery her cardiovascular function was entirely normal, even though her new heart was entirely denervated. About 3 months after surgery, she developed a bleeding duodenal ulcer and was estimated to have lost about 600 mL of blood in 1 hour. After hospitalization for acute blood loss, her physician treated her with diet and antibiotics, and her ulcer was cured in about 2 weeks. The patient was healthy for 3 years, but then her strength and energy gradually diminished. Her physician determined that the cardiac transplant was slowly being rejected, and he began to treat her with a new drug that specifically increases myocardial contractility. Occasionally the patient experienced brief periods of tachycardia with a rate of 250 beats/min; the electrocardiogram indicated that the tachycardia originated in the AV junction.
Questions
1. The acute blood loss from her duodenal ulcer can be expected to:
2. Administration of a drug that acts specifically to improve myocardial contractility would:
3. Strapping the patient to a tilt-table and tilting her to the vertical, head-up position would:
4. When the patient was experiencing the tachycardia at 250 beats per minute, the critical hemodynamic changes would be expected to be: