Chapter 1 Imaging the Head and Brain
Emergency physicians frequently evaluate patients with complaints requiring brain imaging for diagnosis and treatment. The diversity of imaging modalities and variations of these modalities may be daunting, creating uncertainty about the most appropriate, sensitive, and specific modality to evaluate the presenting complaint. An evidence-based approach is essential, with modality and technique chosen based on patient characteristics and differential diagnosis. In this chapter, we begin with a brief summary of computed tomography (CT) and magnetic resonance (MR) technology. Next, we present a systematic approach to interpretation of head CT, along with evidence for interpretation by emergency physicians. Then, we discuss the cost and radiation exposure from neuroimaging, as these are important reasons to limit imaging. We review the evidence supporting the use of CT and magnetic resonance imaging (MRI) for diagnosis and treatment of emergency brain disorders, concentrating on clinical decision rules to target imaging to high-risk patients. We also consider adjunctive imaging techniques, including conventional angiography, plain films, and ultrasound. By chapter’s end, we consider the role of neuroimaging in the evaluation of headache, transient ischemic attacks (TIAs) and stroke, seizure, syncope, subarachnoid hemorrhage (SAH), meningitis, hydrocephalus and shunt malfunction, and head trauma.
Neuroimaging Modalities
Indications for neuroimaging are diverse, including traumatic and nontraumatic conditions (Table 1-1). The major brain neuroimaging modalities today are CT and MRI, with adjunctive roles for conventional angiography and ultrasound. Plain films of the calvarium have an extremely limited role, as they can detect bony injury but cannot detect underlying brain injury, which may be present even in the absence of fracture.
TABLE 1-1 Clinical Indications, Differential Diagnoses, and Initial Imaging Modality
| Clinical Indication | Differential Diagnosis | Initial Imaging Modality |
|---|---|---|
| Headache | Mass, traumatic or spontaneous hemorrhage, meningitis, brain abscess, sinusitis, hydrocephalus | Noncontrast CT |
| Altered mental status or coma | Mass, traumatic or spontaneous hemorrhage, meningitis, brain abscess, hydrocephalus | Noncontrast CT |
| Fever | Meningitis (assessment of ICP), brain abscess | Noncontrast CT |
| Focal neurologic deficit—motor, sensory, or language deficit | Mass, ischemic infarct, traumatic or spontaneous hemorrhage, meningitis, brain abscess, sinusitis, hydrocephalus | Noncontrast CT, possibly followed by MRI, MRA, or CTA, depending on context |
| Focal neurologic complaint—ataxia or cranial nerve abnormalities | Posterior fossa or brainstem abnormalities, vascular dissections | MRI or MRA of brain and neck; CT or CTA of brain and neck if MR is not rapidly available |
| Seizure | Mass, traumatic or spontaneous hemorrhage, meningitis, brain abscess, sinusitis, hydrocephalus | Noncontrast CT, possibly followed by CT with IV contrast or MR |
| Syncope | Trauma | Little indication for imaging for cause of syncope, only for resulting trauma |
| Trauma | Hemorrhage, mass effect, cerebral edema | Noncontrast CT—if clinical decision rules suggest need for any imaging |
| Traumatic loss of consciousness | Hemorrhage, DAI, mass effect, cerebral edema | Little indication when transient loss of consciousness is isolated complaint |
| Planned LP | Increased ICP | Noncontrast head CT—limited indications |
Computed Tomography
CT has been in general clinical use in emergency departments (EDs) in the United States since the early 1980s. The modality was simultaneously and independently developed by the British physicist Godfrey N. Hounsfield and the American Allan M. Cormack in 1973, and the two were corecipients of the Nobel Prize for Medicine in 1979.1,2 Advances in computers and the introduction of multislice helical technology (described in detail in Chapter 8 in the context of cardiac imaging) have dramatically enhanced the resolution and diagnostic utility of CT since its introduction. CT relies on the differential attenuation of x-ray by body tissues of differing density. The image acquisition occurs by rapid movement of the patient through a circular gantry opening equipped with an x-ray source and multiple detectors. A three-dimensional volume of image data is acquired; this volume can be displayed as axial, sagittal, or coronal planar slices or as a three-dimensional image. CT does raise some safety concerns with regard to long-term biologic effects of ionizing radiation and carcinogenesis, which we describe later. The radiation exposure to the fetus in a pregnant patient undergoing head CT is minimal.3 Most commercially available CT scanners have a weight capacity of approximately 450 pounds (200 kg), although some manufacturers now offer units with capacities up to 660 pounds (300 kg).4 Portable dedicated head CT scanners with acceptable diagnostic quality and no weight limits are now available.4a
Noncontrast Head CT
Noncontrast CT is the most commonly ordered head imaging test in the ED, used in up to 12% of all adult ED visits.5,6 It provides information about hemorrhage, ischemic infarction, masses and mass effect, ventricular abnormalities such as hydrocephalus, cerebral edema, sinus abnormalities, and bone abnormalities such as fractures. Although dedicated facial CT provides more detail by acquiring thinner slices through the region of interest or by changing the patient’s position in the scanner during image acquisition, general information about the face and sinuses can be gleaned from a generic noncontrast head CT, as described in detail in Chapter 4 on facial imaging. The American College of Radiology recommends acquisition of contiguous or overlapping slices with slice thickness no greater than 5mm. For imaging of the cranial base, the ACR recommends the thinnest slices possible. If multiplanar or three-dimensional reconstruction is planned, slice thickness should be as thin as possible and no greater than 2-3 mm.6a
Contrast-Enhanced Head Computed Tomography
Contrast-enhanced head CT is usually performed following a noncontrast CT, and the two are then compared. In a contrast-enhanced head CT, IV contrast is injected, usually through an upper extremity intravenous catheter. A time delay is introduced to allow the venous contrast to pass to the brain. Depending on the delay between contrast injection and image acquisition, the resulting CT may be a CT cerebral angiogram (CTA) or a CT cerebral venogram (CTV). The CT data may be reconstructed in any of several planes (typically axial, sagittal, or coronal) or even three-dimensionally. Cerebral perfusion can be mapped with IV contrast, using a technique described in more detail later. Contrast CT is useful for depicting abnormal vascular structures, such as aneurysms or arteriovenous malformations; for demonstrating abnormal failure of filling of vascular structures, such as sagittal sinus thrombosis (akin to demonstrating a filling defect in chest CT for pulmonary embolism); and for demonstrating neoplastic, inflammatory, and infectious processes. These latter abnormalities typically have increased regional blood flow, consequently receive abnormally high levels of vascular contrast agents, and may demonstrate ring enhancement, a circumferential increase in density around a lesion on CT occurring after IV contrast administration.
Magnetic Resonance
MR has been in wide clinical use in the United States since the late 1980s. The modality was coinvented by the American Paul C. Lauterbur and the British physicist Sir Peter Mansfield, who shared the 2003 Nobel Prize in Medicine for their work.7 MR allows imaging of the brain by creating variations in the gradient of a magnetic field and analyzing the radio waves emitted in response by hydrogen ions (protons) within the field. MR provides outstanding soft-tissue contrast that is superior to that obtained from CT. MR can be performed with or without intravenous contrast agents. Advantages of MRI include the noninvasive nature of the test and its apparent safety in pregnancy.8 It does not employ ionizing radiation and has no known permanent harmful biologic effects.9 Traditionally, contraindications have been thought to include the presence of ferromagnetic material within the body, including electronic devices such as pacemakers or metallic debris such as shrapnel, especially in sensitive structures such as the eye or brain. However, there are now more than 230 published prospective cases of patients with pacemakers safely having undergone low-field MRI, so MRI may be an imaging option in these patients.10 Magnetic effects on tattoos, including first-degree burns and burning sensation, have been reported, although these appear rare and more likely to interfere with completion of MR than to cause significant harm.11-13
Can Emergency Physicians Accurately Interpret Head CT Images? What Are the Potential Benefits to Patients?
Head CT is rapid to obtain, but delays in interpretation could result in adverse patient outcomes if clinical treatment decisions cannot be made in a timely fashion. Surveys of emergency medicine residency programs suggest that, in many cases, radiology interpretation is not rapidly available for clinical decisions and that emergency physicians often perform the initial interpretation of radiographic studies. A study simulating a teleradiology support system estimated the time to interpretation of a noncontrast head CT at 39 minutes, potentially wasting precious time in patients with intracranial hemorrhage or ischemic stroke.14 The ability of the on-scene emergency physician to interpret the CT could be extremely valuable.
Multiple studies have examined the ability of emergency medicine residents and attending physicians to interpret head CT. A 1995 study showed that in an emergency medicine residency program, although up to 24% of potentially significant CT abnormalities were not identified by the emergency medicine residents, only 0.6% of patients appear to have been mismanaged as a result.15 Studies have shown that substantial and sustained improvements in interpretation ability can occur with brief training. Perron et al.16 showed an immediate improvement from 60% to 78% accuracy after a 2-hour training session based on a mnemonic, sustained at 3 months. In the setting of stroke, emergency medicine attending physicians perform relatively poorly in the recognition of both hemorrhage and early ischemic changes, which may contraindicate tissue plasminogen activator (t-PA) administration, with accuracy of approximately 60%. However, neurologists and general radiologists achieve only about 80% accuracy compared with the gold-standard interpretation by neuroradiologists.17,18 Undoubtedly, improvements in training are needed, but the pragmatic limitations on the availability of subspecialist radiologists, even with teleradiology, mean that emergency physicians must become proficient first-line readers of emergency CT.
Interpretation of Noncontrast Head CT
Several systematic methods for interpretation of noncontrast head CT have been described. The mnemonic “Blood Can Be Very Bad” has been shown to assist in the sustained improvement of interpretation by emergency medicine residents.16 The mnemonic reminds the interpreter to look for blood (blood), abnormalities of cisterns and ventricles (can and very, respectively), abnormalities of the brain parenchyma (be), and fractures of bone (bad).
Broder used the familiar ABC paradigm to drive the assessment of the head CT (see “A Mnemonic for Head CT Interpretation: ABBBC”).5
Hounsfield Units and Windows
The density of a tissue is represented using the Hounsfield scale, with water having a value of zero Hounsfield units (HU), tissues denser than water having positive values, and tissues less dense than water having negative values (Figure 1-1). By convention, low-density tissues are assigned darker (blacker) colors and high-density structures are assigned brighter (whiter) colors. Because the human eye can perceive only a limited number of gray shades, the full range of density values is typically not displayed for a given image. Instead, the tissues of interest are highlighted by devoting the visible gray shades to a narrow portion of the full density range, a process called “windowing” (Figures 1-1 and 1-2). The same image data can be displayed in different window settings to allow evaluation of injury to different tissues. In general, head CT images are viewed on brain or bone windows to allow most emergency pathology to be assessed (see Figure 1-2).
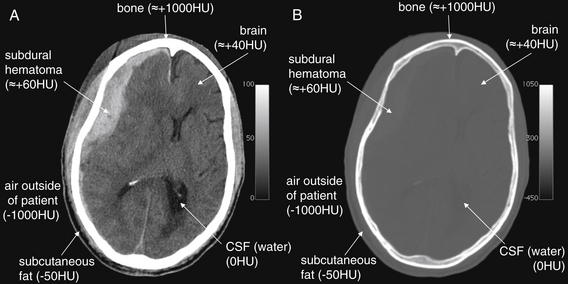
Figure 1-1 The CT Hounsfield scale and window settings.
The CT Hounsfield scale places water density at a value of zero with air and bone at opposite extreme values of -1000HU and +1000HU. Fat is less dense than water and has a density around -50HU. Other soft tissues are slightly more dense than water and have densities ranging from around +20 to +100HU. The colors associated with these density values can be reassigned to highlight particular tissues, a process called “windowing.” A, Axial CT slice, viewed with brain window settings. Notice in the grayscale bar at the right side of the figure that the full range of shades from black to white has been distributed over a narrow HU range, from zero (pure black) to +100HU (pure white). This allows fine discrimination of tissues within this density range, but at the expense of evaluation of tissues outside of this range. A large subdural hematoma is easily discriminated from normal brain, even though the two tissues differ in density by less than 100HU. Any tissues greater than +100HU in density will appear pure white, even if their densities are dramatically different. Consequently, the internal structure of bone cannot be seen with this window setting. Fat (-50HU) and air (-1000HU) cannot be distinguished with this setting, as both have densities less than zero HU and are pure black. B, The same axial CT slice viewed with a bone window setting. Now the scale bar at the right side of the figure shows the grayscale to be distributed over a very wide HU range, from -450HU (pure black) to +1050HU (pure white). Air can easily be discriminated from soft tissues on this setting because it is assigned pure black, while soft tissues are dark gray. Details of bone can be seen, because a large portion of the total range of gray shades is devoted to densities in the range of bone. Soft tissue detail is lost in this window setting, because the range of soft tissue densities (-50HU to around +100HU) represents a narrow portion of the gray scale.
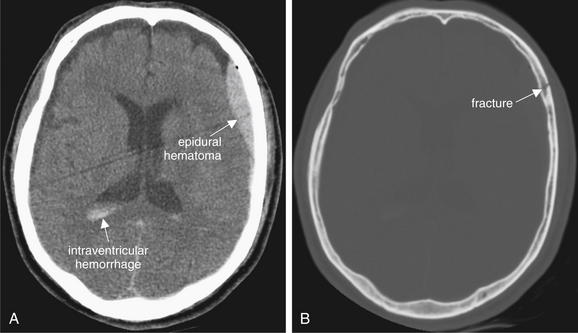
Figure 1-2 Hounsfield units and windows.
A single noncontrast computed tomography slice, shown in brain windows (A) and bone windows (B).
Brain windows allow evaluation of the brain parenchyma, hemorrhage, cerebrospinal fluid (CSF) spaces, and other soft tissue at the expense of bony detail. Gross fractures may be seen. Bone windows allow detailed examination for fractures but obscure most soft-tissue detail.
(From Broder J, Preston R: An evidence-based approach to imaging of acute neurological conditions. Emerg Med Pract 9(12):4, 2007.)
Bone windows are useful for evaluation in the setting of trauma. By shifting the gray scale to center on the range of densities typical of bone bone windows allow detection of abnormalities such as subtle fracture lines. At the same time, they sacrifice detailed evaluation of structures less dense than bone (brain, cerebrospinal fluid, and blood vessels). Air remains black on bone windows and can be readily identified—for example, intracranial air can easily be seen on bone window settings. Sinus spaces are also nicely delineated on bone windows because of the contrast between air (black) and all other tissues (gray shades).
Brain windows are useful for evaluation of brain hemorrhage, fluid-filled structures including blood vessels and ventricles, and air-filled spaces. The majority of our evaluations will be done using this window setting. On brain windows, bone and other dense or calcified structures (e.g., surgical clips and calcified pineal glands) all appear bright white, and internal detail of these high-density structures is lost.
Right–Left Orientation of Computed Tomography Images
By convention, axial CT images are displayed with the patient’s right side on the left side of the video screen or printed image. The point of view is as follows. Imagine yourself standing at the foot of the CT gantry, gazing toward the patient’s head, with the patient positioned supine. Your left hand is placed on the patient’s right foot. The patient is virtually “sectioned” into slices like a loaf of bread(Figure 1-3).
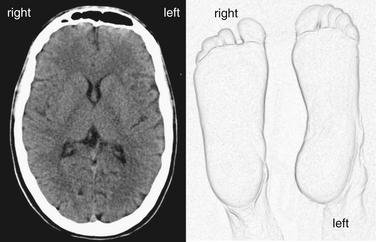
Figure 1-3 Right–left orientation in computed tomography (CT).
Axial CT images are displayed with the patient’s right side on the left side of the video screen or printed image (A). The point of view is that of an observer standing at the feet of a supine patient, gazing toward the patient’s head. The volume of the patient’s head is divided into a stack of axial slices for review. (B).
(From Broder J. Midnight radiology: Emergency CT of the head. (Accessed at http://emedhome.com/.)
Brain Symmetry
The brain, air and cerebrospinal fluid (CSF) spaces and the surrounding bone are normally symmetrical structures (Figure 1-4; see also Figures 1-7 and 1-19). A head CT should be inspected for normal symmetry, as deviation from this norm often indicates pathology (Figure 1-5; see also Figure 1-4). If the patient’s head is not centered symmetrically in the CT gantry, the resulting images can create a false sense of asymmetry. It is critical to note that some life-threatening pathological conditions such as diffuse subarachnoid hemorrhage, cerebral edema, and hydrocephalus can have a symmetrical CT appearance, so symmetry does not guarantee normalcy.
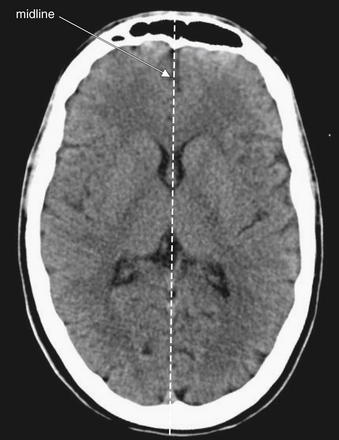
Figure 1-4 Normal brain symmetry brain windows.
Abnormal masses or hemorrhage may deviate brain structures across an imaginary line dividing the brain, creating midline shift. The degree of midline shift is more important acutely than the exact etiology of the shift, since shift is an indication of threatened subfalcine herniation and may require surgical intervention.
(From Broder J, Preston R: An evidence-based approach to imaging of acute neurological conditions. Emerg Med Pract 9(12):6, 2007.)
Abnormal Asymmetry: Mass Effect and Midline Shift
The compression or displacement of normal brain structures (including ventricles and sulci) by adjacent masses is called mass effect. This displacement may occur due to tumor, hemorrhage, edema, or obstruction of CSF flow, to name but a few common causes. When this effect becomes extreme, shift of brain structures across the midline of the skull can occur, a finding called midline shift. Midline shift can indicate significant pathology, including threatened subfalcine herniation (Figure 1-5), and it should be carefully sought, as it may be more important than the underlying etiology of the shift in determining initial management. The degree of displacement of structures across the normal midline of the brain can be easily measured using digital tools on the picture archiving and communication system (PACS), a computer viewing system. Midline shift may have some prognostic value in determining the likelihood of regaining consciousness after surgical decompression; patients with significant shift, greater than 10 mm, are more likely to benefit from decompression than are those with lesser degrees of shift.19 Patients with shift of 5 mm or greater are more likely to have neurologic deficits requiring long-term supervision than are those with lesser midline shift.20 Midline shift is also linked to probability of death after traumatic brain injury.21 Published guidelines on surgical indications for brain lesions include midline shift as one of several parameters (as shown later), so recognizing and measuring midline shift is important.
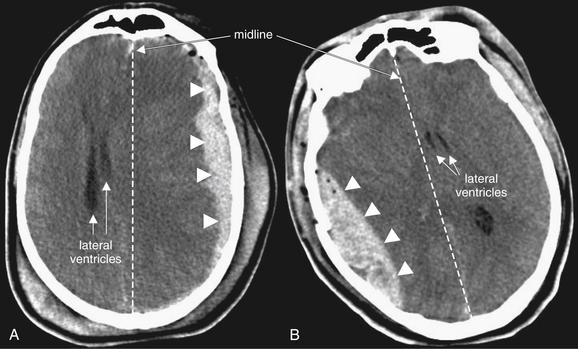
Figure 1-5 Mass effect and midline shift, brain windows.
Abnormal masses such as hemorrhage create mass effect, displacing other structures from their normal positions. When mass effect drives structures across the brain midline, midline shift is present. The degree of mass effect or midline shift is more important than the underlying etiology. Guidelines call significant midline shift (5 mm or greater) a neurosurgical emergency, although the clinical status of the patient is the more important parameter.
A, A large subdural hematoma (arrowheads) creates a mass effect and is displacing brain structures, including the lateral ventricles (arrowheads), across the midline (dotted line) to the patient’s right. B, A large epidural hematoma (arrowheads) creates mass effect. The lateral ventricles (arrowheads) are shifted across the midline (dotted line) to the patient’s left.
Artifacts: Motion and Metal
A brain CT should be examined for artifacts that may limit interpretation, including motion and streak artifact or beam-hardening artifact from high-density structures such as metal (Figure 1-6). Although artifact may degrade the overall quality of the study, useful diagnostic information can often still be gleaned from an imperfect scan. Modern CT scanners acquire images at a very fast rate—a 64-slice CT can scan the entire brain in approximately 5 seconds.22 As a consequence, CT is less subject to motion artifact than in the past, although significant patient motion may still render images uninterpretable. Just as in standard photographs, motion results in a blurry CT image.
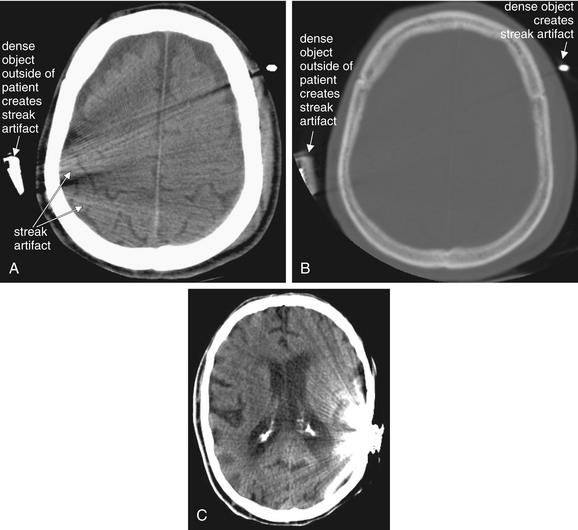
Streak artifacts may result from extremely high-density structures, such as dental fillings, implanted devices, or metal objects outside of the patient. A, Streak artifacts are most evident on brain windows. B, It is evident that the source of the artifact is very high-density material on bone windows. Notice how the external objects are denser (whiter) than the patient’s calvarium. C, A cochlear implant (in another patient) also creates significant streak artifact.
Although streak artifact may obscure some important details, relevant clinical information may be obtained from an imperfect scan. For example, in these scans, no midline shift is visible.
(From Broder J, Preston R: An evidence-based approach to imaging of acute neurological conditions. Emerg Med Pract 9(12):6, 2007.)
Very dense objects create distortion on CT, called streak artifact. Examples include implanted metallic devices, such as cochlear implants and dental fillings; metallic foreign bodies, such as bullets; and even dense bone, such as occipital bone surrounding the posterior fossa. These artifacts may make it difficult or impossible to identify pathologic changes in the region (see Figure 1-6).
A Mnemonic for Head CT Interpretation: ABBBC
A systematic approach to interpretation of head CT is necessary to avoid missing important abnormalities. We review one approach, with a discussion of the normal appearance of the brain. Although a detailed understanding of neuroanatomy will improve your head CT interpretation, our mnemonic avoids significant anatomic detail, as many clinical decisions don’t require this level of sophistication. Table 1-2 gives an overview of the mnemonic, with images illustrating each finding in the figures that follow.
Table 1-2 A Mnemonic for Systematic Interpretation of Non-Contrast Head CT: ABBBC
| Assess These Structures… | For Signs of This Pathology |
|---|---|
| Bones | Fractures |
| Blood | |
| Brain | |
A Is for Air Spaces
Our mnemonic starts with A, for air-filled spaces in the head. The normal head contains air-filled spaces: the frontal, maxillary, ethmoid, and sphenoid sinuses and the mastoid air cells (Figure 1-7). Opacification of an air space may occur because of fluids such as pus, mucus, or blood; mucosal edema; or because of tumor invasion of the space. In the setting of trauma, opacification of an air space may indicate bleeding into that space, raising suspicion of a fracture of the surrounding bone (Figure 1-8). In the absence of trauma, opacification may indicate sinus infection or inflammation, although this is a nonspecific finding that may require no treatment in the absence of symptoms.
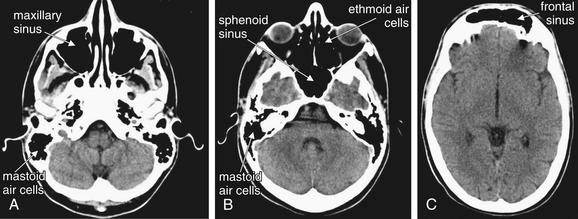
The normal location and appearance of air-filled spaces when viewed on brain windows. Air-filled spaces are normally black on both brain and bone windows. Even more detail of fine bony partitions can be seen by selecting bone windows.
A through C move progressively from caudad to cephalad. The structures are labeled on one side. Try to identify the same structure on the opposite side.
(From Broder J, Preston R: An evidence-based approach to imaging of acute neurological conditions. Emerg Med Pract 9(12):5, 2007.)
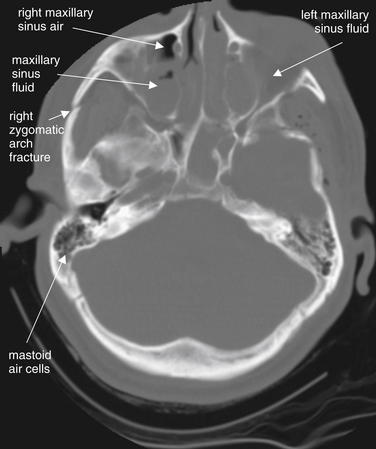
Figure 1-8 Fluid in normally air-filled spaces.
Fractures of the bony walls of normally air-filled structures, including the sinuses and mastoid air cells, can result in hemorrhage. Blood pooling in the dependent portion of these air-filled chambers results in an air–fluid level or sometimes in complete opacification. This may be the only evidence of fracture. If no history of trauma is present, fluid in an air space may indicate infection, such as sinusitis or mastoiditis.
Viewed here on bone windows, the patient’s right maxillary sinus has an air (black)–fluid (gray) level. The left maxillary sinus is completely opacified. The fractures of the sinuses themselves are hard to identify, though a right zygomatic arch fracture is visible. The mastoid air cells are normal and have no fluid. Following trauma, opacification of the mastoid air cells is a sign of temporal bone fracture.
(From Broder J, Preston R: An evidence-based approach to imaging of acute neurological conditions. Emerg Med Pract 9(12):6, 2007.)
Normal air spaces appear black on either brain or bone windows, because air has the lowest Hounsfield density, negative 1000 HU. The frontal, maxillary, ethmoid, and sphenoid sinuses are normally air-filled, with no thickening of mucosa or air–fluid levels. The mastoid processes are normally spongy bone filled with tiny pockets of air, the mastoid air cells. If these air spaces become partially or totally opacified with fluid, this is easily recognized as a gray shade. Dense bone surrounding the small mastoid air cells creates a “bloom artifact” that can obscure the actual air spaces when viewed on brain windows, making assessment for abnormal fluid more difficult. This is minimized by viewing this region using bone windows. Abnormal fluid appears gray on this setting as well. The relatively small ethmoid air cells are also best-assessed for fluid using bone windows. For larger air-spaces, bloom artifact is minimal and brain or bone windows will usually reveal fluid. Recognizing abnormalities of normally air-filled structures requires some basic knowledge of their normal location and configuration (see Figure 1-7). Box 1-1 summarizes abnormalities of sinus air spaces, which are discussed in more detail later.
Sinus Trauma
Facial fractures are discussed in more detail in the dedicated chapter on facial imaging (Chapter 2). In trauma, fractures through the bony walls of sinuses result in bleeding into the sinus cavity. While the trauma patient remains in a supine position, this blood accumulates in the dependent portion of the sinus, forming an air–fluid level visible on CT. Previously existing sinus disease may be visible as circumferential sinus mucosal thickening, rather than as an air–fluid level. Inspect the sinuses carefully for air–fluid levels, as these may indicate occult fractures. In trauma, opacification of sinuses should be considered evidence of fracture until proven otherwise, as the fracture itself may be hard to identify (Figures 1-8 and 1-9). The ethmoid sinuses are small and may be completely opacified by blood in the event of fracture. Opacified ethmoid sinuses should increase suspicion of a medial orbital blowout fracture. Air–fluid levels in the maxillary sinus may be associated with inferior orbital blowout fractures, because the inferior wall of the orbit is the superior wall of the maxillary sinus. The frontal sinus is less easily fractured, as its anterior and posterior plates are thick and resistant to trauma. Fracture of the anterior wall of the frontal sinus is relatively less concerning, requiring plastic surgery or otolaryngology consultation. Fracture of the posterior wall of the frontal sinus is a potential neurosurgical emergency due to communication of the sinus space with the CSF. Look for intracranial air whenever frontal
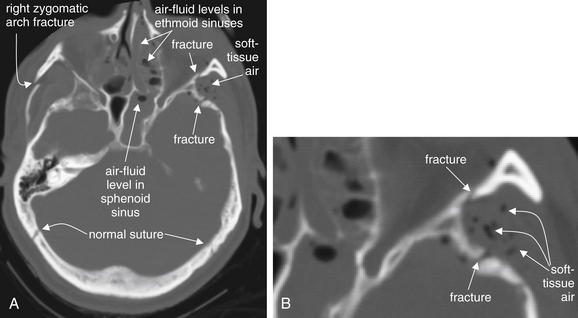
A, Fractures, viewed on bone windows. B, Close-up from A. Fractures are sometimes evident as discontinuities in the bony cortex. It is important to compare the contralateral side to ensure that a normal suture is not misidentified as a fracture. Air in soft tissues and air–fluid levels or opacification of sinus air spaces are additional clues to minimally or nondisplaced fractures.
(From Broder J, Preston R: An evidence-based approach to imaging of acute neurological conditions. Emerg Med Pract 9(12):9, 2007.)
sinus air–fluid levels are present and disruption of the posterior plate is suspected. When the mastoid air cells are obliterated or opacified, suspect temporal bone fracture. The normal side is a useful comparison.
Sinus Infections
In the absence of trauma, sinus mucosal thickening and air–fluid levels may be normal findings. They should not be used to make a diagnosis of bacterial sinusitis in the absence of strong clinical evidence, as they are nonspecific and may occur in allergic sinusitis or even asymptomatic patients. The mastoid air cells are not normally fluid filled, and in the presence of mastoid tenderness and erythema, their opacification on CT is evidence of mastoiditis (Figure 1-10). Sinus infections are discussed in more detail in Chapter 2, Imaging the Face.
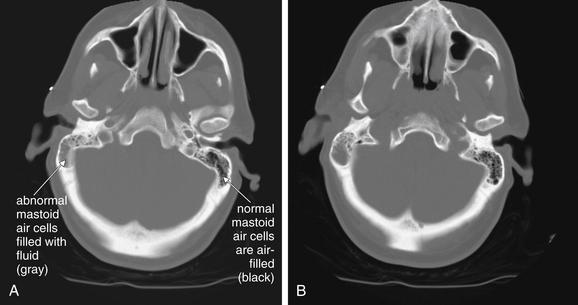
Figure 1-10 Mastoiditis resulting in meningitis.
This patient presented with confusion and nystagmus, as well as a history of right ear pain. Noncontrast Computed tomography (CT) showed opacification of the right mastoid air cells, consistent with mastoiditis. Given the patient’s confusion, meningitis as a complication of mastoiditis was suspected. Cerebrospinal fluid ultimately grew Streptococcus pneumoniae.
The mastoid air cells are best viewed on bone windows (A and B), as soft-tissue windows are subject to bloom artifact from dense bone, which often obscures the small air spaces. A normal mastoid process is a spongy, air-filled bony lattice. Fluid in the mastoids air cells is abnormal. In the setting of trauma, fluid may indicate blood filling air cells from a temporal bone fracture. With no history of trauma, infectious mastoiditis should be suspected. Mastoiditis can be recognized on a noncontrast head CT and does not require special temporal bone views or facial CT series.
B Is for Bone
The first B in our mnemonic is for bone. Following trauma, bony fractures should be suspected, although they are often of less clinical significance than any underlying brain injury. Abnormalities of bone including acute fractures are best identified on bone windows. Defects in the cortex of bone may indicate fracture, but these must be distinguished from normal suture lines (Figure 1-11). Comparing the contralateral side to the side in question may help to distinguish fractures from normal sutures. Air–fluid levels within sinuses following trauma are likely blood resulting from fracture (see Figures 1-8 and 1-9). Pneumocephalus (air within the calvarium) may also be present and may provide an additional clue to fractures communicating with sinus spaces or the outside world (Figures 1-12 and 1-13). Air may take the form of large amorphous collections abutting the calvarium or small black spheres within hemorrhage associated with the fracture.
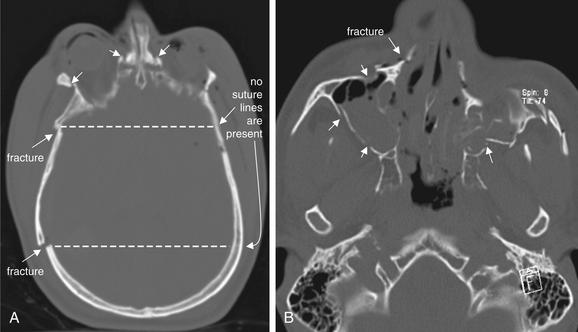
Figure 1-11 Distinguishing fractures from normal sutures.
Fractures, viewed on bone windows. A, Multiple fractures are visible (arrows). The dotted line connecting to the contralateral side confirms that no sutures are present in these locations. B, Multiple displaced fractures are present (arrows). The patient’s left maxillary sinus is badly comminuted. The associated air–fluid levels and opacification are additional clues to the presence of fractures.
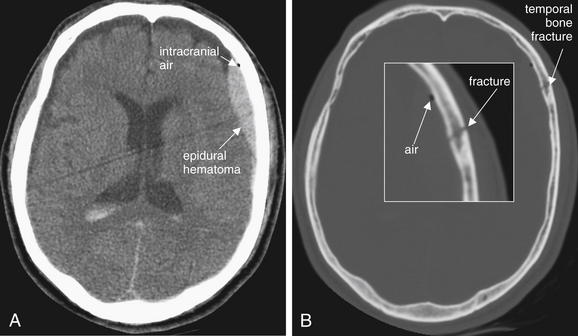
Figure 1-12 Pneumocephalus, noncontrast CT.
A, Brain windows. B, Same image, bone windows.
In this patient with a temporal bone fracture and associated epidural hematoma, air has entered the calvarium and is visible as a small black area on brain windows. On this setting, cerebrospinal fluid, fat, and and air all appear nearly black, so fine adjustment of the window setting may sometimes be necessary to confirm that this finding is air. Air may be more visible on bone or lung windows. In this case, the location, adjacent to the fracture, and the rounded shape, typical of air bubbles, are confirmatory. Finally, the actual density of the tissue can be measured using tools on a digital picture archiving and communication system (PACS). Air has a density of -1000HU, far lower than any other tissue.
(From Broder J, Preston R: An evidence-based approach to imaging of acute neurological conditions. Emerg Med Pract 9(12):6, 2007.)
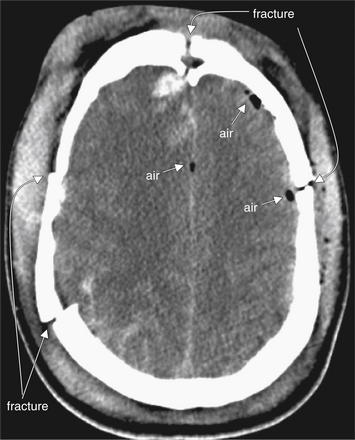
Figure 1-13 Pneumocephalus, noncontrast CT, brain windows.
In this patient with multiple skull fractures, air (arrows) has entered the calvarium and is visible as black areas on brain windows. On this setting, cerebrospinal fluid (CSF) and air both appear nearly black, so fine adjustment of the window setting may sometimes be necessary to confirm that this finding is air. Air (-1000 HU) will remain black on all window settings, while CSF is much denser (0 HU) and will become lighter in color with adjustment of the window level. The density of the tissues can be measured directly using PACS tools when uncertainty exists. In this case, the location, immediately adjacent to fractures, and the rounded shape, typical of air bubbles, are confirmatory.
When a fracture is identified, look carefully for associated brain abnormalities using brain windows. Inspect for any of the types of hemorrhage described later. Look for soft-tissue swelling outside the calvarium overlying the fracture.
B Is for Blood
The second B in our mnemonic is for blood. A brain CT should be carefully inspected for the presence of subarachnoid, epidural, subdural, and intraparenchymal blood using brain windows. Multiple hemorrhage types may coexist. On noncontrast head CT, acute hemorrhage appears hyperdense (brighter or whiter) compared with brain tissue. As time elapses, blood darkens, indicating lower density. This is likely due to a number of factors, including the absorption of water by hematoma, changes in oxidation state, and the dispersion of blood within the subarachnoid space. As discussed later, the sensitivity of CT to detect subarachnoid hemorrhage is thought to decline as time elapses from the moment of hemorrhage. Debate exists about the accuracy of CT in dating blood.23
Hemorrhage can occur in any of several spaces within or around the brain. The shape of blood collections on CT depends on the anatomic location, as described in the sections that follow.
Subarachnoid Hemorrhage
SAH is blood within the subarachnoid space, which includes the sulci, Sylvian fissure, ventricles, and basilar cisterns surrounding the brainstem (Figure 1-14).
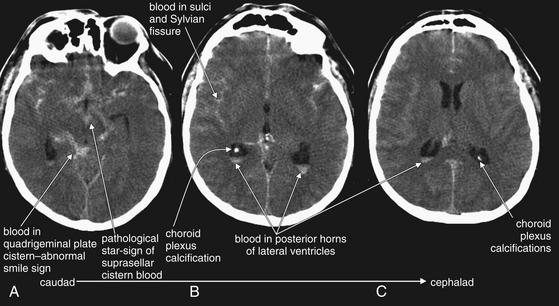
Figure 1-14 Subarachnoid hemorrhage (SAH), noncontrast CT, brain windows.
Acute SAH appears white on noncontrast computed tomography (CT) brain windows. A through C, nonconsecutive axial slices, progressing from caudad to cephalad. In this case of diffuse SAH, note the presence of subarachnoid blood filling the sulci, as well as extending into the cisterns, Sylvian fissures, and even lateral ventricles. In A, blood (white) fills the suprasellar cistern. This star-shaped structure is normally filled with CSF (black). The quadrigeminal plate cistern is normally a smile-shaped black crescent, filled with CSF--but in this case is filled with blood. Extremely bright calcifications in the choroid plexus of the posterior horns of the lateral ventricles are common, normal findings—do not mistake these for hemorrhage. Note their similarity in density to bone of the calvarium.
Fresh SAH appears white, although the appearance varies depending on the ratio of blood to CSF.24 CT is believed to be greater than 95% sensitive for SAH within the first 12 hours but to decline to 80% or less after 12 hours.25-27 SAH may result from trauma or may occur spontaneously after rupture of an abnormal vascular structure such as an aneurysm. When looking for SAH, inspect the entire subarachnoid space, including the sulci, ventricles, Sylvian fissure, and cisterns for blood. Because subarachnoid blood may diffuse into adjacent regions, it may defy the guideline that hemorrhage and other abnormalities disturb normal brain symmetry. In other words, large amounts of SAH, including hemorrhage into cisterns, may actually result in a symmetrical-appearing head CT. Beware of this possibility when inspecting the brain for abnormalities. Familiarity with the black appearance of normal CSF spaces (see Figure 1-32) can help to avoid confusion. CSF spaces are reviewed in detail later with the “C” in our mnemonic. However, two CSF spaces deserve special mention here with respect to SAH. The suprasellar cistern lies just above the sella turcica (home of the pituitary gland) at the level of the brainstem. This cistern usually is CSF-filled and has the appearance of a symmetrical black “star.” When filled with blood, it appears as a symmetrical white star (see Figure 1-14). The quadrigeminal plate cistern is usually visible on the same axial CT slice and has the appearance of a black “smile” when filled normally with CSF. When filled with subarachnoid blood, it becomes a white “smile.”
As time elapses from the moment of hemorrhage, blood will diffuse through the subarachnoid spaces, like a drop of food coloring dropped into a glass of water. Thus a bright white punctate finding on head CT is not
likely to be SAH, especially hours after the onset of clinical symptoms. Figure 1-14 shows several examples of SAH, involving different brain regions. SAH may be accompanied by other important changes, including hydrocephalus and cerebral edema, discussed later. Box 1-2 summarizes findings of SAH.
Epidural Hematoma
Epidural hematoma (EDH) is a collection of blood lying outside the dura mater, between the dura and the calvarium. It is almost always a traumatic injury, commonly resulting from injury to the middle meningeal artery. Because blood is extravasating from an artery under high pressure, rapid enlargement of the hematoma may occur, leading to significant mass effect, midline shift, and herniation. The common CT appearance is a biconvex disc or lens, collecting in the potential space between the calvarium and the dura mater.28 This shape occurs because the more superficial aspect of the EDH conforms to the curve of the calvarium, while the inner aspect expands and presses into the dura. The dura is usually tethered to the calvarium at sutures, so EDHs usually do not cross suture lines on CT. EDHs may cross the midline, because there are no midline sutures in the frontal and occipital regions. The usual location of an EDH is temporal, although EDHs occasional occur in other locations. Transfalcine herniation may occur with EDHs, so the midline of the brain should be carefully inspected on CT for midline shift or compression of the lateral ventricle. The swirl sign, described as a bright white vortex or “swirl” within the EDH, has long been considered a finding of active bleeding and should be interpreted as a sign of continued expansion, although recent studies have questioned the prognostic significance of this finding.29-32 Figures 1-15 and 1-16 show several examples of EDHs, with the classic findings described earlier. Interestingly, the volume of hematoma has not been shown to correlate with preoperative neurologic status or 6-month postoperative status.33 Box 1-3 summarizes findings of EDH.
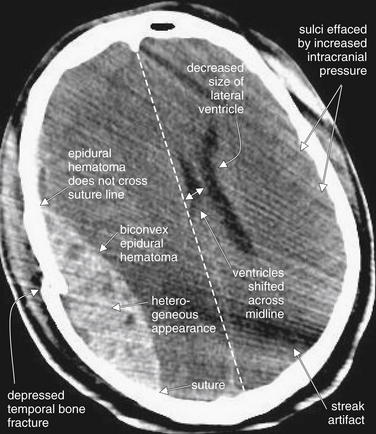
Figure 1-15 Epidural hematoma (EDH), noncontrast CT, brain windows.
EDHs are frequently the result of traumatic injury to the middle meningeal artery at the site of a temporal bone fracture. They characteristically have a biconvex (lens) shape. Because they lie between the calvarium and the dura, they are restricted from extending beyond suture lines, where the dura is tightly adherent to the skull.
Sutures are not actually visible on this brain window setting but could be readily identified by use of bone windows. Suture locations are pointed out in this figure for reference. In this CT, image quality is somewhat degraded by streak artifact emanating from an object outside of the patient to the left side (cropped out of the field of image). Despite this, several classic features of EDH are visible:
(From Broder J, Preston R: An evidence-based approach to imaging of acute neurological conditions. Emerg Med Pract 9(12):7, 2007.)
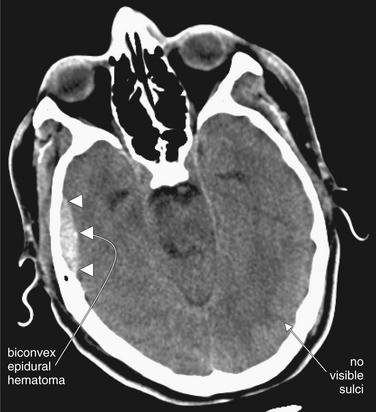
Figure 1-16 Epidural hematoma (EDH), noncontrast CT, brain windows.
This EDH (arrowheads) demonstrates several classic features, including a lenslike or biconvex disc shape and a temporal location. Although it appears small on this slice, the entire CT may reveal a different story. On this slice, sulci are absent, raising concern for elevated intracranial pressure.
Indications for Surgery in Epidural Hematoma
Published criteria for surgical evacuation of an acute EDH include volume greater than 30 cm3 (regardless of Glasgow Coma Score, or GCS). Many PACS toolkits allow automated computation of volumes from two-dimensional datasets by measuring the thickness of a structure or outlining it. For patients with a GCS greater than 8 and no focal deficit, an EDH smaller than 30 cm3, less than 15 mm thick, and with less than 5 mm of midline shift can be managed nonoperatively. Anisocoria with a GCS below 9 is an indication for surgery, regardless of EDH size.34
Subdural Hematoma
Subdural hematoma (SDH) (Figures 1-17 and 1-18) is a collection of blood between the dura mater and the brain surface. SDHs usually occur from traumatic injury to bridging dural veins, although a history of trauma is not always found. SDHs may be self-limited in size due to the lower pressure of venous bleeding, but they can become enormous, causing significant mass effect, midline shift, and herniation. They may also rebleed after an initial delay, resulting in expansion. Moreover, they are frequently markers of significant head trauma, and patient outcomes may be compromised by associated diffuse axonal injury (DAI) (described later) or edema. The typical CT appearance of an SDH is a crescent, with the convex side facing the calvarium and the concave surface abutting the brain surface. The shape of SDHs results from their accumulation between the dura and the brain surface. Because they lie between the dura and the brain, they are not restricted by attachment sites between the dura and the calvarium at sutures. Consequently, SDHs may cross suture lines. Moreover, each cerebral hemisphere is wrapped in its own dura, so SDHs typically do not cross the midline but instead may continue to follow the brain surface into the interhemispheric fissure.
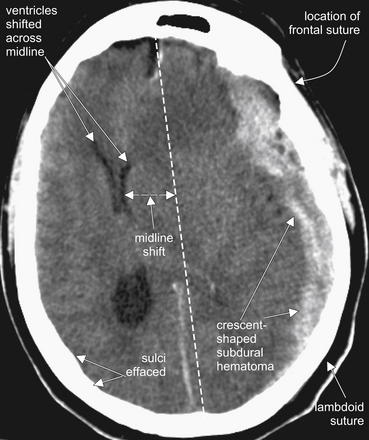
Figure 1-17 Subdural hematoma (SDH), noncontrast CT, brain windows.
SDHs are most often the result of shearing of dural veins from blunt trauma. They usually have a crescent shape and may cross suture lines, as they lie within the dura and are thus free to extend along the brain surface, rather than being restricted by the tethering of the dura to the calvarium at sutures. In this figure, the sutures themselves are not visible due to the window setting, but their locations are labeled to illustrate this point.
This SDH demonstrates several classic features:
(From Broder J, Preston R: An evidence-based approach to imaging of acute neurological conditions. Emerg Med Pract 9(12):5, 2007.)
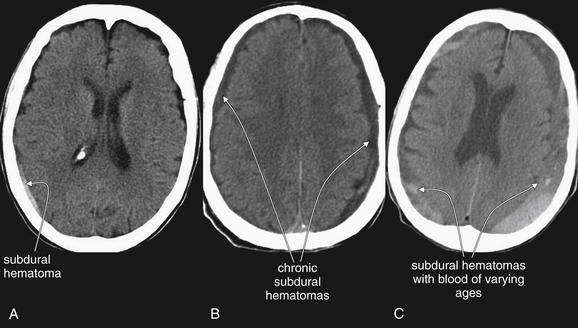
Figure 1-18 Three variations of subdural hematoma (SDH) from different patients, noncontrast CT, brain windows.
A, A small SDH. B, Bilateral SDHs, likely subacute or chronic, as they are hypodense relative to brain. C, Bilateral SDHs with varying density, likely indicating hemorrhage at different times. Bright white hemorrhage is acute, while dark hemorrhage is subacute or chronic. Also notice that the window settings for panels A through C are not identical. CSF within the lateral ventricles appears darker in panel A than in panel C due to differences in the window setting. Windows can be varied to accentuate various tissues.
The color may vary depending on the age of the SDH (see Figure 1-18). Fresh subdurals are typically brighter white (or lighter gray) than the adjacent brain. Older
SDHs, or acute hematomas in anemic patients, may become similar in density (isodense) to the adjacent brain and thus may be difficult to detect.35,36 Clues to their presence include the obliteration of sulci on the brain surface and mass effect resulting from the SDH. Still older SDHs may become similar in density or color to the CSF surrounding the brain and thus may be difficult to recognize. Sometimes SDHs are multicolored or layered, indicating blood of varying ages. Box 1-4 summarizes findings of SDH.
Indications for Surgery in Subdural Hematoma
Published criteria for surgical evacuation of an acute SDH include thickness greater than 10 mm or midline shift greater than 5 mm, regardless of GCS. Surgery may be indicated with smaller SDHs and lesser degrees of shift in patients with a GCS score less than 9, based on intracranial pressure (ICP), pupillary findings, and worsening GCS.37
Intraparenchymal Hemorrhage
Intraparenchymal hemorrhage (Figures 1-19 and 1-20), or hemorrhage within the substance of the brain matter, may occur in trauma or spontaneously, perhaps as a complication of hypertension. The appearance is generally bright white acutely. The size may vary from punctate to catastrophically large, with associated mass effect and midline shift. For intraparenchmyal hemorrhage, mass effect such as midline shift or ventricular effacement should be assessed. Signs of increased ICP should be identified. Particularly for smaller punctate hemorrhages, care must be taken not to mistake hemorrhage for normal benign calcifications of the pineal gland, choroid plexus, and meninges, or vice versa. Calcifications can usually be distinguished from hemorrhage as the former remain bright white on bone windows. In addition, if the density is measured with PACS tools, calcifications have very high density, near +1000HU, while hemorrhage has a density around +40 to +70HU. Pineal gland and choroid plexus calcifications also have stereotypical locations (Figure 1-21) that aid in their recognition. Calcifications are shown in Figure 1-21.
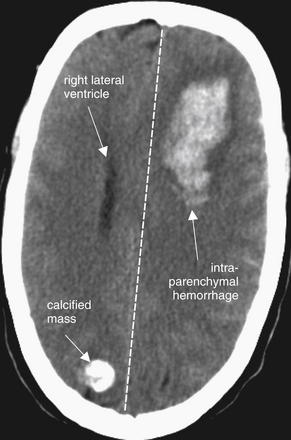
Figure 1-19 Intraparenchymal hemorrhage, noncontrast CT, brain windows.
Acute intraparenchymal hemorrhage appears white on CT brain windows. Hemorrhage in the patient’s left frontal region is creating mass effect with midline shift. The left lateral ventricle has been completely effaced. The single visible ventricle is the right lateral ventricle.
A calcified mass in the right occipital region must be differentiated from acute hemorrhage. Calcifications are extremely bright white on brain windows—as white and dense as bone. On bone windows, they remain white, while hemorrhage does not. The density can also be measured using PACS tools. Bone has a density near +1000HU, while blood has a density closer to +50HU, easily differentiating the two in most cases.
(From Broder J, Preston R: An evidence-based approach to imaging of acute neurological conditions. Emerg Med Pract 9(12):6, 2007.)
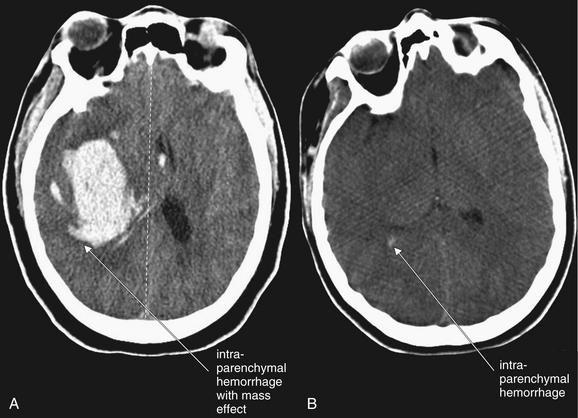
Figure 1-20 Spectrum of intraparenchymal hemorrhage, noncontrast CT, brain windows.
Intraparenchymal hemorrhage may be grossly obvious or subtle. A, A large hemorrhage with midline shift and mass effect. B, A small amount of hemorrhage (arrow).
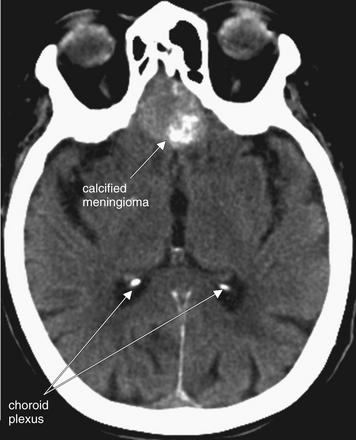
Figure 1-21 Calcifications, noncontrast CT, brain windows.
Calcification of the choroid plexi is a frequent incidental finding that may resemble punctate intraparenchymal hemorrhage. Clues are bright white density (equal to that of bone), location in the posterior horns of the lateral ventricles, and frequent bilaterality.
This patient also has a calcified meningioma. Meningiomas are common benign neoplasms that may become quite large. A well-circumscribed, rounded appearance and calcification are common.
(From Broder J, Preston R: An evidence-based approach to imaging of acute neurological conditions. Emerg Med Pract 9(12):8, 2007.)
Indications for Surgery in Parenchymal Hemorrhage
Published criteria for surgical treatment of traumatic intraparenchymal hematoma are complex. They include size greater than 20 cm3 with midline shift greater than 5 mm, cisternal compression, or both if the GCS score is 6 to 8. Lesions greater than 50 cm3 in size should be managed operatively, regardless of the GCS score.37a
B Is for Brain
The third B in our mnemonic is for brain. Brain abnormalities include neoplastic masses, localized vasogenic edema, abscesses, ischemic infarction, global brain edema, and DAI.
Masses
Masses are best delineated on CT with IV contrast or on MRI. However, noncontrast CT can demonstrate a variety of masses if they are of sufficient size. In some cases, the mass itself may not be seen, but secondary findings such as mass effect, calcification (see Figure 1-21), or vasogenic edema (Figure 1-22) (see the discussion in the next section) may occur. IV contrast is useful in detecting masses because they are generally extremely vascular and thus enhance in the presence of contrast material. On noncontrast CT, masses may be denser than surrounding brain if they are calcified. Examples are meningiomas, which are often seen as midline structures emanating from the falx cerebri.
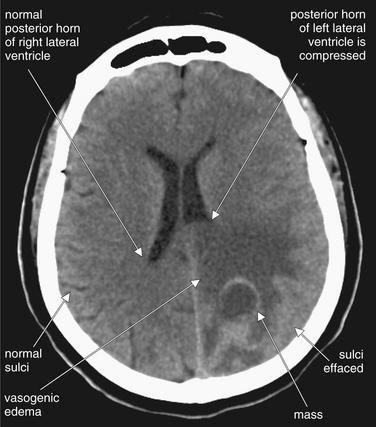
Figure 1-22 Masses, noncontrast CT, brain windows.
A mass with surrounding vasogenic edema, which has a hypodense (dark gray) appearance. Neoplasms frequently are associated with vasogenic edema, named for the putative cause, which is abnormal blood vessels that allow extravasation of fluid.
This form of edema appears hypodense, like an ischemic infarct, but is not restricted to a vascular territory. An abscess might appear similar.
Masses often exert mass effect. Here, the edema surrounding the mass is compressing the posterior horn of the left lateral ventricle. Notice also the effacement of the sulci in the region of the mass.
(From Broder J, Preston R: An evidence-based approach to imaging of acute neurological conditions. Emerg Med Pract 9(12):8, 2007.)
Vasogenic Edema
Malignant primary brain neoplasms or metastatic lesions often appear hypodense (darker or blacker) compared with normal brain. This appearance is typical of localized
vasogenic edema surrounding a lesion. Neoplasms often secrete vascular endothelial growth factor, resulting in the development of immature blood vessels that perfuse the tumor. These immature vessels have leaky endothelial junctions, allowing fluid to extravasate into the interstitium, which causes vasogenic edema. This increased fluid content reduces the density of brain tissues toward that of water (zero on the Hounsfield scale), resulting in a hypodense appearance on CT. In addition, the mass itself and associated local edema increase the volume of brain tissue, resulting in local mass effect, including the effacement of ventricles (see Figure 1-22, effacement of the posterior horn of the lateral ventricle) and effacement of sulci as adjacent gyri expand in size (see Figure 1-22).
Vasogenic edema must be differentiated from infarction, which may also cause a hypodense appearance. Vasogenic edema does not need to conform to a normal vascular territory within the brain, whereas hypodensity associated with ischemic stroke does. Vasogenic edema responds to treatment with dexamethasone, whereas steroids are not indicated for other forms of cerebral edema such as traumatic edema do not. In fact, a multicenter randomized controlled trial of corticosteroid therapy in patients with traumatic brain injury showed an increased risk of death and severe disability from steroid use.38
As described earlier, midline shift associated with a mass should be carefully assessed during inspection of the brain on brain windows.
Abscesses
Abscesses may be visible on noncontrast CT as hypodense regions (Figure 1-23), occasionally with air within them. This appearance may be nonspecific, and a differential diagnosis including toxoplasmosis, mass with vasogenic edema, or central nervous system lymphoma should be considered, depending on the patient’s clinical scenario. Abscesses, toxoplasmosis, neurocysticercosis (Figure 1-24), and masses all may undergo ring enhancement, an increase in density around a lesion after administration of IV contrast (Box 1-5). This reflects increased blood flow in the vicinity of the lesion, as well as leaky vascular structures that allow extravasation of contrast in the region.
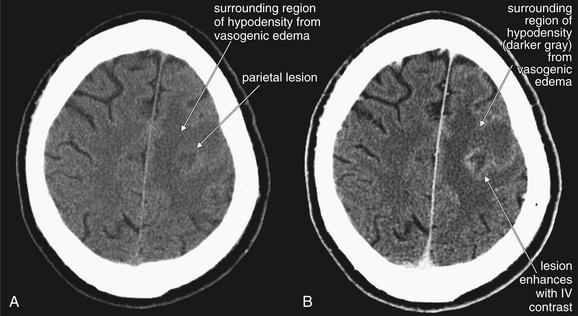
This 48-year-old male presented with status epilepticus. CT showed a parietal mass, which at brain biopsy was found to be an abscess. Cultures grew mixed gram-positive and gram-negative organisms and anaerobes. The patient was subsequently found to be human immunodeficiency virus positive.
A, Noncontrast head CT, brain windows. B, CT with intravenous (IV) contrast moments later, brain windows. Abscesses and other infectious, inflammatory, or neoplastic lesions typically have surrounding hypodense regions representing vasogenic edema. When IV contrast is administered (B), the lesion may enhance peripherally, often referred to as ring enhancement.
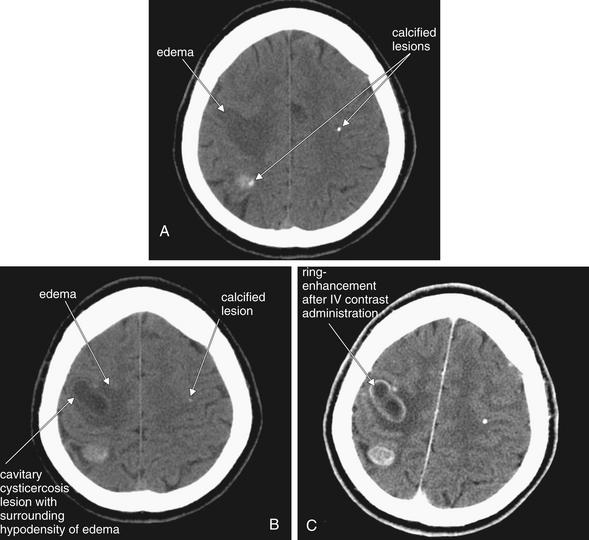
Figure 1-24 Neurocysticercosis.
This 40-year-old Bolivian male presented with left-hand weakness. A, B, Noncontrast head CT, brain windows. C, CT with contrast moments later—compare this with image B, a slice through the same level of the brain before contrast administration. Hypodense lesions are present, with surrounding hypodensity (dark gray) representing edema. Scattered calcifications are also seen, which are a common feature of old neurocysticercosis lesions. Administration of IV contrast leads to ring enhancement, a feature of many infectious and inflammatory conditions, including neurocysticercosis, brain abscess, and toxoplasmosis.
Ischemic Stroke and Infarction
Ischemic stroke accounts for 85% of strokes.39 It is potentially one of the most important indications for head CT and is an area in which the interpretation of CT by emergency physicians might play the greatest role by shortening the time to diagnosis. One obvious reason is the 3-hour or 4.5-hour window for administration of IV t-PA—an intervention that is still fiercely debated in the emergency medicine community and that has been reviewed elsewhere.40
Understanding CT findings of acute ischemic stroke is important—for those who do not believe in
administration of t-PA, they provide yet another argument against the treatment, while for those who would use t-PA in select patients, they may allow more rational and safer patient selection. Apart from t-PA administration, rapid diagnosis of ischemic stroke may allow the emergency physician to make better-informed decisions about patient management and disposition. If new stroke therapies such as intra arterial thrombolysis and clot retrieval become widely accepted and available, rapid CT interpretation for ischemic stroke may become even more valuable. Interventional radiologic therapies for ischemic stroke are reviewed in Chapter 16.
A complex cascade of events occurs to cause the evolving appearance of ischemic stroke on head CT. Initially, at the moment of onset of cerebral ischemia, no abnormalities may be seen on head CT—thus, this is one of the most difficult diagnoses for the emergency physician, as a normal CT may correlate with significant pathology. Studies have shown emergency physicians to be relatively poor at recognizing early ischemic changes, which we review here (Table 1-3 and Box 1-6).
TABLE 1-3 Early Ischemic CT Changes Within 3 Hours of symptom onset, Possibly Altering Management
| Type of Change | Percentage |
|---|---|
| Any change | 31% |
| GWMD loss | 27% |
| Hypodensity | 9% |
| CSF space compression | 14% |
| GWMD loss > ⅓ MCA territory | 13% |
| Hypodensity > ⅓ MCA territory | 2% |
| CSF space compression > ⅓ MCA territory | 9% |
GWMD, Gray–white matter differentiation.
From NINDS; Patel SC, Levine SR, Tilley BC, et al: Lack of clinical significance of early ischemic changes on computed tomography in acute stroke. JAMA 286:2830–2838, 2001.
How Early Does the Noncontrast Head CT Indicate Ischemic Stroke?
Analysis of the National Institute of Neurological Disorders and Stroke (NINDS) data shows that early ischemic changes are quite common in ischemic stroke, occurring in 31% of patients within 3 hours of stroke onset,41 in contrast to the widely held belief that ischemic strokes become visible on CT only after 6 hours.42 Some findings may occur immediately, such as the hyperdense middle cerebral artery (MCA) sign, while other findings may require time to elapse, with the gradual failure of adenosine triphosphate (ATP)–dependent ion pumps and resulting fluid shifts.
Hyperdense Middle Cerebral Artery Sign
The hyperdense MCA sign is a finding of hyperacute stroke, indicating thrombotic occlusion of the proximal MCA. This may be present on the initial noncontrast head CT immediately following symptom onset, since the finding does not require the failure of ion pumps and fluid shifts that lead to other ischemic changes on head CT. Because
Box 1-6 Early CT Findings of Acute Ischemia
From Patel SC, Levine SR, Tilley BC, et al: Lack of clinical significance of early ischemic changes on computed tomography in acute stroke. JAMA 286:2830-2838, 2001.
this lesion leads to ischemia in the entire MCA territory, typically the patient with this finding will have profound hemiparesis or hemiplegia on the contralateral side, as well as other findings such as language impairment, depending on the side of the lesion. In other words, this finding is not associated with mild or subtle strokes. The presence of a hyperdense MCA sign is an independent predictor of neurologic deterioration.43 However,the dense MCA sign is only visible in 30% to 40% of patients with stroke affecting the MCA territory.71,72 It may seem surprising that this vascular abnormality is visible on noncontrast head CT. As the name implies, the MCA appears hyperdense (bright white) compared with the normal side. A specific Hounsfield unit threshold of greater than 43 units has been recommended to avoid false positives.44
Use your knowledge of the location of the patient’s neurologic deficits to direct you to the likely side of the lesion, which will be on the contralateral side. Then use the normal symmetry of the brain to help you identify this abnormality. A related finding, the MCA “dot” sign, has been validated by angiography and found to be a specific marker of branch occlusion of the MCA. This sign appears as a bright white dot in the sylvian fissure on the affected side.45 Figure 1-25 shows the hyperdense MCA sign.
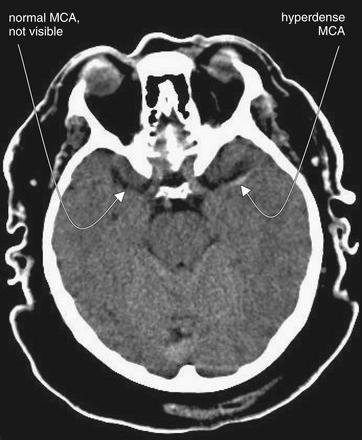
Figure 1-25 Hyperdense middle cerebral artery (MCA) sign, noncontrast CT, brain windows.
The hyperdense MCA sign is a CT finding of thrombosis of the MCA. Importantly, this is a sign seen on noncontrast CT—the typical initial imaging study obtained in patients with suspected acute stroke. It can be seen in the immediate hyperacute stages of thrombotic–ischemic stroke and may guide therapy, such as intra arterial tissue plasminogen activator administration. On CT, the hyperdense MCA appears as a white line or point representing the thrombosed vessel. Care must be taken not to confuse this with the white appearance of fresh extravascular blood in hemorrhagic stroke. In this patient, who presented within 30 minutes of onset of right hemiplegia, the normal MCA is not visible while the left MCA is thrombosed and demonstrates the hyperdense MCA sign.
(From Broder J, Preston R: An evidence-based approach to imaging of acute neurological conditions. Emerg Med Pract 9(12):12, 2007.)
Gray–White Differentiation
Understanding this finding of stroke requires a brief and simple review of neuroanatomy. Gray matter is brain tissue without myelin—examples include the cerebral cortex, lentiform nucleus, caudate, and thalamus. White matter is composed of myelinated axons in brain tissue—rendered white on gross pathologic section by the high lipid content of the myelin sheath. Recall from our earlier discussion of Hounsfield units that lower density on CT means a darker color—low-density fat appears a darker gray than does higher-density water. Thus, the higher fat content of white matter makes it appear darker on CT. In other words, on a normal head CT, gray matter is whiter and white matter is grayer. Figure 1-26 shows the normal gray–white matter boundary.
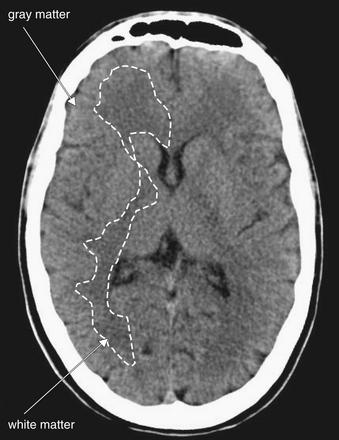
Figure 1-26 Normal gray–white matter differentiation, noncontrast CT, brain windows.
Myelinated regions (white matter) have a greater fat content than unmyelinated regions (gray matter). As a consequence, and perhaps counterintuitively, white matter has lower density and appears darker than gray matter on computed tomography. The dotted line on the patient’s right outlines the border between gray and white matter. Trace this interface yourself on the patient’s left.
Loss of Gray–White Matter Differentiation
In an ischemic stroke, as brain tissue consumes ATP and is unable to replenish it, ATP-dependent ion pumps stop working. Ions equilibrate across membranes, and fluid shifts occur. Gray matter gains fluid, lowering its density, and as it does, its density becomes more similar to that of white matter. White matter also gains fluid, increasing its density slightly. Since differences in density are the reason that these tissues look different on CT, as their densities converge, their appearances become more similar, and it becomes more difficult to discern where gray matter ends and white matter begins. This change is called loss of gray–white matter differentiation, and it is an early finding of ischemic stroke, occurring within 3 hours after onset of ischemia.41 Figures 1-27 and 1-28 show an abnormal gray–white matter boundary.
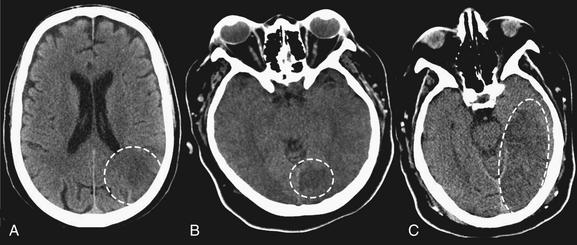
Figure 1-27 Early ischemic hypodensity, noncontrast CT, brain windows.
Three examples of subtle hypoattenuation in early stroke (dotted circles). Compare the abnormal side to the normal side in each image. Large areas of hypoattenuation predict an increased risk of hemorrhage and are relative contraindications for tissue plasminogen activator.
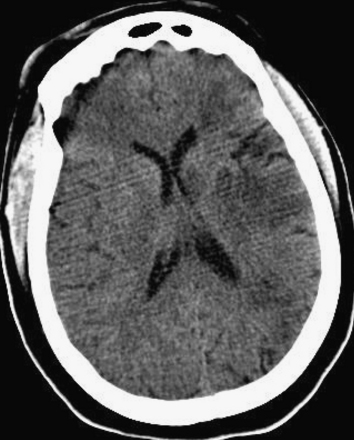
Figure 1-28 Gray and white matter differentiation, noncontrast CT, brain windows.
When ischemia renders the gray–white interface less discrete, the computed tomography appearance is called loss of gray–white differentiation. In this example, the differentiation is normal on the patient’s right but is being lost on the patient’s left. The patient has progressed beyond early hypoattenuation (Figure 1-27) and is developing the frank hypodensity of ischemic stroke.
Insular Ribbon Sign (Loss of Insular Ribbon)
The insula (or insular cortex) is a thin ribbon of gray matter tissue that lies just deep to the lateral brain surface, separating the temporal lobe from the inferior parietal cortex. On CT, it is visible as the tissue layer lining the Sylvian fissure. This region is subject to early ischemic changes in the form of loss of gray–white matter differentiation, often called the insular ribbon sign or loss of the insular ribbon, as this area becomes less distinct.
Hypodensity in Ischemic Stroke
Ischemic brain looks hypodense, or darker than normal brain in the same anatomic region. This change occurs for the same general reasons as does loss of gray–white differentiation. As neurons deplete stores of ATP, cytotoxic and vasogenic edema both occur. Ion gradients run back toward equilibrium, and water shifts into gray matter, making it less dense relative to normal tissue. The appearance of an infarct becomes progressively more hypodense over the first several days to weeks of an ischemic stroke. Again, this finding can occur as an early change within 3 hours of symptom onset.41 Figures 1-27 through 1-30 show examples of hypodensity. Figure 1-31 shows the progressive hypodensity of an ischemic stroke over several days.
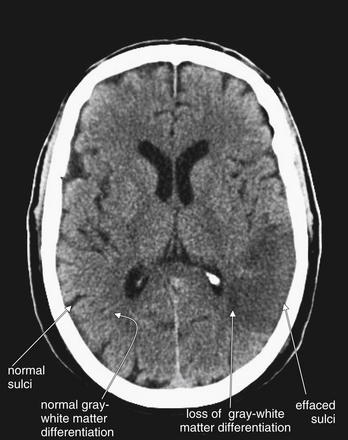
Figure 1-29 Early ischemic changes, noncontrast CT, brain windows.
Early ischemic changes may be visible within 3 hours of onset of ischemic stroke. They include sulcal effacement, loss of gray–white matter differentiation, and the insular ribbon sign. Sulcal effacement occurs as local edema develops, swelling brain matter and displacing the cerebrospinal fluid that normally fills sulci as the adjacent gyri become edematous. Loss of gray–white matter differentiation occurs as ion pumps fail, leading to equilibration of diffusion gradients and shift of fluid. The normal ability of computed tomography (CT) to differentiate gray from white matter relies on differences in their density due to differences in their fluid and lipid content. White matter contains more fat, is less dense, and therefore appears darker on CT. Gray matter contains less lipid, is denser, and therefore appears whiter on CT. Local edema in the region of a developing infarct renders the region darker on CT because of the presence of increasing amounts of fluid. This masks the normal differentiation between white and gray matter. The insular ribbon sign is another manifestation of this loss of gray–white matter differentiation. The insula is a region of gray matter lining the lateral sulcus, in which ischemic strokes of the middle cerebral artery distribution may demonstrate early abnormalities. In this patient, both sulcal effacement and loss of gray–white matter differentiation have occurred. The frank hypodensity of ischemic stroke is also becoming visible. Compare these to similar regions on the patient’s right side, where normal sulci and normal gray–white matter differentiation are seen.
(From Broder J, Preston R: An evidence-based approach to imaging of acute neurological conditions. Emerg Med Pract 9(12):12, 2007.)
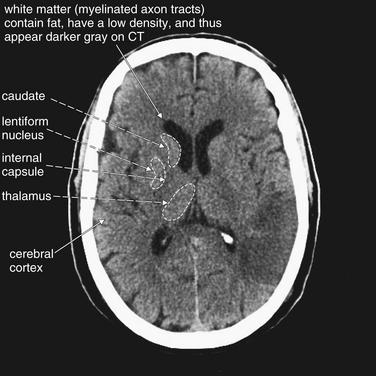
Figure 1-30 Early ischemic changes, noncontrast CT, brain windows.
(Same image as Figure 1-29.) Image contrast has been increased to accentuate gray–white matter differentiation. On a PACS image, you can adjust the window level and contrast. In a normal brain, you should be able to discern several white and gray matter structures.
Normal gray–white matter differentiation is subtle. Gray matter has lower lipid content than myelinated white matter and therefore appears brighter on computed tomography (CT). On CT, this leads counterintuitively to gray matter appearing whiter and white matter appearing grayer.
Normal gray matter areas include the cerebral cortex, lentiform nucleus, caudate, and thalamus. White matter tracks, including the internal capsule, separate these structures.
(From Broder J, Preston R: An evidence-based approach to imaging of acute neurological conditions. Emerg Med Pract 9(12):12, 2007.)
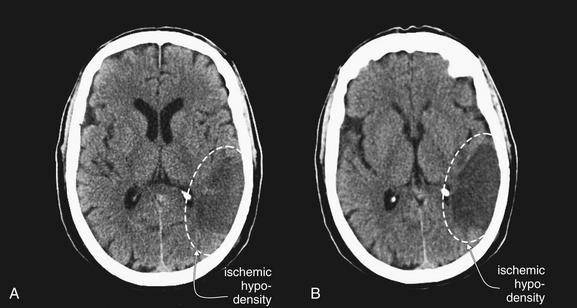
Figure 1-31 Progression of ischemic hypodensity over days, noncontrast CT, brain windows.
A left middle cerebral artery distribution stroke, day 2 (A) and day 4 (B) after symptom onset. Early ischemic changes may be visible within 3 hours of symptom onset. The rate of progression of computed tomography findings may depend on the degree of ischemia or infarction and thus may vary between patients. Unlike vasogenic edema, this hypodense region follows a vascular territory and has a wedge-shaped appearance. Also note the local effacement of sulci in the region of the infarct due to local edema.
(From Broder J, Preston R: An evidence-based approach to imaging of acute neurological conditions. Emerg Med Pract 9(12):8, 2007.)
Are Ischemic Changes a Contraindication to t-PA?
Early ischemic stroke findings were not used as exclusion criteria in the NINDS trial, which required only the absence of hemorrhage on initial head CT.46 However, multiple studies following NINDS have shown an increased risk of intracranial hemorrhage, bad neurologic outcomes, and death in patients with early ischemic changes on head CT.47,48 Ischemic changes are relative contraindications to t-PA administration, and their presence may suggest that greater than 3 hours have elapsed from symptom onset, in which case systemic t-PA may be contraindicated. In addition, the Food and Drug Administration, American Heart Association, and American Academy of Neurology specifically recommend against administering t-PA if early signs of major infarction are present, because of increased risk of intracranial hemorrhage.49-51 MCA infarction greater than one third of the MCA territory predicts increased bleeding risk if t-PA is given, and it was poorly detected by radiologists, neurologists, and emergency physicians in past studies.18,52,53 In addition, the greater the extent of ischemic changes on CT, the higher the risk of bleeding, as demonstrated in the second multinational European Cooperative Acute Stroke Study (ECASS-II).48
The many noncontrast CT findings of ischemic stroke may seem too much to hope to remember, and their clinical relevance may appear unclear. A few simple rules can make sense of this. First, a normal head CT is perhaps the most likely finding if the patient presents within 3 hours of symptom onset. In this setting, the most important job of the emergency physician in interpreting the head CT is to rule out hemorrhage. Second, in the presence of significant unilateral neurologic abnormalities, the hyperdense MCA sign should be sought. Third, early changes such as loss of gray–white differentiation and hypodensity should be identified, again using the patient’s clinical symptoms to direct you to the likely abnormal side of the brain. These early changes may imply either an earlier time of onset than suggested by the history or a massive stroke in progress.
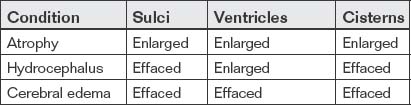
Cerebral Edema
Diffuse cerebral edema is an abnormality of the brain, but it is manifest through compression of CSF spaces. It can logically be evaluated under B or C in our mnemonic. Cerebral edema can result from many pathologic processes, including trauma, anoxic brain injury, carbon monoxide poisoning, and systemic fluid and electrolyte abnormalities. The appearance is therefore not diagnostic of the underlying etiology. As the brain swells, several visible changes occur on noncontrast CT. CSF spaces become collapsed as they give way to the increasing volume of solid brain tissue. As a result, the lateral ventricles become slitlike and ultimately become obliterated. In addition, the sulci become effaced as the gyri swell. The normal rim of CSF surrounding the brain disappears. The cisterns surrounding the brainstem become compressed, and risk of herniation rises. Moreover, as the ICP rises, the cerebral perfusion pressure falls
Box 1-7 Relationship Among Intracranial Pressure, Arterial Blood Pressure, and Cerebral Perfusion Pressure
As ICP rises, blood flow to the brain decreases unless a compensatory rise in blood pressure occurs:

(in the absence of a compensatory rise in mean arterial pressure) and global brain ischemia occurs (Box 1-7). Just as with focal ischemia (stroke), ion pumps fail and loss of gray–white matter differentiation occurs. Figure 1-35 later in this chapter shows changes of diffuse cerebral edema. Box 1-8 summarizes findings of cerebral edema.
Diffuse Axonal Injury
DAI is the widespread shearing of long axons that occurs as the result of deceleration injury. Common clinical scenarios include high-speed motor vehicle collisions and falls from great height. This injury is not typical of blows to the head or penetrating brain injury. The CT appearance is nonspecific: normal in the hyperacute phase, often followed by cerebral edema over hours to days. Punctate intraparenchymal hemorrhage may occur as well. Often, other traumatic brain injury will be evident, such as SDH or EDH.
The prognosis is poor, and resolution of CT findings may not equate with clinical improvement. MRI is thought to be more diagnostic.54
Normal Findings That May Simulate Disease
Several common incidental findings may simulate disease. These include calcifications in the choroid plexus of the posterior horns of the lateral ventricles (recall that the choroid plexus secretes CSF) (see Figure 1-21) and calcifications in the pineal gland.55 These should not be confused with hemorrhage, because they have a greater density (brighter white appearance) and a stereo typical location. The significance of these findings is unknown, although choroid calcifications have been associated with hallucinations in schizophrenia.56
Why Can Two Patients With the Same CT Findings Have Markedly Different Neurologic Examinations?
Remember that CT offers a macroscopic snapshot in time of complex pathologic changes. It may be that a patient with severe neurologic impairment but a relative benign–looking head CT will soon develop changes such as cerebral edema due to neuronal injury that has already occurred or is ongoing. In other cases, a patient with a large SDH may appear surprisingly neurologically intact, whereas another patient with similar head CT findings is severely impaired. One explanation is the degree of DAI that may accompany abnormalities such as SDH. The patient with minimal deficits may have no DAI, whereas the patient with severe deficits may have severe DAI, which is not as evident on CT. Another of many factors that may determine clinical status is the amount of cerebral atrophy present before the injury. Atrophy is loss of brain volume and compensatory increase in the size of CSF-containing spaces, such as ventricles, cisterns, and sulci. When an injury occurs and cerebral edema or a space-occupying lesion such as an SDH develops, the presence of atrophy (see Figure 1-33) may be protective by allowing room for expansion of the pathologic lesion without leading to herniation or precipitous rises in ICP.
C Is for CSF Spaces
The final letter in our mnemonic, C, reminds us to inspect CSF spaces. This is critical, even in cases in which other pathology, such as intracranial hemorrhage, has already been found. The CSF spaces offer clues to ICP and may reveal a neurosurgical emergency. In addition, as discussed earlier, SAH may accumulate in CSF spaces, including sulci, cisterns, and ventricles. Normal CSF spaces (Figure 1-32) show symmetrical lateral ventricles that are neither enlarged nor effaced, patent sulci, and patent basilar cisterns. Deviations from this norm are best appreciated by understanding the normal pattern. In cerebral atrophy (Figure 1-33), all CSF spaces are enlarged. In obstructive hydrocephalus (Figure 1-34), the enlarging ventricles compress other CSF spaces, causing effacement of the sulci and basilar cisterns. In diffuse cerebral edema (discussed earlier under “B is for Brain”) (Figure 1-35), the swelling brain parenchyma compresses and effaces all CSF spaces, including sulci, ventricles, and cisterns. Figure 1-36 compares various combinations of CSF spaces and their diagnostic correlates. Table 1-4 summarizes changes in CSF spaces and the accompanying change in ICP.
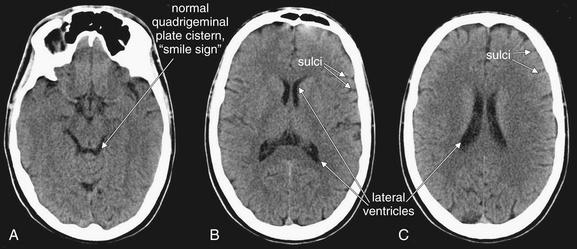
Figure 1-32 Normal cerebrospinal fluid spaces, noncontrast CT, brain windows.
Images are from the same patient, progressing from caudad to cephalad. A, In a normal brain, the basilar cistern is patent and filled with black CSF (sometimes referred to as the “smile sign”). B, C, The lateral ventricles are open but not enlarged. In all panels, sulci are visible but not excessive.
(From Broder J, Preston R: An evidence-based approach to imaging of acute neurological conditions. Emerg Med Pract 9(12):5, 2007.)
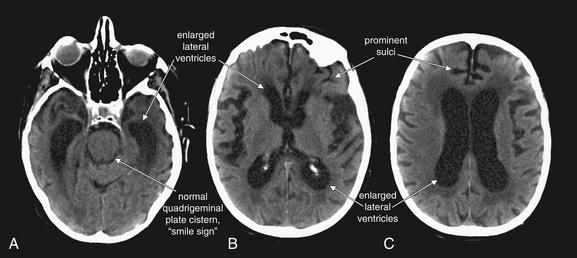
Figure 1-33 Cerebral atrophy, noncontrast CT, brain windows.
Images are from the same patient, progressing from caudad to cephalad.
In cerebral atrophy, all cerebrospinal fluid spaces become prominent. A, The quadrigeminal plate cistern is open. A–C, The lateral ventricles are enlarged and sulci are prominent, helping to distinguish this condition from hydrocephalus, where ventricles are large but sulci are effaced.
(From Broder J, Preston R: An evidence-based approach to imaging of acute neurological conditions. Emerg Med Pract 9(12):9, 2007.)
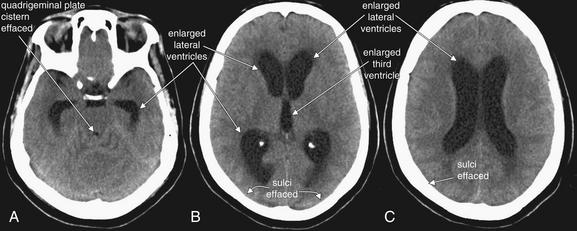
Figure 1-34 Hydrocephalus, noncontrast CT, brain windows.
Images are from the same patient, progressing from caudad to cephalad.
In hydrocephalus, the quadrigeminal plate cistern is effaced, resulting in loss of the normal smile sign. A–C, Because the total volume of intracranial contents is fixed in patients whose fontanelles and sutures have closed, as the ventricles enlarge, the sulci become effaced. B, The lateral ventricles and third ventricle are enlarged.
(From Broder J, Preston R: An evidence-based approach to imaging of acute neurological conditions. Emerg Med Pract 9(12):9, 2007.)
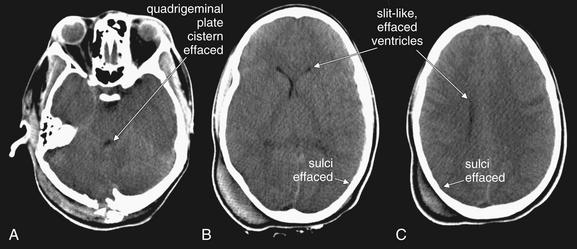
Figure 1-35 Cerebral edema, noncontrast CT, brain windows.
Images are from the same patient, progressing from caudad to cephalad. A, The quadrigeminal plate cistern becomes effaced, resulting in loss of the normal smile sign. B, C, The lateral ventricles become compressed and slitlike, or even completely effaced. Sulci become effaced.
(From Broder J, Preston R: An evidence-based approach to imaging of acute neurological conditions. Emerg Med Pract 9(12):9, 2007.)
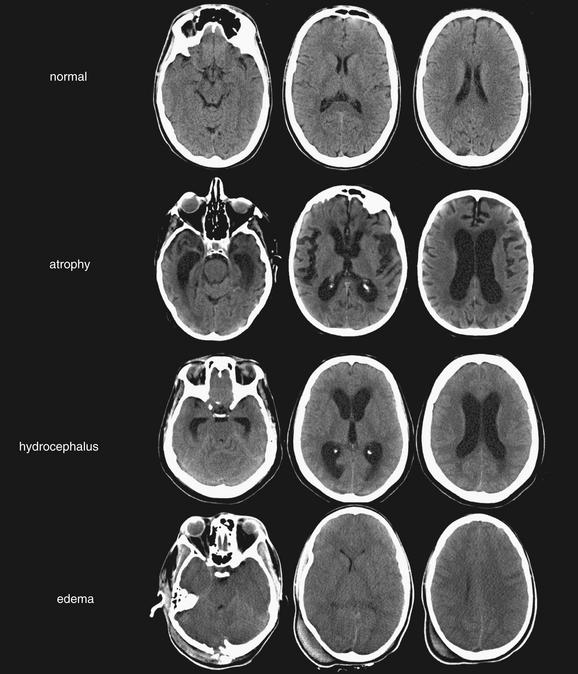
Figure 1-36 Comparison of cerebrospinal fluid (CSF) spaces.
(From Broder J, Preston R: An evidence-based approach to imaging of acute neurological conditions. Emerg Med Pract 9(12):9, 2007.)
Because the volume of the calvarium is fixed in patients whose fontanelles and sutures have closed, as the size of one component of skull contents (brain, CSF, and blood) increases, the volume of other components must diminish. Once the compressible skull contents (CSF spaces and circulating blood volume) have been reduced to their minimum volumes, ICP rises rapidly if other cranial contents continue to enlarge.
Sulci
Sulci, the CSF spaces between the undulating gyri of the brain surface, should appear black on brain windows. Normal sulci are visible but not prominent, and a thin ribbon of CSF should outline the entire brain. In cases of cerebral edema, the sulci may be completely effaced as the brain swells. In hydrocephalus, the volume of brain remains fixed but ventricles increase in size, leading to compression of the sulci. In cases of cerebral atrophy, loss of brain tissue volume leads to a compensatory increase in the size of sulci (Figures 1-32 through 1-36).
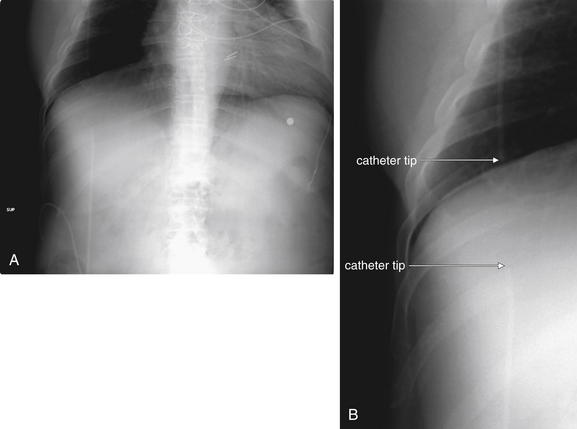
Figure 1-37 Ventriculoperitoneal shunt failure.
A ventriculoperitoneal shunt series is a series of plain x-ray images documenting the course of a shunt from brain to peritoneum. Rarely, a shunt series may reveal an abnormality despite a normal brain CT. Much more frequently, the shunt series will be abnormal only if the head CT shows hydrocephalus.
A, Chest x-ray from a shunt series. B, Close-up from the same image. In this patient, a discontinuity is faintly visible between the shunt catheter in the chest and that in the abdomen. The patient’s head CT demonstrated hydrocephalus.
(From Broder J, Preston R: An evidence-based approach to imaging of acute neurological conditions. Emerg Med Pract 9(12):17, 2007.)
Ventricles and Hydrocephalus
Hydrocephalus is an important finding for emergency physicians because of its potential as a neurosurgical emergency. Untreated, hydrocephalus can result in tonsillar herniation, brainstem compression, and respiratory arrest.57 In general, as hydrocephalus becomes severe, the lateral ventricles become significantly enlarged. Because the volume of the calvarium is fixed, and solid brain tissue is essentially incompressible, as the ventricles expand, other CSF spaces become compressed—consequently, the sulci become effaced. In contrast, in the patient with atrophy, the ventricles may appear dilated but sulci appear similarly enlarged. In communicating hydrocephalus, the axial CT at the level of the lateral ventricles and third ventricle can resemble the face of a Halloween pumpkin. The enlarged anterior horns of the lateral ventricles are the rounded eyes, and the normally slitlike midline third ventricle dilates to a rounded nose. The posterior horns of the two lateral ventricles resemble corners of a grin, though they do not connect in the midline. Depending on the location of obstruction to CSF flow, the fourth ventricle just posterior to the quadrigeminal plate cistern may become dilated, producing an O-shaped mouth. The quadrigeminal plate cistern itself may be effaced if significant downward herniation is occurring. This appearance has also been described as a cartwheel, with 5 spokes (the 2 anterior and 2 posterior horns of the lateral ventricles, plus the fourth ventricle) radiating from an axle (the third ventricle). In noncommunicating hydrocephalus, the obstruction may lie proximal to the fourth ventricle, which will then not appear dilated. Comparison with a prior head CT is always valuable in assessing for hydrocephalus, because ventricular size alone is a relatively poor predictor of ICP.58 Normal ventricular size does not completely exclude the possibility of increased intracranial pressure.
A variety of CT criteria for acute and chronic hydrocephalus have been described (Box 1-9). Figure 1-34 shows CT findings of hydrocephalus. Figure 1-37 shows a disconnected ventriculoperitoneal shunt, which can result in hydrocephalus.
Atrophy
In cerebral atrophy, loss of brain volume results in relatively symmetrical increase in size of sulci and ventricles. The basilar cisterns should also remain patent (see Figure 1-33).
Computed Tomography Findings of Elevated Intracranial Pressure
A variety of CT findings may indicate elevated ICP, though none are completely predictive. Findings that suggest increased ICP are decreased ventricle size, decreased basilar cistern size, effacement of sulci, degree of transfalcine herniation (midline shift), and loss of gray–white matter differentiation (Box 1-10).59
What CT Findings Are Contraindications to Lumbar Puncture?
Before performing lumbar puncture, confirm that findings of midline shift or elevated ICP are not present. The midline should be midline, the sulci should be evident, and the cisterns should be open. Ventricle size should not be excessive, particularly when compared to sulci. The evidence basis for assessment of ICP using CT is reviewed later in this chapter.
Determination of Need for imaging
We have discussed interpretation of head CT in detail, which prepares us for the harder task we face as emergency physicians: determining which patients actually require imaging. We begin this assessment with a review of the costs and radiation risks of imaging, because these are important factors in deferring imaging when possible.
Costs of Imaging
Costs of CT and MR tests are listed in Table 1-5. These Medicare reimbursement figures may dramatically underestimate the cost billed to the patient. An industry survey of imaging costs in New Jersey found a wide variation in consumer costs, ranging from $1000 to $4750 for brain MRI or magnetic resonance angiography (MRA).60 The American Hospital Directory reports the national average charge for head CT as $996 and for MRI as $2283.61 Additional radiologist physician fees may apply. Some authors have concluded that, in the setting of traumatic brain injury, the extreme cost of a missed injury justifies the use of CT in all patients, rather than a more selective imaging policy based on clinical criteria.62 However, with an annual cost of emergency head CT in the United States estimated to exceed $130 million, others have estimated the savings from selective use of CT to be high and the risk of missed injury to be low using validated clinical decision rules such as the Canadian CT Head Rule (CCHR), discussed later in this chapter.63
TABLE 1-5 Costs of Computed Tomography and Magnetic Resonance Tests∗
| Diagnostic Procedure | Cost ($) |
|---|---|
| CT head or brain without contrast | 230.54 |
| CTA head without contrast, followed by contrast, further sections, and postprocessing | 382.19 |
| MRA, head with contrast | 386.64 |
| MRA, neck with contrast | 386.64 |
| MRI, brain with contrast | 386.64 |
| MRA, neck without contrast material(s), followed by contrast material(s) and further sequences | 522.54 |
∗ Based on 2007 Medicare reimbursement national averages.
From Reginald D, Williams AR II, Glaudemans J: Pricing Variations in the Consumer Market for Diagnostic Imaging Services. Avalere Health LLC, CareCore National, December 2005; American Hospital Directory. (Accessed at http://www.ahd.com/sample_outpatient.html.)
Radiation
Radiation dose from head CT is approximately 60 mGy.64,65 Attributable mortality risk varies, depending on age of exposure. A single head CT in a neonate would be expected to contribute less than a 1 in 2000 lifetime risk of fatal cancer, whereas in adults the risk declines even further, to less than 1 in 10,000.65 However, head CT may have other risks—one study of patients undergoing external beam radiation therapy for scalp hemangiomas, with a radiation exposure similar to that from CT, found an association with lower high school graduation rates.66 This study, although large (more than 2000 subjects followed over time), was retrospective and therefore can demonstrate only association, not
causation. In general, the radiation exposure from head CT likely poses a very low level of risk for deleterious biologic effects, but care should be taken to perform testing only when indicated, as radiation effects are cumulative and not fully understood.
Emergency Department Evaluation
Before imaging can be considered, basic principles of emergency medicine must be applied, including management of the patient’s airway and hemodynamic stabilization as indicated. An unstable patient is not appropriate for imaging tests that will take the patient out of the ED for extended periods, such as MRI. The history and physical examination can guide imaging decisions. A thorough neurologic examination, including assessment of orientation, strength, sensation, deep tendon reflexes, cerebellar function, and language, may help localize the neurologic lesion to assist in choice of imaging modality. Motor and sensory deficits that are unilateral may be more suggestive of an anterior fossa brain abnormality, imaged by CT or MRI, whereas a bilateral motor and sensory level may suggest a spinal lesion. Symptoms of vertigo, ataxia, and dysmetria may suggest posterior fossa cerebellar abnormalities, best imaged by MRI. Acute onset of these symptoms could suggest posterior circulation stroke, for which imaging options would include MRI with MRA and CT angiography (CTA) of the head and neck, described in more detail later. Symptoms of cranial nerve dysfunction, including dysarthria, dysphagia, and abnormalities of extraocular muscles, suggest brainstem pathology better imaged with MRI than with CT. A motor deficit with ptosis and miosis may suggest carotid artery aneurysm or dissection, imaged by CTA, MRA, or carotid ultrasound. Table 1-1 correlates chief complaints, the differential diagnosis, and the suggested initial imaging
Box 1-10 CT Findings of Increased Intracranial Pressure from Cerebral Edema59c
test. A complete review of neuroanatomic localization is beyond the scope of this chapter.
Critical Appraisal of the Literature
A large number of studies have examined indications for imaging, as well as the test characteristics (including sensitivity, specificity, and positive and negative likelihood ratios) of the available imaging modalities. When possible, this chapter focuses on large, multicenter, prospective trials; unfortunately, for many of the clinical questions addressed, strong evidence is lacking. In the sections that follow, we discuss many studies, addressing methodologic strengths and weaknesses. Before we begin, we briefly review some common principles of evidence-based medicine.
Principles of Evidence-Based Medicine for Imaging Studies
Imaging studies for neurologic emergencies share a common problem in that the gold standard for diagnosis is often another imaging study, with no clear independent means of settling discrepancies. It is unclear what strategy should be used when two imaging studies yield divergent results. For example, if CT is compared to MR for evaluation of acute intracranial hemorrhage, which test should serve as the gold standard? Given a negative CT in the context of a positive MR, is the CT a false negative or the MR a false positive? Alternative gold standards may include clinical follow-up for mortality, readmission, neurosurgical intervention, or neurologic outcome. The most stringent reference standard might be autopsy findings, compared with imaging findings. When evaluating a study’s relevance to clinical practice, the strength of the gold standard must be considered.
Another important concept when interpreting the results of a study is point estimate versus 95% confidence interval (CI). Take the example of a study with a point estimate sensitivity of 99% and a CI of 66% to 100%. The 95% CI indicates that the true sensitivity of the test in an infinitely large sample has a 95% chance of lying between the extreme values of 66% and 100%. Although the likelihood of the test having either of these extreme values is low, it cannot be ruled out on the basis of the data. Small studies often have broad 95% CIs for their results, whereas large studies usually have narrower CIs. For a test to be reliable for ruling out a disease process, it must have both a high sensitivity and a narrow CI. To rule in pathology, the specificity must be high and the CI narrow. The lower boundary of the CI can be considered a “worst-case scenario” for the test characteristic.
Another means of reporting a test’s ability to “rule in” or “rule out” pathology is the likelihood ratio (Box 1-11). The likelihood ratio positive (LR+) is the factor by which the odds of disease increases when the test result is positive. The likelihood ratio negative (LR−) is the factor by which the odds of disease decreases when the test result is negative. The pretest odds multiplied by the likelihood ratio (positive or negative) yields the posttest odds.
Positive and negative predictive values are not emphasized in this chapter in that they are heavily influenced by disease prevalence and thus must be used cautiously in clinical practice.
Which ED Patients With Acute Headache Require Emergency Imaging?
The American College of Emergency Physicians (ACEP) published an update to its clinical policy on evaluation of acute headache in 2008.67 Based on the available


evidence, no level A recommendations could be made for indications for imaging. Level B and C recommendations are listed in Box 1-12. Overall, the sensitivity and specificity of history and physical are limited in identifying patients who require emergency imaging.
Imaging for Suspected Stroke
Stroke is the leading cause of disability in the United States68 and may be ischemic (85%) or hemorrhagic (15%) in nature. When presented with signs and symptoms suggestive of stroke, the emergency physician must take steps to differentiate ischemic stroke from intraparenchymal hemorrhage while entertaining the possibility of stroke mimics (e.g., hypoglycemia or Todd’s paralysis). A number of neuroimaging modalities may aid in this task. Some techniques may yield additional information, including the vascular territory affected, the extent of injury, clues to the underlying precipitant cause or causes, and identification of tissue that, though ischemic, might still be viable. This information is critical when contemplating the use of thrombolytic or neuroprotective therapies. Unfortunately, many imaging modalities are not currently available at all institutions during all
Box 1-12 Guidelines for Imaging in Adult Patients Presenting With Acute Headache
From ACEP; Edlow JA, Panagos PD, Godwin SA et al. Clinical policy: Critical issues in the evaluation and management of adult patients presenting to the emergency department with acute headache. Ann Emerg Med 52:407-436, 2008.
 Patients who are older than 50 years and presenting with a new type of headache but with a normal neurologic examination should be considered for an urgent† imaging study.
hours of the day. Furthermore, many theoretically useful options remain untested or inconclusive with regard to their utility in guiding intervention and disposition.
Computed Tomography for Stroke
CT is the most widely available, immediate imaging technique for patients presenting to the ED with signs and symptoms of stroke. Noncontrast head CT is rapid, taking less than 5 seconds for image acquisition using some 64-slice scanners.22 It is sensitive for detecting intracranial hemorrhage,26 and immediate imaging is more cost effective than either delayed or selective imaging strategies.69 Limitations do exist, however. Surrounding bone can obscure evidence of ischemic stroke, an artifact effect known as beam hardening. This problem can be minimized by requesting fine thickness cuts (~1 mm), but the risk of false negatives for stroke detection still exists—particularly when a vertebral–basilar distribution is present, because beam hardening is worsened by thick bone surrounding the posterior fossa.70
Noncontrast CT findings of ischemic stroke were reviewed earlier in the section on head CT interpretation. The prognostic importance of these findings and implications for t-PA therapy are also discussed there. Although the sensitivity of noncontrast head CT for ischemic stroke increases beyond 24 hours, the sensitivity for ischemia-induced changes in the first six hours is relatively low at 66%. Thus, a normal CT is consistent with the diagnosis of acute ischemic stroke in a patient presenting with suggestive signs and symptoms.47
For the emergency physician, several points about early ischemic changes should be emphasized. First, in contrast to the assertion in some emergency medicine texts that ischemic stroke becomes visible on noncontrast head CT only after 6 hours,42 the NINDS trial upon which t-PA therapy is largely based demonstrated that 31% of patients had early findings of ischemia within 3 hours of symptom onset (see Table 1-3).41 Although early ischemic changes were not an exclusion criterion for t-PA in the original NINDS trial,46 subsequent research has shown a heightened risk of hemorrhagic conversion of ischemic stroke, poor neurologic outcomes, and death in patients with these changes.47,48 As a consequence, and as mentioned earlier, the Food and Drug Administration, American Heart Association, and American Academy of Neurology recommend against use of t-PA in the patients with major early ischemic changes.73 Specifically, early ischemic changes occupying an area one third the size of the MCA territory or one third of a cerebral hemisphere, cerebral edema, and midline shift are considered relative contraindications to t-PA because of the increased risk for hemorrhage.74 When discussing the head CT findings with a radiologist before administration of t-PA, it is important to ask specifically about the presence and extent of these changes, in addition to asking about hemorrhage.
Standard contrast-enhanced head CT is rarely used for evaluation of stroke since it provides little additional information compared with noncontrast head CT. With the advent of multidetector CT scanners and spiral CT technology, however, CT angiography (CTA) can be performed to obtain images of the extracranial and intracranial vasculature from the aortic arch to the cranial vertex (Figs. 1-38 through 1-42). Images are acquired by administering a rapid bolus of IV contrast immediately after standard noncontrast head CT. The raw images can be acquired in as little as 60 seconds, and three-dimensional computer reconstructions can be performed in less than 15 minutes. The results might profoundly alter the course of management, because large artery occlusions correlate with National Institutes of Health Stroke Scale scores75 and may indicate a need for endovascular intervention (Discussed in Chapter 16). Generally, agreement between CTA and catheter angiography—still the gold standard for diagnosis of vessel stenosis—approaches 95%. For severe carotid artery stenosis, sensitivity for CTA approaches 100%, whereas the sensitivity for diminished flow in the circle of Willis is 89%.76 Although traditional angiography may have subtle, additional benefits related to characterization of the plaque lesion, the noninvasive and rapid nature of CTA renders it an attractive option to the emergency physician, assuming that the risks of exposure to contrast and additional radiation are acceptable to the patient.
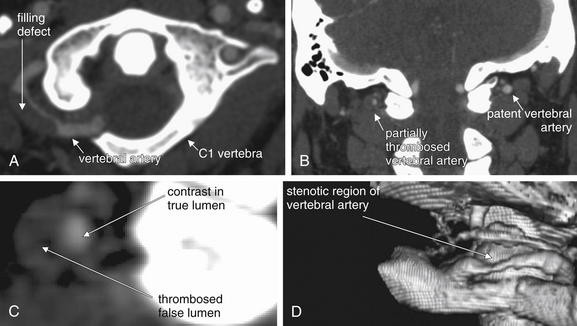
Figure 1-38 Computed tomography angiography (CTA).
CTA can identify dissections of cervical arteries. A, Axial image. B, Coronal image. C, Enlarged region from B. D, Three-dimensional reconstruction. In this case, the false lumen has thrombosed, so a filling defect is seen where thrombus prevents contrast from entering the false lumen. If the false lumen had not thrombosed, an intimal flap would be seen separating the true and false lumens. Although the three-dimensional reconstruction (D) provides useful anatomic context here, it does not reveal the etiology of the stenosis. Instead, the thrombosed dissection itself is evident from the cross-sectional images (A–C).
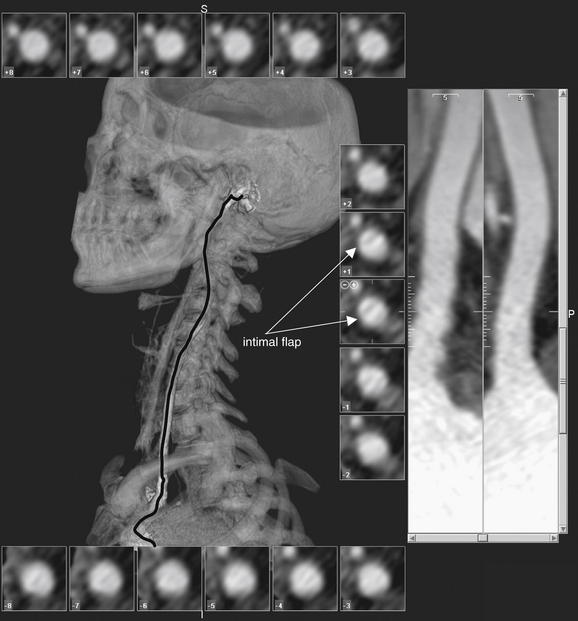
Figure 1-39 Computed tomography angiography (CTA).
In this patient with carotid artery dissection, CTA allows three-dimensional reconstruction of the vessel, with cross sections displayed at intervals around the periphery. An intimal flap is faintly visible on several of these cross sections (arrows).
(From Broder J, Preston R: An evidence-based approach to imaging of acute neurological conditions. Emerg Med Pract 9(12):13, 2007.)
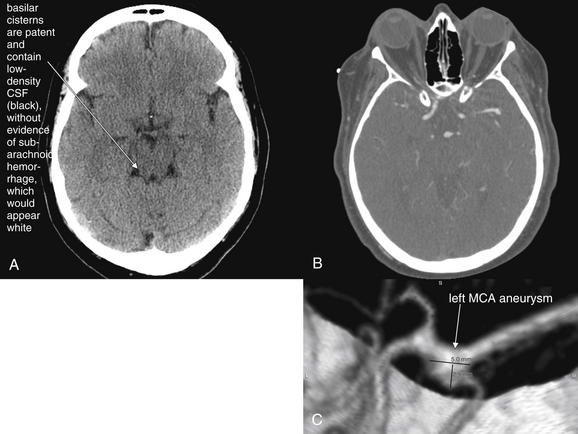
Figure 1-40 Computed tomography angiography (CTA) of intracranial vessels.
A, Noncontrast head CT. B, CT angiogram, axial image. C, Three-dimensional reconstruction rendered from axial CT dataset.
CTA can identify berry aneurysms and arterial–venous malformations. This 53-year-old female awoke at 4 AM with a severe headache. Noncontrast head CT was normal, but lumbar puncture showed xanthochromia and more than 20,000 red blood cells per cubic millimeter. CTA confirmed an aneurysm of the left middle cerebral artery (MCA) trifurcation, with one of the MCA branches arising from the aneurysm. The patient underwent clipping of the aneurysm rather than angiographic coiling because of this configuration.
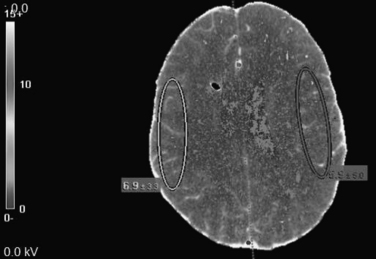
Figure 1-41 Computed tomography (CT) perfusion scan.
A CT perfusion scan provides a map of blood flow in ischemic stroke, potentially identifying ischemic areas that could be salvaged by reperfusion. Here, blood flow in similar regions of the two cerebral hemispheres is compared. This is an imaging technique that continues to be developed in the research setting but is not a routine part of most clinical practice. Erroneously programmed CT perfusion scans have been the cause of iatrogenic radiation injury to patients undergoing stroke evaluations.
(From Broder J, Preston R: An evidence-based approach to imaging of acute neurological conditions. Emerg Med Pract 9(12):13, 2007.)
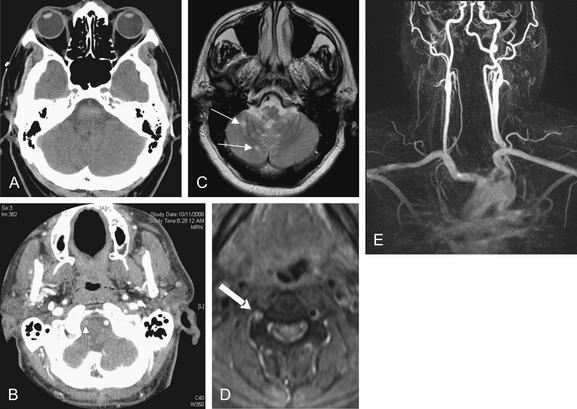
Figure 1-42 Multimodality assessment of stroke.
This patient presented with dizziness, nausea, and vomiting. Noncontrast computed tomography of the brain (A) was interpreted as normal, but symptoms were concerning for posterior circulation stroke. CT angiography (B) suggested right vertebral artery dissection (arrow). Magnetic resonance imaging (C) revealed posterior inferior cerebellar artery–territory ischemic stroke (arrows) and magnetic resonance angiography (MRA) (D) confirmed vertebral dissection (arrow). E, A three-dimensional view from the MRA.
(From Broder J, Preston R: An evidence-based approach to imaging of acute neurological conditions. Emerg Med Pract 9(12):15, 2007.)
CTA uses enhancement of the cerebral vasculature as a surrogate for estimating perfusion of the parenchyma. Targeted CT perfusion studies (CTPSs) can be performed simultaneously using the same bolus of contrast77 and have a sensitivity and specificity for detecting ischemia of 95% and 100%, respectively.78 By measuring the rise and fall in concentration of injected contrast over time, CTPSs are capable of even more direct estimates of cerebral perfusion than CTA, including measurements of cerebral blood volume and cerebral blood flow (see Figure 1-41). Quantifying these variables may allow clinicians to identify areas of the brain that, although ischemic, are potentially still viable—the so-called ischemic penumbra. This has implications for the clinician attempting to weigh the benefits of administering IV or intraarterial thrombolytic drugs against the risk of intracranial hemorrhage. Routine use of CTPSs could potentially allow a more precise prediction of outcome79 and could even herald a paradigm shift in one of the indications for thrombolytic administration: rather than excluding the use of thrombolytics in patients presenting after an arbitrary time interval (e.g., 3 hours), thrombolytic therapy could be initiated or excluded based on actual visualization or absence of a penumbral area likely to benefit from such intervention.
However, routine use of CTPSs in the hospital setting (much less in the ED) is not without challenges. First, the usual difficulties of imaging the posterior fossa with CT techniques persist.70,80 Second, only limited volumes of brain can be imaged at one time with each bolus of contrast, so ischemia located outside the scanning level of interest can be missed,81 although this is partially alleviated by the use of multislice scanners or repeated contrast boluses. Third, despite the theoretical appeal, only small studies in limited populations exist that confirm the ability of CTPSs to detect infarct,82 to predict infarct location83 and size,84 and to predict final outcomes.82,84 We await large study confirmation of these findings before routinely recommending their use in the ED setting. Because CT perfusion studies require that the same regions of the brain be repeatedly scanned over a period of a few minutes to acquire data about perfusion over time, focal areas of the brain receive higher levels of radiation exposure. Widely publicized accounts exist of patients receiving dangerous radiation exposures when CT scanners were misprogrammed, prompting lawsuits and an investigation by the US Food and Drug Administration.84a
Magnetic Resonance Imaging for Acute Stroke
Standard MRI for stroke includes scout images, T1- and T2-weighted images and MRA. Increasingly available new-generation scanners incorporate additional high-sensitivity methods such as diffusion-weighted imaging (DWI), gradient echo pulse sequencing (GEPS), and perfusion-weighted imaging (PWI).
Obtaining DWI has been possible since 1985.85 In brief, the technique involves detecting and processing a signal in response to the movement of water molecules caused by two pulses of radiofrequency. Ischemic changes can be detected in as little as 3 to 30 minutes after insult, and in a small study of 22 patients who presented within 6 hours of symptom onset, DWI was found to be 100% sensitive and specific.86 In a subsequent study, DWI was found to have a far superior sensitivity compared to CT (91% vs. 61%).87 When MRA is done simultaneous with DWI as part of a fast protocol to detect vascular stenosis, their combined use within 24 hours of hospitalization substantially improved the early diagnostic accuracy of ischemic stroke subtypes.88 DWI may also be useful when the clinician encounters a patient with remote-onset neurologic defects. In patients presenting with a median delay of 17 days after symptom onset, clinicians gained additional clinical information one third of the time (including clarification of the vascular territory affected) by performing DWI in addition to conventional T2-weighted images. Of this third, the information was designated as “highly likely” to affect management strategy in 38%.89
MRI is superior to CT at both detecting acute ischemic change85,87 and visualizing the posterior fossa.70,80 However, MRI has failed to supplant CT as the imaging modality of choice for stroke in the ED due to cost, availability of the requisite personnel, time, and a long-standing belief that MRI is not reliable for detecting intracerebral hemorrhage. At least the last two factors are being surmounted. New scanners are faster, with acquisition times in the range of 3 to 5 minutes, compared to 15 to 20 minutes previously.90 With respect to hemorrhage, DWI has proved sufficient to exclude intracerebral hemorrhage,91 and in studies comparing GEPS with CT, GEPS was at least as useful for detecting acute intracranial hemorrhage and actually better at elucidating chronic hemorrhagic changes,92-94 with sensitivity approaching 100% when interpreted by trained personnel.92 The issues of cost and personnel are more complex, however. MRI hardware costs and costs associated with imaging are roughly double those of CT.95 Whether these costs will fall in the future or can be justified in the form of better outcomes, shorter hospital stays, or other measurable end points is unknown. Personnel issues are related not only to sheer manpower but also to qualitative training demands. MRI requires specially trained technicians spending more time per study compared to CT, and expert-level radiologists with extensive training in MRI interpretation must be employed, because interpretation is still not reproducible (though advocates of DWI point out that there is virtually no intra-observer or interobserver variability with this modality).87
Similar to the ability of CTPSs to identify the ischemic penumbra, the combination of DWI and PWI makes it possible to make inferences about ischemia before permanent injury (infarction) has occurred. DWI provides a map of brain tissue that is ischemic and at high risk for infarction. PWI provides a map of brain tissue that is threatened by decreased blood flow but not yet demonstrating cellular injury marked by changes in diffusion. Typically, the hypoperfused region (PWI defect) is larger than the area of diffusion abnormality (DWI defect) early in stroke. The DWI–PWI mismatch is thought to represent the ischemic penumbra, a region that is potentially salvageable with aggressive reperfusion (either by thrombolytic therapy or by catheter-based mechanical interventions).96
PWI is performed with standard MRI and MRA using gadolinium and requires a total imaging time of less than 15 minutes. PWI can be performed in cases of contraindication to gadolinium (a rare event, as gadolinium has been found safe in most instances, though recent fatal nephrogenic systemic fibrosis has been noted in patients with advanced renal disease; see Chapter 1597), by magnetically labeling the blood as the blood enters the brain, a technique known as continuous arterial spin labeling.98 Patients with large perfusion defects96,99 detected by PWI or occluded arteries detected by MRA100 are at heightened risk for enlarging regions of frank infarction, leading some to suggest that these findings should prompt early revascularization, either with thrombolytic agents pharmacologically or with mechanical devices. The volume of abnormalities on DWI and PWI during acute stroke correlates with acute National Institutes of Health Stroke Scales and with chronic neurologic scores, and lesion size may predict early neurologic deterioration.101-102 Still another benefit of advanced techniques like DWI and PWI is, as is the case for CTPSs, the potential to identify areas of ischemia that have not yet progressed to infarction, potentially permitting extension of the traditional 3-hour window for thrombolytic administration.103,104 However, PWI and DWI have yet to prove practical and reliable in defining the ischemic penumbra and infarct core,105 and head-to-head trials comparing MRI diffusion–perfusion studies to CTPSs are limited.
Figure 1-42 shows images from a single patient in various modalities, including CT, CTA, MRI, and MRA.
Ultrasonography for Ischemic Stroke
Ultrasound techniques include Doppler (used to assess flow rate and presence of stenosis), brightness mode (permitting anatomic and structural details of the tissue to be illuminated), and duplex (a combination of the two). Carotid duplex ultrasound has traditionally been deployed electively (i.e., nonemergently) to investigate whether the origin of an acute ischemic event in a given patient could be due to carotid artery stenosis. Studies show conflicting results, with some showing poorer performance of ultrasound (65% sensitivity, 95% specificity) compared with MRA (82%-100% sensitivity, 95%-100% specificity) and the gold standard (by definition 100% sensitive and specific) of digital subtraction angiography.106,107 Transcranial ultrasound can be used to visualize the vessels in and near the circle of Willis. Here, it is possible to identify stenosis with reasonable success, though less well for the vertebral–basilar system. In the internal carotid artery distribution, the sensitivity and specificity for stenosis are 85% and 95%, respectively. Sensitivity and specificity are only 75% and 85%, respectively, in the vertebral–basilar system. Additional benefits of transcranial ultrasound reportedly include the ability to identify collateral pathways, visualize in real time harmful emboli and in the postthrombolysis state, judge the success of therapy.108-110 In addition, ultrasound is being used therapeutically in trials to augment the thrombolytic effect of medications.111
Studies have focused on the use of ultrasound to select patients for thrombolytic drug therapy or endovascular treatment. Ultrasound is inexpensive relative to other imaging modalities, noninvasive, and does not expose the patient to ionizing radiation, but the validity of the results is highly operator-dependent. In addition, it is impossible to differentiate reliably between complete and high-grade stenosis, and contralateral stenosis can result in falsely reassuring flow velocities ipsilaterally, resulting in a false-negative interpretation for stenosis.112-115
Conventional Catheter Angiography for Stroke
Still considered the gold standard for diagnosing arterial stenosis, conventional catheter angiography has been substantially improved with the advent of digital subtraction techniques permitting visualization of even small, cortical branches of intracranial arteries. Endovascular techniques permit administration of intra-arterial thrombolysis, and some users have the ability to perform clot retrieval and angioplasty with or without stenting.116 However, despite its utility when noninvasive diagnostic techniques are equivocal or conflicting, angiography is still used only sparingly in the acute stroke setting because of its invasive nature and the approximate 1% risk of iatrogenic stroke associated with the procedure.117
Stroke Neuroimaging Summary
The goals of neuroimaging in the ED patient presenting with signs and symptoms consistent with stroke include the exclusion of intraparenchymal hemorrhage, space-occupying lesions, and other stroke “mimics.” Ideally, the imaging technique would also highlight areas of ischemia, identify underlying causes of ischemia (i.e., vessel occlusion), and delineate those areas that are ischemic but salvageable. Currently, no single imaging modality can accomplish all of these goals quickly and at low cost, and no combination of studies is widely available in all centers.
When stroke is the suspected diagnosis, the patient must be imaged as quickly as possible with the most readily available neuroimaging modality to rule out hemorrhage and other stroke mimics. Typically, this is with noncontrast CT. In the absence of contraindication to the use of contrast, simultaneous CTA can evaluate for large vessel occlusion. Provided that it does not delay other indicated therapy, CTPS may be useful for prognosis and to guide therapeutic decisions, including the use of thrombolytic drug therapy. In specialized centers with the required expertise and resources, MR stroke protocols including MRI, MRA, DWI, and PWI may be feasible from the ED without the need for prior CT imaging.
Clinical Questions in Stroke Imaging
What Is the Risk of Progression to Stroke in Acute TIA? What Imaging Studies Are Indicated?
Large studies in multiple settings have demonstrated that patients diagnosed with TIA in the ED progress to stroke at a high rate of 10% in 3 months, with half of those strokes occurring within 48 hours.118,120 In addition, some evidence suggests that patients with TIA may be at higher risk for subsequent adverse clinical outcomes than patients with minor ischemic strokes—possibly because of a higher rate of large vessel atherosclerosis as the cause of TIA. In TIA, large artery atherosclerosis (including carotid artery disease) may account for up to 34% of cases. The 3-month risk for stroke, myocardial infarction, and vascular death is higher for TIA patients than for minor stroke patients (15% vs. 3%; hazard ratio = 4.6; 95% CI = 2.3-9.3 in multivariate analysis).121 The result has been a significant impetus to admit patients with TIA or to perform urgent diagnostic testing in the outpatient setting. A variety of neuroimaging strategies have been proposed to identify patients at high risk.
Is Noncontrast CT Valuable in Apparent TIA?
In patients presenting with apparent TIA, head CT might be expected to be normal, and the value of CT in the context of resolved neurologic symptoms could be questioned. Yet 4% of patients clinically diagnosed with TIA in the ED have evidence of new infarct on noncontrast head CT. Moreover, those patients have a fourfold increased 90-day risk of subsequent stroke.118 Thus, head CT may be warranted in TIA as a risk stratification tool. If MRI with or without MRA will be performed in the ED, CT is not necessary as MR can evaluate for hemorrhage, infarct, and other brain pathology.
Is MRI Useful in Apparent TIA?
MRI may be a useful alternative imaging modality when available for patients with apparent TIA. The age of ischemic lesions can be judged with DWI based on measurement of the apparent diffusion coefficient, which varies with time from onset of ischemia. Ischemic lesions of varying ages on DWI MRI predict a substantially higher risk of new lesions on 30-day follow-up MRI (relative risk = 3.6; 95% CI = 1.9-6.8), so MRI may be useful for risk stratification.122 Ischemic lesions of varying ages suggest an embolic source of TIA and future stroke. A negative diffusion weighted MRI within 24 hours of apparent TIA predicts a low risk of disabling ischemic stroke within 90 days in patients with moderate or high risk ABCD(2) scores (described later).122a
What Percentage of Patients with TIA or Stroke Have a Cardioembolic Source? Is Echocardiogram Indicated?
Studies show that 51% to 61% of patients with TIA or stroke in whom a clear cause had not yet been identified after initial workup had a cardiac abnormality potentially warranting anticoagulation identified on echocardiography. Transesophageal echocardiography was superior to transthoracic echocardiography, identifying an abnormality in 40% of those with a normal transthoracic echocardiography. An absolute indication for anticoagulation was identified by echocardiography in 20% of patients, and 80% of those were identified only on transesophageal echocardiography.123,124 Another study demonstrated that coexisting cardiac and carotid artery lesions are quite common in TIA and stroke patients, occurring in 11%, so imaging of both the heart and the cervical vessels is likely indicated.125
Does a Clinical Prediction Rule Exist to Identify High-Risk TIA Patients Who Require Further Imaging?
The ABCD score has been described to identify patients at low risk of progression to TIA. The rule incorporates age, blood pressure, unilateral weakness, speech disturbance, and duration to generate a score, which has been correlated with 7-day risk for stroke. A dichotomized version of the ABCD score, with patients scoring five or more points being at high risk, has been validated for the ED. Unfortunately, the small numbers in these studies result in wide CIs for the sensitivity of the score, with lower 95% CIs as low as 60%. Some studies have shown the ABCD score to have only limited value, as patients with relatively low risk scores (predicted to correlate with low risk for stroke) had adverse outcomes
Box 1-13 ABCD(2) Score for Predicting Progression from Transient Ischemic Attacks to Stroke∗
From Asimos AW, Johnson AM, Rosamond WD, et al. A multicenter evaluation of the ABCD2 score’s accuracy for predicting early ischemic stroke in admitted patients with transient ischemic attack. Ann Emerg Med 55:201-210 e5, 2010; Bray JE, Coughlan K, Bladin C. Can the ABCD score be dichotomised to identify high-risk patients with transient ischaemic attack in the emergency department? Emerg Med J 24:92-95, 2007; Cucchiara BL, Messe SR, Taylor RA, et al. Is the ABCD score useful for risk stratification of patients with acute transient ischemic attack? Stroke 37:1710-1714, 2006; Johnston SC, Rothwell PM, Nguyen-Huynh MN, et al. Validation and refinement of scores to predict very early stroke risk after transient ischaemic attack. Lancet 369:283-292, 2007; Rothwell PM, Giles MF, Flossmann E, et al. A simple score (ABCD) to identify individuals at high early risk of stroke after transient ischaemic attack. Lancet 366:29-36, 2005; Tsivgoulis G, Spengos K, Manta P, et al. Validation of the ABCD score in identifying individuals at high early risk of stroke after a transient ischemic attack: A hospital-based case series study. Stroke 37:2892-2897, 2006.
∗ In validation studies, ABCD(2) poorly predicts short-term stroke risk.
in external validation.126-129 A recent extended version of the ABCD score including diabetes as a risk factor, known as ABCD(2), attempts to predict 2-day risk for stroke but requires further validation (Box 1-13).130 A multicenter study demonstrated a low 7-day risk for progression from TIA to disabling stroke in patients with an ABCD(2) score of no more than three. However, risk for more minor stroke was poorly predicted, limiting applicability in the ED.131 Another prospective study suggested a 5-fold higher 90-day risk of stroke in patients with an ABCD(2) score >2.131a
What Is the Yield of CTA, Ultrasound, or MRA in TIA?
As stated earlier in the discussion of stroke, CTA has been shown to be 100% sensitive for high-grade carotid stenosis. MRA and carotid ultrasonography are alternative studies with similar sensitivity.132
Suspected Subarachnoid Hemorrhage
Traditional practice in the evaluation for suspected SAH has been lumbar puncture (LP) following negative CT, a practice still advocated by major textbooks of emergency medicine.133 The reported sensitivity of CT (third generation or higher) for SAH is in the range of 90% in the first 24 hours, declining afterward.134 A recent study of fifth-generation CT found no SAH in patients undergoing LP after negative CT.27 However, this retrospective review examined only 177 ED patients undergoing both CT and LP. Records and follow-up were not reviewed for patients who underwent CT but not LP, so it is possible that cases of SAH with negative head CT occurred but were not detected. In addition, the interval between headache onset and CT or LP was not recorded, so this study provides no information on any time dependency of CT sensitivity for SAH. Given an incidence of SAH of only around 3.4% compared with previously reported numbers in the range of 12% of ED acute, severe, nontraumatic headache patients, the true sensitivity of fifth-generation CT may be as low as 61%.26,27,135 A prospective study of patients presenting with the worst headache of their life reported a sensitivity of 97.5%, but again the small number of patients, 107, yielded a lower CI—as low as 91%.26 Another retrospective study found the sensitivity of noncontrast head CT for SAH to be 93% (95% CI = 88%-97%).136 Sensitivity of CT is thought to decline over time due to clearance of blood and is reported to be as low as 50% at 7 days.137 How good is the combination of CT with LP for ruling out the diagnosis of SAH? A prospective cohort study of 599 patients undergoing both LP and head CT for nontraumatic acute headache found the combination of head CT and LP to be 98% sensitive (95% CI = 91%-100%) for the diagnosis of SAH or aneurysm. The authors calculated a negative likelihood ratio of 0.024, indicating an extremely low posttest probability of SAH when both CT and LP are negative.138 Emergency medicine physicians are only moderately accurate at predicting SAH based on clinical history,139 so a conservative approach including LP after negative head CT is probably still warranted based on CT sensitivity. Even the authors of studies of CT sensitivity are reluctant to state that LP is not needed after negative CT.140 Future advances in CT may eliminate this need, although some have argued on theoretical grounds that CT sensitivity will never reach 100% for SAH.141
CT Angiography for Aneurysmal Subarachnoid Hemorrhage
When noncontrast head CT is negative in a patient suspected of SAH, is additional imaging warranted to assess for aneurysmal disease? Is there a role for CTA (see Figure 1-40)? The precise role is as yet undefined. A small study found aneurysms in 5.1% (6/116) of patients with a negative CT and positive LP and in 2.5% (3/116) following a normal CT and LP. Given the incidence of berry aneurysms in the general population, believed to be approximately 1% to 5%,142,144 it is possible that the aneurysms detected in these patients were incidental, not the acute cause of the patients’ symptoms. Wide use of CTA might result in detection of large numbers of asymptomatic aneurysms, resulting in unneeded procedures, including formal angiography and endovascular coiling of aneurysms, with associated morbidity and mortality. Perhaps the best role of CTA would be in patients in whom LP is not feasible—for example, those with coagulopathy. CTA might also be useful in patients with a particularly high pretest probability of disease but negative noncontrast CT and LP.145 Finally, CTA could be used to evaluate for aneurysm in patients with negative noncontrast CT and equivocal LP results, such as a declining but nonzero number of red blood cells.
How Is Cerebral Dural Sinus Thrombosis best Imaged?
Dural sinus thrombosis is a rare but important cause of headache. An observational study of 1676 consecutive Pakistani patients undergoing a CT or MRI study found dural sinus thrombosis in 3.3%, although the incidence in U.S. ED patients may be quite different.146 Risk factors include hypercoagulable states. Untreated, the condition leads to rising ICP due to failure of drainage of blood from dural sinuses into the internal jugular venous system. This in turn can lead to intracranial hemorrhage. Both CT venography and MR venography can be used to detect this condition. Only small studies dating from the 1990s have directly compared the two techniques, and without a strong gold standard, it is impossible to state the sensitivity of the techniques accurately.147,148 The technique for CT venography is the same as for CTA with one exception: in CTV, CT image acquisition is timed to coincide with the arrival of contrast in venous structures.149,152
Imaging of Vascular Dissections
Vascular dissections of the carotid and vertebral arteries are a relatively rare cause of acute headache and neurologic symptoms, occurring in an estimated 2.5 to 3 per 100,000 and 1 to 1.5 100,000 annually in the United States.153,154 They account for only about 2% of all ischemic strokes but as much as 20% of strokes in young adults.155 Noncontrast head CT is expected to be negative in the setting of these lesions unless ischemic stroke has resulted. In addition, dissection of the vertebral arteries would be expected to result in ischemia in the region of the basilar artery (which forms from the confluence of the vertebral arteries), and the territories supplied by the basilar artery lie within the posterior fossa, an area poorly seen on noncontrast CT. Multiple imaging techniques are available for this diagnosis. CTA, MRA, and conventional angiography all have excellent sensitivity and specificity, greater than 95%.156 Imaging of the head and neck should be ordered when these diagnoses are suspected to ensure that the lesion is within the imaged field (see Figures 1-38 and 1-39).
Imaging in Acute Hydrocephalus and Shunt Failure
Noncontrast head CT is the initial study of choice for diagnosis of acute obstructive hydrocephalus. As the ventricles enlarge, due to obstruction of the normal outflow of CSF, other CSF spaces become progressively effaced, because the total volume of all skull contents is fixed (Figures 1-34, 1-36, and 1-37). Large ventricles with small or completely effaced sulci and cisterns are consistent with hydrocephalus. In contrast, in cerebral atrophy all CSF spaces are enlarged, whereas in cerebral edema all spaces are effaced (see Figure 1-36). Occasionally, a mixed picture can occur, with both obstructing hydrocephalus and diffuse cerebral edema. A number of radiographic criteria for hydrocephalus have been described (see Box 1-9).
How Common Is Ventricular Shunt Obstruction Among Children Presenting With Suspected Obstruction Undergoing CT? How Sensitive and Specific Are Computed Tomography and Shunt Series for Shunt Obstruction?
Among children presenting with suspected shunt malfunction, up to 25% may require surgical intervention. The sensitivity of noncontrast head CT is reported to be 83%, with a specificity of 76%. Traditionally, a shunt series (a series of plain x-rays without contrast following the course of the shunt from head to destination, usually peritoneum) is also performed. Shunt series have low sensitivity (20%) but high specificity (98%). Studies do not suggest high utility of this test in patients with normal noncontrast head CT, but occasionally the shunt series may be positive in these patients (see Figure 1-37). In one series, 3 of 233 patients undergoing imaging had normal head CT but abnormal shunt series and documented shunt obstruction.58,157
When head CT and standard shunt series are normal but shunt malfunction continues to be suspected, MRI can be used to assess flow within the shunt. The technique is felt to be highly sensitive but not perfectly specific. Some patients may have intermittent flow through a functioning shunt, and if MRI is performed during a period of normal physiologic low flow, the MRI may falsely suggest the shunt to be occluded. However, demonstration of flow by MRI confirms shunt patency.158,159
Central Nervous System Infections
When central nervous system infection is suspected, imaging may be indicated for diagnosis. Imaging serves several roles in this setting: it evaluates for other diagnoses, including hemorrhage or masses; it identifies focal infectious processes, such as abscess or toxoplasmosis; and it identifies possible contraindications to LP, such as the presence of elevated ICP.
Assessment of Intracranial Pressure Before Lumbar Puncture: Does CT predict elevated ICP before LP?
Some studies have shown size of ventricles on CT to be only weakly predictive of ICP.58 Oliver et al. have argued that the evidence that imaging accurately predicts elevated ICP is scant, that some degree of ICP elevation in meningitis is probably ubiquitous, and that examination findings suggesting high ICP, such as stupor, coma, or focal neurologic deficits, are more reliable than CT in identifying patients at risk of herniation.160 Nonetheless, CT is frequently performed before LP for suspected meningitis, with the goal of ruling out alternative diagnoses and identifying contraindications to LP. A prospective study in 2001 demonstrated an association among age, recent seizure, abnormal neurologic examination findings, and immunocompromise and CT abnormalities before LP, although the majority of the CT abnormalities were felt to be unlikely to contraindicate LP (Table 1-6).161 Because elevations of ICP may be present that are not detected on head CT, LP should be carefully considered in patients with abnormal mental status or neurologic examinations, even if CT appears normal. Conversely, significant midline shift or findings suggesting herniation on CT may rarely be present in patients with normal neurologic examinations. Following head trauma, 1.9% of patients with CT-diagnosed frank herniation and 4.4% of patients with significant brain shift but no herniation had no neurologic deficit in National Emergency X-radiography Utilization Study (NEXUS) II.162
TABLE 1-6 Predictors of Head CT Abnormalities Potentially Contraindicating Lumbar Puncture in Patients With Suspected Meningitis
| Baseline Patient Characteristic | Risk Ratio (95% CI) |
|---|---|
| Age ≥60 years | 4.3 (2.9-6.4) |
| Immunocompromised state∗ | 1.8 (1.1-2.8) |
| History of central nervous system disease† | 4.8 (3.3-6.9) |
| Seizure within 1 week before presentation | 3.2 (2.1-5.0) |
| Neurologic Findings | |
| Abnormal level of consciousness | 3.3 (2.2-4.4) |
| Inability to answer two questions correctly | 3.8 (2.5-5.8) |
| Inability to follow two commands correctly | 3.9 (2.6-5.9) |
| Gaze palsy | 3.2 (1.9-5.4) |
| Abnormal visual fields | 4.0 (2.7-5.9) |
| Facial palsy | 4.9 (3.8-6.3) |
| Arm drift | 4.0 (2.7-5.8) |
| Leg drift | 4.4 (3.0-6.5) |
| Abnormal language‡ | 4.3 (2.9-6.5) |
∗ Human immunodeficiency virus or AIDS, immunosuppressive therapy, or transplant.
† Mass lesion, stroke, or focal infection.
‡ Aphasia, dysarthria, or extinction.
From Hasbun R, Abrahams J, Jekel J, Quagliarello VJ: Computed tomography of the head before lumbar puncture in adults with suspected meningitis. N Engl J Med 345:1727-1733, 2001.
Imaging in Patients With Seizures
Imaging of patients with new-onset seizure who have returned to a normal neurologic baseline is a level B recommendation in the 2004 ACEP clinical policy on seizures (Box 1-14).163 Level B recommendations generally reflect evidence with moderate certainty based on class II studies (e.g., nonrandomized trials, retrospective or observational studies, and case-control studies) directly addressing a clinical question or reflect broad consensus among experts based on class III studies (e.g., case reports and case series). What is the basis of the ACEP recommendation? Studies on patients with new-onset seizure show a wide range of abnormal head CT results, from 3% to as high as 41%, often unsuspected on the basis of history or examination.164,166 It is not clear whether there is a causal relationship between some of the CT abnormalities found in these studies and acute seizure or whether any beneficial change in management resulted from CT imaging. A systematic review
Box 1-14 Indications for Imaging in Adult Patients With New-Onset Seizure
From ACEP Clinical Policies Committee, Clinical Policies Subcommittee on Seizures: Clinical policy: Critical issues in the evaluation and management of adult patients presenting to the emergency department with seizures. Ann Emerg Med 43:605-625, 2004.
Urgent neuroimaging is recommended for all adult patients, even with return to baseline neurologic status. Imaging should be performed in the emergency department for patients with:
found that among all adult ED patients with new-onset seizure, 17.7% had an abnormal head CT—26.6% of those undergoing head CT. Among patients with acquired immunodeficiency syndrome (AIDS) and new-onset seizure, the risk appears higher still (20%-30%), with frequent CT diagnoses including cerebral toxoplasmosis, progressive multifocal leukoencephalopathy, and central nervous system lymphoma.167 Whether seizure is new onset or recurrent, emergent CT scanning is recommended for patients with any of the risk factors in Box 1-14.168 Noncontrast CT is the initial imaging method, as the majority of life-threatening lesions (hemorrhage, edema, mass effect, and hydrocephalus) would be expected to be found with this modality. Enhanced CT or MRI may be indicated if unenhanced CT is normal and suspicion remains of a structural lesion.
Febrile and Typical Recurrent Seizures
Neither emergent nor urgent imaging is recommended for patients with a typical simple febrile seizure (Box 1-15) or recurrent seizures with typical features compared with the patient’s prior seizure history.168 Do complex febrile seizures require emergency imaging? A recent study found that although 16% of children presenting with new-onset complex febrile seizure had abnormal CT or MR findings, none required emergent intervention (0%; 95% CI = 0%–4%).169
Do partial seizures suggest a focal structural brain abnormality and thus mandate imaging? A study from South Africa in a region with a high incidence of tuberculosis and neurocysticercosis suggests that the answer is no. This prospective cohort study of 118 children with new-onset partial seizure found abnormal CT scans in only 8 (7%), all of whom were suspected prospectively of having the CT diagnosis. The investigators concluded that routine scanning would require 11 scans and 5 courses of antihelmintic therapy to prevent one case of childhood seizure disorder, versus no scans and 11 courses of drug therapy if all seizure patients were empirically treated.170 Of course, this study is from a population quite different from the U.S. population, and its results must be viewed in this context.
Head and Brain Imaging in Syncope
Head CT is commonly obtained as part of the evaluation of a patient with syncope, despite little evidence supporting its use. Syncope is a brief, nontraumatic loss of consciousness with loss of postural tone. Syncope is due to global cerebral hypoperfusion, but the brain is generally the “victim” of syncope, not the cause. Syncope is rarely due to stroke, as loss of consciousness requires loss of blood flow to both cerebral hemispheres or to the medullary reticular activating system in the brainstem. Studies of the diagnostic yield of head CT performed for syncope show little pathology clearly related to the syncope episode.171 In one retrospective study, 34%
Box 1-15 Simple Versus Complex Febrile Seizure
From Greenberg MK, Barsan WG, Starkman S: Neuroimaging in the emergency patient presenting with seizure. Neurology 47:26-32, 1996.
of patients presenting to a community ED underwent head CT, with only 1 patient (0.7%) having the etiology identified by imaging (posterior circulation infarct).172 A second retrospective study found that 283 of 649 (44%) patients admitted with syncope at two community teaching hospitals from 1994 to 1998 underwent head CT, with 5 (2%) revealing an apparent causal diagnosis: 10 patients underwent MRI without a diagnosis of a cause of syncope. Utilization of head CT fell from 61% to 33% of syncope patients from 1994 to 1998, but diagnostic yield remained extremely low, under 1% for both groups.173 A prospective observational study found a 39% rate of head CT in ED syncope patients at Harvard University’s Beth Israel Deaconess Medical Center, with only 5% having head CT abnormalities. That research group proposes that a decision rule for head CT in syncope might reduce utilization by 25% to 50%, although such a rule has not been prospectively validated (Box 1-16).174 Head CT may be warranted when the history and exam do not fully exclude other diagnoses, such as seizure or stroke, or when trauma results from a syncope episode.175 A 2007 ACEP Clinical Policy found that there is no evidence for routine screening of syncope patients with advanced imaging including CT. That policy gives a Level C recommendation for cranial CT only when indicated by specific findings in the history or physical examination.175a
Posterior Reversible Encephalopathy Syndrome (PRES)
Posterior Reversible Encephalopathy Syndrome (PRES) is a state of vasogenic brain edema seen in severe hypertension, eclampsia, lupus, and cyclosporine toxicity, among many other conditions. The mechanism remains
Box 1-16 Proposed Decision Rule for Computed Tomography Head in Syncope∗
From Grossman SA, Fischer C, Bar JL, et al: The yield of head CT in syncope: A pilot study. Intern Emerg Med 2:46-49, 2007.
∗ Not yet validated.
in debate, and studies of imaging findings are limited by the lack of a strong diagnostic reference standard. CT and MR can demonstrate focal regions of symmetric hemispheric edema. The most commonly involved regions are the parietal and occipital lobes, followed by the frontal lobes, inferior temporal-occipital junction, and cerebellum. Vascular watershed areas of the brain appear most affected. The basal ganglia, brain stem, and deep white matter (external/internal capsule) can also be involved. Complications such as hydrocephalus and hemorrhage can occur. On MRI, restricted diffusion representing infarction is seen in 11% to 26% of cases. The clinical importance of imaging for the specific diagnosis and management of PRES is not well established, though imaging to rule out hemorrhage, mass or mass effect, hydrocephalus, and ischemic stroke is indicated.175b
Imaging of Traumatic Brain Injury
For evaluation of traumatic brain injury, noncontrast CT remains the primary imaging modality. Brain injuries can include traumatic SAH, SDH, EDH, intraparenchymal hemorrhage, DAI, and traumatic cerebral edema. Concurrent injuries may include bony injuries such as skull fracture. More rarely, head and neck trauma may result in vascular dissection of the intracranial or extracranial arteries (carotid or vertebral), with potential catastrophic neurologic outcomes such as ischemic stroke.
Epidemiology of Traumatic Brain Injury
The incidence of an acute intracranial injury seen on CT following a “mild” traumatic brain injury (GCS score = 13–15) is approximately 6% to 9%, but not all detected injuries result in a clinically meaningful change in management.63,176 Of patients in the derivation phase of the Canadian CT Head Rule (CCHR), 8% had potentially important CT head findings, yet only 1% underwent a neurosurgical intervention.63 NEXUS II enrolled 13,728 patients at 21 medical centers in the United States, including all ED patients undergoing head CT after
Box 1-17 National Emergency X-radiography Utilization Study II: Intracranial Injuries Considered Significant
From Mower WR, Hoffman JR, Herbert M, et al: Developing a decision instrument to guide computed tomographic imaging of blunt head injury patients. J Trauma 59:954-959, 2005.
blunt head trauma, regardless of GCS score or neurologic examination. Of these, 6.7% to 8.7% had clinically significant traumatic blunt head injury (prospectively defined) (Box 1-17).177,178 For purposes of NEXUS II, a clinically significant traumatic brain injury was defined based on prior research as an injury that may require neurosurgical intervention (such as craniotomy, invasive ICP monitoring, or mechanical ventilation) or an injury with potential for rapid deterioration or long-term neurologic dysfunction.179 Based on NEXUS II, an average emergency physician evaluating patients with a range of GCS scores and neurologic examination findings might expect to find a potentially important head CT abnormality in between 1 in 20 and 1 in 10 patients in whom CT head was ordered after blunt trauma.177-178 Stiell and collaborators in Canada showed a 6% incidence of head injuries in ED patients undergoing CT following blunt head injury, although they also demonstrated great heterogeneity in the ordering practices of ED physicians, from 6.5% to 80% of patients with head trauma undergoing CT, depending on treating physician.180 As described later, a variety of decision rules have been investigated to reduce unnecessary imaging in patients with a very low risk for intracranial injury.
Skull Films for Blunt Head Trauma
The 2008 ACEP clinical policy on altered mental status and mild blunt head trauma found that “plain films of the skull have essentially no utility” in the emergency evaluation of patients with altered mental status.181 Surprisingly, they are still widely used in international emergency practice. In the United Kingdom, skull radiographs are obtained in about 20% of blunt head injury patients, a decrease from nearly 50% in the past.182 Some investigators have argued that this diagnostic test may play a limited role when CT is not available.183-184
Clinical Decision Rules for Blunt Head Trauma
Clinical decision rules have been derived by several groups in the United States, Canada, the United Kingdom, and Scandinavia with moderate success. These rules differ in their definitions of clinically significant injuries, the neurologic inclusion criteria (GCS score, loss of consciousness, and neurologic examination), and the time from injury to imaging. Table 1-7 compares three rules, while Boxes 1-19 through 1-23 and Table 1-8 list the specific inclusion and exclusion criteria and specified outcomes of interest. In general, the New Orleans Criteria (NOC) (Box 1-18) seek to identify any acute intracranial injury, while NEXUS II and the CCHR seek to identify injuries most likely to require neurosurgical intervention or to result in serious neurologic deficits. It is a matter of debate as to which definition is most appropriate. For example, is it important to know of the existence of a traumatic brain injury that does not require neurosurgical intervention to follow cognitive function long-term? Moreover, some clinical interventions may not have truly been “needed” but rather may have been driven by the judgment of individual physicians once they became aware of imaging findings.
TABLE 1-7 Outcomes and Test Characteristics of Three Clinical Decision Rules for Computed Tomography Use Following Minor Blunt Head Injury in Adults∗
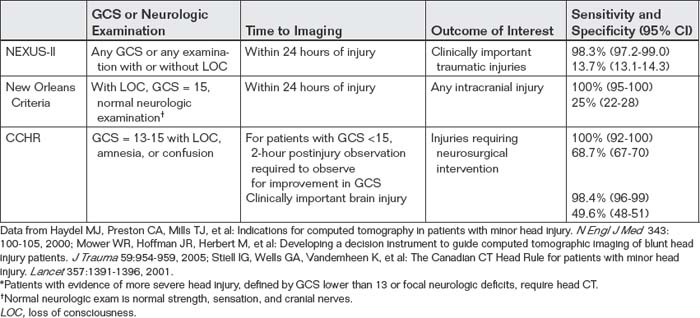
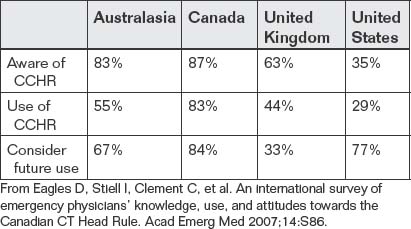
New Orleans Criteria
The New Orleans Criteria investigators sought a rule with 100% sensitivity, citing prior surveys of emergency physicians indicating that a clinical decision rule with anything less than perfect
Box 1-18 New Orleans Criteria: “Positive” Computed Tomography Findings
From Haydel MJ, Preston CA, Mills TJ, et al: Indications for computed tomography in patients with minor head injury. N Engl J Med 343:100-105, 2000.
sensitivity would be unacceptable. Their rule achieved this goal of sensitivity (100%; 95% CI = 95%-100%) but has a low specificity (25%; 95% CI = 22%-28%).176 This rule (see Box 1-20) has been challenged for its lack of specificity, which might lead to increased utilization of head CT for patients with no other indication for imaging beyond headache, vomiting, or minor head and neck trauma such as facial abrasions.
Canadian Computed Tomography Head Rule
The CCHR was 100% sensitive (95% CI 92%-100%) and 68.7% specific (95% CI 67%-70%) for patients with blunt trauma and a GCS score of 13-15 in its original study; subsequent studies have found slightly lower values.63,185-189 This rule (see Box 1-21) has been criticized for its relative complexity, as well as for end points (see Box 1-19) that
Box 1-19 Canadian Head CT Rule: Outcomes
From Stiell IG, Wells GA, Vandemheen K, et al: The Canadian CT Head Rule for patients with minor head injury. Lancet 357:1391-1396, 2001.

might be considered unacceptable in some medical practice settings, including the United States, where fears of litigation might make any CT abnormality undesirable to be missed. Nonetheless, in multiple validation studies and subanalyses, the rule appears to perform well in identifying patients who present with normal mental status but require emergent neurosurgical intervention, including in U.S. populations.190 Remarkably, despite numerous studies in multiple settings, emergency physician awareness of the rule remains low. A recent study found that only 35% of U.S. emergency physicians were aware of the rule (see Table 1-8).191
National Emergency X-radiography Utilization Study II
The NEXUS II investigators identified a decision rule with high sensitivity (98.3%; 95% CI = 97.2%–99.0%) but low specificity (13.7%; 95% CI = 13.1%–14.3%) for significant intracranial injury.177 This rule (see Box 1-22) has limited clinical utility because it would mandate brain CT in the majority of patients following blunt trauma and thus might actually increase CT use when compared with current physician practice. Its clinical outcome benefit is uncertain—no study to date has demonstrated whether application of the NEXUS
From Haydel MJ, Preston CA, Mills TJ, et al: Indications for computed tomography in patients with minor head injury. N Engl J Med 343:100-105, 2000.
Head C is required for blunt trauma patients with loss of consciousness, GCS score of 15, a normal neurologic exam,∗ and any of the following:
∗ Normal cranial nerves and normal strength and sensation in the arms and legs, as determined by a physician on the patient’s arrival at the ED.
Box 1-21 Canadian CT Head Rule∗
From Stiell IG, Wells GA, Vandemheen K, et al: The Canadian CT Head Rule for patients with minor head injury. Lancet 357:1391-1396, 2001.
For patients with a GCS score of 13-15 after witnessed traumatic loss of consciousness, definite post-traumatic amnesia, or witnessed post-traumatic disorientation, CT is only required for patients with any one of the following findings:
∗ Exclusion criteria: no history of trauma, GCS <13, age <16 years, warfarin use or coagulopathy, obvious open skull fracture.
‡ A pedestrian struck by a motor vehicle, an occupant ejected from a motor vehicle, or a fall from ≥3-foot elevation or five stairs.
† Including hemotympanum, raccoon eyes, cerebrospinal fluid, otorrhea or rhinorrhea, and Battle’s sign.
II rule instead of current clinical practice would identify important injuries that would otherwise have been missed. Another difficulty with this proposed rule is the potential variability in application of terms such as scalp hematoma or abnormal behavior by different observers. In addition, coagulopathy, found to be a high-risk factor,
Box 1-22 National Emergency X-radiography Utilization Study II: Variables Associated With Significant Head Injury
From Mower WR, Hoffman JR, Herbert M, et al: Developing a decision instrument to guide computed tomographic imaging of blunt head injury patients. J Trauma 59:954-959, 2005.
Box 1-23 Prediction Rule for Head Injury in Children Under 2 Years of Age
From Kuppermann N, Holmes JF, Dayan PS, et al: Identification of children at very low risk of clinically-important brain injuries after head trauma: A prospective cohort study. Lancet 374:1160-1170, 2009. Severe mechanism of injury: motor vehicle crash with patient ejection, death of another passenger, or rollover; pedestrian or bicyclist without helmet struck by a motorized vehicle; falls of more than 1.5 m [5 feet]; or head struck by a high-impact object.
included aspirin use, potentially increasing the need for head imaging among patients who do not otherwise appear at risk for brain injury. One important finding of NEXUS II is a lack of association among several clinical variables that have traditionally been considered as potential markers of significant clinical injury, including loss of consciousness, seizure, severe headache, and vomiting.
External Validity of Decision Rules for Blunt Head Trauma
The CCHR and the New Orleans Criteria have been prospectively tested in other populations with less success; in Australia, the rules fail to exclude injury while reducing use.192 In Britain, the CCHR would increase CT use and associated costs.193,194 In German populations, the rules appear to reduce utilization.195 A prospective Dutch study validated the high sensitivity of both rules but found that the New Orleans Criteria would decrease use by only 3% and the CCHR by 37.3%.186 These reductions in use are smaller than the estimates from the original New Orleans Criteria publication (20%)176 and CCHR (50% to 70%).63 These findings reflect the existing practices in other countries; when baseline CT use for blunt head injury is low, the NEXUS, Canadian, and New Orleans rules may result in smaller decreases in use or could actually increase use.
Is One Rule “Best”?
A retrospective study of 7955 patients with traumatic head injury published in 2009 compared the three rules we’ve discussed in detail, plus the guidelines of the Neurotraumatology Committee of the World Federation of Neurosurgical Societies, the National Institute of Clinical Excellence (UK), and the Scandinavian Neurotrauma Committee. No statistical difference was found when comparing the sensitivity of the rules for detection of intracranial hematoma requiring surgical treatment. Current ACEP (2008) guidelines continue to endorse the New Orleans Criteria with a level A recommendation and the CCHR with a level B recommendation.196
Can We “Mix and Match” the Rules?
It may be tempting to adopt a combination of features of the preceding decision rules to manufacture a superior decision rule. Unfortunately, there is little evidence to support this practice. The NEXUS investigators and the New Orleans investigators tested a variety of other combinations of clinical criteria besides the final suggested rules. 176,177 Eliminating criteria not surprisingly improved specificity but impaired sensitivity, and adding additional criteria improved sensitivity but impaired specificity. A rule with large numbers of criteria fails the original purpose of developing a clinical decision rule; it detects all injuries by mandating CT for all blunt head trauma patients.
Some Commonalities Among the Rules
An important take-home point for all of the decision rules described earlier is the notable absence of loss of consciousness alone as an indication for head CT. In the CCHR and New Orleans Criteria studies loss of consciousness was a required inclusion criterion, but in none of the studies did isolated loss of consciousness identify patients at risk for significant injury. NEXUS II included patients with or without loss of consciousness in the study population, and did not find that loss of consciousness required head CT in the absence of the other rule critera. Prior studies had shown little association between loss of consciousness and significant traumatic brain injury.197 Neither NEXUS II nor the CCHR found posttraumatic headache to be an indication for head CT. The New Orleans Criteria did identify headache as a high-risk criterion, though a decision rule omitting headache would have had 97% sensitivity in the derivation phase.176 Because the New Orleans investigators desired 100% sensitivity, they did not further validate such a rule. Single posttraumatic seizure also does not appear to be a high-risk feature by the CCHR or NEXUS II, though again, it is considered high risk by NOC.
Table 1-9 summarizes the rules for ease of comparison and application.
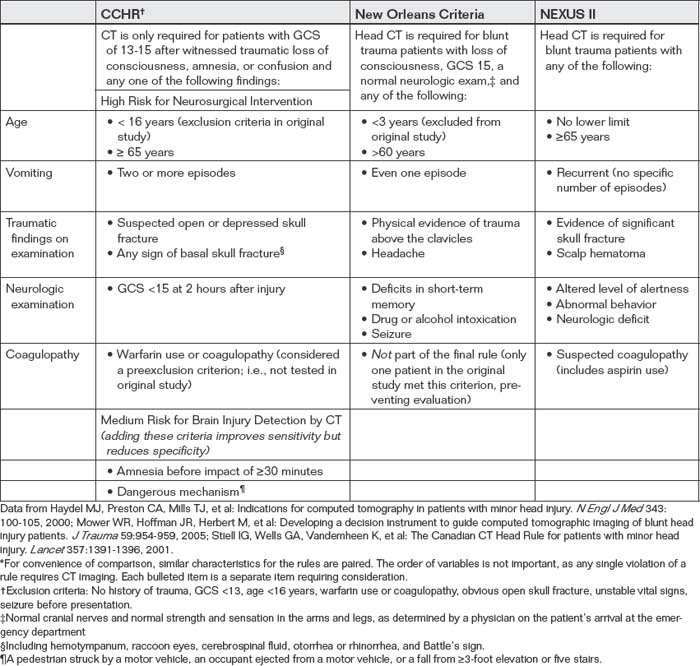
Decision Rules for Children
Clinical decision rules for children following blunt head injury remain controversial.198 Predictors of intracranial injury such as scalp hematoma lack specificity, resulting in large numbers of head CT performed to detect an injury. For example, only about 1% of patients under the age of 2 years with scalp hematoma have traumatic brain injury, although large hematomas, nonfrontal location, and accompanying skull fracture increase the risk.198 In general, acceptably high sensitivity in these studies comes at the price of extremely low specificity, resulting in little reduction in the utilization of CT in pediatric populations. In some settings, application of these rules could actually increase utilization. These rules may also be very sensitive to the care with which they are applied; the NEXUS II rule, for example, falls in sensitivity from approximately 99% to only 90% when the word headache is replaced with severe headache, so emergency physicians must scrupulously apply the rules if they expect the rules to function as described in the original studies.199-203
Palchak et al.200 prospectively derived a clinical decision rule for pediatric patients using a cohort of 2043 patients at a single center. They excluded patients with trivial trauma such as falls from standing. They identified five predictors, any of which would mandate CT: abnormal mental status, clinical signs of skull fracture (including retroauricular ecchymosis, CSF otorrhea or rhinorrhea, and palpable fracture), history of any vomiting, scalp hematoma (in children ≤2 years of age), or headache. The sensitivity of the rule was 99% (95% CI = 94%-100%) for traumatic brain injury and 100% (95% CI = 97%-100%) for detection of injury requiring acute intervention. This rule would have eliminated 24% of the CT scans performed at the study institution, but the CIs for the result remain wider than would be accepted by some clinicians and parents.
In the largest study of pediatric blunt head injury to date, Kuppermann et al.204 conducted a prospective study of 42,412 children ages 18 years and younger to derive and validate a clinical decision rule identifying children with extremely low risk for clinically important traumatic head injuries after blunt trauma.204 Of these, 14,969 (35.3%) underwent head CT, with clinically important head injuries occurring in 376 (0.9%), and neurosurgery occurring in 60 (0.1%). The investigators identified two rules: one for children younger than 2 years and a second for children 2 years and older. For children under 2 years of age, the rule had a negative predictive value of 100% (95% CI = 99.7%-100%) and sensitivity of 100% (95% CI = 86.3%–100%). In children 2 years and older, the negative predictive value was 99.95% (95% CI = 99.81%-99.99%) and sensitivity was 96.8% (95% CI = 89.0%-99.6%). The rules would have eliminated the need for imaging in 24.1% of children younger than 2 years and 20.1% of older children, without missing any children requiring neurosurgery. Thus children meeting all low-risk criteria do not require a head CT. Conversely, children who do not meet all of the low-risk criteria do not necessarily require an immediate head CT; the rules had positive predictive values of less than 2.5% for clinical important traumatic brain injury. This underscores a major limitation of clinical decision rules: high sensitivity inevitably comes at the price of poor specificity and potential for overuse. While the Kuppermann rules identify children with very low risk of important brain injury, they are not intended to identify children at high risk. The authors consequently recommend CT or clinical observation in those patients not meeting all low-risk criteria.
In the youngest patients, preverbal children 0 to 3 years of age, clinical assessment is particularly difficult. A very low threshold for CT must be applied after any head trauma, especially considering the possibility of nonaccidental trauma.
Decision Rules for Elderly
The elderly have a high rate of injury with few clinical predictors.205 NEXUS II found that the rate of clinically significant injury in those 65 years of age or older was 12.6%, compared with 7.8% in those younger than 65 years.178 The CCHR classifies patients older than 65 years as high risk and therefore in need of imaging in the case of traumatic loss of consciousness.
Is a Repeated Head CT Required for Patients With Abnormal Head CT After Blunt Trauma?
A range of reported progression in CT findings has been published, with few clear-cut indications for safely omitting repeat scan. A systematic review from 2006 found that the range of reported progression of injury on repeat head CT varied from 8% to 67%, with resulting neurosurgical intervention in 0% to 54% of patients.206 The review’s authors cite a variety of explanations for this dramatic variability in study outcomes, including selection bias, spectrum bias (studies with more severely injured patients being more likely to show unfavorable outcomes), and poor definitions of injury progression. Risk factors including coagulopathy, poor GCS score, and high overall injury severity appear to be associated with worsening CT abnormalities, but methodologic flaws in the studies reviewed make more specific recommendations impossible. Since the
Box 1-24 Prediction Rule for Head Injury in Children 2 Years and Older
From Kuppermann N, Holmes JF, Dayan PS, et al. Identification of children at very low risk of clinically-important brain injuries after head trauma: A prospective cohort study. Lancet 374:1160-1170, 2009. Severe mechanism of injury: motor vehicle crash with patient ejection, death of another passenger, or rollover; pedestrian or bicyclist without helmet struck by a motorized vehicle; falls of more than 1.5 m [5 feet]; or head struck by a high-impact object.
publication of that review, a prospective study of level I trauma center patients with an abnormal head CT has addressed some of the issues raised by that review. The study stratified patients according to GCS (mild: GCS = 13-15; moderate: GCS = 9-12; and severe: GCS <9) and indication for repeat CT (routine vs. indicated by neurologic deterioration). Among patients undergoing CT for neurologic deterioration, a medical or surgical intervention followed CT in 38%. In contrast, among patients undergoing routine repeat CT, 1% underwent an intervention—in both cases, in patients with a GCS score below 9. The authors conclude that repeat CT is warranted in any patient with neurologic deterioration and routine repeat CT may be warranted among patients with a GCS score below 9. No interventions occurred in patient with a GCS score of 9 or higher undergoing routine head CT, but this study is too small to conclude with certainty that routine repeat CT is never necessary in this group.207 Other recent retrospective studies also suggest that routine repeat head CT is not likely to change clinical management in the absence of a deteriorating neurologic examination, but a larger prospective study will be needed to more stringently define those patients with abnormal CT after blunt trauma in whom repeat CT can be deferred.208
What Is the Best Imaging Modality for DAI?
As the name implies, DAI is damage to white matter tracts throughout the brain, thought to occur as the result of shearing from rapid deceleration, often with a rotational component.209 There is some debate as to the clinical scenarios in which this injury occurs, with some arguing that DAI is a feature only of severe injury while others suggesting it as a mechanism underlying postconcussive syndromes in patients with normal CT.210 Studies in patients with mild head injury are problematic, as it is unclear whether MR abnormalities are truly evidence of CT-negative DAI or, rather, false-positive MR findings. CT is generally thought to be poor in detecting these changes, though a gold standard for comparison is often lacking or limited to comparison with MRI. A prospective study in 1988 compared CT and MR for identification of blunt traumatic head injuries, but advances in both modalities have rendered its results invalid. A 1994 study found the modalities to be complementary for head trauma, with MR substantially more sensitive for DAI.211 Subsequent studies have often compared new MR image sequences such as fluid attenuated inversion recovery and DWI to other MR sequences, using as a gold standard a clinical definition of DAI (loss of consciousness persisting more than 6 hours after injury, no hemorrhage on CT) plus imaging criteria (presence of white matter injury on MRI). This type of study, in which the gold standard or reference used to determine the accuracy of the experimental test incorporates that test, suffers from incorporation bias.212 The sensitivity of MRI may be overestimated as a result.
Summary
Emergency imaging of the brain is required for a number of presenting chief complaints. Clinical decision rules can guide imaging in some instances, particularly trauma. Noncontrast CT is the most widely used modality, but some processes, such as ischemic stroke, vascular dissection, and SAH, cannot be ruled out by noncontrast CT alone. Emergency physicians should understand when more diagnostic testing is required after a normal CT. A systematic approach to CT interpretation can improve the accuracy of interpretation by emergency physicians.
1. . Nobel Prize in Physiology or Medicine 1979. Nobel Foundation (Accessed at http://nobelprize.org/nobel_prizes/medicine/laureates.)
2. Raju T.N. The Nobel chronicles. 1979: Allan MacLeod Cormack (b 1924); and Sir Godfrey Newbold Hounsfield (b 1919). Lancet. 1999;354:1653.
3. Ratnapalan S., Bentur Y., Koren G. “Doctor, will that x-ray harm my unborn child?”. CMAJ. Dec 2 2008;179(12):1293-1296.
4. rtIMAGE. http://www.rt-image.com/datasheets.cfm?homechartID=128.
4a. Rumboldt Z., Huda W., All JW. Review of portable CT with assessment of a dedicated head CT scanner. AJNR Am J Neuroradiol. 2009;30(9):1630-1636.
5. Broder J: Midnight radiology: Head CT interpretation. (Accessed at http://emedhome.com/.)
6. Broder J., Fordham L.A., Warshauer D.M. Increasing utilization of computed tomography in the pediatric emergency department, 2000-2006. Emerg Radiol. 14(4):227-232, 2007.
6a. American College of Radiology: ACR–ASNR practice guideline for the performance of computed tomography (CT) of the brain. Available at: http://www.acr.org/SecondaryMainMenuCategories/quality_safety/guidelines/dx/head-neck/ct_brain.aspx. Accessed 3-18-2011., 2011.
7. . Nobel Prize in Physiology or Medicine 2003. (Accessed at http://nobelprize.org/nobel_prizes/medicine/laureates/2003/press.html.)
8. De Wilde J.P., Rivers A.W., Price D.L. A review of the current use of magnetic resonance imaging in pregnancy and safety implications for the fetus. Prog Biophys Mol Biol. 2005;87:335-353.
9. Shellock F.G., Crues J.V. MR procedures: Biologic effects, safety, and patient care. Radiology. 2004;232:635-652.
10. Loewy J., Loewy A., Kendall E.J. Reconsideration of pacemakers and MR imaging. Radiographics. 2004;24:1257-1267.
11. Tope W.D., Shellock F.G. Magnetic resonance imaging and permanent cosmetics (tattoos): Survey of complications and adverse events. J Magn Reson Imaging. 2002;15:180-184.
12. Ratnapalan S., Greenberg M., Armstrong D. Tattoos and MRI. Am J Roentgenol. 2004;183:541.
13. Franiel T., Schmidt S., Klingebiel R. First-degree burns on MRI due to nonferrous tattoos. Am J Roentgenol. 2006;187:W556.
14. Kalyanpur A., Weinberg J., Neklesa V., et al. Emergency radiology coverage: Technical and clinical feasibility of an international teleradiology model. Emerg Radiol. 2003;10:115-118.
15. Alfaro D., Levitt M.A., English D.K., et al. Accuracy of interpretation of cranial computed tomography scans in an emergency medicine residency program. Ann Emerg Med. 1995;25:169-174.
16. Perron A.D., Huff J.S., Ullrich C.G., et al. A multicenter study to improve emergency medicine residents’ recognition of intracranial emergencies on computed tomography. Ann Emerg Med. 1998;32:554-562.
17. Schriger D.L., Kalafut M., Starkman S., et al. Cranial computed tomography interpretation in acute stroke: Physician accuracy in determining eligibility for thrombolytic therapy. JAMA. 1998;279:1293-1297.
18. Kalafut M.A., Schriger D.L., Saver J.L., Starkman S. Detection of early CT signs of >1/3 middle cerebral artery infarctions: Interrater reliability and sensitivity of CT interpretation by physicians involved in acute stroke care. Stroke. 2000;31:1667-1671.
19. Sucu H.K., Gelal F., Gokmen M., et al. Can midline brain shift be used as a prognostic factor to predict postoperative restoration of consciousness in patients with chronic subdural hematoma? Surg Neurol. 2006;66:178-182. discussion 82
20. Englander J., Cifu D.X., Wright J.M., Black K. The association of early computed tomography scan findings and ambulation, self-care, and supervision needs at rehabilitation discharge and at 1 year after traumatic brain injury. Arch Phys Med Rehabil. 2003;84:214-220.
21. Eisenberg H.M., Gary H.E.Jr., Aldrich E.F., et al. Initial CT findings in 753 patients with severe head injury. A report from the NIH Traumatic Coma Data Bank. J Neurosurg. 1990;73:688-698.
22. Philips. Computed Tomography. (Accessed at http://www.medical.philips.com/us/products/ct/.)
23. Lee K.S., Bae W.K., Bae H.G., et al. The computed tomographic attenuation and the age of subdural hematomas. J Korean Med Sci. 1997;12:353-359.
24. Chakeres D.W., Bryan R.N. Acute subarachnoid hemorrhage: In vitro comparison of magnetic resonance and computed tomography. AJNR Am J Neuroradiol. 1986;7:223-228.
25. Sidman R., Connolly E., Lemke T. Subarachnoid hemorrhage diagnosis: Lumbar puncture is still needed when the computed tomography scan is normal. Acad Emerg Med. 1996;3:827-831.
26. Morgenstern L.B., Luna-Gonzales H., Huber J.C.Jr., et al. Worst headache and subarachnoid hemorrhage: Prospective, modern computed tomography and spinal fluid analysis. Ann Emerg Med. 1998;32:297-304.
27. Boesiger B.M., Shiber J.R. Subarachnoid hemorrhage diagnosis by computed tomography and lumbar puncture: Are fifth generation CT scanners better at identifying subarachnoid hemorrhage? J Emerg Med. 2005;29:23-27.
28. Tans J.T. Computed tomography of extracerebral hematoma. Clin Neurol Neurosurg. 1977;79:296-306.
29. Al-Nakshabandi N.A. The swirl sign. Radiology. 2001;218:433.
30. Greenberg J., Cohen W.A., Cooper P.R. The “hyperacute” extraaxial intracranial hematoma: Computed tomographic findings and clinical significance. Neurosurgery. 1985;17:48-56.
31. Subramanian S.K., Roszler M.H., Gaudy B., Michael D.B. Significance of computed tomography mixed density in traumatic extra-axial hemorrhage. Neurol Res. 2002;24:125-128.
32. Zimmerman R.A., Bilaniuk L.T. Computed tomographic staging of traumatic epidural bleeding. Radiology. 1982;144:809-812.
33. van den Brink W.A., Zwienenberg M., Zandee S.M., et al. The prognostic importance of the volume of traumatic epidural and subdural haematomas revisited. Acta Neurochir (Wien). 1999;141:509-514.
34. Bullock M.R., Chesnut R., Ghajar J., et al. Surgical management of acute epidural hematomas. Neurosurgery. 2006;58:S7-15. discussion Si-iv
35. Holodny A.I., Visvikis G.A., Schlenk R.P., Maniker A.H. Bilateral subdural hematomas exactly isodense to the subjacent gray matter. J Emerg Med. 2001;20:413-414.
36. Smith W.P.Jr., Batnitzky S., Rengachary S.S. Acute isodense subdural hematomas: A problem in anemic patients. AJR Am J Roentgenol. 1981;136:543-546.
37. Bullock M.R., Chesnut R., Ghajar J., et al. Surgical management of acute subdural hematomas. Neurosurgery. 2006;58:S16-S24. discussion Si-iv
37a. Bullock MR., Chesnut R., Ghajar J., et al. Surgical management of traumatic parenchymal lesions. Neurosurgery. Mar 2006;58(3 Suppl):S25-46. discussion Si-Siv
38. Edwards P., Arango M., Balica L., et al. Final results of MRC CRASH, a randomised placebo-controlled trial of intravenous corticosteroid in adults with head injury-outcomes at 6 months. Lancet. 2005;365:1957-1959.
39. Lewandowski C., Barsan W. Treatment of acute ischemic stroke. Ann Emerg Med. 2001;37:202-216.
40. Hoffman J.R. Tissue plasminogen activator (tPA) for acute ischaemic stroke: Why so much has been made of so little. Med J Aust. 2003;179:333-334.
41. Patel S.C., Levine S.R., Tilley B.C., et al. Lack of clinical significance of early ischemic changes on computed tomography in acute stroke. JAMA. 2001;286:2830-2838.
42. Scott P.A.T.C. Stroke, transient ischemic attack, and other central focal conditions. In: Tintinalli J.E.K.G., Stapczynski J.S., editors. Emergency Medicine: A Comprehensive Study Guide. ed 6. New York: McGraw-Hill; 2003:1385.
43. Manno E.M., Nichols D.A., Fulgham J.R., Wijdicks E.F. Computed tomographic determinants of neurologic deterioration in patients with large middle cerebral artery infarctions. Mayo Clin Proc. 2003;78:156-160.
44. Koo C.K., Teasdale E., Muir K.W. What constitutes a true hyperdense middle cerebral artery sign? Cerebrovasc Dis. 2000;10:419-423.
45. Leary M.C., Kidwell C.S., Villablanca J.P., et al. Validation of computed tomographic middle cerebral artery “dot” sign: An angiographic correlation study. Stroke. 2003;34:2636-2640.
46. National Institute of Neurological Disorders and Stroke, rt-PA Stroke Study Group. Tissue plasminogen activator for acute ischemic stroke. N Engl J Med. 1995;333:1581-1587.
47. Wardlaw J.M., Mielke O. Early signs of brain infarction at CT: Observer reliability and outcome after thrombolytic treatment—Systematic review. Radiology. 2005;235:444-453.
48. Dzialowski I., Hill M.D., Coutts S.B., et al. Extent of early ischemic changes on computed tomography (CT) before thrombolysis: Prognostic value of the Alberta Stroke Program Early CT Score in ECASS II. Stroke. 2006;37:973-978.
49. National Stroke Association Consensus Statement. Stroke: The First Hours—Emergency Evaluation and Treatment Guidelines. Englewood, Colo: National Stroke Association; 1997.
50. Quality Standards Subcommittee of the American Academy of Neurology. Practice advisory: Thrombolytic therapy for acute ischemic stroke—Summary statement. Neurology. 1996;47:835-839.
51. Adams H.P.Jr., Brott T.G., Furlan A.J., et al. Guidelines for thrombolytic therapy for acute stroke: A supplement to the guidelines for the management of patients with acute ischemic stroke. A statement for healthcare professionals from a Special Writing Group of the Stroke Council, American Heart Association. Stroke. 1996;27:1711-1718.
52. von Kummer R., Allen K.L., Holle R., et al. Acute stroke: usefulness of early CT findings before thrombolytic therapy. Radiology. 1997;205:327-333.
53. NINDS t-PA Stroke Study Group. Intracerebral hemorrhage after intravenous t-PA therapy for ischemic stroke. Stroke. 1997;28:2109-2118.
54. Parizel P.M., Ozsarlak, Van Goethem J.W., et al. Imaging findings in diffuse axonal injury after closed head trauma. Eur Radiol. 1998;8:960-965.
55. Modic M.T., Weinstein M.A., Rothner A.D., et al. Calcification of the choroid plexus visualized by computed tomography. Radiology. 1980;135:369-372.
56. Sandyk R. Choroid plexus calcification as a possible marker of hallucinations in schizophrenia. Int J Neurosci. 1993;71:87-92.
57. Hord E-D. Hydrocephalus. (Accessed at http://emedicine.medscape.com/.)
58. Eide P.K. The relationship between intracranial pressure and size of cerebral ventricles assessed by computed tomography. Acta Neurochir (Wien). 2003;145:171-179.
59. Miller M.T., Pasquale M., Kurek S., et al. Initial head computed tomographic scan characteristics have a linear relationship with initial intracranial pressure after trauma. J Trauma. 2004;56:967-972. discussion 72-3
59a. Eide PK: The relationship between intracranial pressure and size of cerebral ventricles assessed by computed tomography. Acta Neurochir (Wien) 145:171-179, 2003
59b. Hord E-D: Hydrocephalus. (Accessed at http://emedicine.medscape.com/)
59c. Miller MT, Pasquale M, Kurek S, et al: Initial head computed tomographic scan characteristics have a linear relationship with initial intracranial pressure after trauma. J Trauma 56:967-972; discussion 72-73.
60. Reginald D., Williams A.R.II, Glaudemans J. Pricing Variations in the Consumer Market for Diagnostic Imaging Services. Avalere Health LLC, CareCore National. December 2005.
61. American Hospital Directory. (Accessed at http://www.ahd.com/sample_outpatient.html.)
62. Stein S.C., Burnett M.G., Glick H.A. Indications for CT scanning in mild traumatic brain injury: A cost-effectiveness study. J Trauma. 2006;61:558-566.
63. Stiell I.G., Wells G.A., Vandemheen K., et al. The Canadian CT Head Rule for patients with minor head injury. Lancet. 2001;357:1391-1396.
64. Koller C.J., Eatough J.P., Bettridge A. Variations in radiation dose between the same model of multislice CT scanner at different hospitals. Br J Radiol. 2003;76:798-802.
65. Brenner D., Elliston C., Hall E., Berdon W. Estimated risks of radiation-induced fatal cancer from pediatric CT. AJR Am J Roentgenol. 2001;176:289-296.
66. Hall P., Adami H.O., Trichopoulos D., et al. Effect of low doses of ionising radiation in infancy on cognitive function in adulthood: Swedish population based cohort study. BMJ. 2004;328:19.
67. Edlow J.A., Panagos P.D., Godwin S.A., et al. Clinical policy: Critical issues in the evaluation and management of adult patients presenting to the emergency department with acute headache. Ann Emerg Med. 2008;52:407-436.
68. Edlow J.A., Caplan L.R. Avoiding pitfalls in the diagnosis of subarachnoid hemorrhage [see comment]. N Engl J Med. 2000;342:29-36.
69. Wardlaw J.M., Seymour J., Cairns J., et al. Immediate computed tomography scanning of acute stroke is cost-effective and improves quality of life [erratum appears in Stroke 2005;36(3):688]. Stroke. 2004;35:2477-2483.
70. DeWitt L.D. Clinical use of nuclear magnetic resonance imaging in stroke. Stroke. 1986;17:328-331.
71. Marks M.P., Holmgren E.B., Fox A.J., et al. Evaluation of early computed tomographic findings in acute ischemic stroke. Stroke. 1999;30:389-392.
72. Leys D., Pruvo J.P., Godefroy O., et al. Prevalence and significance of hyperdense middle cerebral artery in acute stroke. Stroke. 1992;23:317-324.
73. Adams H.P.Jr., del Zoppo G., Alberts M.J., et al. Guidelines for the early management of adults with ischemic stroke: A guideline from the American Heart Association/American Stroke Association Stroke Council, Clinical Cardiology Council, Cardiovascular Radiology and Intervention Council, and the Atherosclerotic Peripheral Vascular Disease and Quality of Care Outcomes in Research Interdisciplinary Working Groups—The American Academy of Neurology affirms the value of this guideline as an educational tool for neurologists. Stroke. 2007;38:1655-1711.
74. Food and Drug Administration. Product Labeling for Genetech Alteplase, 2002.
75. Sims J.R., Rordorf G., Smith E.E., et al. Arterial occlusion revealed by CT angiography predicts NIH stroke score and acute outcomes after IV tPA treatment. AJNR Am J Neuroradiol. 2005;26:246-251.
76. Katz D.A., Marks M.P., Napel S.A., et al. Circle of Willis: Evaluation with spiral CT angiography, MR angiography, and conventional angiography. Radiology. 1995;195:445-449.
77. Hunter G.J., Hamberg L.M., Ponzo J.A., et al. Assessment of cerebral perfusion and arterial anatomy in hyperacute stroke with three-dimensional functional CT: Early clinical results [see comment]. AJNR Am J Neuroradiol. 1998;19:29-37.
78. Wintermark M., Reichhart M., Cuisenaire O., et al. Comparison of admission perfusion computed tomography and qualitative diffusion- and perfusion-weighted magnetic resonance imaging in acute stroke patients [see comment]. Stroke. 2002;33:2025-2031.
79. Grotta J.C., Chiu D., Lu M., et al. Agreement and variability in the interpretation of early CT changes in stroke patients qualifying for intravenous rtPA therapy [see comment]. Stroke. 1999;30:1528-1533.
80. Teasdale G.M., Hadley D.M., Lawrence A., et al. Comparison of magnetic resonance imaging and computed tomography in suspected lesions in the posterior cranial fossa. BMJ. 1989;299:349-355.
81. Michel P., Bogousslavsky J. Penumbra is brain: No excuse not to perfuse [comment]. Ann Neurol. 2005;58:661-663.
82. Kilpatrick M.M., Yonas H., Goldstein S., et al. CT-based assessment of acute stroke: CT, CT angiography, and xenon-enhanced CT cerebral blood flow [see comment]. Stroke. 2001;32:2543-2549.
83. Ezzeddine M.A., Lev M.H., McDonald C.T., et al. CT angiography with whole brain perfused blood volume imaging: Added clinical value in the assessment of acute stroke. Stroke. 2002;33:959-966.
84. Levatter R.E. Radiation risk of body CT: What to tell our patients and other questions. Radiology. 2005;234:968. author reply 970
84a. Safety Investigation of CT Brain Perfusion Scans: Update 11/9/2010. Date Issued: Nov. 9, 2010. Available at: http://www.fda.gov/medicaldevices/safety/alertsandnotices/ucm185898.htm.]
85. Warach S., Gaa J., Siewert B., et al. Acute human stroke studied by whole brain echo planar diffusion-weighted magnetic resonance imaging. Ann Neurol. 1995;37:231-241.
86. Gonzalez R.G., Schaefer P.W., Buonanno F.S., et al. Diffusion-weighted MR imaging: Diagnostic accuracy in patients imaged within 6 hours of stroke symptom onset. Radiology. 1999;210:155-162.
87. Fiebach J.B., Schellinger P.D., Jansen O., et al. CT and diffusion-weighted MR imaging in randomized order: Diffusion-weighted imaging results in higher accuracy and lower interrater variability in the diagnosis of hyperacute ischemic stroke [see comment]. Stroke. 2002;33:2206-2210.
88. Lee L.J., Kidwell C.S., Alger J., et al. Impact on stroke subtype diagnosis of early diffusion-weighted magnetic resonance imaging and magnetic resonance angiography. Stroke. 2000;31:1081-1089.
89. Schulz U.G., Briley D., Meagher T., et al. Diffusion-weighted MRI in 300 patients presenting late with subacute transient ischemic attack or minor stroke. Stroke. 2004;35:2459-2465.
90. U-King-Im J.M., Trivedi R.A., Graves M.J., et al. Utility of an ultrafast magnetic resonance imaging protocol in recent and semi-recent strokes [see comment]. J Neurol Neurosurg Psychiatry. 2005;76:1002-1005.
91. Kang D.W., Chalela J.A., Dunn W., et al. MRI screening before standard tissue plasminogen activator therapy is feasible and safe. Stroke. 2005;36:1939-1943.
92. Fiebach J.B., Schellinger P.D., Gass A., et al. Stroke magnetic resonance imaging is accurate in hyperacute intracerebral hemorrhage: A multicenter study on the validity of stroke imaging [see comment]. Stroke. 2004;35:502-506.
93. Kidwell C.S., Chalela J.A., Saver J.L., et al. Comparison of MRI and CT for detection of acute intracerebral hemorrhage [see comment]. JAMA. 2004;292:1823-1830.
94. Patel M.R., Edelman R.R., Warach S. Detection of hyperacute primary intraparenchymal hemorrhage by magnetic resonance imaging. Stroke. 1996;27:2321-2324.
95. Tatlisumak T. Is CT or MRI the method of choice for imaging patients with acute stroke? Why should men divide if fate has united? [comment]. Stroke. 2002;33:2144-2145.
96. Neumann-Haefelin T., Wittsack H.J., Wenserski F., et al. Diffusion- and perfusion-weighted MRI: The DWI/PWI mismatch region in acute stroke. Stroke. 1999;30:1591-1597.
97. Food and Drug Administration: Warning on Gadolinium Associated Fatal Nephrogenic Systemic Fibrosis, 2006.
98. Chalela J.A., Alsop D.C., Gonzalez-Atavales J.B., et al. Magnetic resonance perfusion imaging in acute ischemic stroke using continuous arterial spin labeling. Stroke. 2000;31:680-687.
99. Sorensen A.G., Copen W.A., Ostergaard L., et al. Hyperacute stroke: Simultaneous measurement of relative cerebral blood volume, relative cerebral blood flow, and mean tissue transit time. Radiology. 1999;210:519-527.
100. Rordorf G., Koroshetz W.J., Copen W.A., et al. Regional ischemia and ischemic injury in patients with acute middle cerebral artery stroke as defined by early diffusion-weighted and perfusion-weighted MRI. Stroke. 1998;29:939-943.
101. Beaulieu C., de Crespigny A., Tong D.C., et al. Longitudinal magnetic resonance imaging study of perfusion and diffusion in stroke: Evolution of lesion volume and correlation with clinical outcome [see comment]. Ann Neurol. 1999;46:568-578.
102. Lovblad K.O. Diffusion-weighted MRI: Back to the future [comment]. Stroke. 2002;33:2204-2205.
103. Fiehler J., Kucinski T., Knudsen K., et al. Are there time-dependent differences in diffusion and perfusion within the first 6 hours after stroke onset? Stroke. 2004;35:2099-2104.
104. Hacke W., Albers G., Al-Rawi Y., et al. The Desmoteplase in Acute Ischemic Stroke Trial (DIAS): A phase II MRI-based 9-hour window acute stroke thrombolysis trial with intravenous desmoteplase. Stroke. 2005;36:66-73.
105. Sobesky J., Zaro Weber O., Lehnhardt F.G., et al. Does the mismatch match the penumbra? Magnetic resonance imaging and positron emission tomography in early ischemic stroke. Stroke. 2005;36:980-985.
106. D’Onofrio M., Mansueto G., Faccioli N., et al. Doppler ultrasound and contrast-enhanced magnetic resonance angiography in assessing carotid artery stenosis. Radiol Med (Torino). 2006;111:93-103.
107. Johnson M.B., Wilkinson I.D., Wattam J., et al. Comparison of Doppler ultrasound, magnetic resonance angiographic techniques and catheter angiography in evaluation of carotid stenosis. Clin Radiol. 2000;55:912-920.
108. Alexandrov A.V., Demchuk A.M., Wein T.H., Grotta J.C. Yield of transcranial Doppler in acute cerebral ischemia. Stroke. 1999;30:1604-1609.
109. Gao S., Wong K.S., Hansberg T., et al. Microembolic signal predicts recurrent cerebral ischemic events in acute stroke patients with middle cerebral artery stenosis. Stroke. 2004;35:2832-2836.
110. Saqqur M., Shuaib A., Alexandrov A.V., et al. Derivation of transcranial Doppler criteria for rescue intra-arterial thrombolysis: Multicenter experience from the Interventional Management of Stroke study. Stroke. 2005;36:865-868.
111. Siegel R.J. Ultrasound augmentation of thrombolysis and tissue perfusion. Clin Physiol Funct Imaging. 2004;24:156-163.
112. Grolimund P., Seiler R.W., Aaslid R., et al. Evaluation of cerebrovascular disease by combined extracranial and transcranial Doppler sonography: Experience in 1,039 patients. Stroke. 1987;18:1018-1024.
113. Camerlingo M., Casto L., Censori B., et al. Transcranial Doppler in acute ischemic stroke of the middle cerebral artery territories. Acta Neurol Scand. 1993;88:108-111.
114. Iannuzzi A., Wilcosky T., Mercuri M., et al. Ultrasonographic correlates of carotid atherosclerosis in transient ischemic attack and stroke. Stroke. 1995;26:614-619.
115. Razumovsky A.Y., Gillard J.H., Bryan R.N., et al. TCD, MRA and MRI in acute cerebral ischemia. Acta Neurol Scand. 1999;99:65-76.
116. Flint A.C., Duckwiler G.R., Budzik R.F., et al. for the MaMMWC. Mechanical thrombectomy of intracranial internal carotid occlusion: Pooled results of the MERCI and Multi MERCI part I trials. Stroke. 2007;38:1274-1280.
117. Biondi A., Le Jean L., Capelle L., et al. Fatal hemorrhagic complication following endovascular treatment of a cerebral arteriovenous malformation: Case report and review of the literature. J Neuroradiol. 2006;33:96-104.
118. Douglas V.C., Johnston C.M., Elkins J., et al. Head computed tomography findings predict short-term stroke risk after transient ischemic attack. Stroke. 2003;34:2894-2898.
119. Gladstone D.J., Kapral M.K., Fang J., et al. Management and outcomes of transient ischemic attacks in Ontario. CMAJ. 2004;170:1099-1104.
120. Johnston S.C., Gress D.R., Browner W.S., Sidney S. Short-term prognosis after emergency department diagnosis of TIA. JAMA. 2000;284:2901-2906.
121. Lin H.J., Yeh P.S., Tsai T.C., et al. Differential risks of subsequent vascular events for transient ischaemic attack and minor ischaemic stroke. J Clin Neurosci. 2007;14:17-21.
122. Sylaja P.N., Coutts S.B., Subramaniam S., et al. Acute ischemic lesions of varying ages predict risk of ischemic events in stroke/TIA patients. Neurology. 2007;68:415-419.
122a. Asimos AW., Rosamond WD., Johnson AM., et al. Early diffusion weighted MRI as a negative predictor for disabling stroke after ABCD2 score risk categorization in transient ischemic attack patients. Stroke. 2009;40(10):3252-3257.
123. de Bruijn S.F., Agema W.R., Lammers G.J., et al. Transesophageal echocardiography is superior to transthoracic echocardiography in management of patients of any age with transient ischemic attack or stroke. Stroke. 2006;37:2531-2534.
124. Dawn B., Hasnie A.M., Calzada N., et al. Transesophageal echocardiography impacts management and evaluation of patients with stroke, transient ischemic attack, or peripheral embolism. Echocardiography. 2006;23:202-207.
125. Strandberg M., Marttila R.J., Haapanen A., et al. Carotid sonography and transesophageal echocardiography in patients with ischemic stroke or transient ischemic attack in the territory of the carotid artery. J Clin Ultrasound. 2006;34:374-379.
126. Cucchiara B.L., Messe S.R., Taylor R.A., et al. Is the ABCD score useful for risk stratification of patients with acute transient ischemic attack? Stroke. 2006;37:1710-1714.
127. Bray J.E., Coughlan K., Bladin C. Can the ABCD score be dichotomised to identify high-risk patients with transient ischaemic attack in the emergency department? Emerg Med J. 2007;24:92-95.
128. Rothwell P.M., Giles M.F., Flossmann E., et al. A simple score (ABCD) to identify individuals at high early risk of stroke after transient ischaemic attack. Lancet. 2005;366:29-36.
129. Tsivgoulis G., Spengos K., Manta P., et al. Validation of the ABCD score in identifying individuals at high early risk of stroke after a transient ischemic attack: A hospital-based case series study. Stroke. 2006;37:2892-2897.
130. Johnston S.C., Rothwell P.M., Nguyen-Huynh M.N., et al. Validation and refinement of scores to predict very early stroke risk after transient ischaemic attack. Lancet. 2007;369:283-292.
131. Asimos A.W., Johnson A.M., Rosamond W.D., et al. A multicenter evaluation of the ABCD2 score’s accuracy for predicting early ischemic stroke in admitted patients with transient ischemic attack. Ann Emerg Med. 2010;55:201-210. e5
131a. Tsivgoulis G., Stamboulis E., Sharma VK., et al. Multicenter external validation of the ABCD2 score in triaging TIA patients. Neurology. 2010;74(17):1351-1357.
132. Josephson S.A., Bryant S.O., Mak H.K., et al. Evaluation of carotid stenosis using CT angiography in the initial evaluation of stroke and TIA. Neurology. 2004;63:457-460.
133. Denny C.J.D.S., Michael J. Headache and Facial Pain, ed 6. New York: McGraw-Hill; 2004.
134. Sames T.A., Storrow A.B., Finkelstein J.A., Magoon M.R. Sensitivity of new-generation computed tomography in subarachnoid hemorrhage. Acad Emerg Med. 1996;3:16-20.
135. Linn F.H.H., Wijdicks E.F.M., van Gijn J., et al. Prospective study of sentinel headache in aneurysmal subarachnoid haemorrhage. Lancet. 1994;344:590-593.
136. Byyny R.L., Mower W.R., Shum N., et al. Sensitivity of noncontrast cranial computed tomography for the emergency department diagnosis of subarachnoid hemorrhage. Ann Emerg Med. 2008;51:697-703.
137. Suarez J.I., Tarr R.W., Selman W.R. Aneurysmal subarachnoid hemorrhage. N Engl J Med. 2006;354:387-396.
138. Perry J.J., Spacek A., Forbes M., et al. Is the combination of negative computed tomography result and negative lumbar puncture result sufficient to rule out subarachnoid hemorrhage? Ann Emerg Med. 2008;51:707-713.
139. Perry J.J., Stiell I.G., Wells G.A., et al. Attitudes and judgment of emergency physicians in the management of patients with acute headache. Acad Emerg Med. 2005;12:33-37.
140. Storrow A.B., Wrenn K., de Gans K., et al. Aneurysmal subarachnoid hemorrhage. N Engl J Med. 2006;354:1755-1757.
141. Callaway C.W. Why does the sensitivity of computed tomographic scan for detecting subarachnoid blood never improve? Ann Emerg Med. 2008;51:705-706.
142. Brisman J.L., Song J.K., Newell D.W. Cerebral aneurysms. N Engl J Med. 2006;355:928-939.
143. Unruptured Intracranial Aneurysms Investigators. Unruptured intracranial aneurysms: Risk of rupture and risks of surgical intervention. International Study of Unruptured Intracranial Aneurysms Investigators. N Engl J Med. 1998;339:1725-1733.
144. Wiebers D.O., Whisnant J.P., Huston J.III, et al. Unruptured intracranial aneurysms: Natural history, clinical outcome, and risks of surgical and endovascular treatment. Lancet. 2003;362:103-110.
145. Carstairs S.D., Tanen D.A., Duncan T.D., et al. Computed tomographic angiography for the evaluation of aneurysmal subarachnoid hemorrhage. Acad Emerg Med. 2006;13:486-492.
146. Chaudhary M.Y., Ahmed I., Afzal B., et al. Dural sinus thrombosis: Frequency and imaging diagnosis. J Coll Physicians Surg Pak. 2006;16:400-403.
147. Ozsvath R.R., Casey S.O., Lustrin E.S., et al. Cerebral venography: Comparison of CT and MR projection venography. AJR Am J Roentgenol. 1997;169:1699-1707.
148. Casey S.O., Alberico R.A., Patel M., et al. Cerebral CT venography. Radiology. 1996;198:163-170.
149. Rodallec M.H., Krainik A., Feydy A., et al. Cerebral venous thrombosis and multidetector CT angiography: Tips and tricks. Radiographics. 2006;26(Suppl 1):S5-18. discussion S42-43
150. Visrutaratna P., Oranratanachai K., Likasitwattanakul S. Clinics in diagnostic imaging (103): Dural sinus thrombosis with cerebral venous infarction. Singapore Med J. 2005;46:238-243. quiz 44
151. Majoie C.B., van Straten M., Venema H.W., den Heeten G.J. Multisection CT venography of the dural sinuses and cerebral veins by using matched mask bone elimination. AJNR Am J Neuroradiol. 2004;25:787-791.
152. Lee S.K., terBrugge K.G. Cerebral venous thrombosis in adults: The role of imaging evaluation and management. Neuroimaging Clin N Am. 2003;13:139-152.
153. Lee V.H., Brown R.D.Jr., Mandrekar J.N., Mokri B. Incidence and outcome of cervical artery dissection: A population-based study. Neurology. 2006;67:1809-1812.
154. Schievink W.I., Mokri B., Whisnant J.P. Internal carotid artery dissection in a community. Rochester, Minnesota, 1987-1992. Stroke. 1993;24:1678-1680.
155. Dziewas R., Konrad C., Drager B., et al. Cervical artery dissection: Clinical features, risk factors, therapy and outcome in 126 patients. J Neurol. 2003;250:1179-1184.
156. Elijovich L., Kazmi K., Gauvrit J.Y., Law M. The emerging role of multidetector row CT angiography in the diagnosis of cervical arterial dissection: Preliminary study. Neuroradiology. 2006;48:606-612.
157. Zorc J.J., Krugman S.D., Ogborn J., Benson J. Radiographic evaluation for suspected cerebrospinal fluid shunt obstruction. Pediatr Emerg Care. 2002;18:337-340.
158. Castillo M., Hudgins P.A., Malko J.A., et al. Flow-sensitive MR imaging of ventriculoperitoneal shunts: In vitro findings, clinical applications, and pitfalls. AJNR Am J Neuroradiol. 1991;12:667-671.
159. Drake J.M., Martin A.J., Henkleman R.M. Determination of cerebrospinal fluid shunt obstruction with magnetic resonance phase imaging. J Neurosurg. 1991;75:535-540.
160. Oliver W.J., Shope T.C., Kuhns L.R. Fatal lumbar puncture: Fact versus fiction—An approach to a clinical dilemma. Pediatrics. 2003;112:e174-e176.
161. Hasbun R., Abrahams J., Jekel J., Quagliarello V.J. Computed tomography of the head before lumbar puncture in adults with suspected meningitis. N Engl J Med. 2001;345:1727-1733.
162. Probst M.A., Baraff L.J., Hoffman J.R., et al. Can patients with brain herniation on cranial computed tomography have a normal neurologic exam? Acad Emerg Med. 2009;16:145-150.
163. ACEP Clinical Policies Committee, Clinical Policies Subcommittee on Seizures. Clinical policy: Critical issues in the evaluation and management of adult patients presenting to the emergency department with seizures. Ann Emerg Med. 2004;43:605-625.
164. Henneman P.L., DeRoos F., Lewis R.J. Determining the need for admission in patients with new-onset seizures. Ann Emerg Med. 1994;24:1108-1114.
165. Tardy B., Lafond P., Convers P., et al. Adult first generalized seizure: etiology, biological tests, EEG, CT scan, in an ED. Am J Emerg Med. 1995;13:1-5.
166. Earnest M.P., Feldman H., Marx J.A., et al. Intracranial lesions shown by CT scans in 259 cases of first alcohol-related seizures. Neurology. 1988;38:1561-1565.
167. Pesola G.R., Westfal R.E. New-onset generalized seizures in patients with AIDS presenting to an emergency department. Acad Emerg Med. 1998;5:905-911.
168. Greenberg M.K., Barsan W.G., Starkman S. Neuroimaging in the emergency patient presenting with seizure. Neurology. 1996;47:26-32.
169. Teng D., Dayan P., Tyler S., et al. Risk of intracranial pathologic conditions requiring emergency intervention after a first complex febrile seizure episode among children. Pediatrics. 2006;117:304-308.
170. Swingler G.H., Westwood A.T., Iloni K. The utility of computed tomography for recent-onset partial seizures in childhood. S Afr Med J. 2006;96:941-944.
171. Goyal N., Donnino M.W., Vachhani R., et al. The utility of head computed tomography in the emergency department evaluation of syncope. Intern Emerg Med. 2006;1:148-150.
172. Giglio P., Bednarczyk E., Weiss K., Bakshi R. Syncope and head CT scans in the emergency department. Emerg Radiol. 2005;12:44-46.
173. Pires L.A., Ganji J.R., Jarandila R., Steele R. Diagnostic patterns and temporal trends in the evaluation of adult patients hospitalized with syncope. Arch Intern Med. 2001;161:1889-1895.
174. Grossman S.A., Fischer C., Bar J.L., et al. The yield of head CT in syncope: A pilot study. Intern Emerg Med. 2007;2:46-49.
175. Kapoor W.N. Evaluation and outcome of patients with syncope. Medicine (Baltimore). 1990;69:160-175.
175a. Huff J.S., Decker WW., Quinn J.V., et al. Clinical policy: critical issues in the evaluation and management of adult patients presenting to the emergency department with syncope. Ann Emerg Med. 2007;49(4):431-444.
175b. Bartynski W.S. Posterior reversible encephalopathy syndrome, part 1: fundamental imaging and clinical features. AJNR Am J Neuroradiol. 2008;29(6):1036-1042.
176. Haydel M.J., Preston C.A., Mills T.J., et al. Indications for computed tomography in patients with minor head injury. N Engl J Med. 2000;343:100-105.
177. Mower W.R., Hoffman J.R., Herbert M., Wolfson A.B., Pollack C.V.Jr., Zucker M.I. Developing a decision instrument to guide computed tomographic imaging of blunt head injury patients. J Trauma. 2005;59:954-959.
178. Holmes J.F., Hendey G.W., Oman J.A., et al. Epidemiology of blunt head injury victims undergoing ED cranial computed tomographic scanning. Am J Emerg Med. 2006;24:167-173.
179. Atzema C., Mower W.R., Hoffman J.R., et al. Defining “therapeutically inconsequential” head computed tomographic findings in patients with blunt head trauma. Ann Emerg Med. 2004;44:47-56.
180. Stiell I.G., Wells G.A., Vandemheen K., et al. Variation in ED use of computed tomography for patients with minor head injury. Ann Emerg Med. 1997;30:14-22.
181. American College of Emergency Physicians. Clinical policy for the initial approach to patients presenting with altered mental status. Ann Emerg Med. 1999;33:251-281.
182. Mossop D., Soysa S. The use of skull x-rays in head injury in the emergency department: A changing practice. Ann R Coll Surg Engl. 2005;87:188-190.
183. Andronikou S., Kilborn T., Patel M., Fieggen A.G. Skull fracture as a herald of intracranial abnormality in children with mild head injury: Is there a role for skull radiographs? Australas Radiol. 2003;47:381-385.
184. Windolf J., Inglis R., Pannike A., et al. [Roentgen studies of the skull in head injuries: A multicenter study]. Unfallchirurgie. 1992;18:10-18.
185. Clement C.M., Stiell I.G., Schull M.J., et al. Clinical features of head injury patients presenting with a Glasgow Coma Scale score of 15 and who require neurosurgical intervention. Ann Emerg Med. 2006;48:245-251.
186. Smits M., Dippel D.W., de Haan G.G., et al. External validation of the Canadian CT Head Rule and the New Orleans Criteria for CT scanning in patients with minor head injury. JAMA. 2005;294:1519-1525.
187. Stiell I.G., Clement C.M., Rowe B.H., et al. Comparison of the Canadian CT Head Rule and the New Orleans Criteria in patients with minor head injury. JAMA. 2005;294:1511-1518.
188. Stiell I.G., Lesiuk H., Wells G.A., et al. Canadian CT Head Rule study for patients with minor head injury: Methodology for phase II (validation and economic analysis). Ann Emerg Med. 2001;38:317-322.
189. Stiell I.G., Lesiuk H., Wells G.A., et al. The Canadian CT Head Rule study for patients with minor head injury: Rationale, objectives, and methodology for phase I (derivation). Ann Emerg Med. 2001;38:160-169.
190. Papa L., Stiell I., Clement C., et al. Sensitivity and specificity of the Canadian CT Head Rule and the New Orleans Criteria in a U.S. trauma center. Acad Emerg Med. 2007;14:S46-S47.
191. Eagles D., Stiell I., Clement C., et al. An international survey of emergency physicians’ knowledge, use, and attitudes towards the Canadian CT Head Rule. Acad Emerg Med. 2007;14:S86.
192. Rosengren D., Rothwell S., Brown A.F., Chu K. The application of North American CT scan criteria to an Australian population with minor head injury. Emerg Med Australas. 2004;16:195-200.
193. Boyle A., Santarius L., Maimaris C. Evaluation of the impact of the Canadian CT Head Rule on British practice. Emerg Med J. 2004;21:426-428.
194. Sultan H.Y., Boyle A., Pereira M., et al. Application of the Canadian CT Head Rules in managing minor head injuries in a UK emergency department: Implications for the implementation of the NICE guidelines. Emerg Med J. 2004;21:420-425.
195. Schlegel P.M., Walter M.A., Kloska S.P., et al. [Is the Canadian CT Head Rule for minor head injury applicable for patients in Germany?]. Rofo. 2005;177:872-876.
196. Jagoda A.S., Bazarian J.J., Bruns J.J.Jr., et al. Clinical policy: Neuroimaging and decisionmaking in adult mild traumatic brain injury in the acute setting. Ann Emerg Med. 2008;52:714-748.
197. Falimirski M.E., Gonzalez R., Rodriguez A., Wilberger J. The need for head computed tomography in patients sustaining loss of consciousness after mild head injury. J Trauma. 2003;55:1-6.
198. Kuppermann N. Pediatric head trauma: The evidence regarding indications for emergent neuroimaging. Pediatr Radiol. 2008;38(Suppl 4):S670-S674.
199. Haydel M.J., Shembekar A.D. Prediction of intracranial injury in children aged five years and older with loss of consciousness after minor head injury due to nontrivial mechanisms. Ann Emerg Med. 2003;42:507-514.
200. Palchak M.J., Holmes J.F., Vance C.W., et al. A decision rule for identifying children at low risk for brain injuries after blunt head trauma. Ann Emerg Med. 2003;42:492-506.
201. Greenes D.S. Decisionmaking in pediatric minor head trauma. Ann Emerg Med. 2003;42:515-518.
202. Simon B., Letourneau P., Vitorino E., McCall J. Pediatric minor head trauma: Indications for computed tomographic scanning revisited. J Trauma. 2001;51:231-237. discussion 7-8
203. Oman J.A., Cooper R.J., Holmes J.F., et al. Performance of a decision rule to predict need for computed tomography among children with blunt head trauma. Pediatrics. 2006;117:e238-e246.
204. Kuppermann N., Holmes J.F., Dayan P.S., et al. Identification of children at very low risk of clinically-important brain injuries after head trauma: A prospective cohort study. Lancet. 2009;374:1160-1170.
205. Mack L.R., Chan S.B., Silva J.C., Hogan T.M. The use of head computed tomography in elderly patients sustaining minor head trauma. J Emerg Med. 2003;24:157-162.
206. Wang M.C., Linnau K.F., Tirschwell D.L., Hollingworth W. Utility of repeat head computed tomography after blunt head trauma: A systematic review. J Trauma. 2006;61:226-233.
207. Brown C.V., Zada G., Salim A., et al. Indications for routine repeat head computed tomography (CT) stratified by severity of traumatic brain injury. J Trauma. 2007;62:1339-1344. discussion 44-45
208. Smith J.S., Chang E.F., Rosenthal G., et al. The role of early follow-up computed tomography imaging in the management of traumatic brain injury patients with intracranial hemorrhage. J Trauma. 2007;63:75-82.
209. Gadda D., Carmignani L., Vannucchi L., Bindi A. Traumatic lesions of corpus callosum: Early multidetector CT findings. Neuroradiology. 2004;46:812-816.
210. Mittl R.L., Grossman R.I., Hiehle J.F., et al. Prevalence of MR evidence of diffuse axonal injury in patients with mild head injury and normal head CT findings. AJNR Am J Neuroradiol. 1994;15:1583-1589.
211. Gentry L.R., Godersky J.C., Thompson B., Dunn V.D. Prospective comparative study of intermediate-field MR and CT in the evaluation of closed head trauma. AJR Am J Roentgenol. 1988;150:673-682.
212. Ezaki Y., Tsutsumi K., Morikawa M., Nagata I. Role of diffusion-weighted magnetic resonance imaging in diffuse axonal injury. Acta Radiol. 2006;47:733-740.
213. Broder J., Preston R. An Evidence-Based Approach To Imaging Of Acute Neurological Conditions. Emerg Med Pract. 2007;9(12):1-28.
214. Broder J: Midnight radiology: Emergency CT of the head. (Accessed at http://emedhome.com/.)